social services planning streamlined -...
TRANSCRIPT

Summer 2014 esri.com/health
Social Services Planning StreamlinedIn South Australia, GIS Clarifies the Big Picture, Helps People in NeedBy Gary Maguire (GISP-AP) and Penny Baldock (GISP-AP), Department for Communities and Social Inclusion, Government of South Australia
Planning social services effectively so that a community’s most vulnerable people are getting the help they need has always been a complex challenge for governments around the world. To help tackle this problem, an innovative government department in Australia has continued on page 3
in the capital city of Adelaide, provides services across a state where the popula-tion is relatively small, at about 1.7 millionpeople, but is spread over a huge geographic area of more than 350,000 square miles (900,000 square kilometers),
begun applying a geographic lens over its decision-making processes to find an improved way of looking at how it can capture and analyze huge amounts of information to make better decisions. In South Australia, the Department for Communities and Social Inclusion, based
Comparing the number of carers (people who provide unpaid care and assistance), shown as shaded areas, with the number of carers receiving services to aid with assistance, shown as orange circles. This helps to target future services for carers in South Australia.
1
for Health & Human Services
Esri NewsSummer 2014

Esri News for Health & Human Services Summer 2014
Summer 2014
Esri News for Health & Human Services is a publication of the Health and Human Services Solutions Group of Esri.To contact the Esri Desktop Order Center, call 1-800-447-9778 within the United States or 909-793-2853, extension 1-1235, outside the United States.
Visit the Esri website at esri.com.
View Esri News for Health & Human Services online at esri.com/health or scan the QR code below with your smartphone.
Advertise with UsE-mail [email protected].
Submit ContentTo submit articles for publication in Esri News for Health & Human Services, contact Robby Deming at [email protected].
Manage Your SubscriptionTo update your mailing address or subscribe or unsubscribe to Esri publications, visit esri.com/publications.
International customers should contact an Esri distributor to manage their subscriptions.
For a directory of distributors, visit esri.com/distributors.
Circulation ServicesFor back issues, missed issues, and other circulation services, e-mail [email protected]; call 909-793-2853, extension 2778; or fax 909-798-0560.
QR code generated on http://qrcode.littleidiot.be2
Contents
Cover
1 Social Services Planning Streamlined
Manager Interview
6 Meet Este Geraghty
Case Study
8 Children’s National Puts Geospatial Data on the Map
Product News
10 Tapestry Segmentation Boosts Success of a Flu Vaccine Campaign
11 Unlocking Smarter Health
12 Resources to Help Make Your Community More Resilient
Book Review
13 Esri Press 2014
Esri News
14 Esri on the Road
14 SIG Sponsor
14 SAG Awards in Health
The information contained in this work is the exclusive property of Esri or its licensors. This work is protected under United States copyright law and other international copyright treaties and conventions. No part of this work may be reproduced or transmitted in any form or by any means, electronic or mechanical, including photocopying and recording, or by any information storage or retrieval system, except as expressly permitted in writing by Esri. All requests should be sent to Attention: Contracts and Legal Services Manager, Esri, 380 New York Street, Redlands, CA 92373-8100 USA.
The information contained in this work is subject to change without notice.
@esri.com, 3D Analyst, ACORN, Address Coder, ADF, AML, ArcAtlas, ArcCAD, ArcCatalog, ArcCOGO, ArcData, ArcDoc, ArcEdit, ArcEditor, ArcEurope, ArcExplorer, ArcExpress, ArcGIS, arcgis.com, ArcGlobe, ArcGrid, ArcIMS, ARC/INFO, ArcInfo, ArcInfo Librarian, ArcLessons, ArcLocation, ArcLogistics, ArcMap, ArcNetwork, ArcNews, ArcObjects, ArcOpen, ArcPad, ArcPlot, ArcPress, ArcPy, ArcQuest, ArcReader, ArcScan, ArcScene, ArcSchool, ArcScripts, ArcSDE, ArcSdl, ArcSketch, ArcStorm, ArcSurvey, ArcTIN, ArcToolbox, ArcTools, ArcUSA, ArcUser, ArcView, ArcVoyager, ArcWatch, ArcWeb, ArcWorld, ArcXML, Atlas GIS, AtlasWare, Avenue, BAO, Business Analyst, Business Analyst Online, BusinessMAP, CityEngine, Community, Community Analyst, CommunityInfo, Community Maps, Database Integrator, DBI Kit, EDN, Esri, esri.com, Esri—Team GIS, Esri—The GIS Company, Esri—The GIS People, Esri—The GIS Software Leader, FormEdit, GeoCollector, GeoEnrichment, Geographic Design System, Geography Matters, Geography Network, geographynetwork.com,Geoloqi, Geotrigger, GIS by Esri, gis.com, GISData Server, GIS Day, gisday.com, GIS for Everyone, JTX, MapIt, Maplex, MapObjects, MapStudio, ModelBuilder, MOLE, MPS—Atlas, PLTS, Rent-a-Tech, SDE, SML, Sourcebook•America, SpatiaLABS, Spatial Database Engine, StreetMap, Tapestry, the ARC/INFO logo, the ArcGIS Explorer logo, the ArcGIS logo, the ArcPad logo, the Esri globe logo, the Esri Press logo, The Geographic Advantage, The Geographic Approach, the GIS Day logo, the MapIt logo, The World’s Leading Desktop GIS, Water Writes, and Your Personal Geographic Information System are trademarks, service marks, or registered marks of Esri in the United States, the European Community, or certain other jurisdictions. CityEngine is a registered trademark of Procedural AG and is distributed under license by Esri.
Other companies and products or services mentioned herein may be trademarks, service marks, or registered marks of their respective mark owners.
Copyright © 2014 Esri.All rights reserved. Printed in the United States of America.

Summer 2014 esri.com/health
much of it arid desert and scrubland. For comparison, South Australia is roughly30 percent larger than Texas and three times the size of Britain. The department plays the lead role for the South Australian government in the planning and delivery of social services to some of the commu-nity’s most disadvantaged people. These are families and communities struggling to make ends meet and often facing multiple levels of disadvantage. The department has an incredibly broad social responsibility within South Australia. It provides public housing for thousands of people, including crisis ac-commodation for those in immediate and desperate need—a mother and children fleeing domestic violence, for example. It is responsible for helping homeless people get off the streets and supporting them as they transition into a situation where they can remain in their own home. It runs the state’s juvenile justice system, recently opening a new detention facility with a strong emphasis on rehabilita-tion and education. It provides services and opportunities to people living with disabilities, assisting them to participate in community life through recreation
Social Services Planning Streamlined continued from cover
geospatial analysis, mobile data cap-ture, and web-based GIS solutions for information collaboration and why these things should and could be applied to the department more widely. In the years since, GIS solutions have been applied to many projects, including • Client connectivity to service locations. • Logistics modeling of vehicle usage. • Department-wide regional
planning and service alignment. • Community profiling. • Urban and public
housing redevelopment. • Work force health and safety modeling. • Supporting recovery efforts after
major disasters. These activities made it clear that a plan was needed to fully reap the ben-efits this technology could bring to social services planning. The department now has a geospatial strategy designed to bring GIS into the center of the decision-making process. It is still very new to the organization, but it is encapsulated in a simple philosophy in line with the department’s strategy: Coordinate data under one main umbrella;
and work. It provides domiciliary care services to those who need help at home to remain independent, offers multicul-tural and interpretive services to people who need them, spearheads the state government’s efforts to raise awareness about problem gambling, and manages concession payments to low-income earn-ers. The department works extensively with nongovernmental organizations that deliver many of the frontline services. In late 1999, a small group of individuals in the department had a vision to use GIS technology for land-use planning and asset management to improve the way public housing was used in the community. Over the next five years, geographic services became entrenched in many aspects of the business. The demand for services became so intense that the team had to seek a new and more efficient method of delivery. A pivotal point occurred in 2005 for the public housing agency as GIS went from a few scattered desktops to an integrated GIS web mapping solution accessible to all staff, including in geographically remote re-gions, through the use of Citrix thin clients. In 2006, departmental executives began to see the advantages of
Analyzing the Number of Carers
against the Location of Service Outlets
continued on page 4
3
Cover

Esri News for Health & Human Services Summer 2014
simplify it to make it accessible to all decision makers; enable people through a range of geographic services like ArcGIS to analyze, visualize, and report the information; and make it available through innovative technology platforms. The Evidence Based Management Framework (EBMF) solution has used this strategy throughout many GIS projects. EBMF is the department’s innovative approach to using ArcGIS to arrange and communicate the data and modeling results in a simple and understandable format for decision makers. The EBMF approach begins by locating the high-risk population groups, regarded as high priority for the department in terms of service deliv-ery. Through early intervention, EBMF identifies the factors that indicate high levels of risk in a community and com-piles GIS datasets to measure them. For example, high levels of school truancy could indicate young people in an area are running a higher risk of an encounter with the judicial system. By identifying communities where the risk is high, the department can work at the local level to strengthen and expand existing commu-nity networks and services. By establishing GIS datasets to measure each risk factor, EBMF provides a robust baseline for analyzing and comparing the risk profiles of communities across the state. In the second step of EBMF, the risk measures are narrowed to a group of “sentinel indicators” using a statisti-cal decision tree to model the datasets with the greatest predictive ability. The sentinel indicators are used to establish the Disadvantage-Need-Risk scores, which are a composite measure of risk, and identify and rank target populations according to the highest need. The GIS coordinated service data is overlaid on a map of the target popula-tions, creating an exact picture of where the resources are provided in the com-munity, compared to where the people
1. Evidence Groups Develop2. Sentinel Indicators
3. Evidence Layers Disadvantage Need Risk
5. Qualitative Analysis Community Capacity Assessment4. Service Overlays
6. Reporting
in need are located. In a true exercise of geoaccounting, the department can compare fund-ing and resource allocation to areas of service priority. The development of the EBMF information layers is an interactive and collaborative process involving a wide group of contributors, many of them practitioners delivering the ser-vices at the front line. The end product is a neat, accurate map with tables and charts, where all the relevant information is in one place and is easily shared as a web service. It means that the program planners can determine
to deliver better outcomes for society’s most disadvantaged people is enormous.
About the AuthorsGary Maguire and Penny Baldock are with the Department for Communities and Social Inclusion. Maguire is the de-partment’s corporate enterprise manager of Business and Location Intelligence Services. Over the past seven years, he has been leading the organization in transforming the way it uses its corporate systems/information with GIS for busi-ness solutions. Baldock is the senior pro-ject and policy officer with the Policy and Community Development directorate. She manages the EBMF program and continues to engage all sectors within and outside the department on GIS and the value it provides policy makers.
For more information, contact Gary Maguire, manager, Business and Location Intelligence Services, Department for Communities and Social Inclusion, South Australia.
Social Services Planning Streamlined continued from page 3
The Evidence-Based Management Framework Process
exactly where the greatest need is and where the funds are going. Staff in differ-ent parts of the department, responsible for planning different services, can view the same information, meaning informa-tion is easily shared between parts of the department and seen in context, not in isolation. Those who have worked in a large company or department understand how challenging it can be to source infor-mation outside their particular business area, which is why the benefits of this easy and efficient information-sharing process within such large organizations cannot be underestimated. Being able to see it easily on a map means that it not only results in less frustration but also enables a col-laborative and open result across different parts of an organization. This sharing of information means that a “whole-of-government-approach” to assisting people in need is more likely to occur. The EBMF has been presented to some of the nongovernmental organiza-tions the department has partnerships with. The next step is to share informa-tion with the wider community develop-ment sector. The potential for geoac-counting to break down information barriers between organizations with the same goals and shared aspirations and
4

C
M
Y
CM
MY
CY
CMY
K
HealthyGIS Newsletter Advert November 2014-Converted.pdf 1 01/09/2014 11:04:33

Esri News for Health & Human Services Summer 2014
Este Geraghty, MD, MS, MPH, recently joined Esri’s health and human services (HHS) team. In her new role as the health and human services industry manager, Geraghty will be respon-sible for expanding Esri’s presence in the market and setting strategic directions for marketing and communications efforts. She will also represent Esri at events worldwide and articulate her vision for making geography a foundational component in health and human services. Geraghty has spoken at numerous Esri events and has an unparalleled pedigree as a GIS advocate. Esri marketing writer Robby Deming recently visited with Geraghty to discuss her winding path to Esri and her ideas for GIS in health and human services over the next several years.
6
Deming You have an impressive resumé that spans several different roles and responsibilities. What were you doing before you joined Esri?
Geraghty I was a practicing physician in general internal medicine at the UC [University of California], Davis, health system. I also served as the deputy director of the Center for Health Statistics and Informatics at the California Department of Public Health.
Deming What did you do as deputy director?Geraghty Our group had two main functions: vital records and
informatics. In terms of vital records, we managed California’s vital records systems covering the issu-ance, preservation, and registration of events such as birth, death, and marriage. With approximately 500,000 births per year in the state, and 250,000 mar-riages and deaths per year each, we kept plenty busy.
For informatics, we were charged with acting in a cross-cutting way to assist programs with turning
Meet Este GeraghtyAccomplished Physician and Researcher to Head Esri’s Health and Human Services Team

Summer 2014 esri.com/health
Manager Interview
7
data into usable information. We also regularly published information on low birth weights, causes of death, and more, in the state. One of our big-gest accomplishments was taking a leading role in California’s Health and Human Services Agency to launch the first statewide open-data portal for health. Overall, our vision was “usable data, ef-fectively delivered.”
Deming It seems that you have a love for data and informa-tion. Is that what brought you to GIS?
Geraghty That’s definitely part of it. I actually first encountered GIS during my master’s program. I attended a lecture about GIS, and I was fascinated. When I started out in medicine, I originally wanted to be a radiologist. I’m a very visual person, and I love computers. GIS seemed to speak to both of those things. So I chose a capstone project that required the use of GIS and soon enrolled in an associate’s degree program at American River College to develop proficiency in GIS.
Deming How do you view GIS in health and human services?Geraghty In the non-GIS user population, many people think
that incorporating geography in medicine is a new phenomenon, but there’s always been an intrinsic relationship between the two. John Snow, the nineteenth-century physician, is commonly thought to be the first person to marry health and GIS with his analysis of cholera and water pumps in England. But people had been using geography in health long before that. During the bubonic plague that decimated Europe, bureaucrats used maps to track outbreaks and containment areas. And going back even further, like about 900 AD, the physician Rhazes hung slabs of meat around what is now Baghdad to select a hospital site based on putre-faction rates, hypothesizing that slower putrefac-tion was associated with healthier environments. More recently, Dr. Jack Wennberg, the “father of health GIS,” made it clear that access to health care depends greatly on where you live.
As a physician, it’s obvious to me that you can’t tear apart place and health.
Deming The recent Ebola outbreak in Africa has put dis-ease tracking to the front of everyone’s mind. How can GIS make a difference in tracking and analyz-ing diseases such as Ebola?
Geraghty GIS is a critical tool for epidemiologists and other health professionals focused on tracking and ana-lyzing infectious diseases. Place is intrinsically tied to disease surveillance and transmission. We tend to quantify and communicate disease incidence
and prevalence rates by place, and we use spatial analysis to understand the risk factors associated with disease. When emergencies arise, such as the Ebola outbreak in West Africa, using GIS for disease modeling can combine historical and cur-rent disease and environmental information. This helps us predict transmission patterns, analyze the environmental factors that encourage disease, and plan interventions.
Deming What do you want to focus on at Esri?Geraghty There’s a growing movement, the quantified self,
where people are measuring their interaction with their environments, and we absolutely want to support that. We want to help people collect and map things like walkability. We’ll continue support-ing efforts like epidemiology and geomedicine, and we’re increasingly going to focus on helping people and communities map their health resourc-es. There are also a lot of business problems that hospitals and providers can address with GIS.
I’m actually also interested in pursuing applica-tions of GIS in veterinary science. It’s a growing field that we haven’t explored much in the past. With the One Health movement that links animal, environ-mental, and human health, I think it’s an area that will become more important in the coming years.
Deming You were a practicing physician and the deputy director of a state agency. What brings you to Esri?
Geraghty It sounds selfish, but I wanted to improve the reach of my message. As an academic physi-cian, you’re lucky if 100 people cite your research. When I started working with the Department of Public Health, I was able to work with federal HHS partners, which helped me extend the reach of my work a little farther. I truly feel like Esri gives me the opportunity to make a difference and effect greater change. At Esri, I get to be creative. I get to communicate. And I get to help shape the future vision for GIS in health while optimizing the way it’s currently used.
Looking back at my career, it seems clear to me that I was always on my way to Esri. It couldn’t be a better fit.
Deming Thanks so much for your time. Do you have any part-ing thoughts about your overall goal in joining Esri?
Geraghty My broad goal is that when I’m done, I won’t have to explain what GIS is to health and human services organizations. My hope is that one day, it will just be an integral part of the landscape. I want people to expect to find geography in health.

Esri News for Health & Human Services Summer 2014
population health and try to keep people out of the emergency room, geospatial technologies will come into play.” GIS proponents describe the technolo-gy as offering rich insights into otherwise static health data embedded in tables. Jacobs, for example, has produced maps showing precisely which neighborhoods in Children’s service area are most af-flicted with diabetes. And the emerging focus on population health all but begs for the technology as administrators at-tempt to target interventions and assess factors contributing to ER visits if only to make informed business decisions about where to expand various service lines—and analyze the local clinical labor pool’s ability to support them. Although GIS technology itself is mature, there are many reasons why it has yet to become part of the main-stream technologies in acute and ambu-latory care delivery. Challenges include patient privacy, availability of relevant data that is easily mapped, and a daunt-ing number of options in how to embed spatial coordinates into health data.
Burn PreventionEarly efforts at Children’s National Health System underscore the potential of GIS. In one of his first projects, Jacobs partnered with a trauma surgeon who wanted to reduce the incidence of burns in the community. The project combined data from the organization’s Cerner EHR system with Esri’s geospatial mapping software. Burn patients were linked to various datasets, including home address, ethnicity, and cause and season of injury. Mapping data and performing statistical analyses offered rich insights, Jacobs says. “When we drilled down in the data, we figured out
Children’s National Puts Geospatial Data on the Mapby Gary Baldwin, Editorial Director at HealthData Management
“Unlike some other major industries, health care incorporates geospatial data only sparingly. But that could change quickly with population health a priority.”
When it comes to defining health care data, Brian Jacobs, MD, takes a broad view. Serving a dual role as CIO/chief medical information officer (CMIO) at Washington, DC-based Children’s National Health System, Jacobs has overseen the system’s expansion of EHR technology over the past eight years—it now operates across inpatient depart-ments, ambulatory clinics, and a regional data exchange encompassing 240 inde-pendent physicians. During the past six years, Jacobs also has championed the use of a technol-ogy not commonly deployed with EHRs. Jacobs’ most recent effort, tackling childhood obesity, blends standard EHR data with GIS software, which displays health data in conjunction with geospa-tial coordinates—a move he hopes can offer greater insights into obesity and what interventions might work. “For the first time, we are able to characterize the percentage of the population in different disease groups, where they reside, and the impact of gender and race,” he says, describing one of many health maps of Children’s service area. “As you manage
8

Summer 2014 esri.com/health
most of the problems came from thermal burns caused by a water heater being set too high,” Jacobs says. Fed by EHR data, color-coded maps revealed that the majority of cases originated in a handful of Hispanic neighborhoods. As a result, Children’s partnered with the District of Columbia’s Office on Latino Affairs to circulate handouts describing simple prevention tips. “We significantly reduced the number of thermal burns coming to the ER,” Jacobs says. “It was very effective.”
Jacobs’ obesity project will take a simi-lar approach on a far more complicated problem, one with less clear-cut causes. Data on height, weight, age, gender, ethnicity, and address—“all the data you need to know obesity in a region of interest,” Jacobs says—are extracted from Children’s EHR and then presented spatially on a map, incorporating any number of variables. Jacobs cautions that understanding obesity is a difficult undertaking and that Children’s research-ers have yet to draw conclusions about the best response. “For the researcher, the maps can help inform the focus of research, whether it is around drugs or better nutrition,” he says. “But if you look at the map, you do see we need to focus our efforts on Wards 7 and 8 but not in Bethesda. We can tell where the problem is most severe.” Jacobs says the power of GIS technol-ogy is its ability to display health data in conjunction with a variety of environmen-tal factors that may play a role in health status. In that light, GIS enables research-ers to analyze data spatially against diver-gent factors such as the quality of the air or the proportion of smokers in a defined area. “An asthmatic living near high pollen counts or a huge smoking population is more likely to have exacerbation in their condition than someone living in another area,” Jacobs says. Another recently launched effort tackles sickle-cell disease and its impact on readmissions, an equa-tion that may be influenced by environ-mental factors, he adds. “Many conditions lend themselves to geospatial analyses,” Jacobs continues.
“To analyze them, you need a combina-tion of geospatial software and statistical analysis. [Children’s uses SAS for the statistical analysis.] It is not enough just to get data out of the EHR.” Children’s is currently working with Stanford, California-based Lucille Packard Children’s Hospital to broaden its obesity analysis. Using data supplied by Lucille Packard, Children’s researchers will com-pare the problem in two vastly different metropolitan areas, Jacobs says.
Case Study
9
Esri News for Health & Human Services Summer 2014
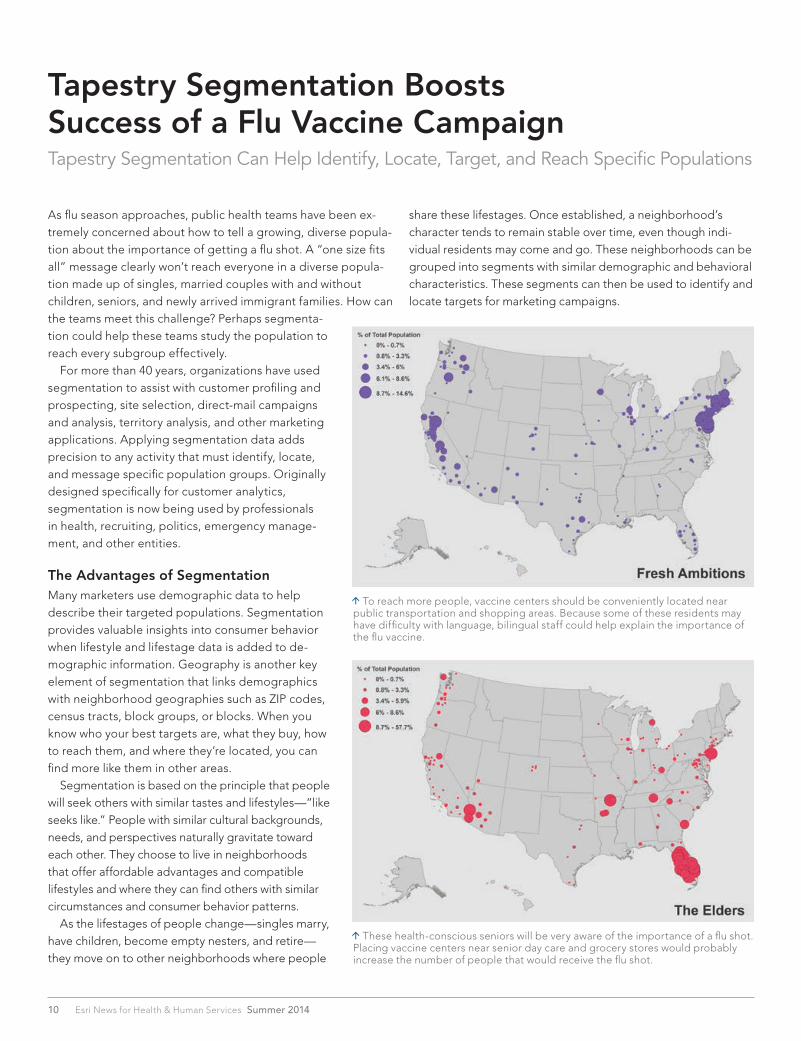
Tapestry Segmentation Boosts Success of a Flu Vaccine CampaignTapestry Segmentation Can Help Identify, Locate, Target, and Reach Specific Populations
As flu season approaches, public health teams have been ex-tremely concerned about how to tell a growing, diverse popula-tion about the importance of getting a flu shot. A “one size fits all” message clearly won’t reach everyone in a diverse popula-tion made up of singles, married couples with and without children, seniors, and newly arrived immigrant families. How can
share these lifestages. Once established, a neighborhood’s character tends to remain stable over time, even though indi-vidual residents may come and go. These neighborhoods can be grouped into segments with similar demographic and behavioral characteristics. These segments can then be used to identify and locate targets for marketing campaigns.
the teams meet this challenge? Perhaps segmenta-tion could help these teams study the population to reach every subgroup effectively. For more than 40 years, organizations have used segmentation to assist with customer profiling and prospecting, site selection, direct-mail campaigns and analysis, territory analysis, and other marketing applications. Applying segmentation data adds precision to any activity that must identify, locate, and message specific population groups. Originally designed specifically for customer analytics, segmentation is now being used by professionals in health, recruiting, politics, emergency manage-ment, and other entities.
The Advantages of SegmentationMany marketers use demographic data to help describe their targeted populations. Segmentation provides valuable insights into consumer behavior when lifestyle and lifestage data is added to de-mographic information. Geography is another key element of segmentation that links demographics with neighborhood geographies such as ZIP codes, census tracts, block groups, or blocks. When you know who your best targets are, what they buy, how to reach them, and where they’re located, you can find more like them in other areas. Segmentation is based on the principle that people will seek others with similar tastes and lifestyles—”like seeks like.” People with similar cultural backgrounds, needs, and perspectives naturally gravitate toward each other. They choose to live in neighborhoods that offer affordable advantages and compatible lifestyles and where they can find others with similar circumstances and consumer behavior patterns. As the lifestages of people change—singles marry, have children, become empty nesters, and retire—they move on to other neighborhoods where people
To reach more people, vaccine centers should be conveniently located near public transportation and shopping areas. Because some of these residents may have difficulty with language, bilingual staff could help explain the importance of the flu vaccine.
These health-conscious seniors will be very aware of the importance of a flu shot. Placing vaccine centers near senior day care and grocery stores would probably increase the number of people that would receive the flu shot.
10

Summer 2014 esri.com/health
Unlocking Smarter Health2014 Esri Health GIS Conference Promises to Modernize Health Applications
Esri’s Tapestry Segmentation SystemA successful market segmentation system must be able to distin-guish between consumer behaviors. With more than 75 yearsof combined experience in building segmentation systems, Esri’s data development team used its proven methodologies to build the next generation of Tapestry Segmentation. The 67 Tapestry segments accurately describe all the residential neighborhoods in the United States. Tapestry reveals the diversity of the US population and can identify seniors, immigrants, income dispari-ties, singles, college students, and those who are serving in the military. The nonclassified segment indicates geographic areas such as golf courses, cemeteries, and group quarters. Tapestry Segmentation data can help public health teams provide the right information to the right groups in the right media at the right time. Let’s explore how Tapestry differenti-ates populations of seniors and ethnically diverse residents. Tapestry has identified six very different types of seniors. Most of their lifestyles are dictated by age, income, and population density. High-income educated seniors such as residents of Silver and Gold and Golden Years neighborhoods are affluent and self-sufficient, understand the importance of immunization, and can travel to vaccine centers on their own. Residents in The Elders neighborhoods are considerably older, have moderate incomes, and may need assistance. Lower-income seniors in Social Security Set neighborhoods might have to depend on public transporta-tion, so providing vaccine centers near public transportation, grocery stores, pharmacies, and senior centers will be helpful for these older folks. Tapestry also provides information about media preferences for each segment.
Using Tapestry, the teams will know which media vehicles reach the most seniors and consequently will place public-service spots on seniors’ favorite radio and TV programs and in certain sections of newspapers. Ethnic diversity is a commonality among other Tapestry segments, even though they differ according to age, location, affluence, family types, and housing. Barrios Urbanos, Valley Growers, and Fresh Ambitions are three Hispanic segments in the next generation of Tapestry. Residents in these types of neigh-borhoods are young and married, have children, and may live in multigenerational households. Tapestry captures other subtleties among these consumers. Differences occur in their income, edu-cation, acculturation, and preferences. In this example, the teams could easily see that multiple messages in several languages will be necessary to reach most of these residents. Understanding the media preferences of these residents is another way to ensure the message will reach the most people. For example, public-service spots on Hispanic TV programs and radio stations in both English and Spanish will have a good chance of reaching more people. Locating vaccine centers near Hispanic shopping areas and public transportation might also raise participation rates. The teams will also make sure bilingual staff is available to explain the impor-tance of immunization to those who have difficulty with English. Would Tapestry Segmentation data improve the precision of your analyses?
To learn more about Tapestry, visit esri.com/tapestry.
Product News
11
Don’t miss this opportunity to see how geography improves every aspect of health and human services, from epide-miology and social services to program administration and facility operations.
Register online at esri.com/healthgis.
The world of health and human services is rapidly changing. Between seismic shifts in public policy and generational leaps in technology, there has never been a greater opportunity to transform com-munity health through geography. Join us at the 2014 Esri Health GIS Conference in Colorado Springs, Colorado, November 3–5, to take part in modernizing applications of community health, hospital administration, human services, and geomedicine. We’ve com-pletely reengineered this year’s event
to focus more on practical training that will help you turn your vision into reality. From the Hands-on Learning Lab and technical workshops with Esri experts to breakout sessions and the GIS Solutions EXPO, you’ll have plenty of opportuni-ties to see how GIS can improve care, boost efficiency, eliminate waste, and deliver better outcomes for patients and communities. We’ve also lined up pres-entations from leaders across the field who will discuss open data, community wellness, human services, and more.

Esri News for Health & Human Services Summer 2014
I-Heat
Find out which areas of your community are most likely to be severely affected by excessively hot weather. You can also learn more about the risk factors related to extreme heat events and see the locations of public cooling centers.
Learn more at www.biomedware.com.
My Way to Go
Find alternate routes for your daily commute (including walking, bus, and bike routes) that promote better air quality and reduce traffic congestion. Get detailed directions and find car pools or vanpools you can join.
Learn more at http://mywaytogo.org.
RainHarvest
Calculate the rain catchment potential of buildings in your community to see how much water you could conserve if you captured rainwater. View rain potential by month and discover uses for the rainwater you collect.
Learn more at http://roktech.net.
Placeways Climate App
Explore energy consumption in your area and the correspond-ing effects on climate-changing greenhouse gases. You can also toggle through various energy-saving models to visualize the impacts of taking particular actions.
Learn more at www.placeways.com.
12
Resources to Help MakeYour Community More Resilient
Communities around the world are facing increasing challenges from natural and man-made disasters. To help you prepare and bounce back faster, Esri has partnered with leading organizations that can get you started on the path to resilience. As you begin thinking about how GIS can support resiliency for health and social services, here are four apps you should know about:

ISBN: 9781589483729, June 2014, US$79.99, 460 pages
GIS Tutorial for Health, Fifth Edition
Given the large percentage of the health care work force and students who want to incorporate spatial thinking in their practices, I feel that the approach taken by this book is a step in the right direction. Tutorials, assignments, and independent case studies provide a solid platform for GIS learning and provide multiple use cases for the text. For example, the individual
chapters can be used indepen-dently of each other. Users can select chapters in the order that best suits them or complete them all as an integral part of their GIS learning experience. Although it is not mandated for users to follow the chapters in order, new ArcGIS for Desktop users who are using the book as a self-study guide are urged to work through the chapters in a sequential manner. Based on how the chapter assignments and exercises are uniquely structured, the book intentionally forces users to think beyond the sample tutorial while they learn to use the software in different ways of visualizing and analyzing health-related data. Thus, from a teaching point of view, this brilliant approach allows students to explore how GIS is used in the real world through the built-in health care scenarios. Therefore, GIS instructors can
benefit from adopting this book as a GIS textbook for students. I was impressed by the fact that this book is written in a straightforward, basic manner, yet it’s technically focused where appropriate, which makes learners feel like they’re being guided through the lessons. The knowledge and skills gained from the associated resources provide additional support for learners. I have previously assigned earlier editions of GIS Tutorial for Health in a graduate-level GIS for public health practice course. I will similarly use this edition, since it provides an effective introduction to ArcGIS through the lens of understanding and dealing with health-related, real-world issues.
For more information, visit esri.com/esripress.
The AuthorsKristen S. Kurland—Professor of architecture, information systems, and public policy at Carnegie Mellon University Wilpen L. Gorr—Professor of public policy and information management solutions at Carnegie Mellon University
ReviewerSeth A. Wiafe is an assistant professor in the School of Public Health at Loma Linda University in California.
Book Review
Summer 2014 esri.com/health 13
The fifth edition of GIS Tutorial for Health is organized to teach GIS and analysis skills to practicing health care professionals and stu-dents. The book uses scenarios to demonstrate how to process and visualize health data with the aim of improving the management of various health services and sup-porting health care policy. As a tutorial, the book includes step-by-step exercises covering the basics of mapping, data prep-aration for maps, spatial analysis of health issues, and using GIS as a spatial decision support tool for health practices. Additionally, the workbook features extended introductions to numerous assignments addressing significant issues of health care and policy development. The fifth edition has been fully updated for ArcGIS 10.2 for Desktop software compatibility. The exercise data for this edition is available for download, as well as a free 60-day trial of ArcGIS for Desktop software and relevant extensions. Resources for instructors are available separately. The fifth edition of GIS Tutorial for Health is divided into four parts containing a total of 11 chapters. Part 1 covers the ben-efits of GIS and mapping basics, Part 2 deals with the prepara-tion of map data, Part 3 focuses on spatial analysis, and Part 4handles case studies. To start exploring health issues with GIS,each chapter begins with a health problem with a spatial com-ponent that requires a GIS-based solution. The chapter then provides a conceptual framework detailing an approach to the solution using ArcGIS.

American Public Health Association Annual Meeting & Exposition
November 15–19, 2014New Orleans, Louisianawww.apha.org/meetings/annual
International Society for Disease Surveillance Conference
December 9–11, 2014Philadelphia, Pennsylvaniawww.syndromic.org
Esri on the Road
Esri thanks our partner Electronic Data Solutions (elecdata) for helping us host the Health and Human Services Special Interest Group Meeting on July 16, 2014, at the Esri User Conference in San Diego, California.
SIG Sponsor
Special Achievement in GIS Award WinnersEvery year, Esri and our distributors celebrate outstanding applications of geographic technology with the Special Achievement in GIS (SAG) Awards. We’d like to congratulate the following winners in health and human services:
United States Winners • New York State Council on Children and Families for its interactive
portal based on ArcGIS Online that exposes data related to children’s health, education, and well-being
• Tennessee Methamphetamine and Pharmaceutical Task Force for its use of GIS to track, analyze, and investigate drug offenders
Winners outside the United States • Department of Communities and Social Inclusion (Australia) for its
MapIQ system that enables better service delivery and decision support throughout the country
• World Vision Tanzania (Tanzania) for its use of GIS to collect data in the field related to water points, health facilities, and more
SAG Awards in Health
Esri News for Health & Human Services Summer 201414
Department of Communities and Social Inclusion

PUBLIC HEALTH ANALYSIS
INFECTIOUS DISEASE &POPULATION HEALTH
MANAGEMENT
HEALTH INDICATORS
MEDICARE MAPPER
NIH CIO SP3Contract Vehicle - Health
Trademarks provided under license from Esri
Critigen offers Accountable Care Organizations, HealthcareNetworks, Federal, State and Local Health Agencies access
to the power of location intelligence & GIS analysis

Presorted Standard
US Postage Paid Esri
380 New York Street Redlands, California 92373-8100 usa
Esri News for Health & Human Services Summer 2014
A New Era of Health Analytics2014 Esri Health GIS ConferenceNovember 3–5, 2014 Broadmoor HotelColorado Springs, Colorado
Come to the 2014 Esri Health GIS Conference to see how geography empowers the science, application, and administration of health. This is an unrivaled opportunity to learn cutting-edge Esri® software from world-class experts, sharpen your geographic information systems (GIS) skills, witness how others solve tough technical problems, and collaborate with peers from across the globe.
For more information and to register, visit esri.com/healthgis
Copyright © 2014 Esri. All rights reserved.
G62593_HealthConference_ad_2-14.indd 1 7/29/14 1:32 PM
143217 QUAD160M9/14tk