social security: cust sat
TRANSCRIPT
8/14/2019 Social Security: cust sat
http://slidepdf.com/reader/full/social-security-cust-sat 1/45
1
SOCIAL SECURITY ADMINISTRATION – OFFICE OF POLICY
2001 CUSTOMER SATISFACTION SURVEY
FINAL REPORT
Prepared for:
SOCIAL SECURITY ADMINISTRATION – OFFICE OF POLICY
December 21, 2001
Prepared by:
The Gallup Organization
901 F Street, NW
Washington, D.C. 20004

8/14/2019 Social Security: cust sat
http://slidepdf.com/reader/full/social-security-cust-sat 2/45
2
TABLE OF CONTENTS
EXECUTIVE SUMMARY .............................................................................................................4
BACKGROUND ........................................................................................................................ 4
CUSTOMER SATISFACTION ................................................................................................. 4
RESPONDENT INTEREST AREAS......................................................................................... 4
RESPONDENT RECOMMENDATIONS................................................................................. 5
RESPONDENT TYPES ............................................................................................................. 5
BACKGROUND .............................................................................................................................6
SURVEY RESULTS .......................................................................................................................7
THE SAMPLE AND RESPONDENTS ..................................................................................... 7
CUSTOMER SATISFACTION ................................................................................................. 8
Satisfaction With Statistical Tables And Analytical Articles Or Reports .......................... 8
Satisfaction With Specific SSA Publications ................................................................... 12
Satisfaction With Overall Quality..................................................................................... 13
Satisfaction With Overall Quality By Sample Group ....................................................... 14
Satisfaction With SSA’s Performance On New Issues ..................................................... 15
Satisfaction With SSA’s Performance On New Issues By Sample Group ....................... 16
RESPONDENT INTERESTS .................................................................................................. 17
Broad Interest Areas.......................................................................................................... 17
Interest In Topics And Subgroups .................................................................................... 18
Respondents’ Priority Research And Policy Issues .......................................................... 20
Interest In Public-Use Data Files ...................................................................................... 21
Use Of Specific SSA Publications .................................................................................... 22
8/14/2019 Social Security: cust sat
http://slidepdf.com/reader/full/social-security-cust-sat 3/45
3
RESPONDENTS' RECOMMENDATIONS FOR IMPROVEMENT..................................... 23
Recommendations For Improvement................................................................................ 23
Reasons For Not Using SSA’s Information...................................................................... 25
RESPONDENT TYPES ........................................................................................................... 26
Work Affiliation.................................................................................................................26
Satisfaction By SSA Employment .................................................................................... 28
Years of Professional Interest ............................................................................................29
Frequency of Use ...............................................................................................................31
Source of Information....................................................................................................... 33
APPENDIX A: SURVEY METHODOLOGY..............................................................................34
SURVEY DESIGN ................................................................................................................... 34
Questionnaire Design And Pretests .................................................................................. 34
Sample Frame And Selection............................................................................................ 34
DATA COLLECTION ............................................................................................................. 36
DATA FILE PREPARATION AND ANALYSIS ................................................................... 38
APPENDIX B: SURVEY QUESTIONNAIRE.............................................................................40
8/14/2019 Social Security: cust sat
http://slidepdf.com/reader/full/social-security-cust-sat 4/45
4
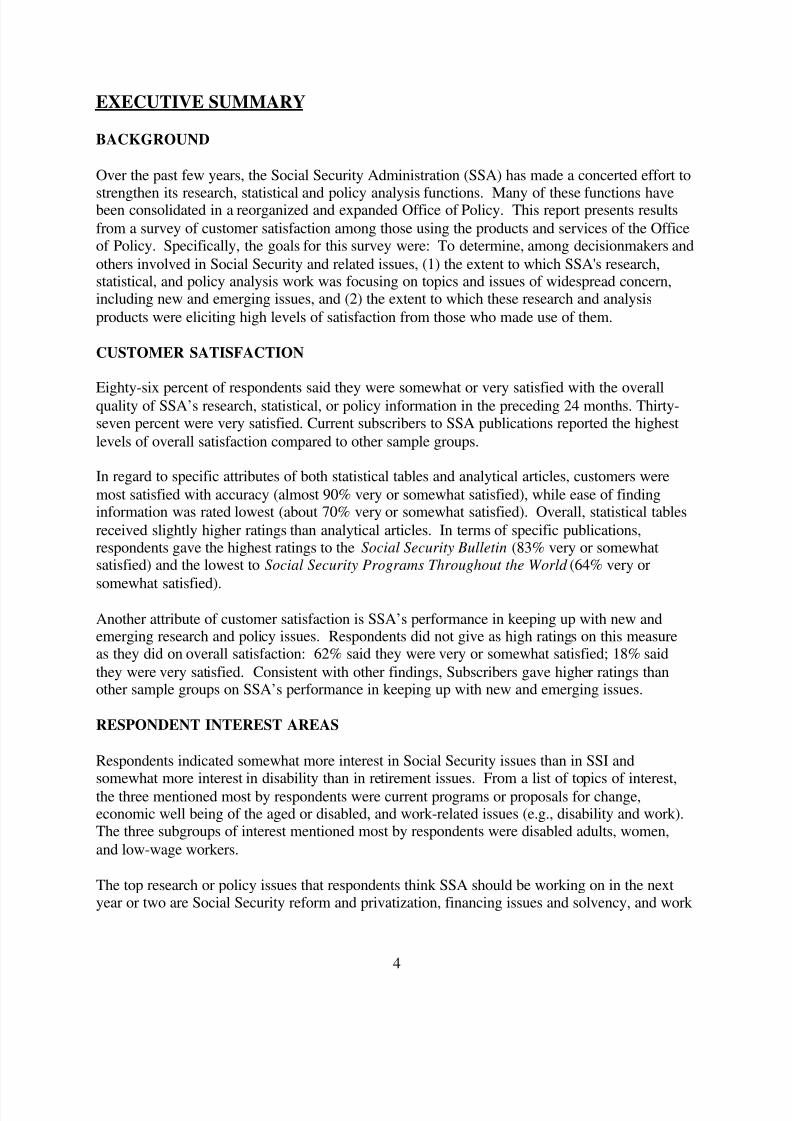
EXECUTIVE SUMMARY
BACKGROUND
Over the past few years, the Social Security Administration (SSA) has made a concerted effort to
strengthen its research, statistical and policy analysis functions. Many of these functions havebeen consolidated in a reorganized and expanded Office of Policy. This report presents results
from a survey of customer satisfaction among those using the products and services of the Officeof Policy. Specifically, the goals for this survey were: To determine, among decisionmakers and
others involved in Social Security and related issues, (1) the extent to which SSA's research,statistical, and policy analysis work was focusing on topics and issues of widespread concern,including new and emerging issues, and (2) the extent to which these research and analysis
products were eliciting high levels of satisfaction from those who made use of them.
CUSTOMER SATISFACTION
Eighty-six percent of respondents said they were somewhat or very satisfied with the overallquality of SSA’s research, statistical, or policy information in the preceding 24 months. Thirty-seven percent were very satisfied. Current subscribers to SSA publications reported the highest
levels of overall satisfaction compared to other sample groups.
In regard to specific attributes of both statistical tables and analytical articles, customers were
most satisfied with accuracy (almost 90% very or somewhat satisfied), while ease of findinginformation was rated lowest (about 70% very or somewhat satisfied). Overall, statistical tables
received slightly higher ratings than analytical articles. In terms of specific publications,respondents gave the highest ratings to the Social Security Bulletin (83% very or somewhatsatisfied) and the lowest to Social Security Programs Throughout the World (64% very or
somewhat satisfied).
Another attribute of customer satisfaction is SSA’s performance in keeping up with new andemerging research and policy issues. Respondents did not give as high ratings on this measureas they did on overall satisfaction: 62% said they were very or somewhat satisfied; 18% said
they were very satisfied. Consistent with other findings, Subscribers gave higher ratings thanother sample groups on SSA’s performance in keeping up with new and emerging issues.
RESPONDENT INTEREST AREAS
Respondents indicated somewhat more interest in Social Security issues than in SSI and
somewhat more interest in disability than in retirement issues. From a list of topics of interest,the three mentioned most by respondents were current programs or proposals for change,economic well being of the aged or disabled, and work-related issues (e.g., disability and work).The three subgroups of interest mentioned most by respondents were disabled adults, women,
and low-wage workers.
The top research or policy issues that respondents think SSA should be working on in the nextyear or two are Social Security reform and privatization, financing issues and solvency, and work

8/14/2019 Social Security: cust sat
http://slidepdf.com/reader/full/social-security-cust-sat 5/45
5
incentives. In regard to administrative data, respondents are most interested in public use datafiles that have SSA data linked to surveys. Publications most widely used by the respondents
were the Social Security Bulletin, the Annual Statistical Supplement, and Fast Facts and Figures
about Social Security.
RESPONDENT RECOMMENDATIONS
Only about two-fifths of respondents offered recommendations for improving Social Security’sresearch, statistical, or policy products and services. The most common recommendation was for
additional data or analysis in a particular topic area. Next most frequent were recommendationsfor improving the dissemination of information, including SSA’s website, and for increasing theclarity of information.
RESPONDENT TYPES
Nearly one-fourth of respondents worked for the federal government and another one- fifth were
employed in higher education. Almost half had been interested in SSA related issues for morethan 20 years. Of the respondents who used SSA information, almost half said they had receivedor sought SSA information more than 10 times in the preceding 24 months. Also of the
respondents who used SSA information, about 90% got the information from published or hardcopy materials and two-thirds from SSA web sites.

8/14/2019 Social Security: cust sat
http://slidepdf.com/reader/full/social-security-cust-sat 6/45
6
BACKGROUND
Over the past few years, the Social Security Administration (SSA) has made a concerted effort tostrengthen its research, statistical and policy analysis functions, recognizing that information
generated through these activities is essential to the development of sound and effective policies
and programs. Many of these research and policy functions have been consolidated in areorganized and expanded Office of Policy (OP). This empirical and analytical information is
provided to decisionmakers, both inside and outside of SSA, but it is also disseminated tomembers of the broader research/policy community who are concerned with social security and
income maintenance issues. Among other venues, dissemination occurs through regularpublications, postings on the Internet, briefings and other presentations, and responses toinformation requests.
In order to evaluate the perceived quality of SSA’s research, statistical, and policy analysis work
and to promote further improvements, SSA's FY 2000 Performance Plan included thedevelopment of a customer satisfaction survey to be conducted in FY 2001. The goals for the
survey were as follows: To determine, among decisionmakers and others involved in SocialSecurity and related issues, (1) the extent to which SSA's research, statistical, and policy analysiswork was focusing on topics and issues of widespread concern, including new and emerging
issues, and (2) the extent to which these research and analysis products were eliciting high levelsof satisfaction from those who made use of them--specifically, in terms of such attributes asaccuracy, comprehensiveness, and responsiveness. Information gained from the survey will be
used to guide the agency's efforts for further improvements in its research, statistical, and policyanalysis products and services.
Essentially, this report contains two main sections: one on customer satisfaction data and theother on respondent interests and recommendations. The first section of the report outlines
customer satisfaction results in several different categories. Satisfaction was asked in terms of SSA’s statistical tables and analytical reports, specific SSA publications, overall quality of
information, and SSA’s performance in working on new and emerging research and policyissues. In addition, some analyses are reported by sample group.
The second section of the report addresses additional respondent issues. The section begins witha discussion of respondents’ research and policy interests, including particular topics and
subgroups, and priority issues for SSA to address in the next year or two. The presentation thendescribes recommendations made by respondents for improving SSA’s research, statistical, andpolicy analysis products and services.
A brief final section analyzes types of respondents who were very satisfied with these productsand services, and appendices provide details on the survey’s methodology and a facsimile of themailed questionnaire.

8/14/2019 Social Security: cust sat
http://slidepdf.com/reader/full/social-security-cust-sat 7/45

8/14/2019 Social Security: cust sat
http://slidepdf.com/reader/full/social-security-cust-sat 8/45
8
CUSTOMER SATISFACTION
Satisfaction With Statistical Tables And Analytical Articles Or Reports
Over three-quarters of respondents reported that they received informa tion from SSA in the form
of either statistical tables or analytical articles and reports.
In addition to these two forms specified in the questionnaire, some respondents said they
received the information in another format. Of those who did receive information in anotherformat, the most commonly mentioned was verbal reports, presentations, and discussions.
Q15: Was this information in the form of statistical tables,
analytical articles or reports, or something else?
5.3%
2.1%
3.5%
6.4%
76.4%
82.9%
0% 10% 20% 30% 40% 50% 60% 70% 80% 90%
Other
* Data Files
* Direct Mail
* Verbal Reports, presentations and
discussions
Statistical Tables
Analytical Articles
The respondents who answered that they received information in the form of statistical tables oranalytical articles and reports were asked several follow up questions to measure their
satisfaction with various attributes of the information. These attributes included accuracy,clarity, comprehensiveness, objectivity, how up to date the information was, how useful it was,
and how easy it was to find the information the respondent was looking for. The charts belowsummarize satisfaction with these attributes. Accuracy had the highest ratings for both statisticaltables and analytical articles while ease of finding information had the lowest ratings.
* Coded from “Other-Specify”

8/14/2019 Social Security: cust sat
http://slidepdf.com/reader/full/social-security-cust-sat 9/45
9
Q16: Now thinking about the statistical tables that you received from
SSA in the past 24 months, how satisfied were you with the following
aspects of the information?
26.0%
31.6%
37.7%
44.5%
61.3%
36.8%
65.5%
43.1%
42.3%
39.8%
33.9%
23.7%
48.5%
23.1%
0% 20% 40% 60% 80% 100%
Easy to find
Up to date
Comprehensiveness
Clarity
Objectivity
Useful
Accuracy
Very Satisfied Somewhat Satisfied
Q17: Now thinking about the analytical articles or reports that you
received from SSA in the past 24 months, how satisfied were you with
the following aspects of the information?
24.9%
28.9%
30.9%
49.8%
32.0%
38.6%
53.0%
46.5%
44.8%
46.8%
31.1%
49.1%
44.5%
33.9%
0% 20% 40% 60% 80% 100%
Easy to find
Up to date
Comprehensiveness
Objectivity
Useful
Clarity
Accuracy
Very Satisfied Somewhat Satisfied

8/14/2019 Social Security: cust sat
http://slidepdf.com/reader/full/social-security-cust-sat 10/45
10
From these measures we created three index scores that collapse the answers for individualitems. The first index score is the average of the seven “very satisfied” ratings for statistical
tables; the second index is a comparable average for analytical articles and reports; and the thirdindex score is a simple average of the first two scores, indicating the average percent very
satisfied with both types of products combined (it should be noted that adjusting these
calculations for slight differences in the numbers of product and attribute ratings had nomeaningful impact on the averages). As shown in the chart below, respondents were more likely
to be very satisfied with the statistical tables than with the analytical articles.
Index Scores: Average Percent "Very Satisfied" for Statistical
Tables, Analytical Articles, and Both Combined
40.1%
36.9%
43.3%
0% 20% 40% 60% 80% 100%
Both
Analytical Articles
Statistical Tables

8/14/2019 Social Security: cust sat
http://slidepdf.com/reader/full/social-security-cust-sat 11/45
11
We created another index score that averages the “very satisfied” ratings for each of the sevenattributes across the two product types (analytical articles and statistical tables). The index
scores are shown below. The highest index scores were for accuracy (59.3%) and the lowest forease in locating the information (25.4%).
Index Scores: Average Percent "Very Satisfied" with Aspects of
Statistical Tables and Analytical Articles
25.4%
30.3%
34.3%
34.4%
41.5%
55.6%
59.3%
0% 10% 20% 30% 40% 50% 60% 70%
Easy to find
Up to date
Comprehensiveness
Useful
Clarity
Objectivity
Accuracy

8/14/2019 Social Security: cust sat
http://slidepdf.com/reader/full/social-security-cust-sat 12/45
12
Satisfaction With Specific SSA Publications
Overall, a majority of respondents were satisfied with the publications they were asked toevaluate. The publications are listed below along with the number of people who rated each
publication. Respondents gave the highest ratings to the Social Security Bulletin; 83.3% were
very or somewhat satisfied. The lowest ratings were for Social Security Programs Throughout the World; 64.0% were very or somewhat satisfied. Although Fast Facts and Figures About
Social Security was number three in terms of the number of respondents who were either very orsomewhat satisfied, it had the highest number of very satisfied respondents (44.1%).
Q18: Thinking now about specific SSA publications, please indicate how
satisfied you were, overall, with each of the following publications that you used
during the past 24 months?
29.2%
30.9%
33.4%
34.3%
29.9%
37.8%
35.1%
44.1%
41.8%
39.9%
34.8%
34.7%
36.6%
37.1%
41.5%
36.5%
39.6%
37.2%
40.8%
43.4%
0% 10% 20% 30% 40% 50% 60% 70% 80% 90%
Social Security Programs Throughout the World,
n=336
OASDI Beneficiaries by State and County, n=317
SSI Recipients by State and County, n=380
Income of the Population 55 or Older, n=402
Social Security Programs in the U.S., n=431
Income of the Aged Chartbook, n=370
SSI Annual Statistical Report, n=445
Fast Facts and Figures About Social Security,
n=556
Annual Statistical Supplement, n=586
Social Security Bulletin, n=655
Very Satisfied Somewhat Satisfied

8/14/2019 Social Security: cust sat
http://slidepdf.com/reader/full/social-security-cust-sat 13/45
13
We also created an index score to collapse the ratings of the various publications in Question 18.It is a weighted average of the “very satisfied” ratings for the ten publications (based on the
number of responses received for each publication). The average score was 36.6%, slightlylower than the average for statistical tables (43.3%) but on par with analytical articles (36.9%).
Satisfaction With Overall Quality
Eighty-six percent of respondents said they were either very or somewhat satisfied with theoverall quality of SSA’s research, statistical, or policy information in the previous 24 months.
However, more respondents said they were somewhat satisfied (48.8%) than said they were verysatisfied (37.2%).
Q19: How satisfied were you with the OVERALL QUALITY of SSA's
research, statistical, or policy information in the past 24 months?
37.2%
48.8%
10.1%
3.7%0.2%
0%
10%
20%
30%
40%
50%
60%
Very Satisfied Somewhat
Satisfied
Neither
Satisfied nor
Dissatisfied
Somewhat
Dissatisfied
Very
Dissatisfied

8/14/2019 Social Security: cust sat
http://slidepdf.com/reader/full/social-security-cust-sat 14/45
14
Satisfaction With Overall Quality By Sample Group
There were some differences in overall satisfaction by sample group. Group differences weresmall for the combined ratings of very and somewhat satisfied together, but somewhat larger
when restricted to very satisfied. Compared to the other sample groups, more Subscribers said
they were very satisfied (42.0%) and slightly more said they were either very or somewhatsatisfied (88.2%). Non-Subscribers had the lowest rating on the combined measure (82.4%),
although respondents in the OComm sample had the fewest number of respondents saying theywere very satisfied (23.6%). Decision makers landed in the middle of the satisfaction pack,
coming in second for the combined overall score and third for the very satisfied rating.
Q19: How satisfied were you with the OVERALL
QUALITY of SSA's research, statistical, or policy
information in the past 24 months?
36.5%
23.6%
33.3%
42.0%
45.9%
60.0%
51.1%
46.2%
0% 20% 40% 60% 80% 100%
Non-Subscriber
OComm
Decisionmakers
Subscriber
Very Satisfied Somewhat Satisfied

8/14/2019 Social Security: cust sat
http://slidepdf.com/reader/full/social-security-cust-sat 15/45
15
Satisfaction With SSA’s Performance On New Issues
Respondents were also asked how satisfied they were with SSA’s performance in identifying andworking on new and emerging research and policy issues. Among those who expressed an
opinion, respondents were not as satisfied as they were with the overall quality of SSA’s current
research. While almost two-thirds of respondents said they were very or somewhat satisfied withSSA’s performance in this area, less than 20% said they were very satisfied.
Q8: One of SSA's goals is to identify and work on new and emerging
research and policy issues. How satisfied were you with SSA's
performance in this area over the past two years?
17.7%
44.3%
23.7%
10.8%
3.5%
0%
5%
10%
15%
20%
25%
30%
35%
40%
45%
50%
Very Satisfied Somewhat
Satisfied
Neither
Satisfied nor
Dissatisfied
Somewhat
Dissatisfied
Very
Dissatisfied

8/14/2019 Social Security: cust sat
http://slidepdf.com/reader/full/social-security-cust-sat 16/45
16
Satisfaction With SSA’s Performance On New Issues By Sample Group
There were modest differences in satisfaction levels among the four sample groups on thisquestion as well. Subscribers reported the highest levels of satisfaction; 66.2% said they were
very or somewhat satisfied. Respondents from the OComm list reported the lowest levels;
52.7% said they were very or somewhat satisfied.
Q8: One of SSA's goals is to identify and work on new and emerging
research and policy issues. How satisfied were you with SSA's
performance in this area over the past two years?
11.2%
13.3%
18.2%
21.5%
41.5%
45.6%
47.7%
44.7%
0% 10% 20% 30% 40% 50% 60% 70%
OComm
Non-Subscriber
Decisionmakers
Subscriber
Very Satisfied Somewhat Satisfied

8/14/2019 Social Security: cust sat
http://slidepdf.com/reader/full/social-security-cust-sat 17/45
17
RESPONDENT INTERESTS
Broad Interest Areas
A set of four questions asked respondents about their interest areas. The first set asked about
interests in the broad topic areas of Social Security and SSI, retirement and disability.Respondents were somewhat more likely to be interested in Social Security issues than in SSI,
and somewhat more interested in disability than in retirement issues. However, larger groupswere interested in both Social Security and SSI (54.5%) and both retirement and disability issues
(39.0%).
Q4: Are your professional interests more
in issues relevant to Social Security, to
SSI, or to both?
29.0%16.5%
54.5%
0%
20%
40%
60%
Social
Security
SSI Both
Q5: Are your professional interests more
in retirement issues, disability issues, or
both?
24.6%
36.4% 39.0%
0%10%20%30%40%50%
Retirement
issues
Disability
issues
Both

8/14/2019 Social Security: cust sat
http://slidepdf.com/reader/full/social-security-cust-sat 18/45
18
Interest In Topics And Subgroups
Respondents were then asked more specifically about their interest in lists of topic areas andsubgroups. More than half of respondents indicated that they were interested in current
programs or proposals for change, economic well-being of the aged or disabled, work-related
issues (e.g., disability and work, the retirement process), economic impact of Social Security orSSI programs, Social Security financing issues, and other government income security programs
in the U.S. The top write-in response was Medicare/Medicaid and health-related issues.
Q6: Do you have a professional interest in any of the topics below?
4.2%
1.2%
2.0%
2.2%
2.2%
3.3%
4.0%
41.3%
46.8%
52.0%
62.7%70.8%
78.1%
81.9%
92.3%
0% 10% 20% 30% 40% 50% 60% 70% 80% 90% 100%
Other
* Demographic, economic, social issues
* Benefits; equity or group issues
* Issues/programs related to children
* Other disability-related issues
* Other specific program provisions
* Medicare/Medicaid, health-related issues
Income security systems in other countries
Private sources of income security
Other government income security programs
Social Security financing issues
Economic impact of SS or SSI programs
Work-related issues
Economic well-being of aged or disabled
Current programs or proposals for change
The top five topic areas for each of the four sample groups were no different than the top topic
areas for the population as a whole – they were even in the same order of importance with theexception of Decisionmakers. For Decisionmakers, current programs or proposals for changewas the most commonly mentioned response to Question 6 (97.8%) but work-related issues and
the economic impact of SS or SSI programs were tied for second place (88.9%), while SocialSecurity financing issues were more important to Decisionmakers (86.7%) than the topic area
economic well-being of the aged or disabled (80.0%).
* Coded from “Other-Specify”

8/14/2019 Social Security: cust sat
http://slidepdf.com/reader/full/social-security-cust-sat 19/45
19
Question 7 asked respondents about their interests in a list of specific population subgroups.Over one-half of respondents indicated that they were interested in disabled adults, women, low
wage workers, racial or ethnic minorities, and disabled children.
Q7: Are you particularly interested in any of the subgroupsbelow?
7.7%
34.0%
36.1%
36.3%
39.4%
47.5%
53.7%
54.8%
55.2%
55.9%
63.7%
0% 10% 20% 30% 40% 50% 60% 70%
Other
Widowed, divorced, or never married
Immigrants, non-citizens
The oldest old (85+)
Early retirees
Older workers
Disabled children
Racial or ethnic minorities
Low wage workers
Women
Disabled adults
The top five subgroups of interest were the same across all four sample groups.

8/14/2019 Social Security: cust sat
http://slidepdf.com/reader/full/social-security-cust-sat 20/45
20
Respondents’ Priority Research And Policy Issues
Respondents were then asked what were the most important research or policy issues theythought SSA should be working on in the next year or two. The question was open-ended, and
23% of respondents didn’t offer an opinion. Among those who did, the top response was Social
Security reform/proposals, which was mentioned by 20.2% of respondents. More than 10% of respondents also mentioned financing/solvency/trus t fund issues (14.7%), work incentive issues
(14.4%), and issues concerning specific policies or provisions (12.8%).
Q9: Please list the most important research or policy issues
that you think SSA should be working on in the next year or
two(multiple responses allowed)
10.4%
1.3%
1.4%
1.4%
1.7%
2.0%
2.0%
2.0%
2.1%
4.3%
4.4%
5.4%
6.3%
6.4%
7.1%
7.5%
8.1%
9.7%
12.8%
14.4%
14.7%
20.2%
0% 5% 10% 15% 20% 25%
Other
Mental health issues
Employment, training, earnings
Economic issues, interactions with programs
Services for the aged, disabled
Baby boomers
Educating the public about programs
Data issues
Non-SSA sources of income
Demographic issues
Healthcare, medical insurance
Issues re. disabled children/youth
Maintaining or strengthening the programs
Disability definition
Equity or group issues
The aged, retirement issues
Income security, economic well-being
Other disability or disability program issues
Issues re. specific policies or provisions
Work incentives
Financing issues, solvency, trust funds
SS reform/proposals; privatization

8/14/2019 Social Security: cust sat
http://slidepdf.com/reader/full/social-security-cust-sat 21/45
21
The responses to Question 9 did not differ greatly across the four sample groups. The top fivemost important research and policy areas were the same in the different sample groups as in the
total sample with two exceptions. For Non-Subscribers, aged and retirement issues were morefrequently mentioned than SS reform/proposals. For Decisionmakers, issues related to disabled
children and youth were the fourth most common response.
Interest In Public-Use Data Files
Respondents were also asked if they would have any interest in having access to public-use data
files about various topics. The highest number of respondents (72.9%) were interested in SSAdata that has been linked to surveys. Over half of all respondents also expressed an interest indata on characteristics of Social Security beneficiaries (68.4%) and SSI recipients (62.4%).
Q10: In your work, would you be interested in having access to public-use data
files in any of the following areas?
16.0%
49.8%
62.4%
68.4%
72.9%
0% 10% 20% 30% 40% 50% 60% 70% 80%
Other
Earnings histories of
covered workers
Characteristics of SSI
recipients
Characteristics of SS
beneficiaries
SSA data that has been
linked to surveys

8/14/2019 Social Security: cust sat
http://slidepdf.com/reader/full/social-security-cust-sat 22/45
22
Use Of Specific SSA Publications
Another way to measure the interest areas of respondents is to see which publications they saidthey used over the past 24 months in Question 18. Most of the publications listed were used by
over half of the respondents.
Q18: Use of publications in the past 24 months.
43.2%
45.0%
49.3%
51.0%
53.5%
57.3%
59.5%
72.6%
76.1%
83.8%
0% 10% 20% 30% 40% 50% 60% 70% 80% 90%
OASDI Beneficiaries by State and County
Social Security Programs Throughout the World
Income of the Aged Chartbook
SSI Recipients by State and County
Income of the Population 55 or Older
Social Security Programs in the U.S.
SSI Annual Statistical Report
Fast Facts and Figures About Social Security
Annual Statistical Supplement
Social Security Bulletin
Used
Use of the publications did not differ much across the four sample groups. All groups listed thesame publications as their top five.

8/14/2019 Social Security: cust sat
http://slidepdf.com/reader/full/social-security-cust-sat 23/45
23
RESPONDENTS' RECOMMENDATIONS FOR IMPROVEMENT
Recommendations For Improvement
All respondents were asked an open-ended question about recommendations they had for
improving Social Security’s products and services. Forty-three percent did not respond, while anadditional 16% said they had no recommendations. The most common recommendation was for
additional data or analysis in particular topic areas (12%).
Q20: Please list any recommendations you have for improving
Social Security's research, statistical, or policy products and
services.
(multiple responses allowed)
4.9%
1.2%
1.5%
2.2%
2.2%
2.3%
2.7%
3.5%
3.7%
3.9%
4.2%
4.2%
4.7%
11.6%
15.7%
43.2%
0% 5% 10% 15% 20% 25% 30% 35% 40% 45% 50%
Other
More SSA staff
Negative comments
More data by state/county
More international data
More input from outside SSA
Positive comments
Make data more accessible
Publicize what's available
More timely/up to date
Make easier to comprehend
Improve website
Better dissemination
Additional info in particular area
No recommendations
No response

8/14/2019 Social Security: cust sat
http://slidepdf.com/reader/full/social-security-cust-sat 24/45
24
Among the small group of Decisionmakers, only 38% offered recommendations forimprovements; four of the top five recommendations were similar to those from respondents as a
whole although the rank order is somewhat different. The recommendation made mostfrequently by Decisionmakers (13%) was to improve the timeliness of research, statistical or
policy products.
Q20: (Decisionmakers Only) Please list any recommendations
you have for improving Social Security's research, statistical,
or policy products and services.(multiple responses allowed)
2.2%
2.2%
2.2%
2.2%
2.2%
4.4%
4.4%
6.7%
11.1%
11.1%
13.3%
51.1%
0% 10% 20% 30% 40% 50% 60%
Other, n=1
More international data, n=1
More input from outside SSA, n=1
Positive comments, n=1
Negative comments, n=1
Make data more accessible, n=2
Better dissemination, n=2
Make easier to comprehend, n=3
Additional info in particular area, n=5
No recommendations, n=5
More timely/up to date, n=6
No response, n=23

8/14/2019 Social Security: cust sat
http://slidepdf.com/reader/full/social-security-cust-sat 25/45
25
Reasons For Not Using SSA’s Information
Another question that can be used to look for recommendations is Question 12. This questionwas asked of respondents who indicated active interest in the field but said they did not receive
any research, statis tical, or policy information from SSA publications, SSA web sites, or SSA
staff in the preceding two years. The question asked these respondents if there was anyparticular reason they had not used SSA’s information. Forty-one percent did not respond, and
an additional 14% said there was no particular reason. The reason mentioned most frequently(18%) was that SSA’s information was not related to the respondent’s particular needs.
Q12: Is there any particular reason why you have
not used SSA's information?(multiple responses allowed)
15.1%
6.8%
8.2%
13.7%
17.8%
41.1%
0% 10% 20% 30% 40% 50%
Other
Haven't been receiving this
information
Lack of knowledge as to its
availability
No particular reason
Not related to my needs
No response

8/14/2019 Social Security: cust sat
http://slidepdf.com/reader/full/social-security-cust-sat 26/45
26
RESPONDENT TYPES
Respondents were also asked several demographic or usage questions such as where theyworked, how long they had been interested in Social Security related issues, how frequently they
received or sought SSA information, and how they received that information.
Work Affiliation
The first question asked respondents to answer in what general category of organization they
worked. Almost one- fourth (23.3%) of respondents worked in the executive branch of thefederal government. Another 20.9% worked at a university or college.
Q1: Currently, which of the categories below best
describes where you work?
1.4%
2.9%
3.7%
4.0%
4.3%
5.2%
7.6%
13.3%
13.6%
20.9%
23.3%
0% 5% 10% 15% 20% 25% 30% 35% 40%
Other
Congressional Agency
Professional/Trade Assoc.
Advocacy/Lobbying Group
Business/Industry
No Affiliation
Private Research/Policy
State/Local Gov't
Nonprofit Service Org.
University/College
Federal Gov't

8/14/2019 Social Security: cust sat
http://slidepdf.com/reader/full/social-security-cust-sat 27/45
27
Respondents with no work affiliation (for example, retirees or consultants) were most likely tosay they were “very satisfied” with the overall quality of SSA’s information in Question 19.
Respondents who worked at nonprofit service organizations gave the lowest ratings for overallquality.
Percent "Very Satisfied" With the Overall Quality of SSA's Research,
Statistical, or Policy Information by Employment Category
22.2%
30.8%
32.4%
35.2%
39.1%
40.0%
40.6%
42.9%
48.4%
68.4%
0% 10% 20% 30% 40% 50% 60% 70% 80%
Nonprofit service org.
Congressional agency
State or local government
Federal government
University or college
Professional/trade assoc.
Advocacy/Lobbying group
Business or industry
Private research/policy org.
No work affiliation
Percent Very Satisfied

8/14/2019 Social Security: cust sat
http://slidepdf.com/reader/full/social-security-cust-sat 28/45
28
Respondents with no work affiliation (39.0%) were also most likely to be “very satisfied” withSSA’s identification and work on new and emerging research and policy issues (Q8).
Respondents in Congressional agencies (8.3%) were least likely to respond that they were “verysatisfied.”
Percent "Very Satisfied" With SSA's Performance Identifying and Working
on New and Emerging Research and Policy Issues by Employment
Category
8.3%
8.8%
13.8%
14.0%14.3%
16.5%
17.7%
22.9%
27.1%
39.0%
0% 5% 10% 15% 20% 25% 30% 35% 40% 45%
Congressional agency
Advocacy/Lobbying group
Professional/trade assoc.
State or local governmentNonprofit service org.
University or college
Federal government
Business or industry
Private research/policy org.
No work affiliation
Percent Very Satisfied
Satisfaction By SSA Employment
SSA employees had only slightly higher satisfaction levels with overall quality than did non-SSA employees (80.4% vs. 78.8% very or somewhat satisfied).
Q19: How satisfied were you with the
OVERALL QUALITY of SSA's research,
statistical, or policy information in the past
24 months?
34.2%
33.3%
44.6%
47.1%
0% 20% 40% 60% 80% 100%
Non SSA
Employees
SSA
Employees
Very Satisfied Somewhat Satisfied

8/14/2019 Social Security: cust sat
http://slidepdf.com/reader/full/social-security-cust-sat 29/45
29
SSA employees were also slightly more likely to be satisfied with SSA’s performance inidentifying and working on new and emerging research and policy issues than were non-SSA
employees (59.2% vs. 54.0% very or somewhat satisfied).
Q8: One of SSA's goals is to identify and work on new
and emerging research and policy issues. How
satisfied were you with SSA's performance in this area
over the past two years?
15.5%
16.5%
38.5%
42.7%
0% 10% 20% 30% 40% 50% 60% 70%
Non SSA
Employees
SSA
Employees
Very Satisfied Somewhat Satisfied
Years of Professional Interest
Respondents generally had quite a long interest in SSA related issues. Almost half (45.5%) hadan interest for more than twenty years and fewer than 10% had an interest for less than five
years.
Q3: During the course of your career, approximately
how many years have you had some interest in
issues relevant to Social Security or SSI?
8.6%
16.0%
30.0%
45.5%
0%
10%
20%
30%
40%
50%
Less than 5
years
5 to 9 years 10 to 20 years More than 20
years

8/14/2019 Social Security: cust sat
http://slidepdf.com/reader/full/social-security-cust-sat 30/45
30
Overall satisfaction was somewhat higher among respondents who had been interested in SSArelated issues for more than twenty years (40.6% very satisfied).
Percent "Very Satisfied" With the Overall Quality of SSA's Research,
Statistical, or Policy Information by Length of Time Interested in SSA
Related Issues
40.6%
35.6%
32.8%
33.9%
0% 5% 10% 15% 20% 25% 30% 35% 40% 45%
More than 20 years
10 to 20 years
5 to 9 years
Less than 5 years
Percent "Very Satisfied"
There was no clear relationship between the length of time the respondent had been interested inSSA related issues and satisfaction with SSA’s identification and work on new and eme rging
research and policy issues. Respondents who said they were interested in SSA related issues forfive to nine years and more than twenty years were the most likely to be very satisfied withoverall quality (around 19.5%); respondents who were interested in SSA related issues for
between ten and twenty years were the least likely to be very satisfied (14.8%).
Percent "Very Satisfied" With SSA's Performance
Identifying and Working on New and Emerging
Research and Policy Issues by Length of Time
Interested in SSA Related Issues
19.4%
14.8%
19.5%
16.7%
0% 5% 10% 15% 20% 25%
More than 20 years
10 to 20 years
5 to 9 years
Less than 5 years
Percent "Very Satisfied"

8/14/2019 Social Security: cust sat
http://slidepdf.com/reader/full/social-security-cust-sat 31/45
31
Frequency of Use
Of the respondents who identified themselves as users of SSA’s information, a slight majority(53.2%) received or sought the information fewer than ten times in the preceding twenty-fourmonths. About one-quarter reported use more than 20 times, including about 10 percent using
more than 50 times.
Q13: During the past 24 months, about how many
times have you received or sought this kind of
information from SSA?
16.0%
37.2%
21.1%
15.9%
9.9%
0%
5%10%15%
20%25%30%35%40%
Less than
3 times
3 to 9
times
10 to 19
times
20 to 50
times
More than
50 times
Not surprisingly, respondents who had received or sought information from SSA more than 50
times in the past 24 months were the most likely to say they were very satisfied with the overallquality of SSA information.
8/14/2019 Social Security: cust sat
http://slidepdf.com/reader/full/social-security-cust-sat 32/45
32
Percent "Very Satisfied" With the Overall Quality of SSA's
Research, Statistical, or Policy Information by Number of Times
Received or Sought SSA Information
42.7%
40.8%
35.3%
34.7%
39.3%
0% 5% 10% 15% 20% 25% 30% 35% 40% 45%
More than 50 times
20 to 50 times
10 to 19 times
3 to 9 times
Less than 3 times
Percent "Very Satisfied"
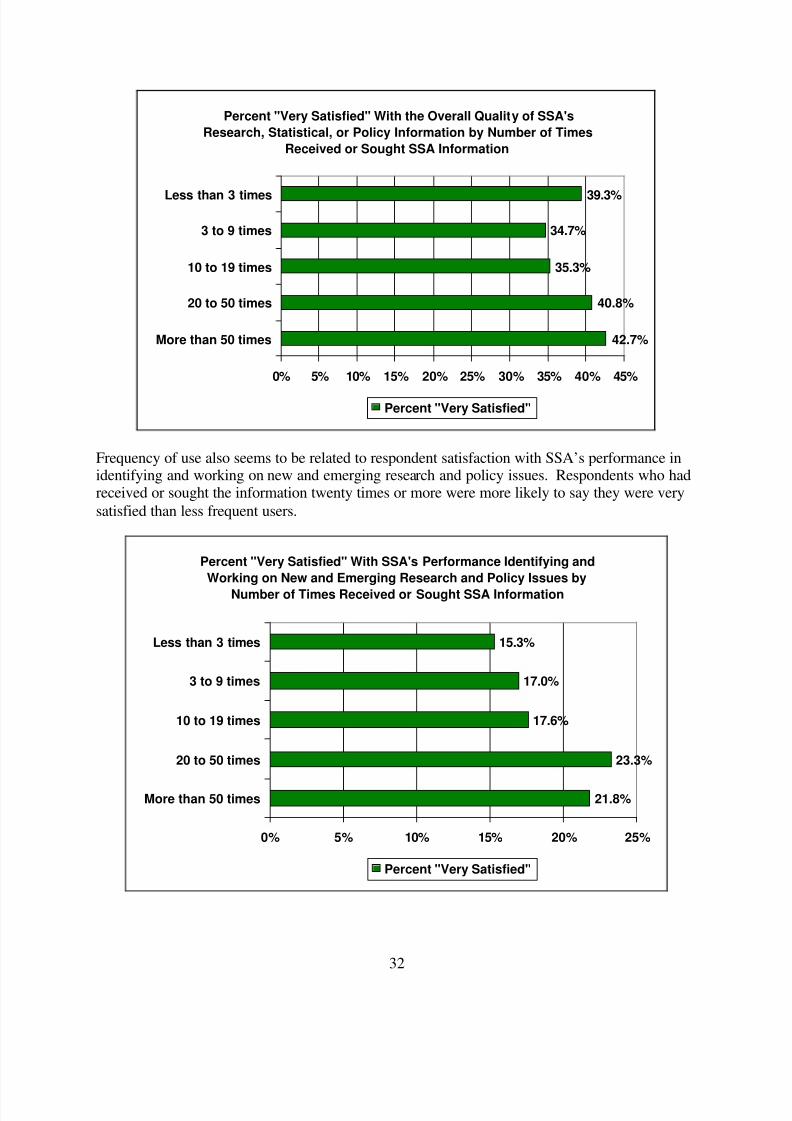
Frequency of use also seems to be related to respondent satisfaction with SSA’s performance inidentifying and working on new and emerging research and policy issues. Respondents who hadreceived or sought the information twenty times or more were more likely to say they were very
satisfied than less frequent users.
Percent "Very Satisfied" With SSA's Performance Identifying and
Working on New and Emerging Research and Policy Issues by
Number of Times Received or Sought SSA Information
21.8%
23.3%
17.6%
17.0%
15.3%
0% 5% 10% 15% 20% 25%
More than 50 times
20 to 50 times
10 to 19 times
3 to 9 times
Less than 3 times
Percent "Very Satisfied"

8/14/2019 Social Security: cust sat
http://slidepdf.com/reader/full/social-security-cust-sat 33/45
33
Source of Information
Almost 90% of respondents said they got information from SSA through published or hard copymaterials. Two-thirds got information from SSA’s web sites.
Q14: How did you get the information from SSA?
6.5%
25.3%
36.9%
43.8%
66.7%
89.3%
0% 10% 20% 30% 40% 50% 60% 70% 80% 90% 100%
Other
SSA's "E-News"
newsletter
Briefings/presentations
by SSA staff
By telephone or fax from
SSA staff
SSA's web sites
Published or hard copy
materials

8/14/2019 Social Security: cust sat
http://slidepdf.com/reader/full/social-security-cust-sat 34/45
34
APPENDIX A: SURVEY METHODOLOGY
SURVEY DESIGN
Questionnaire Design And Pretests
The questionnaire was developed from an initial draft by SSA-OP. It was designed to focus on
two critical components of customer satisfaction. The first part of the questionnaire wasdesigned to measure whether individuals active in this field thought that SSA was producing
research and policy information on topics of interest and importance to them. The second part of the questionnaire focused on users of SSA's research, statistical, or policy information within thetwo years preceding the survey, and their level of satisfaction with that information.
The questionnaire was pretested three different ways. First, Gallup conducted a focus group of
nine users of OP’s products to talk about the concepts in the questionnaire and to discover howthey evaluated OP’s products and services. Second, after the questionnaire was drafted, Gallup
researchers interviewed four SSA employees to get their feedback on the questionnaire. Finally,Gallup interviewers conducted separate telephone interviews with nine OP customers, alternatingbetween two slightly different versions of the questionnaire.
Sample Frame And Selection
Given the subject matter of this survey – research, statistical, and policy information from SSA –it was impossible to operationally define the population of customers or intended customers in a
comprehensive manner. Clearly, the population would include subscribers to SSA-OP'spublications. But the population would also include non-subscribers who are active in this areaof research/policy and who make use of SSA materials in libraries and over the internet, who
contact SSA with requests for information, or who receive information through SSApresentations and briefings. This population could not be fully identified. In addition, there was
no obvious list for another segment of the target population, "Decisionmakers," as mentioned inSSA’s Performance Plan.
After exploring the availability and utility of various lists and sources of names, OP's surveyteam, in consultation with Gallup and others, developed four lists that seemed a reasonable
approach to a sampling frame for this first OP Customer Satisfaction Survey.
The first of these lists was composed of a small group of Decisionmakers, individuals in high-
level positions in SSA and related federal agencies who are presumed to have enhanced potential
for influencing policy decisions. This list of 59 names was prepared by OP's executive staff.
A second list consisted of individual Subscribers to a cross-section of SSA-OP publications.Specifically, those publications included: 1) Social Security Bulletin, 2) ORES Working Papers,
3) Social Security Programs Throughout the World , and 4) SSI reports, including SSI Disabled
Workers and WIN Provisions, Children Receiving SSI , and SSI Annual Statistical Report . There
were 885 non-duplicative names on this list.

8/14/2019 Social Security: cust sat
http://slidepdf.com/reader/full/social-security-cust-sat 35/45
35
The third list, Non-Subscribers who were known to have some active interest in thisresearch/policy area, was more difficult to construct. Various possibilities were explored before
the list was compiled, primarily from the following sources: members of the National Academyof Social Insurance, attendees at recent conferences of the Retirement Research Consortium (a
consortium of researchers whose work is funded by SSA), and participants at recent conferences
sponsored by several other research or policy organizations. For the latter, an effort was made toselect organizations reflecting a broad spectrum of political philosophies. Many of these
individuals were on more than one of these lists, and others were already included in theDecisionmakers or Subscribers lists. A non-duplicative count of this segment of the target
population yielded 1,192 names.
Finally, SSA-OP obtained additional non-subscribers from a list recently developed by SSA's
Office of Communications (OComm). Based on input from SSA's field offices throughout thecountry, this OComm "stakeholder" list identifies individuals at the community level who have
expressed professional interest in SSA's policies and programs. (Many of these individuals are,for example, state or local government workers in social services or health programs.) Among
specific areas of interest, a subset of these persons had identified themselves as interested in"statistical publications" from SSA. The non-duplicative count of these individuals was 802.
Certain individuals were excluded from these lists: employees in SSA-OP, persons livingoutside the U.S, and individuals who had participated in the focus group or pretest, describedabove. Members of Congress and congressional staffs were also excluded from the sample for
the 2001 survey. In the early stages of planning this survey, it was learned that interviews andfocus group sessions with key congressional staffers were being conducted by SSA-OComm
during 2000-2001 in an effort to evaluate SSA's services to Congress, including the provision of statistical and policy analysis information. To avoid duplication of effort and undue respondentburden, SSA decided not to request Congressional participation in OP's 2001 customer
satisfaction survey.
The sequence of the four sampling lists described above and the exclusion of duplicate listings ineach successive list reflected our decisions about different levels of importance and choices for asample design.
First, since we intended to reach some conclusions about how well SSA is serving
Decisionmakers (as suggested in the Performance Plan), a decision was made to include 100% of this small group in the survey sample. The second group (Subscribers) was also considered of primary importance to the survey’s objectives. In order to develop a reliable baseline measure of
customer satisfaction from the survey, it was essential to obtain a reasonably large number of responses from recent “users” of SSA’s research and policy information. Of the four sampling
lists, it seemed that the Subscriber group would likely include the highest proportion of theseusers. Thus, we sampled 100% of this group.
Among the third and fourth groups (Non-Subscribers who are actively interested in thisresearch/policy area and the OComm list), we expected to find a number of users, but were also
concerned about the interests and needs of intended customers who may not have made recentuse of SSA’s products and services. This important but secondary objective of the survey, along

8/14/2019 Social Security: cust sat
http://slidepdf.com/reader/full/social-security-cust-sat 36/45
36
with the combined size of these two groups (roughly twice the size of the Subscriber group),suggested a lower sampling ratio for them.
There were two additional considerations in choosing the sampling ratios for these two groupsand completing the sample design. First, while we did not plan to calculate statistical estimates
(e.g., variances, confidence intervals) based on this imperfect specification of the population, we
considered it important to achieve a completed sample of at least 900 total cases to enablemeaningful subgroup analyses. Second, while Gallup planned to make every effort to achieve an
80% response rate, we also thought it was prudent to consider the possibility of a somewhatlower rate.
With these considerations in mind and with 944 respondents already included from the first twogroups, a sampling ratio of .4293 was required for the third and fourth groups. The following
table presents total numbers and numbers selected for the sample from each of the four samplinglists.
Stratum/Sample GroupNumber on
Sample Frame
Number in
Sample
1. Decisionmakers 59 59
2. Subscribers 885 885
3. Non-Subscribers 1,192 512
4. OComm database 802 344
Total 2,938 1,800
DATA COLLECTION
The first step in data collection was to complete missing contact information for the selected
sample. This was done in several stages. The first was for a Gallup contractor to match caseswith a missing address or telephone number against a computerized database. The second was to
have a Gallup staff member look up any cases that were still missing contact information. Afterthe initial mailing of the questionnaire, Gallup and SSA-OP staff looked for contact informationfor any cases that were incomplete at that point and still missing telephone numbers.
The data collection schedule is listed in the table below. The first step was to mail the
prenotification letter. This was followed by the survey packet, which included a cover letter, thesurvey questionnaire booklet, and a postage-paid return envelope. A reminder postcard wasmailed a week after the survey packet. Telephone interviewers attempted to contact remaining
non-respondents beginning two weeks after the reminder postcard was mailed and continuing for
four more weeks. Data Collection Schedule
Prenotification Letter June 25, 2001
Survey Packet Mailed July 2, 2001
Reminder postcard Mailed July 9, 2001
Telephone Interviewing July 23 - August 24, 2001

8/14/2019 Social Security: cust sat
http://slidepdf.com/reader/full/social-security-cust-sat 37/45
37
Once the questionnaires were collected, the results from the three modes of data collection werecombined into one data file. The file was examined for duplicates and the duplicates were
removed by taking the most complete case and filling missing items with complete informationfrom the duplicate case if possible. Then the least complete cases were eliminated from the file.
This second step removed three cases that had 12 or more of the 20 questionnaire items missing.
The table below shows the data collection results. There were 913 respondents who said they
were active in the field of Social Security related research and policy, and another 130respondents who said they were inactive in the field. Over half of the number of active completes
were collected with the mail questionnaire.
Status Frequency Percent
Incomplete 757 42.1%
Complete – Mail 514 28.6%
Complete – Web 104 5.8%
Complete – Telephone 295 16.4%
Complete – Inactive 130 7.2%Total 1,800 100.0%
The table below shows the final response rates for the total sample and by sample group. Therewere three cases that were returned with no questionnaire ID. Therefore it is unknown which
sample group these cases came from.
Complete –Active
Complete –Inactive
Number inSample
ResponseRate
Decisionmakers 45 0 59 76.3%
Subscriber 483 53 885 60.6%
Non-Subscriber 211 38 512 48.6%OComm 171 39 344 61.0%
Unknown 3 0 NA NA
Total 913 130 1800 57.9%

8/14/2019 Social Security: cust sat
http://slidepdf.com/reader/full/social-security-cust-sat 38/45
38
The final status of the 757 incompletes is listed below. “Other” includes respondents who saythey are ill or had a death in the family, or say they already completed the survey through the
mail or web site. A “non-target” number is when the respondent is not at the number given.There were 226 cases where contact had been made, but the interviewer needed to call back the
respondent to complete the interview; among these callback numbers, all numbers had been
called at least once, with an average number of calls being 8 and the maximum 18. The tablebelow shows the final outcome data for the 757 people who did not participate:
Final Sample Status Frequency Percent
Unlocatable – Mail 57 7.50
Unlocatable – Telephone 41 5.39
Call back 226 29.74
Other 241 31.71
Refused 47 6.18
Deafness/Language problem 1 0.13
Non-target 13 1.71
Busy 6 0.79Answering Machine 37 4.87
No answer 22 2.89
Non-working or disconnected number 66 8.68
Total 757 100.00
DATA FILE PREPARATION AND ANALYSIS
After the initial steps in the data file preparation, the sample variables were added to the data fileincluding: the sample source, whether or not the respondent is an SSA employee, which
publication type the respondent subscribes to, and the ICS code variable (a code that identifies asmall subset of cases that will be analyzed by SSA as part of a separate project on internalcustomer satisfaction).
The open-ended questions were coded after data collection. For questions where the verbatim
response was an “other-specify” question, the response was examined to see if it fit into any of the existing response categories. If it did, it was added to the existing response category. Propernouns, place names, expletives, and unintelligible words were removed from the verbatim
response and replaced with a code such as (undecipherable). Up to three responses were codedfor each open-ended response. The coding was completed in three stages: first by a Gallup
coder, then a Gallup researcher reviewed the codes, and finally all verbatims and codes were sent
to SSA-OP for review.
The next step in the data file preparation was to “clean” the data to make sure there were noinconsistent responses. For the data cleaning Gallup did the following:
• Checked the skip patterns in Questions 2, 11, 12, and 15. Our procedure is if a stem question
indicates that the respondent should have skipped the follow up question but the follow upquestion is completed, we will change the answer to the stem question so that the respondent

8/14/2019 Social Security: cust sat
http://slidepdf.com/reader/full/social-security-cust-sat 39/45
39
should not skip the follow up question. For example, if the respondent filled out any questionin Questions 13-19 but also said “no” in Question 11 (the stem question), we changed
Question 11 to “yes.”
• Gave a special value to questions that a respondent would legitimately skip. For example if
the respondent did not mark statistical tables in Question 15 they were coded with a special
missing code for all of Question 16. This coding of “inapplicables” gave us accurate countsof the number actually missing for each question.
• For “mark all that apply” questions we created a separate variable for each response item thathas a value of 2 if the respondent did not mark that item and 1 if the respondent did mark that
item. If the respondent left the entire question blank, each item was left as missing.
• For “other specify” questions, if the respondent filled in the specify box but did not check the
other box, we used the same one/two coding scheme mentioned above and assigned the otherbox a code of one.
Item nonresponse was generally below 5%. Exceptions are listed in the table below. Questions 9and 20 were open-ended questions, which typically have higher rates of nonresponse. No
imputation was done for any missing values.
Nonresponse greater than 5%
Question 7 7%
Question 9 23%
Question 18 6-12%
Question 20 43%
No weighting was done on the sample because the population of users is not fully defined. SSA-OP continues to try to identify their target audience. However, with the public nature of theirpublications, there may never be a finite population list of those using the SSA materials.

8/14/2019 Social Security: cust sat
http://slidepdf.com/reader/full/social-security-cust-sat 40/45
40
APPENDIX B: SURVEY QUESTIONNAIRE

8/14/2019 Social Security: cust sat
http://slidepdf.com/reader/full/social-security-cust-sat 41/45
The Social Security Administration (SSA) has asked The Gallup Organization to find out what you think about its research, statistical, and policy analysis efforts.
SSA produces a variety of statistical and analytical information about its programs and about related issues.
The information is disseminated in various ways, including the Internet, through SSA staff, and in publica-
tions and reports (e.g., the Social Security Bulletin, the Annual Statistical Supplement ).
The purpose of this survey is to help SSA improve these products and services. As you will see, some of the
survey questions are directed to anyone with professional interests in this area, while other questions are
restricted to those who have actually used some of the SSA’s research, statistical, or policy information in
recent years. Your opinions are still important to SSA and Gallup, even if you are a “non-user”.
Please take a few minutes to fill out this questionnaire and send it back to us in the enclosed postage-paid
envelope. We estimate that the survey will take about ten minutes to complete. Your answers will be kept
strictly confidential, and will be merged with the responses of others like yourself.
If you wish to take this survey online, you may do so by logging into http://ssaop.gallup.comThe code (PIN) you should use to access the survey is on the cover letter attached to this questionnaire.
Thank you again for your participation. We greatly appreciate your time and your help.
SOCIAL SECURITY ADMINISTRATION – OFFICE OF POLICY
CUSTOMER SATISFACTION SURVEY
The PRIVACY ACT requires us to notify you that we are authorized to collect this information by Section 702 of the
Social Security Act. You do NOT have to provide the information requested. However, the data you provide will help the
Social Security Administration - Office of Policy to evaluate and improve its products and services. The Gallup
Organization guarantees the confidentiality of every respondent.
The PAPERWORK REDUCTION ACT OF 1995 requires us to notify you that this information collection is in
accordance with the clearance requirements of 44 U.S.C. § 3507, as amended by section 2 of the Paperwork Reduction
Act of 1995. We may not conduct or sponsor, and you are not required to respond to, a collection of information unless
it displays a valid OMB control number. We estimate that it will take you about 10 minutes to complete this questionnaire.
This includes the time it will take you to read the instructions and fill out the questionnaire.
OMB No. 0960-0526
Expires: 12-31-02

8/14/2019 Social Security: cust sat
http://slidepdf.com/reader/full/social-security-cust-sat 42/45
1 Currently, which of the categories below best
describes where you work? (Mark only one)
U.S. Congress or Congressional agency
Federal government, Executive branch
State or local governmentUniversity or college
Private research or policy organization
Business or industry
Nonprofit service organization
Professional or trade association
Advocacy or lobbying group
The press or other media
No work affiliation (for example, retired)
Other (please specify)
2 At any time in the past 24 months, have you had any
professional interest in research, statistics, or policy
issues relevant to Social Security or to Supplemental
Security Income (SSI – the means tested public
assistance program administered by SSA)?
Yes¬ Continue with #3
No¬ Stop – Please return your survey
in the enclosed envelope.
3 During the course of your career, approximately how
many years have you had some interest in issues
relevant to Social Security or SSI?
Less than 5 years
5 to 9 years
10 to 20 years
More than 20 years
4 Are your professional interests more in issues
relevant to Social Security, to SSI, or to both?
Social Security
SSI
Both
5 Are your professional interests more in retirement
issues, disability issues, or both?
Retirement issues
Disability issues
Both
6 Do you have a professional interest in any of the
topics below? (Mark all that apply)
Current programs or proposals for change
(Social Security or SSI)
Social Security financing issues, includingstatus of the trust funds
Economic impact of the Social Security or
SSI programs
Work-related issues (for example, employment
and earnings, the retirement process, facilitating
work among the disabled)
Other government income security programs
in the U.S.
Private sources of income security (for example,
individual savings, employer pensions)
Economic well-being of the aged or disabledIncome security systems in other countries
Other SSA-related topics (please specify)
7 Are you particularly interested in any of the
subgroups below? (Mark all that apply)
Women
Racial or ethnic minorities
Low wage workers
Early retirees
Older workers
Disabled children
Disabled adults
The oldest old (age 85+)
Widowed, divorced, or never married persons
Immigrants, non-citizensOther (please specify)
This questionnaire is a scannable form. Please mark your responses
with an “x” using a blue or black pen like this , not like .

8/14/2019 Social Security: cust sat
http://slidepdf.com/reader/full/social-security-cust-sat 43/45
Interested
in data files
w
Not
interested in
data files
w
11 During the past 24 months, have you received any
research, statistical, or policy information from
SSA publications, SSA web sites, or SSA staff?
Yes¬ Skip to #13
No ¬ Continue with #12
12 Is there any particular reason why youhave not used SSA’s information?
(If you answered #12)¬ Skip to #20
13 During the past 24 months, about how many times
have you received or sought this kind of information
from SSA?
Less than 3 times
3 to 9 times
10 to 19 times
20 to 50 times
More than 50 times
14 How did you get the information from SSA?
(Mark all that apply)
Published or hard copy materials
SSA’s “E-news” newsletter
SSA’s web sites
By telephone or fax from SSA staff
Briefings or other presentations by SSA staff
Other (please specify)
8 One of SSA’s goals is to identify and work on new
and emerging research and policy issues. How
satisfied are you with SSA’s performance in this
area over the past two years?
Very satisfied
Somewhat satisfied
Neither satisfied nor dissatisfied
Somewhat dissatisfied
Very dissatisfied
No opinion
9 Please list the most important research or policy
issues that you think SSA should be working on in
the next year or two.
10 SSA has various administrative data files with
restricted access to protect confidentiality. In your
work, would you be interested in having access to
public-use data files in any of the following areas?
(Mark one box for each item)
a. Earning histories of
covered workers ........................
b. Characteristics of Social Security
beneficiaries (including benefit
types and amounts) ...................
c. Characteristics of SSI recipients .....
d. SSA data that has been linked
to surveys (for example, Census
Bureau surveys) ........................
e. Other data files of interest (please specify)
8/14/2019 Social Security: cust sat
http://slidepdf.com/reader/full/social-security-cust-sat 44/45
Very
satisfied
w
Somewhat
satisfied
w
Neither
satisfied nor
dissatisfied
w
Somewhat
dissatisfied
w
Very
dissatisfied
w
No
opinion
w
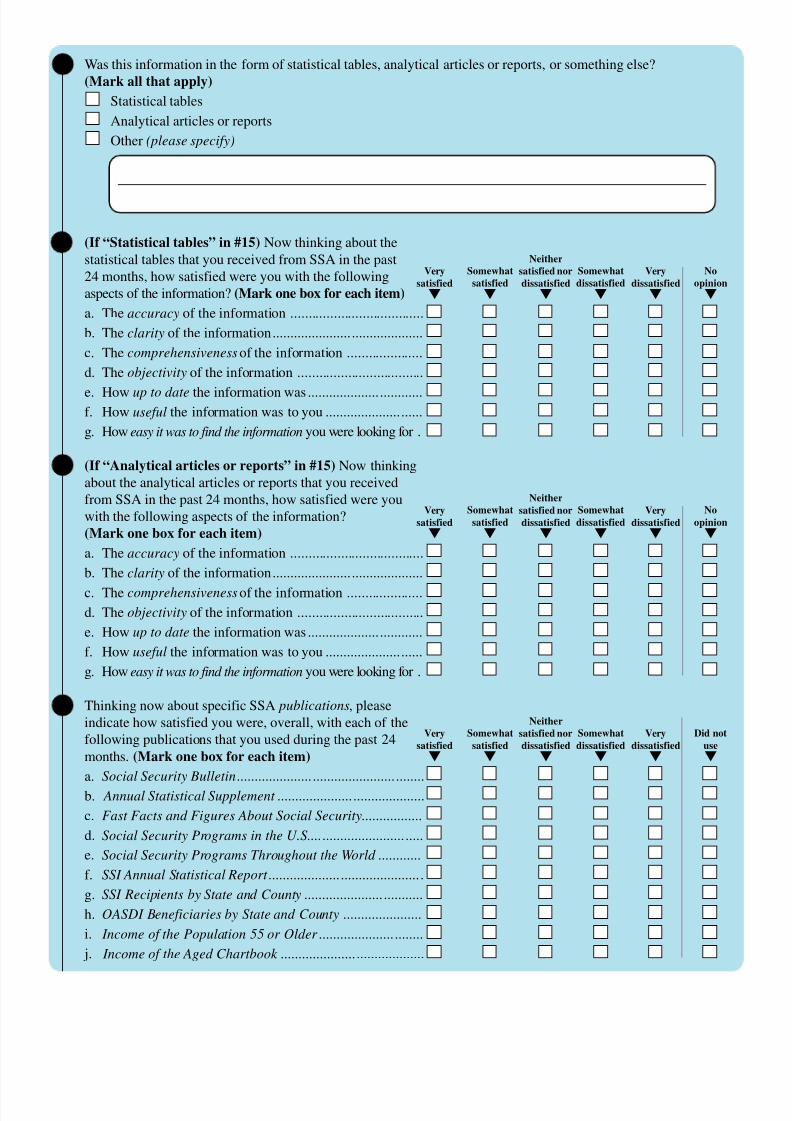
15 Was this information in the form of statistical tables, analytical articles or reports, or something else?
(Mark all that apply)
Statistical tables
Analytical articles or reports
Other (please specify)
16 (If “Statistical tables” in #15) Now thinking about the
statistical tables that you received from SSA in the past
24 months, how satisfied were you with the following
aspects of the information? (Mark one box for each item)
a. The accuracy of the information .....................................
b. The clarity of the information..........................................
c. The comprehensiveness of the information .....................
d. The objectivity of the information ...................................
e. How up to date the information was ................................f. How useful the information was to you ...........................
g. How easy it was to find the information you were looking for .
17 (If “Analytical articles or reports” in #15) Now thinking
about the analytical articles or reports that you received
from SSA in the past 24 months, how satisfied were you
with the following aspects of the information?
(Mark one box for each item)
a. The accuracy of the information .....................................
b. The clarity of the information..........................................
c. The comprehensiveness of the information .....................
d. The objectivity of the information ...................................
e. How up to date the information was ................................
f. How useful the information was to you ...........................
g. How easy it was to find the information you were looking for .
18 Thinking now about specific SSA publications, please
indicate how satisfied you were, overall, with each of the
following publications that you used during the past 24
months. (Mark one box for each item)
a. Social Security Bulletin....................................................
b. Annual Statistical Supplement .........................................
c. Fast Facts and Figures About Social Security.................
d. Social Security Programs in the U.S................................
e. Social Security Programs Throughout the World ............
f. SSI Annual Statistical Report ...........................................
g. SSI Recipients by State and County .................................
h. OASDI Beneficiaries by State and County ......................
i. Income of the Population 55 or Older .............................
j. Income of the Aged Chartbook ........................................
Very
satisfied
w
Somewhat
satisfied
w
Neither
satisfied nor
dissatisfied
w
Somewhat
dissatisfied
w
Very
dissatisfied
w
No
opinion
w
Very
satisfied
w
Somewhat
satisfied
w
Neither
satisfied nor
dissatisfied
w
Somewhat
dissatisfied
w
Very
dissatisfied
w
Did not
use
w

8/14/2019 Social Security: cust sat
http://slidepdf.com/reader/full/social-security-cust-sat 45/45
THANK YOU FOR PARTICIPATING IN THIS SURVEY.
PLEASE RETURN YOUR COMPLETED QUESTIONNAIRE IN THE ENCLOSED ENVELOPE.
19 How satisfied were you with the OVERALL QUALITY of SSA’s research, statistical, or policy information
in the past 24 months?
Very satisfied
Somewhat satisfied
Neither satisfied nor dissatisfied
Somewhat dissatisfied
Very dissatisfied
20 Please list any recommendations you have for improving Social Security’s research, statistical, or policy
products and services.