social security: benefit calculation - congress
TRANSCRIPT

Social Security: Benefit Calculation
Updated November 24, 2021
Congressional Research Service
https://crsreports.congress.gov
R46658
Congressional Research Service
SUMMARY
Social Security: Benefit Calculation Old-Age and Survivors Insurance (OASI) and Disability Insurance (DI), commonly referred to
on a combined basis as OASDI, are social insurance programs that protect insured workers and
their family members against loss of income due to old age, disability, or death. These programs
are often referred to as Social Security. Monthly Social Security benefit amounts are determined
by federal law. Most Social Security beneficiaries are retired or disabled workers whose monthly
benefits depend on their past earnings, the age at which they claimed benefits, and other factors.
Benefits are also paid to workers’ dependents and survivors based on the earnings of the insured
workers.
The computation process involves three main steps:
1. First, a summarized measure of lifetime Social Security–covered earnings is computed. That measure is called the
average indexed monthly earnings (AIME).
2. Second, a progressive benefit formula is applied to the AIME to compute the primary insurance amount (PIA). The
benefit formula is progressive. As a result, workers with higher AIMEs receive higher Social Security benefits, with
benefits received by people with lower earnings replacing a larger share of career-average earnings.
3. Third, an adjustment may be made based on the age at which a beneficiary chooses to begin receiving benefits. For
retired workers who claim benefits at the full retirement age (FRA) and for disabled workers, the monthly benefit
equals the PIA. Retired workers who claim earlier than the FRA receive monthly benefits lower than the PIA (i.e.,
an actuarial reduction), and those who claim later than the FRA receive benefits higher than the PIA (i.e., a delayed
retirement credit).
Retired-worker benefits can be affected by other adjustments. For example, the windfall elimination provision can reduce
benefits for individuals who receive a pension based on employment not covered by Social Security, and benefits can be
temporarily withheld under the retirement earnings test if a beneficiary under the FRA continues to work and earns above a
certain amount. Although not an adjustment, income tax can affect Social Security benefits and thus the beneficiary’s net
income.
Benefits for eligible dependents and survivors are based on the worker’s PIA. For example, a dependent spouse can receive a
benefit equal to 50% of the worker’s PIA, and a widow(er) can receive a benefit equal to 100% of the worker’s PIA.
Dependent benefits may also be adjusted based on the age at which they are claimed and other factors.
In October 2021, there were approximately 65.2 million Social Security beneficiaries collecting an average monthly benefit
of $1,442. Retired-worker and disabled-worker beneficiaries accounted for 84.5% of the beneficiary population. The largest
single category of beneficiaries was retired workers (72.3%), with an average monthly benefit of $1,563. The second-largest
category was disabled workers (12.2%), with an average monthly benefit of $1,282. Family members of retired, disabled, or
deceased workers accounted for the remainder of the beneficiary population (15.5%). The Social Security Administration’s
Office of the Chief Actuary estimates that about 94% of workers (176 million) are covered under the OASDI programs.
Because of the number of people receiving benefits, the number of people expected to receive benefits, and the program’s
projected long-term financial imbalance, there has been some congressional interest in making changes to the benefit
formula.
R46658
November 24, 2021
Barry F. Huston Analyst in Social Policy

Social Security: Benefit Calculation
Congressional Research Service
Contents
Introduction ..................................................................................................................................... 1
Eligibility and Insured Status .......................................................................................................... 2
Insured Status ............................................................................................................................ 2 Amount Needed to Earn Credits ............................................................................................... 3
Average Index Monthly Earnings .................................................................................................... 3
Wage Indexing .................................................................................................................... 3 Number of Years ................................................................................................................. 4 AIME for Hypothetical Workers Born in 1952 ................................................................... 4
Primary Insurance Amount .............................................................................................................. 5
PIA for Hypothetical Workers Born in 1952 ....................................................................... 5
Benefit Amounts .............................................................................................................................. 6
Age .................................................................................................................................................. 6
Adjustments for Early and Late Benefit Claim ......................................................................... 7 Cost-of-Living Adjustments ...................................................................................................... 8
Benefit Amounts for Hypothetical Workers Born in 1952 .................................................. 8
Features of the Benefit Formula ...................................................................................................... 9
Auxiliary Benefits .......................................................................................................................... 11
Maximum Family Benefits ..................................................................................................... 12
Other Adjustments to Benefits....................................................................................................... 12
Figures
Figure A-1. Scaled Factors by Hypothetical Earnings Level and Age .......................................... 14
Tables
Table 1. Total Wage-Indexed Earnings and Average Indexed Monthly Earnings (AIME)
for Hypothetical Workers Born in 1952, by Earnings Level ........................................................ 4
Table 2. Computation of Primary Insurance Amounts (PIAs) for Hypothetical Workers
Born in 1952, by Earnings Levels ................................................................................................ 6
Table 3. Full Retirement Age (FRA) by Year of Birth .................................................................... 6
Table 4. Monthly Benefit Amounts for Hypothetical Workers Born in 1952, by Earnings
Level at Claiming Age .................................................................................................................. 9
Table 5. Wage-Indexed Earnings, Average Indexed Monthly Earnings (AIMEs), and
Primary Insurance Amounts (PIAs) for Hypothetical Earners Born in 1952, by Earnings
Level and Years of Earnings ....................................................................................................... 10
Table A-1. Distribution of Average-Indexed Monthly Earnings (AIMEs) of Actual
Workers Retiring in Years 2015-2020, Relative to AIMEs for Hypothetical Workers
Retiring in 2020 .......................................................................................................................... 15
Social Security: Benefit Calculation
Congressional Research Service
Table A-2. Hypothetical Wages for 1952 Birth Cohort by Earnings Level ................................... 16
Table A-3. Wage-Indexed Hypothetical Wages for 1952 Birth Cohort by Earnings Level ........... 17
Table B-1. Parameters Used to Calculate Social Security Eligibility and Benefits, Select
Years ........................................................................................................................................... 20
Table B-2. Social Security Benefit Amounts, Full Retirement Age (FRA), and Delayed
Retirement Credits (DRCs) by Birth Year .................................................................................. 22
Table C-1. Social Security Benefits for the Worker’s Family Members ....................................... 24
Appendixes
Appendix A. Hypothetical Workers, Wages, and Indexed Wages ................................................. 14
Appendix B. Social Security Program Information ....................................................................... 20
Appendix C. Auxiliary Benefits .................................................................................................... 24
Contacts
Author Information ........................................................................................................................ 26
Social Security: Benefit Calculation
Congressional Research Service 1
Introduction Old-Age and Survivors Insurance (OASI) and Disability Insurance (DI), commonly referred to on
a combined basis as OASDI, are social insurance programs that protect insured workers and their
family members against loss of income due to old age, disability, or death. These programs are
often referred to as Social Security. Most Social Security beneficiaries are retired or disabled
workers whose monthly benefits depend on their past earnings, their age, and other factors.
Benefits are also paid to workers’ dependents and survivors based on the earnings of the insured
workers.
Social Security has a significant impact on beneficiaries, both young and old, in terms of income
support and poverty reduction.1 Under current law, Social Security’s revenues are projected to be
insufficient to pay full scheduled benefits after 2034.2 For both of those reasons, Social Security
is of ongoing interest to policymakers. Most proposals to change Social Security would change
the benefit computation rules. Evaluating such proposals requires an understanding of how
benefits are computed under current law.
This report provides several examples of how benefits are computed under current law. To help
illustrate the benefit formula, this report makes use of hypothetical earners. Wages for
hypothetical earners are expressed at each age as a percent of the Social Security Administration’s
(SSA’s) Average Wage Index (AWI).3 Throughout this report, examples of benefit calculations
are shown for very low, low, medium, and high lifetime hypothetical earners as well as maximum
earners.4 This technique demonstrates how Social Security benefits are computed under current
law, how career earnings affect benefit levels, and how program changes may affect beneficiaries.
In addition, this technique illustrates how indexed parameters that change year to year affect
benefit amounts. Appendix A provides more details, including distributional information, on
wages of hypothetical earners born in 1952. This year is chosen simply because it is the youngest
1 Research suggests that Social Security benefits accounted for most of the decline in poverty from 1967 through 2000.
For more information, see CRS Report R45791, Poverty Among the Population Aged 65 and Older.
2 Social Security Administration (SSA), Office of the Chief Actuary, The 2021Annual Report of the Board of Trustees
of the Federal Old-Age and Survivors Insurance and Federal Disability Insurance Trust Funds, August 31, 2021,
https://www.ssa.gov/OACT/TR/2021/tr2021.pdf (hereinafter cited as “2021 Annual Report”). Under current law, the
OASI and DI trust funds are distinct entities and cannot borrow from each other when faced with a funding shortfall.
The shifting of funds between OASI and DI can be done only with authorization from Congress. In the past, Congress
has authorized temporary interfund borrowing among the OASI, DI, and Medicare Hospital Insurance trust funds, as
well as temporary payroll tax reallocations between OASI and DI, to deal with funding shortfalls. Most recently, under
the Bipartisan Budget Act of 2015 (P.L. 114-74), Congress authorized a temporary reallocation of payroll taxes from
the OASI fund to the DI fund for calendar years 2016-2018. Because of such actions, the OASI and DI trust funds are
discussed on a combined basis. Separately, the OASI fund is projected to have asset reserves until 2033, at which point
continuing income to the fund would be sufficient to pay 76% of OASI scheduled benefits. The DI fund is projected to
have asset reserves until 2057, at which point continuing income would be sufficient to pay 91% of DI scheduled
benefits (2021 Annual Report, p. 6.) The 2021 intermediate assumptions reflect the trustees’ understanding of the status
of the Social Security trust funds at the start of 2021. Unlike the previous year’s report, the 2021 estimates do include
potential effects of Coronavirus Disease 2019 (COVID-19). Although the report includes impacts from COVID-19, the
impacts are confined to the near term. The trustees acknowledge that effects from the pandemic, especially in the long
term, are subject to a high level of uncertainty.
3 SSA, Office of the Chief Actuary (OCACT), Scaled Factors for Hypothetical Earnings Examples Under the 2021
Trustees Report Assumptions, August 2021 at https://www.ssa.gov/OACT/NOTES/ran3/an2021-3.pdf.
4 A maximum earner is a worker who has earnings at or above the contribution and benefit base for each year starting at
age 22 through the year prior to retirement (2021 Annual Report, p. 156). The contribution and benefit base for 2022 is
$147,000 (see SSA, 2022 Social Security Changes, https://www.ssa.gov/news/press/factsheets/colafacts2022.pdf).
Social Security: Benefit Calculation
Congressional Research Service 2
cohort of workers and beneficiaries for which complete information on indexed earnings and
program-specific factors are known.
Eligibility and Insured Status Workers become eligible for Social Security benefits for themselves and for their family members
by working in Social Security–covered employment.5 Generally speaking, about 94% of workers
earn wages or self-employment income in Social Security–covered employment.6 While working
in covered employment, workers earn quarters of coverage (QCs), or credits. The amount needed
for a QC increases annually with growth in average earnings in the national economy as
measured by the AWI (see Table B-1).7 In 2022, a worker will earn one credit or QC for every
$1,510 of earnings, up to four per year. Therefore, a worker earning $6,040 in covered
employment at any point in the calendar year would be credited with the maximum number (i.e.,
four) of QCs for that year.
Insured Status
To be eligible for most benefits, workers must be fully insured, which requires one QC for each
year elapsed after the worker turns 21 years old—with a minimum of six QCs and a maximum of
40 QCs—and the year before the worker attains age 62, the year before the worker dies, or the
year before the worker becomes disabled. A worker is first eligible for Social Security retirement
benefits at 62, so to be eligible for retirement benefits, a worker must generally have worked for
10 years. Workers are permanently insured when they are fully insured and will not lose fully
insured status when they stop working under covered employment, for example, if a worker has
the maximum 40 QCs.
Benefits may be paid to eligible survivors of a worker who was fully insured at the time of death.8
Some dependents are also eligible for survivors benefits if the deceased worker was currently
insured, which requires earning six QCs in the 13 quarters ending with the quarter of death.
To be eligible for disability benefits, workers must also satisfy a recency of work requirement.
Workers aged 31 or older must have earned 20 QCs in the 10 years before becoming disabled.
Fewer QCs are required for younger workers.9
In the case of workers having work history in multiple countries, international totalization
agreements allow workers who divide their careers between the United States and certain
5 A list of eligibility requirements for family members is covered in Appendix C. Covered employment is employment
for which earnings are creditable for Social Security purposes (2021 Annual Report, p. 243). The roughly 6% of
workers who are not covered by Social Security are state and local government workers, certain workers employed by
religious groups, and certain noncitizen workers.
6 OCACT, “Social Security Program Fact Sheet,” June 2021, https://www.ssa.gov/oact/FACTS/index.html.
7 The AWI is the average of all workers’ wages subject to federal income taxes and contributions to deferred
compensation plans. It is calculated using some wages that are not subject to the Social Security payroll tax.
8 For more information on survivors benefits, see CRS Report RS22294, Social Security Survivors Benefits.
9 To be eligible for disability benefits, workers must also be found unable to engage in substantial gainful activity. See
CRS Report R44948, Social Security Disability Insurance (SSDI) and Supplemental Security Income (SSI): Eligibility,
Benefits, and Financing.

Social Security: Benefit Calculation
Congressional Research Service 3
countries to fill gaps in Social Security coverage by combining work credits under each country’s
system to qualify for benefits under one or both systems.10
Amount Needed to Earn Credits
As discussed, in 2022, a worker will earn one QC for each $1,510 of covered earnings.11
Therefore, a worker earning $6,040 in covered employment at any point in the calendar year
would be credited with the maximum number (i.e., four) of QCs for that year. Alternatively, if a
worker earned $4,530 in covered employment in 2022, he or she would be credited with three
QCs for that year ($4,530 divided by $1,510).
Average Index Monthly Earnings The first step of computing a Social Security benefit is determining a worker’s average indexed
monthly earnings (AIME), a measure of a worker’s past earnings.
A worker’s Social Security benefit is based on his or her earnings during covered employment.
That is, only earnings from years of covered employment are included in the calculation.
Earnings that were not covered (i.e., not subject to the Social Security payroll tax) are not
included in the calculation.
Under current law, the Social Security payroll tax is applied to covered earnings up to an annual
limit, or taxable maximum. The taxable maximum is indexed to national average wage growth for
years in which a cost-of-living adjustment (COLA) is payable. The taxable maximum will
increase from $142,800 in 2021 to $147,000 in 2022. This level of earnings is both the
contribution base (i.e., amount of covered earnings subject to the Social Security payroll tax) and
the benefit base (i.e., amount of covered earnings used to determine benefits). Earnings in excess
of the taxable maximum are not subject to the Social Security payroll tax and are not factored into
benefit calculations.
Wage Indexing
Rather than using the amounts earned in past years directly, the AIME computation process first
updates past earnings to account for the growth in overall economy-wide earnings. That is done
by increasing each year of a worker’s taxable earnings after 1950 by the growth in average
earnings in the economy, as measured by the AWI, from the year of work until two years prior to
eligibility for benefits, which for retired workers is at age 60. (Workers are first eligible for
benefits at age 62.12) For example, the national average wage grew from $32,155 in 2000 to
$41,674 in 2010. So if a worker earned $20,000 in 2000 and turned 60 in 2010, the indexed wage
for 2000 would be $20,000 × ($41,674/$32,155), or $25,921. Earnings from later years—for
retired workers at ages 60 and above—are not indexed.
10 See CRS Report RL32004, Social Security Benefits for Noncitizens.
11 Since 1978, the amount needed to earn a QC has been indexed to changes in the AWI. See OCACT, “Quarter of
Coverage,” https://www.ssa.gov/OACT/COLA/QC.html. Under current law, the amount needed to earn a QC cannot
decrease. That is, the amount required is the higher of (1) the amount in effect for the calendar year a determination is
made or (2) the product of that calendar year’s amount and the change in the AWI (42 U.S.C. §413(a)).
12 SSA uses the national average wage indexing series to ensure that future benefits reflect the general rise in the
standard of living over the course of a worker’s earning history. For details, see “Index earnings used to compute initial
benefits” in OCACT, “National Average Wage Index,” https://www.ssa.gov/oact/COLA/AWI.html.

Social Security: Benefit Calculation
Congressional Research Service 4
Number of Years
For retired workers, the AIME equals the average of the highest 35 years of indexed earnings
divided by 12 (to change the benefit from an annual to a monthly measure). Those years of
earnings are known as computation years. If the person worked fewer than 35 years in
employment subject to Social Security payroll taxes, the computation includes some years of zero
earnings.
In the case of workers who die before turning 62 years old, the number of computation years is
generally reduced below 35 by the number of years until he or she would have reached 62. For
example, the AIME for a worker who died at 61 is based on 34 computation years.
For disabled workers, the number of computation years depends primarily on the age at which
they become disabled, increasing from two years for those aged 24 or younger to 35 years for
those aged 62 or older.13
AIME for Hypothetical Workers Born in 1952
Table 1 shows the AIME for the four hypothetical scaled earners and maximum earner for the
1952 birth cohort. (Nominal annual earnings for this cohort are shown in Table A-2, and wage-
indexed earnings for this cohort are shown in Table A-3.) These workers, born in 1952, are
assumed to have entered the labor force in 1973 (i.e., age 21) and worked continually until 2014
(i.e., age 62). As discussed and shown in Table A-3, annual earnings until age 60 are wage-
indexed using the AWI, whereas earnings for later years are kept at nominal values (reflected by
an index factor of 1.00 in Table A-3). The AIME is calculated by taking the total of the highest 35
years of earnings and dividing by 420 (the number of months in 35 years).
Table 1. Total Wage-Indexed Earnings and Average Indexed Monthly Earnings (AIME)
for Hypothetical Workers Born in 1952, by Earnings Level
Very Low
Earner
Low
Earner
Medium
Earner
Higher
Earner
Maximum
Earner
Total Earnings from Highest
35 Years of Wage-Indexed
Earnings
$386,516.41 $695,712.04 $1,545,756.54 $2,473,343.43 $3,734,047.63
AIME 920.00 1,656.00 3,680.00 5,888.00 8,890.00
Source: CRS.
Note: Wage-indexed earnings are rounded to the nearest cent, and AIMEs are rounded down to the nearest
dollar (see 20 C.F.R. §404.211).
13 The number of computation years equals the number of “elapsed years” minus any “dropout years.” The number of
elapsed years equals the calendar years after an individual turns 21 years old through the year before the individual first
becomes eligible for disability benefits with a minimum of two. For every five elapsed years, there is one disability
dropout year up to a maximum of five. In addition, people with fewer than three disability dropout years may be
credited with up to two additional dropout years based on the care of a child for up to a total of three dropout years. See
CRS Report R43370, Social Security Disability Insurance (SSDI): Becoming Insured, Calculating Benefit Payments,
and the Effect of Dropout Year Provisions.
Social Security: Benefit Calculation
Congressional Research Service 5
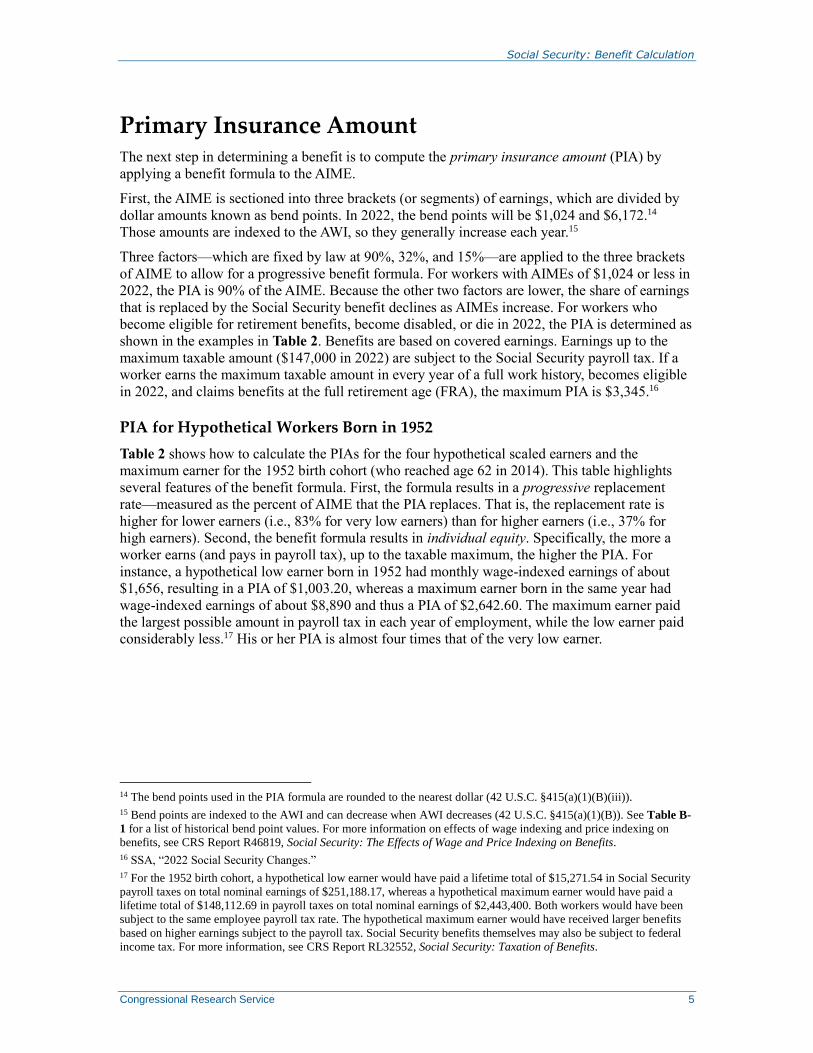
Primary Insurance Amount The next step in determining a benefit is to compute the primary insurance amount (PIA) by
applying a benefit formula to the AIME.
First, the AIME is sectioned into three brackets (or segments) of earnings, which are divided by
dollar amounts known as bend points. In 2022, the bend points will be $1,024 and $6,172.14
Those amounts are indexed to the AWI, so they generally increase each year.15
Three factors—which are fixed by law at 90%, 32%, and 15%—are applied to the three brackets
of AIME to allow for a progressive benefit formula. For workers with AIMEs of $1,024 or less in
2022, the PIA is 90% of the AIME. Because the other two factors are lower, the share of earnings
that is replaced by the Social Security benefit declines as AIMEs increase. For workers who
become eligible for retirement benefits, become disabled, or die in 2022, the PIA is determined as
shown in the examples in Table 2. Benefits are based on covered earnings. Earnings up to the
maximum taxable amount ($147,000 in 2022) are subject to the Social Security payroll tax. If a
worker earns the maximum taxable amount in every year of a full work history, becomes eligible
in 2022, and claims benefits at the full retirement age (FRA), the maximum PIA is $3,345.16
PIA for Hypothetical Workers Born in 1952
Table 2 shows how to calculate the PIAs for the four hypothetical scaled earners and the
maximum earner for the 1952 birth cohort (who reached age 62 in 2014). This table highlights
several features of the benefit formula. First, the formula results in a progressive replacement
rate—measured as the percent of AIME that the PIA replaces. That is, the replacement rate is
higher for lower earners (i.e., 83% for very low earners) than for higher earners (i.e., 37% for
high earners). Second, the benefit formula results in individual equity. Specifically, the more a
worker earns (and pays in payroll tax), up to the taxable maximum, the higher the PIA. For
instance, a hypothetical low earner born in 1952 had monthly wage-indexed earnings of about
$1,656, resulting in a PIA of $1,003.20, whereas a maximum earner born in the same year had
wage-indexed earnings of about $8,890 and thus a PIA of $2,642.60. The maximum earner paid
the largest possible amount in payroll tax in each year of employment, while the low earner paid
considerably less.17 His or her PIA is almost four times that of the very low earner.
14 The bend points used in the PIA formula are rounded to the nearest dollar (42 U.S.C. §415(a)(1)(B)(iii)).
15 Bend points are indexed to the AWI and can decrease when AWI decreases (42 U.S.C. §415(a)(1)(B)). See Table B-
1 for a list of historical bend point values. For more information on effects of wage indexing and price indexing on
benefits, see CRS Report R46819, Social Security: The Effects of Wage and Price Indexing on Benefits.
16 SSA, “2022 Social Security Changes.”
17 For the 1952 birth cohort, a hypothetical low earner would have paid a lifetime total of $15,271.54 in Social Security
payroll taxes on total nominal earnings of $251,188.17, whereas a hypothetical maximum earner would have paid a
lifetime total of $148,112.69 in payroll taxes on total nominal earnings of $2,443,400. Both workers would have been
subject to the same employee payroll tax rate. The hypothetical maximum earner would have received larger benefits
based on higher earnings subject to the payroll tax. Social Security benefits themselves may also be subject to federal
income tax. For more information, see CRS Report RL32552, Social Security: Taxation of Benefits.

Social Security: Benefit Calculation
Congressional Research Service 6
Table 2. Computation of Primary Insurance Amounts (PIAs) for Hypothetical
Workers Born in 1952, by Earnings Levels
Factors
Three Brackets of Average
Indexed
Monthly
Earnings
(AIME) in 2014
PIAs for Hypothetical Workers
Very Low
Earner Low Earner
Medium
Earner
High
Earner
Maximum
Earner
AIME of
$920.00
AIME of
$1,656.00
AIME of
$3,680.00
AIME of
$5,888.00
AIME of
$8,890.00
90% first $8161 of
AIME, plus $734.40 $734.40 $734.40 $734.90 $734.90
32%
AIME over $816
and through
$4,917, plus
33.28 268.80 916.48 1,312.32 1,312.32
15% AIME over $4,917 0.00 0.00 0.00 145.65 595.95
Total: Worker’s PIA (by
law, rounded down to nearest
10 cents)
767.60 1,003.20 1,650.80 2,192.30 2,642.60
PIA as Percent of AIME 83% 61% 45% 37% 30%
Source: CRS.
Notes: The bend points shown in the table apply to workers who first become eligible in 2014. See Table B-1
for historical values of bend points. Under current law, PIA is rounded down to the nearest dime (42 U.S.C.
§415(a)(1)(A)).
Benefit Amounts The PIA calculated in the previous section may not be the benefit amount a worker will receive at
retirement. The PIA is further adjusted for age at benefit claiming and COLAs to determine the
benefit amount. Also, PIAs may be recomputed to capture additional covered earnings.18
Age The earliest eligibility age is the age at which a retired worker can first claim benefits. The full
retirement age (FRA, also called the normal retirement age) is the age at which a worker can
receive the full PIA, increased by any COLAs. The FRA was 65 for people born before 1938, but
the Social Security Amendments of 1983 (P.L. 98-21) raised the FRA for those born later, as
shown in Table 3.
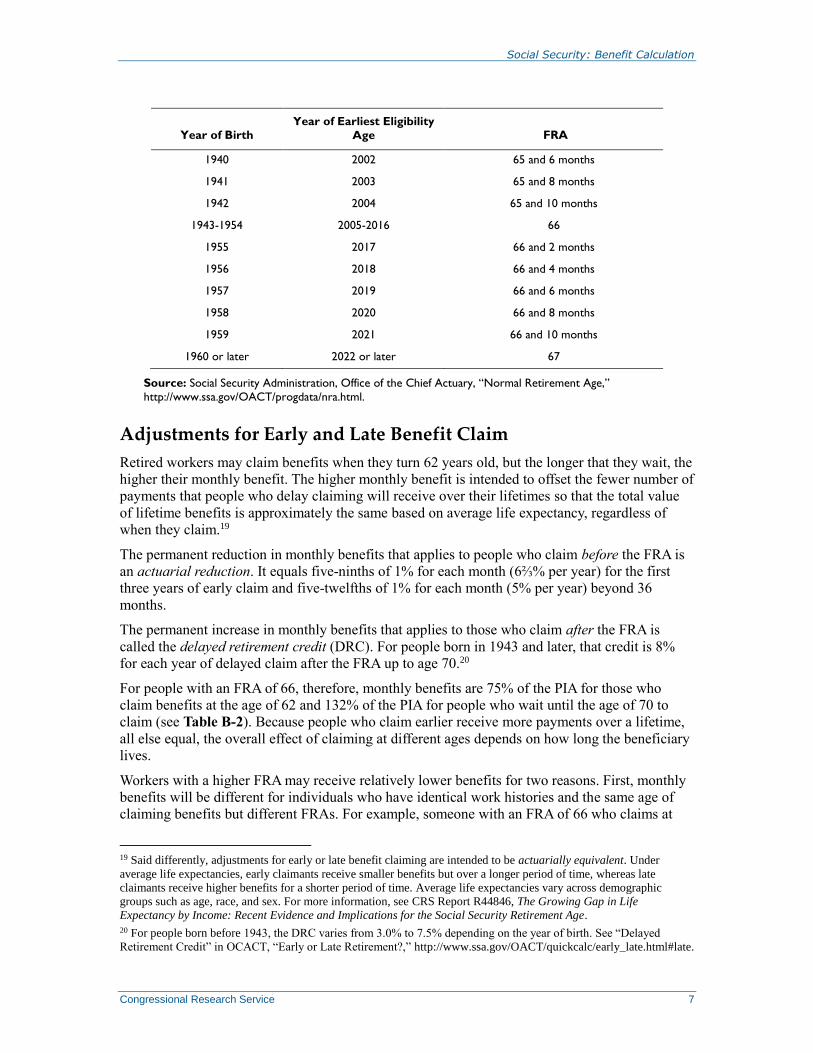
Table 3. Full Retirement Age (FRA) by Year of Birth
Year of Birth
Year of Earliest Eligibility
Age FRA
1937 or earlier 1999 or earlier 65
1938 2000 65 and 2 months
1939 2001 65 and 4 months
18 20 C.F.R. §404.281.
Social Security: Benefit Calculation
Congressional Research Service 7
Year of Birth Year of Earliest Eligibility
Age FRA
1940 2002 65 and 6 months
1941 2003 65 and 8 months
1942 2004 65 and 10 months
1943-1954 2005-2016 66
1955 2017 66 and 2 months
1956 2018 66 and 4 months
1957 2019 66 and 6 months
1958 2020 66 and 8 months
1959 2021 66 and 10 months
1960 or later 2022 or later 67
Source: Social Security Administration, Office of the Chief Actuary, “Normal Retirement Age,”
http://www.ssa.gov/OACT/progdata/nra.html.
Adjustments for Early and Late Benefit Claim
Retired workers may claim benefits when they turn 62 years old, but the longer that they wait, the
higher their monthly benefit. The higher monthly benefit is intended to offset the fewer number of
payments that people who delay claiming will receive over their lifetimes so that the total value
of lifetime benefits is approximately the same based on average life expectancy, regardless of
when they claim.19
The permanent reduction in monthly benefits that applies to people who claim before the FRA is
an actuarial reduction. It equals five-ninths of 1% for each month (6⅔% per year) for the first
three years of early claim and five-twelfths of 1% for each month (5% per year) beyond 36
months.
The permanent increase in monthly benefits that applies to those who claim after the FRA is
called the delayed retirement credit (DRC). For people born in 1943 and later, that credit is 8%
for each year of delayed claim after the FRA up to age 70.20
For people with an FRA of 66, therefore, monthly benefits are 75% of the PIA for those who
claim benefits at the age of 62 and 132% of the PIA for people who wait until the age of 70 to
claim (see Table B-2). Because people who claim earlier receive more payments over a lifetime,
all else equal, the overall effect of claiming at different ages depends on how long the beneficiary
lives.
Workers with a higher FRA may receive relatively lower benefits for two reasons. First, monthly
benefits will be different for individuals who have identical work histories and the same age of
claiming benefits but different FRAs. For example, someone with an FRA of 66 who claims at
19 Said differently, adjustments for early or late benefit claiming are intended to be actuarially equivalent. Under
average life expectancies, early claimants receive smaller benefits but over a longer period of time, whereas late
claimants receive higher benefits for a shorter period of time. Average life expectancies vary across demographic
groups such as age, race, and sex. For more information, see CRS Report R44846, The Growing Gap in Life
Expectancy by Income: Recent Evidence and Implications for the Social Security Retirement Age.
20 For people born before 1943, the DRC varies from 3.0% to 7.5% depending on the year of birth. See “Delayed
Retirement Credit” in OCACT, “Early or Late Retirement?,” http://www.ssa.gov/OACT/quickcalc/early_late.html#late.
Social Security: Benefit Calculation
Congressional Research Service 8
age 62 will receive a monthly benefit equal to 75% of the PIA. For someone with an FRA of 67,
claiming at 62 will result in a monthly benefit that is 70% of the PIA. Depending on the claiming
age, the scheduled increase in the FRA from 66 to 67 will reduce monthly benefits for workers
with similar earnings by between 6.1% and 7.7%. Second, lifetime benefits will be different for
workers who have identical work histories and identical age of death but different FRAs. For
example, consider two workers who have FRAs of 65 and 67, respectively, both of whom claim
at their FRA and thus receive identical monthly benefits. If both workers die at age 75, the worker
with an FRA of 65 will have received monthly benefits for 10 years, compared with the worker
with an FRA of 67, who will have received monthly benefits for eight years.
Cost-of-Living Adjustments
A COLA is applied to the benefit beginning in the second year of eligibility, which for retired
workers is age 63. The COLA applies even if a worker has not yet begun to receive benefits. The
COLA usually equals the growth in the Consumer Price Index for Urban Wage Earners and
Clerical Workers (CPI-W) from the third quarter of one calendar year to the third quarter of the
next calendar year. The COLA becomes effective in December of the current year and is payable
in January of the following year.21 Beneficiaries will receive a COLA of 5.9% for benefits paid in
January 2022.22
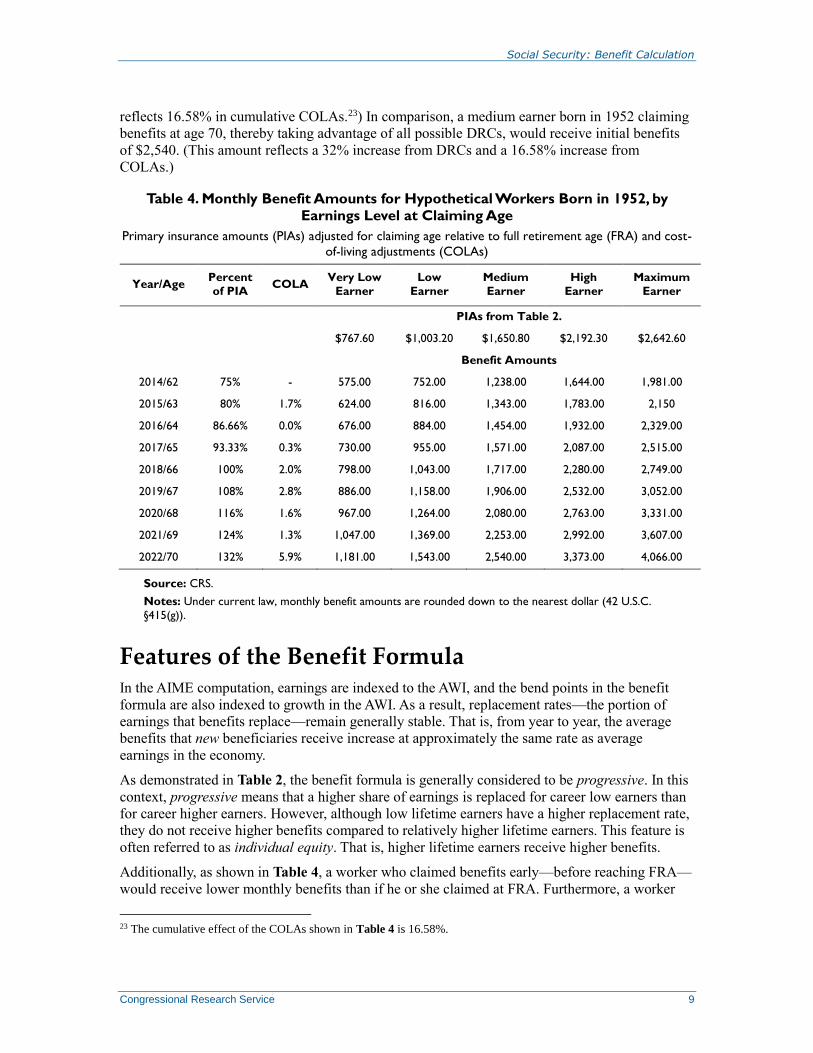
Benefit Amounts for Hypothetical Workers Born in 1952
As discussed, the PIA is not the benefit amount a worker receives. Adjustments to the PIA for
early or late claiming (relative to a worker’s FRA) interact with COLAs to produce the actual
benefit amount. These two factors affect all claimants, while other adjustments may affect only
some claimants (see “Other Adjustments to Benefits”). Table 4 shows how claiming age—and
the associated actuarial reduction or DRC—works with COLAs to produce benefit amounts
before other adjustments. Specifically, Table 4 shows first how the PIA is adjusted for the
claimant’s age. For instance, a worker born in 1952 (FRA of 66) claiming at age 62 (48 months
before FRA) would receive 75% of his or her PIA. This reduction represents five-ninths of 1%
reduction for 36 months and a five-twelfths of 1% reduction for 12 months. Table 4 also shows
how COLAs begin to affect benefit amounts beginning at age 63. For instance, a worker born in
1952 claiming at age 66 (i.e., FRA) would receive 100% of his or her PIA plus COLAs for 2015,
2017, and 2018. (There was no COLA payable for 2016; see Table B-1.) Additionally, since the
COLAs represent a percentage change in benefit amounts that increase the base benefit, benefits
demonstrate cumulative growth with each COLA increase. Lastly, workers claiming benefits after
FRA receive DRCs. For instance, a worker born in 1952 claiming at age 70 would receive 132%
of his or her PIA plus all of the payable COLAs from 2015 through 2022.
Adjustments for early or late claiming and COLAs can have significant effects on a worker’s
benefit amount. For instance, a medium earner born in 1952 claiming benefits at age 62, the
earliest eligibility age, would receive initial benefits of $1,238. Those benefits would increase by
annual COLAs: benefits of $1,238 at age 62 would grow to $1,442 at age 70. (This amount
21 Social Security payments always reflect the benefits due for the preceding month.
22 SSA, 2022 Social Security Changes, https://www.ssa.gov/news/press/factsheets/colafacts2022.pdf. If the CPI-W
does not increase over the relevant period, no COLA is payable. No COLA was payable in January 2010 or January
2011, because the CPI-W for the third quarter of 2009 and for the third quarter of 2010 were both lower than the CPI-
W for the third quarter of 2008. No COLA was payable in January 2016 because the CPI-W for the third quarter of
2015 was lower than the CPI-W for the third quarter of 2014. For details, see CRS Report 94-803, Social Security:
Cost-of-Living Adjustments.
Social Security: Benefit Calculation
Congressional Research Service 9
reflects 16.58% in cumulative COLAs.23) In comparison, a medium earner born in 1952 claiming
benefits at age 70, thereby taking advantage of all possible DRCs, would receive initial benefits
of $2,540. (This amount reflects a 32% increase from DRCs and a 16.58% increase from
COLAs.)
Table 4. Monthly Benefit Amounts for Hypothetical Workers Born in 1952, by
Earnings Level at Claiming Age
Primary insurance amounts (PIAs) adjusted for claiming age relative to full retirement age (FRA) and cost-
of-living adjustments (COLAs)
Year/Age Percent
of PIA COLA
Very Low
Earner
Low
Earner
Medium
Earner
High
Earner
Maximum
Earner
PIAs from Table 2.
$767.60 $1,003.20 $1,650.80 $2,192.30 $2,642.60
Benefit Amounts
2014/62 75% - 575.00 752.00 1,238.00 1,644.00 1,981.00
2015/63 80% 1.7% 624.00 816.00 1,343.00 1,783.00 2,150
2016/64 86.66% 0.0% 676.00 884.00 1,454.00 1,932.00 2,329.00
2017/65 93.33% 0.3% 730.00 955.00 1,571.00 2,087.00 2,515.00
2018/66 100% 2.0% 798.00 1,043.00 1,717.00 2,280.00 2,749.00
2019/67 108% 2.8% 886.00 1,158.00 1,906.00 2,532.00 3,052.00
2020/68 116% 1.6% 967.00 1,264.00 2,080.00 2,763.00 3,331.00
2021/69 124% 1.3% 1,047.00 1,369.00 2,253.00 2,992.00 3,607.00
2022/70 132% 5.9% 1,181.00 1,543.00 2,540.00 3,373.00 4,066.00
Source: CRS.
Notes: Under current law, monthly benefit amounts are rounded down to the nearest dollar (42 U.S.C.
§415(g)).
Features of the Benefit Formula In the AIME computation, earnings are indexed to the AWI, and the bend points in the benefit
formula are also indexed to growth in the AWI. As a result, replacement rates—the portion of
earnings that benefits replace—remain generally stable. That is, from year to year, the average
benefits that new beneficiaries receive increase at approximately the same rate as average
earnings in the economy.
As demonstrated in Table 2, the benefit formula is generally considered to be progressive. In this
context, progressive means that a higher share of earnings is replaced for career low earners than
for career higher earners. However, although low lifetime earners have a higher replacement rate,
they do not receive higher benefits compared to relatively higher lifetime earners. This feature is
often referred to as individual equity. That is, higher lifetime earners receive higher benefits.
Additionally, as shown in Table 4, a worker who claimed benefits early—before reaching FRA—
would receive lower monthly benefits than if he or she claimed at FRA. Furthermore, a worker
23 The cumulative effect of the COLAs shown in Table 4 is 16.58%.
Social Security: Benefit Calculation
Congressional Research Service 10
who claimed benefits late—after reaching FRA—would receive higher monthly benefits than if
he or she claimed at FRA. This feature is known as actuarial equivalence, because the intent is to
provide the same amount of lifetime benefits regardless of when a worker claims benefits.24
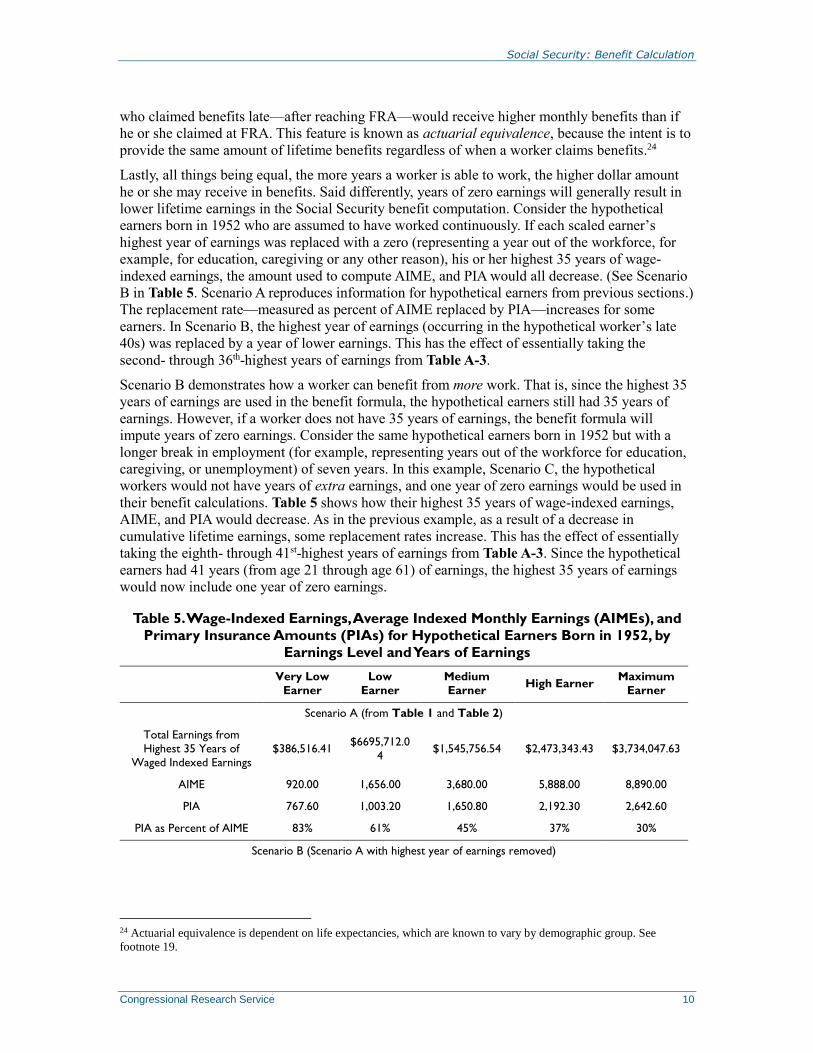
Lastly, all things being equal, the more years a worker is able to work, the higher dollar amount
he or she may receive in benefits. Said differently, years of zero earnings will generally result in
lower lifetime earnings in the Social Security benefit computation. Consider the hypothetical
earners born in 1952 who are assumed to have worked continuously. If each scaled earner’s
highest year of earnings was replaced with a zero (representing a year out of the workforce, for
example, for education, caregiving or any other reason), his or her highest 35 years of wage-
indexed earnings, the amount used to compute AIME, and PIA would all decrease. (See Scenario
B in Table 5. Scenario A reproduces information for hypothetical earners from previous sections.)
The replacement rate—measured as percent of AIME replaced by PIA—increases for some
earners. In Scenario B, the highest year of earnings (occurring in the hypothetical worker’s late
40s) was replaced by a year of lower earnings. This has the effect of essentially taking the
second- through 36th-highest years of earnings from Table A-3.
Scenario B demonstrates how a worker can benefit from more work. That is, since the highest 35
years of earnings are used in the benefit formula, the hypothetical earners still had 35 years of
earnings. However, if a worker does not have 35 years of earnings, the benefit formula will
impute years of zero earnings. Consider the same hypothetical earners born in 1952 but with a
longer break in employment (for example, representing years out of the workforce for education,
caregiving, or unemployment) of seven years. In this example, Scenario C, the hypothetical
workers would not have years of extra earnings, and one year of zero earnings would be used in
their benefit calculations. Table 5 shows how their highest 35 years of wage-indexed earnings,
AIME, and PIA would decrease. As in the previous example, as a result of a decrease in
cumulative lifetime earnings, some replacement rates increase. This has the effect of essentially
taking the eighth- through 41st-highest years of earnings from Table A-3. Since the hypothetical
earners had 41 years (from age 21 through age 61) of earnings, the highest 35 years of earnings
would now include one year of zero earnings.
Table 5. Wage-Indexed Earnings, Average Indexed Monthly Earnings (AIMEs), and
Primary Insurance Amounts (PIAs) for Hypothetical Earners Born in 1952, by
Earnings Level and Years of Earnings
Very Low
Earner
Low
Earner
Medium
Earner High Earner
Maximum
Earner
Scenario A (from Table 1 and Table 2)
Total Earnings from
Highest 35 Years of
Waged Indexed Earnings
$386,516.41 $6695,712.0
4 $1,545,756.54 $2,473,343.43 $3,734,047.63
AIME 920.00 1,656.00 3,680.00 5,888.00 8,890.00
PIA 767.60 1,003.20 1,650.80 2,192.30 2,642.60
PIA as Percent of AIME 83% 61% 45% 37% 30%
Scenario B (Scenario A with highest year of earnings removed)
24 Actuarial equivalence is dependent on life expectancies, which are known to vary by demographic group. See
footnote 19.

Social Security: Benefit Calculation
Congressional Research Service 11
Total Earnings from
Highest 35 Years of
Waged Indexed Earnings
$381,685.35 $687,025.00 $1,526,387.97 $2,442,406.91 $3,692,557.35
AIME 908.00 1,635.00 3,634.00 5,815.00 8,791.00
PIA 763.80 996.40 1,636.10 2,181.40 2,627.80
PIA as Percent of AIME 84% 61% 45% 38% 30%
Percent Reduction in PIA
from Scenario A 0.5% 0.7% 0.9% 0.5% 0.6%
Scenario C (Scenario A with highest seven years of earnings removed)
Total Earnings from
Highest 35 Years of
Waged Indexed Earnings
$333,684.98 $600,597.74 $1,334,164.89 $2,135,036.12 $3,371,699.59
AIME 794.00 1,429.00 3,176.00 5,083.00 8,027.00
PIA 714.60 930.50 1,489.60 2,071.60 2,513.20
PIA as Percent of AIME 90% 65% 47% 41% 31%
Percent Reduction in PIA
from Scenario A 6.9% 7.2% 9.8% 5.5% 4.9%
Source: CRS.
Note: Wage-indexed earnings are rounded to the nearest cent, and AIMEs are rounded down to the nearest
dollar (see 20 C.F.R. §404.211). Under current law, PIA is rounded down to the nearest dime (42 U.S.C.
§415(a)(1)(A)).
Auxiliary Benefits Although the majority of Social Security benefits are paid to retired or disabled workers, many
family members of workers are eligible to receive auxiliary benefits based on the workers’
earnings. In September 2021, 10.1 million family members of retired, disabled, or deceased
workers received Social Security auxiliary benefits (about 15.5% of the beneficiary population).25
Social Security auxiliary benefits are payable to the spouse, divorced spouse, or dependent child
of a retired or disabled worker and to the widow(er), divorced widow(er), dependent child, or
parent of a deceased worker.26 When dependent beneficiaries also earned worker benefits, they
receive the larger of the worker or the auxiliary benefit.27
Benefits payable to family members are equal to a specified percentage of the worker’s PIA,
subject to a maximum family benefit. A spouse’s base benefit (that is, before any adjustments)
equals 50% of the worker’s PIA. A widow(er)’s base benefit is 100% of the worker’s PIA. The
base benefit for children of a retired or disabled worker is 50% of the worker’s PIA, and the base
benefit for children of deceased workers is 75% of the worker’s PIA. Benefits payable to family
25 SSA, “Monthly Statistical Snapshot, September 2021,” Table 2. See the latest edition of the Monthly Statistical
Snapshot at https://www.ssa.gov/policy/docs/quickfacts/stat_snapshot/.
26 The computation of dependent benefits may be quite complex. For additional details and information on other
dependent benefits, see “Benefits for the Worker’s Family Members” in CRS Report R42035, Social Security Primer.
27 Someone with an auxiliary benefit higher than his or her retired-worker benefit is referred to as dually entitled and
receives his or her retired-worker benefit plus a reduced auxiliary benefit amount equal to the full auxiliary benefit
minus the retired-worker benefit, in essence receiving the higher auxiliary benefit amount. For more information on
dual entitlement, see CRS In Focus IF10738, Social Security Dual Entitlement.

Social Security: Benefit Calculation
Congressional Research Service 12
members may be subject to adjustments based on the family member’s age at entitlement, receipt
of a Social Security benefit based on his or her own work record, and other factors.28
Table C-1 provides a summary of Social Security benefits payable to the family members of a
retired, disabled, or deceased worker. It includes the basic eligibility requirements and basic
benefit amounts before any applicable adjustments (such as for the maximum family benefit).
Maximum Family Benefits
The total amount of Social Security benefits payable to a family based on a retired, disabled, or
deceased worker’s record is capped by the maximum family benefit. The family maximum cannot
be exceeded regardless of the number of beneficiaries entitled to benefits on the worker’s
record.29 If the sum of all benefits payable on the worker’s record exceeds the family maximum,
the benefit payable to each dependent or survivor is reduced in equal proportion to bring the total
amount of benefits payable to the family within the limit. In the case of a retired or deceased
worker, the maximum family benefit is determined by a formula and varies from 150% to 188%
of the worker’s PIA. For the family of a worker who attains the age of 62 in 2022 or dies in 2022
before attaining the age of 62, the total amount of benefits payable to the family is limited to
150% of the first $1,308 of the worker’s PIA, plus
272% of the worker’s PIA over $1,308 and through $1,889, plus
134% of the worker’s PIA over $1,889 and through $2,463, plus
175% of the worker’s PIA over $2,463.30
The dollar amounts in the maximum family benefit formula ($1,308/$1,889/$2,463 in 2022) are
indexed to the AWI, as in the regular benefit formula. In the case of a disabled worker, the
maximum family benefit is equal to 85% of the worker’s AIME. However, the family maximum
cannot be less than 100% or more than 150% of the worker’s PIA.31
Other Adjustments to Benefits Other benefit adjustments apply in certain situations, including
the windfall elimination provision, which reduces benefits for worker
beneficiaries who have pensions from employment that was not subject to Social
Security payroll taxes;32
the government pension offset, which reduces Social Security spousal benefits
paid to people who have pensions from employment that was not subject to
Social Security payroll taxes;33 and
28 Similar to a worker’s benefit, auxiliary benefits paid to family members may also be subject to adjustment based on
age. For more information, see CRS Report R41479, Social Security: Revisiting Benefits for Spouses and Survivors.
29 Social Security Act, Title II, §203.
30 SSA, “Formula for Family Maximum Benefit,” https://www.socialsecurity.gov/OACT/COLA/familymax.html.
31 Benefits for a divorced beneficiary are not taken into account for purposes of the family maximum. See SSA,
“Family Benefits Where a Divorced Spouse or a Surviving Divorced Spouse is Entitled,” https://secure.ssa.gov/apps10/
poms.nsf/lnx/0300615682.
32 See CRS Report 98-35, Social Security: The Windfall Elimination Provision (WEP).
33 See CRS Report RL32453, Social Security: The Government Pension Offset (GPO).

Social Security: Benefit Calculation
Congressional Research Service 13
the retirement earnings test, which results in a temporary withholding of monthly
Social Security benefits paid to beneficiaries who are younger than FRA and
have earnings above a certain level.34
34 See CRS Report R41242, Social Security Retirement Earnings Test: How Earnings Affect Benefits.
Social Security: Benefit Calculation
Congressional Research Service 14
Appendix A. Hypothetical Workers, Wages, and
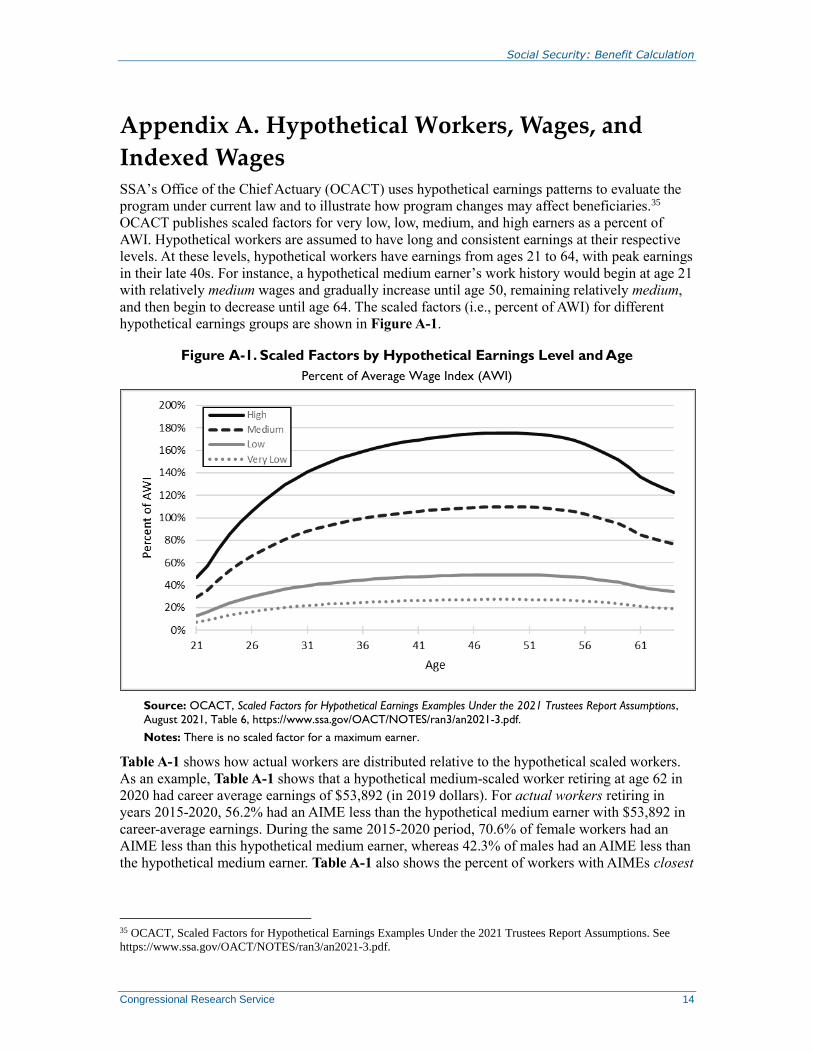
Indexed Wages SSA’s Office of the Chief Actuary (OCACT) uses hypothetical earnings patterns to evaluate the
program under current law and to illustrate how program changes may affect beneficiaries.35
OCACT publishes scaled factors for very low, low, medium, and high earners as a percent of
AWI. Hypothetical workers are assumed to have long and consistent earnings at their respective
levels. At these levels, hypothetical workers have earnings from ages 21 to 64, with peak earnings
in their late 40s. For instance, a hypothetical medium earner’s work history would begin at age 21
with relatively medium wages and gradually increase until age 50, remaining relatively medium,
and then begin to decrease until age 64. The scaled factors (i.e., percent of AWI) for different
hypothetical earnings groups are shown in Figure A-1.
Figure A-1. Scaled Factors by Hypothetical Earnings Level and Age
Percent of Average Wage Index (AWI)
Source: OCACT, Scaled Factors for Hypothetical Earnings Examples Under the 2021 Trustees Report Assumptions,
August 2021, Table 6, https://www.ssa.gov/OACT/NOTES/ran3/an2021-3.pdf.
Notes: There is no scaled factor for a maximum earner.
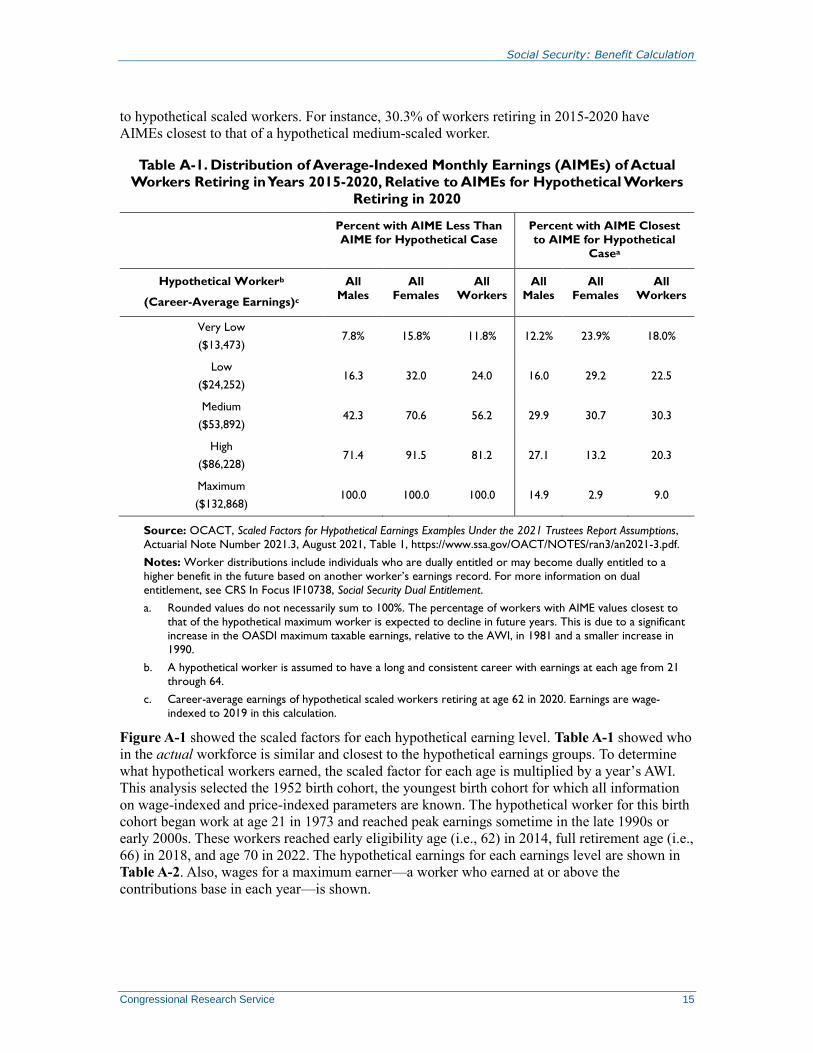
Table A-1 shows how actual workers are distributed relative to the hypothetical scaled workers.
As an example, Table A-1 shows that a hypothetical medium-scaled worker retiring at age 62 in
2020 had career average earnings of $53,892 (in 2019 dollars). For actual workers retiring in
years 2015-2020, 56.2% had an AIME less than the hypothetical medium earner with $53,892 in
career-average earnings. During the same 2015-2020 period, 70.6% of female workers had an
AIME less than this hypothetical medium earner, whereas 42.3% of males had an AIME less than
the hypothetical medium earner. Table A-1 also shows the percent of workers with AIMEs closest
35 OCACT, Scaled Factors for Hypothetical Earnings Examples Under the 2021 Trustees Report Assumptions. See
https://www.ssa.gov/OACT/NOTES/ran3/an2021-3.pdf.
Social Security: Benefit Calculation
Congressional Research Service 15
to hypothetical scaled workers. For instance, 30.3% of workers retiring in 2015-2020 have
AIMEs closest to that of a hypothetical medium-scaled worker.
Table A-1. Distribution of Average-Indexed Monthly Earnings (AIMEs) of Actual
Workers Retiring in Years 2015-2020, Relative to AIMEs for Hypothetical Workers
Retiring in 2020
Percent with AIME Less Than
AIME for Hypothetical Case
Percent with AIME Closest
to AIME for Hypothetical
Casea
Hypothetical Workerb
(Career-Average Earnings)c
All
Males
All
Females
All
Workers
All
Males
All
Females
All
Workers
Very Low
($13,473) 7.8% 15.8% 11.8% 12.2% 23.9% 18.0%
Low
($24,252) 16.3 32.0 24.0 16.0 29.2 22.5
Medium
($53,892) 42.3 70.6 56.2 29.9 30.7 30.3
High
($86,228) 71.4 91.5 81.2 27.1 13.2 20.3
Maximum
($132,868) 100.0 100.0 100.0 14.9 2.9 9.0
Source: OCACT, Scaled Factors for Hypothetical Earnings Examples Under the 2021 Trustees Report Assumptions,
Actuarial Note Number 2021.3, August 2021, Table 1, https://www.ssa.gov/OACT/NOTES/ran3/an2021-3.pdf.
Notes: Worker distributions include individuals who are dually entitled or may become dually entitled to a
higher benefit in the future based on another worker’s earnings record. For more information on dual
entitlement, see CRS In Focus IF10738, Social Security Dual Entitlement.
a. Rounded values do not necessarily sum to 100%. The percentage of workers with AIME values closest to
that of the hypothetical maximum worker is expected to decline in future years. This is due to a significant
increase in the OASDI maximum taxable earnings, relative to the AWI, in 1981 and a smaller increase in
1990.
b. A hypothetical worker is assumed to have a long and consistent career with earnings at each age from 21
through 64.
c. Career-average earnings of hypothetical scaled workers retiring at age 62 in 2020. Earnings are wage-
indexed to 2019 in this calculation.
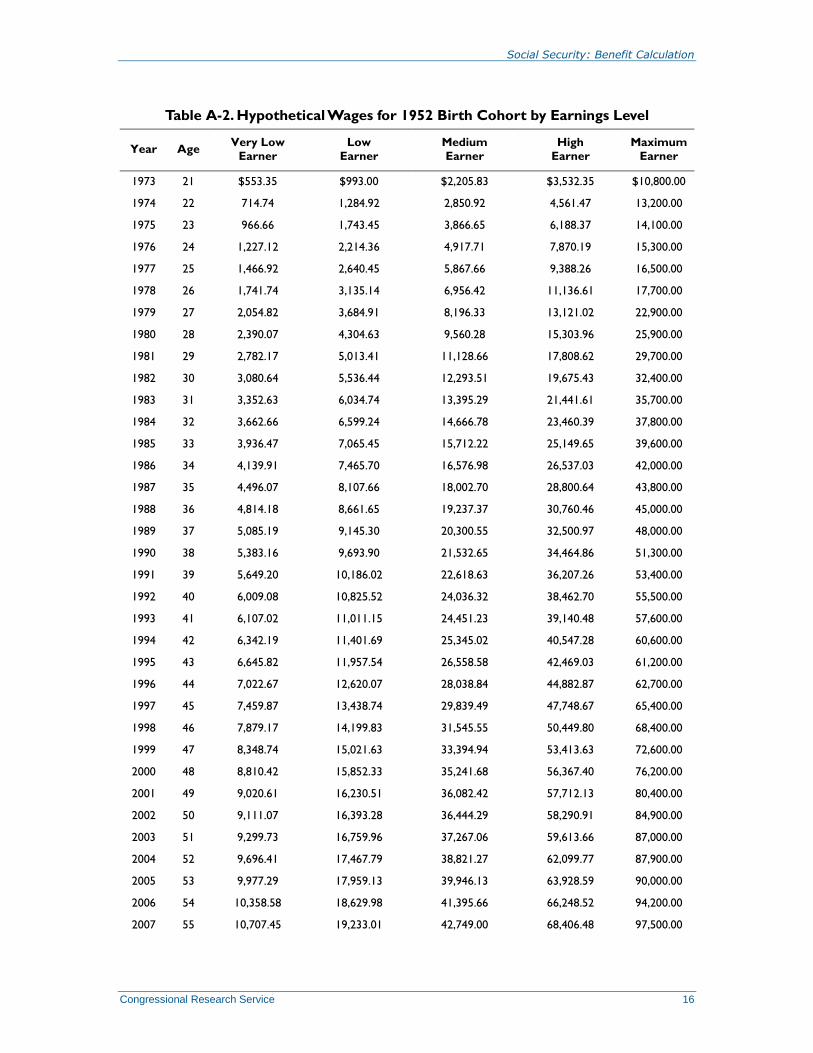
Figure A-1 showed the scaled factors for each hypothetical earning level. Table A-1 showed who
in the actual workforce is similar and closest to the hypothetical earnings groups. To determine
what hypothetical workers earned, the scaled factor for each age is multiplied by a year’s AWI.
This analysis selected the 1952 birth cohort, the youngest birth cohort for which all information
on wage-indexed and price-indexed parameters are known. The hypothetical worker for this birth
cohort began work at age 21 in 1973 and reached peak earnings sometime in the late 1990s or
early 2000s. These workers reached early eligibility age (i.e., 62) in 2014, full retirement age (i.e.,
66) in 2018, and age 70 in 2022. The hypothetical earnings for each earnings level are shown in
Table A-2. Also, wages for a maximum earner—a worker who earned at or above the
contributions base in each year—is shown.
Social Security: Benefit Calculation
Congressional Research Service 16
Table A-2. Hypothetical Wages for 1952 Birth Cohort by Earnings Level
Year Age Very Low
Earner
Low
Earner
Medium
Earner
High
Earner
Maximum
Earner
1973 21 $553.35 $993.00 $2,205.83 $3,532.35 $10,800.00
1974 22 714.74 1,284.92 2,850.92 4,561.47 13,200.00
1975 23 966.66 1,743.45 3,866.65 6,188.37 14,100.00
1976 24 1,227.12 2,214.36 4,917.71 7,870.19 15,300.00
1977 25 1,466.92 2,640.45 5,867.66 9,388.26 16,500.00
1978 26 1,741.74 3,135.14 6,956.42 11,136.61 17,700.00
1979 27 2,054.82 3,684.91 8,196.33 13,121.02 22,900.00
1980 28 2,390.07 4,304.63 9,560.28 15,303.96 25,900.00
1981 29 2,782.17 5,013.41 11,128.66 17,808.62 29,700.00
1982 30 3,080.64 5,536.44 12,293.51 19,675.43 32,400.00
1983 31 3,352.63 6,034.74 13,395.29 21,441.61 35,700.00
1984 32 3,662.66 6,599.24 14,666.78 23,460.39 37,800.00
1985 33 3,936.47 7,065.45 15,712.22 25,149.65 39,600.00
1986 34 4,139.91 7,465.70 16,576.98 26,537.03 42,000.00
1987 35 4,496.07 8,107.66 18,002.70 28,800.64 43,800.00
1988 36 4,814.18 8,661.65 19,237.37 30,760.46 45,000.00
1989 37 5,085.19 9,145.30 20,300.55 32,500.97 48,000.00
1990 38 5,383.16 9,693.90 21,532.65 34,464.86 51,300.00
1991 39 5,649.20 10,186.02 22,618.63 36,207.26 53,400.00
1992 40 6,009.08 10,825.52 24,036.32 38,462.70 55,500.00
1993 41 6,107.02 11,011.15 24,451.23 39,140.48 57,600.00
1994 42 6,342.19 11,401.69 25,345.02 40,547.28 60,600.00
1995 43 6,645.82 11,957.54 26,558.58 42,469.03 61,200.00
1996 44 7,022.67 12,620.07 28,038.84 44,882.87 62,700.00
1997 45 7,459.87 13,438.74 29,839.49 47,748.67 65,400.00
1998 46 7,879.17 14,199.83 31,545.55 50,449.80 68,400.00
1999 47 8,348.74 15,021.63 33,394.94 53,413.63 72,600.00
2000 48 8,810.42 15,852.33 35,241.68 56,367.40 76,200.00
2001 49 9,020.61 16,230.51 36,082.42 57,712.13 80,400.00
2002 50 9,111.07 16,393.28 36,444.29 58,290.91 84,900.00
2003 51 9,299.73 16,759.96 37,267.06 59,613.66 87,000.00
2004 52 9,696.41 17,467.79 38,821.27 62,099.77 87,900.00
2005 53 9,977.29 17,959.13 39,946.13 63,928.59 90,000.00
2006 54 10,358.58 18,629.98 41,395.66 66,248.52 94,200.00
2007 55 10,707.45 19,233.01 42,749.00 68,406.48 97,500.00

Social Security: Benefit Calculation
Congressional Research Service 17
Year Age Very Low
Earner
Low
Earner
Medium
Earner
High
Earner
Maximum
Earner
2008 56 10,705.76 19,262.10 42,781.69 68,450.71 102,000.00
2009 57 10,259.33 18,483.07 41,037.30 65,708.54 106,800.00
2010 58 10,210.09 18,378.16 40,840.35 65,302.89 106,800.00
2011 59 10,186.17 18,309.31 40,701.69 65,114.11 106,800.00
2012 60 10,016.70 18,038.92 40,066.79 64,133.46 110,100.00
2013 61 9,516.29 17,147.28 38,154.94 61,047.90 113,700.00
2014 62 9,528.71 17,151.68 38,161.33 61,030.24 117,000.00
2015 63 9,523.53 17,171.21 38,142.21 60,989.06 118,500.00
2016 64 9,290.65 16,732.90 37,259.89 59,586.63 118,500.00
Source: CRS.
Notes: Very low, low, medium, and high earners are assumed to work at specified ages with earnings equivalent
to the respective scaled earners as shown in OCACT, Scaled Factors for Hypothetical Earnings Examples Under the
2021 Trustees Report Assumptions, August 2021, Table 6, https://www.ssa.gov/OACT/NOTES/ran3/an2021-3.pdf.
All dollar values are shown in nominal terms (i.e., not indexed). Maximum earners are assumed to have earned at
or above the contribution base in each respective year (see Table B-1).
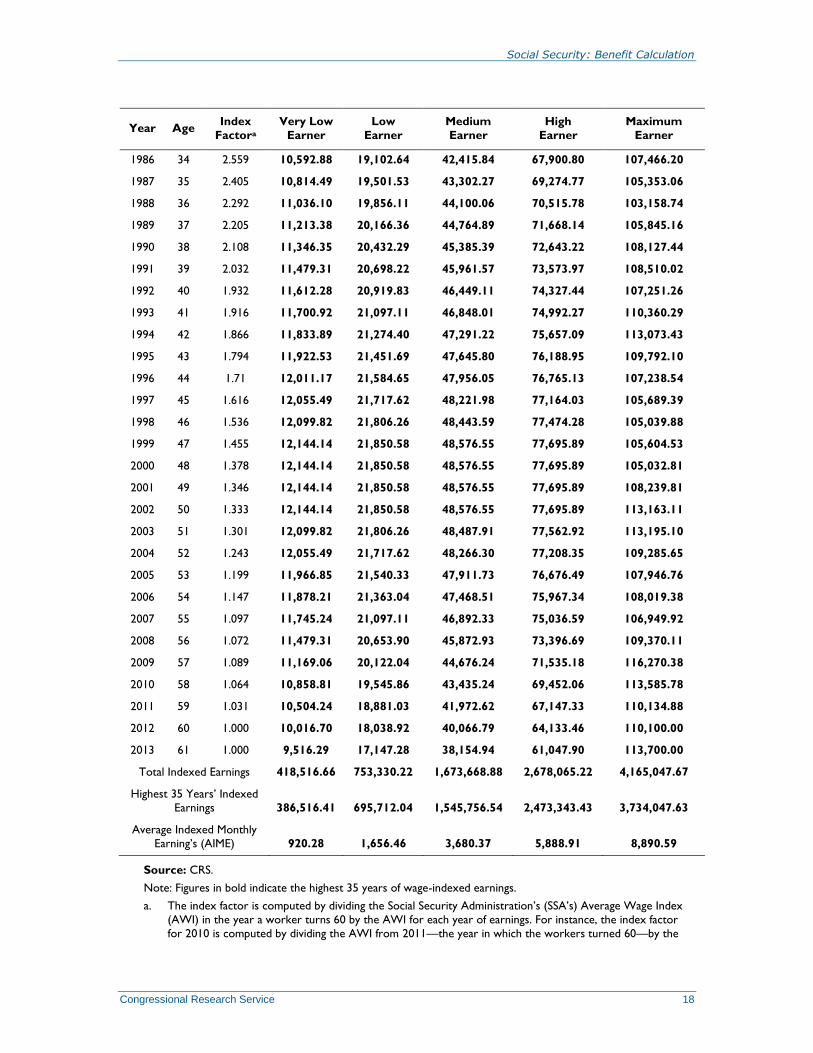
As discussed, the first step in determining benefit amounts is to index a worker’s nominal
earnings to SSA’s AWI (see Table B-1). Earnings up to age 60 are wage-indexed, and earnings
after age 60 are kept in nominal terms. The wage-indexed earnings for scaled hypothetical
workers born in 1952 are shown in Table A-3.
Table A-3. Wage-Indexed Hypothetical Wages for 1952 Birth Cohort by Earnings
Level
Highest 35 Years of Wage-Indexed Earnings Are in Bold
Year Age Index
Factora
Very Low
Earner
Low
Earner
Medium
Earner
High
Earner
Maximum
Earner
1973 21 5.847 3,235.48 5,806.14 12,897.61 20,653.90 63,148.28
1974 22 5.519 3,944.63 7,091.47 15,734.19 25,174.71 72,850.64
1975 23 5.135 4,964.03 8,952.98 19,856.11 31,778.64 72,406.60
1976 24 4.804 5,894.78 10,637.20 23,623.45 37,806.38 73,497.32
1977 25 4.532 6,648.25 11,966.85 26,593.00 42,548.80 74,780.11
1978 26 4.199 7,313.08 13,163.54 29,207.98 46,759.36 74,317.10
1979 27 3.861 7,933.58 14,227.26 31,645.67 50,659.67 88,415.85
1980 28 3.542 8,465.44 15,246.65 33,861.76 54,205.40 91,735.72
1981 29 3.218 8,952.98 16,133.09 35,811.91 57,307.92 95,574.24
1982 30 3.05 9,396.19 16,886.56 37,496.13 60,011.54 98,822.41
1983 31 2.908 9,750.77 17,551.38 38,958.75 62,360.59 103,829.56
1973 21 5.847 3,235.48 5,806.14 12,897.61 20,653.90 63,148.28
1984 32 2.747 10,061.02 18,127.56 40,288.40 64,443.71 103,833.40
1985 33 2.635 10,371.27 18,615.10 41,396.44 66,260.90 104,332.71
Social Security: Benefit Calculation
Congressional Research Service 18
Year Age Index
Factora
Very Low
Earner
Low
Earner
Medium
Earner
High
Earner
Maximum
Earner
1986 34 2.559 10,592.88 19,102.64 42,415.84 67,900.80 107,466.20
1987 35 2.405 10,814.49 19,501.53 43,302.27 69,274.77 105,353.06
1988 36 2.292 11,036.10 19,856.11 44,100.06 70,515.78 103,158.74
1989 37 2.205 11,213.38 20,166.36 44,764.89 71,668.14 105,845.16
1990 38 2.108 11,346.35 20,432.29 45,385.39 72,643.22 108,127.44
1991 39 2.032 11,479.31 20,698.22 45,961.57 73,573.97 108,510.02
1992 40 1.932 11,612.28 20,919.83 46,449.11 74,327.44 107,251.26
1993 41 1.916 11,700.92 21,097.11 46,848.01 74,992.27 110,360.29
1994 42 1.866 11,833.89 21,274.40 47,291.22 75,657.09 113,073.43
1995 43 1.794 11,922.53 21,451.69 47,645.80 76,188.95 109,792.10
1996 44 1.71 12,011.17 21,584.65 47,956.05 76,765.13 107,238.54
1997 45 1.616 12,055.49 21,717.62 48,221.98 77,164.03 105,689.39
1998 46 1.536 12,099.82 21,806.26 48,443.59 77,474.28 105,039.88
1999 47 1.455 12,144.14 21,850.58 48,576.55 77,695.89 105,604.53
2000 48 1.378 12,144.14 21,850.58 48,576.55 77,695.89 105,032.81
2001 49 1.346 12,144.14 21,850.58 48,576.55 77,695.89 108,239.81
2002 50 1.333 12,144.14 21,850.58 48,576.55 77,695.89 113,163.11
2003 51 1.301 12,099.82 21,806.26 48,487.91 77,562.92 113,195.10
2004 52 1.243 12,055.49 21,717.62 48,266.30 77,208.35 109,285.65
2005 53 1.199 11,966.85 21,540.33 47,911.73 76,676.49 107,946.76
2006 54 1.147 11,878.21 21,363.04 47,468.51 75,967.34 108,019.38
2007 55 1.097 11,745.24 21,097.11 46,892.33 75,036.59 106,949.92
2008 56 1.072 11,479.31 20,653.90 45,872.93 73,396.69 109,370.11
2009 57 1.089 11,169.06 20,122.04 44,676.24 71,535.18 116,270.38
2010 58 1.064 10,858.81 19,545.86 43,435.24 69,452.06 113,585.78
2011 59 1.031 10,504.24 18,881.03 41,972.62 67,147.33 110,134.88
2012 60 1.000 10,016.70 18,038.92 40,066.79 64,133.46 110,100.00
2013 61 1.000 9,516.29 17,147.28 38,154.94 61,047.90 113,700.00
Total Indexed Earnings 418,516.66 753,330.22 1,673,668.88 2,678,065.22 4,165,047.67
Highest 35 Years’ Indexed
Earnings 386,516.41 695,712.04 1,545,756.54 2,473,343.43 3,734,047.63
Average Indexed Monthly
Earning’s (AIME) 920.28 1,656.46 3,680.37 5,888.91 8,890.59
Source: CRS.
Note: Figures in bold indicate the highest 35 years of wage-indexed earnings.
a. The index factor is computed by dividing the Social Security Administration’s (SSA’s) Average Wage Index
(AWI) in the year a worker turns 60 by the AWI for each year of earnings. For instance, the index factor
for 2010 is computed by dividing the AWI from 2011—the year in which the workers turned 60—by the

Social Security: Benefit Calculation
Congressional Research Service 19
AWI from year 2010 (i.e., $42,979.61/$41,673.83 or 1.031). Results are displayed to three decimals. See
Table B-1 for AWI values.

Social Security: Benefit Calculation
Congressional Research Service 20
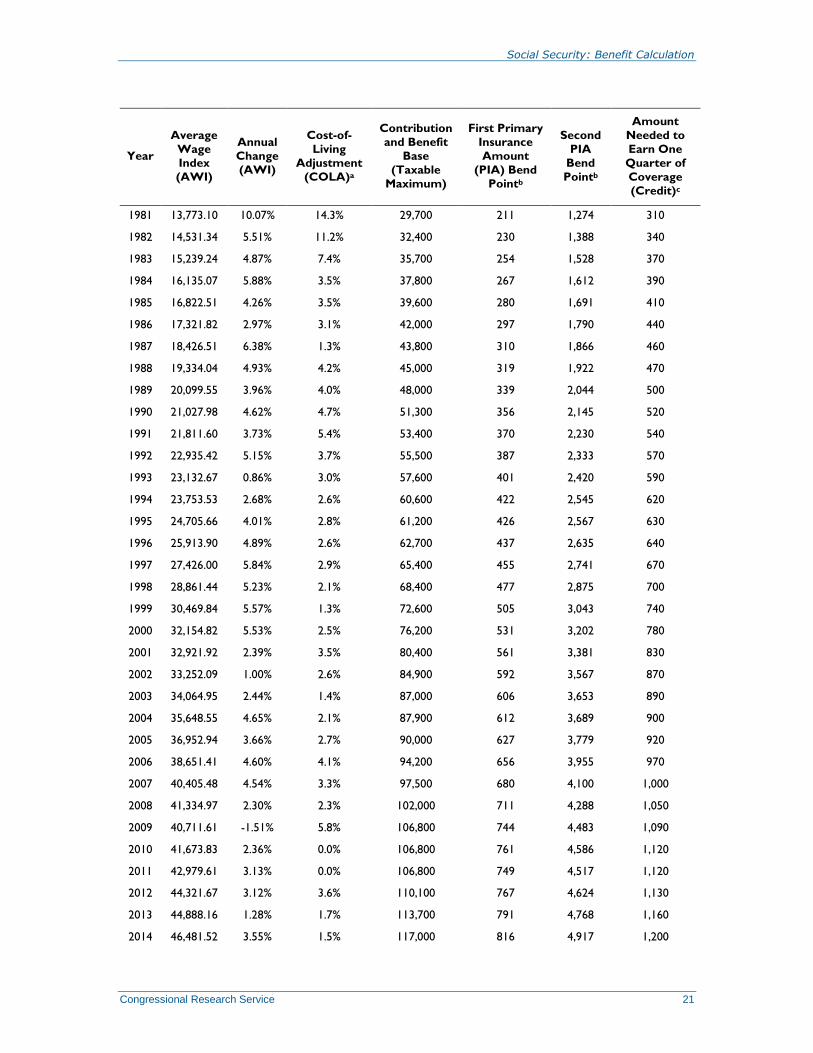
Appendix B. Social Security Program Information
Table B-1. Parameters Used to Calculate Social Security Eligibility and Benefits,
Select Years
Year
Average
Wage
Index
(AWI)
Annual
Change
(AWI)
Cost-of-
Living
Adjustment
(COLA)a
Contribution
and Benefit
Base
(Taxable
Maximum)
First Primary
Insurance
Amount
(PIA) Bend
Pointb
Second
PIA
Bend
Pointb
Amount
Needed to
Earn One
Quarter of
Coverage
(Credit)c
1951 $2,799.16 — — $3,600 — — $50
1952 2,973.32 6.22% — 3,600 — — $50
1953 3,139.44 5.59% — 3,600 — — $50
1954 3,155.64 0.52% — 3,600 — — $50
1955 3,301.44 4.62% — 4,200 — — $50
1956 3,532.36 6.99% — 4,200 — — $50
1957 3,641.72 3.10% — 4,200 — — $50
1958 3,673.80 0.88% — 4,200 — — $50
1959 3,855.80 4.95% — 4,800 — — $50
1960 4,007.12 3.92% — 4,800 — — $50
1961 4,086.76 1.99% — 4,800 — — $50
1962 4,291.40 5.01% — 4,800 — — $50
1963 4,396.64 2.45% — 4,800 — — $50
1964 4,576.32 4.09% — 4,800 — — $50
1965 4,658.72 1.80% — 4,800 — — $50
1966 4,938.36 6.00% — 6,600 — — $50
1967 5,213.44 5.57% — 6,600 — — $50
1968 5,571.76 6.87% — 7,800 — — $50
1969 5,893.76 5.78% — 7,800 — — $50
1970 6,186.24 4.96% — 7,800 — — $50
1971 6,497.08 5.02% — 7,800 — — $50
1972 7,133.80 9.80% — 9,000 — — $50
1973 7,580.16 6.26% — 10,800 — — $50
1974 8,030.76 5.94% — 13,200 — — $50
1975 8,630.92 7.47% — 14,100 — — $50
1976 9,226.48 6.90% 8.0% 15,300 — — $50
1977 9,779.44 5.99% 6.4% 16,500 — — $50
1978b 10,556.03 7.94% 5.9% 17,700 — — 250
1979 11,479.46 8.75% 6.5% 22,900 $180 $1,085 260
1980 12,513.46 9.01% 9.9% 25,900 194 1,171 290
Social Security: Benefit Calculation
Congressional Research Service 21
Year
Average
Wage
Index
(AWI)
Annual
Change
(AWI)
Cost-of-
Living
Adjustment
(COLA)a
Contribution
and Benefit
Base
(Taxable
Maximum)
First Primary
Insurance
Amount
(PIA) Bend
Pointb
Second
PIA
Bend
Pointb
Amount
Needed to
Earn One
Quarter of
Coverage
(Credit)c
1981 13,773.10 10.07% 14.3% 29,700 211 1,274 310
1982 14,531.34 5.51% 11.2% 32,400 230 1,388 340
1983 15,239.24 4.87% 7.4% 35,700 254 1,528 370
1984 16,135.07 5.88% 3.5% 37,800 267 1,612 390
1985 16,822.51 4.26% 3.5% 39,600 280 1,691 410
1986 17,321.82 2.97% 3.1% 42,000 297 1,790 440
1987 18,426.51 6.38% 1.3% 43,800 310 1,866 460
1988 19,334.04 4.93% 4.2% 45,000 319 1,922 470
1989 20,099.55 3.96% 4.0% 48,000 339 2,044 500
1990 21,027.98 4.62% 4.7% 51,300 356 2,145 520
1991 21,811.60 3.73% 5.4% 53,400 370 2,230 540
1992 22,935.42 5.15% 3.7% 55,500 387 2,333 570
1993 23,132.67 0.86% 3.0% 57,600 401 2,420 590
1994 23,753.53 2.68% 2.6% 60,600 422 2,545 620
1995 24,705.66 4.01% 2.8% 61,200 426 2,567 630
1996 25,913.90 4.89% 2.6% 62,700 437 2,635 640
1997 27,426.00 5.84% 2.9% 65,400 455 2,741 670
1998 28,861.44 5.23% 2.1% 68,400 477 2,875 700
1999 30,469.84 5.57% 1.3% 72,600 505 3,043 740
2000 32,154.82 5.53% 2.5% 76,200 531 3,202 780
2001 32,921.92 2.39% 3.5% 80,400 561 3,381 830
2002 33,252.09 1.00% 2.6% 84,900 592 3,567 870
2003 34,064.95 2.44% 1.4% 87,000 606 3,653 890
2004 35,648.55 4.65% 2.1% 87,900 612 3,689 900
2005 36,952.94 3.66% 2.7% 90,000 627 3,779 920
2006 38,651.41 4.60% 4.1% 94,200 656 3,955 970
2007 40,405.48 4.54% 3.3% 97,500 680 4,100 1,000
2008 41,334.97 2.30% 2.3% 102,000 711 4,288 1,050
2009 40,711.61 -1.51% 5.8% 106,800 744 4,483 1,090
2010 41,673.83 2.36% 0.0% 106,800 761 4,586 1,120
2011 42,979.61 3.13% 0.0% 106,800 749 4,517 1,120
2012 44,321.67 3.12% 3.6% 110,100 767 4,624 1,130
2013 44,888.16 1.28% 1.7% 113,700 791 4,768 1,160
2014 46,481.52 3.55% 1.5% 117,000 816 4,917 1,200

Social Security: Benefit Calculation
Congressional Research Service 22
Year
Average
Wage
Index
(AWI)
Annual
Change
(AWI)
Cost-of-
Living
Adjustment
(COLA)a
Contribution
and Benefit
Base
(Taxable
Maximum)
First Primary
Insurance
Amount
(PIA) Bend
Pointb
Second
PIA
Bend
Pointb
Amount
Needed to
Earn One
Quarter of
Coverage
(Credit)c
2015 48,098.63 3.48% 1.7% 118,500 826 4,980 1,220
2016 48,642.15 1.13% 0.0% 118,500 856 5,157 1,260
2017 50,321.89 3.45% 0.3% 127,200 885 5,336 1,300
2018 52,145.80 3.62% 2.0% 128,400 895 5,397 1,320
2019 54,099.99 3.75% 2.8% 132,900 926 5,583 1,360
2020 55,628.60 2.83% 1.6% 137,700 960 5,785 1,410
2021 — — 1.3% 142,800 996 6,002 1,470
2022 5.9% 147,000 1,024 6,172 1,510
Source: CRS.
Notes: Dashes indicate data not available.
a. Automatic COLAs became effective in 1975 as part of P.L. 92-336. Prior to this, each COLA was approved
through legislation. For more information, see CRS Report 94-803, Social Security: Cost-of-Living Adjustments.
b. Prior to 1978, the Social Security benefit amounts were calculated using a process that coupled wage and
price inflation. P.L. 95-216 decoupled price and wage inflation in benefit calculations and instituted the
current-law benefit formula.
c. Prior to 1978, a worker earned a quarter of coverage for each quarter in which he or she earned $50 in
covered employment. P.L. 95-216 stipulated that a quarter of coverage for 1978 would be $250, and that
amount would be indexed annually to the average wage index.
Table B-2. Social Security Benefit Amounts, Full Retirement Age (FRA), and Delayed
Retirement Credits (DRCs) by Birth Year
As a Percentage of Primary Insurance Amount (PIA) at Ages 62-70
Year of
Birth/Age
62
FRA DRC 62 63 64 65 66 67 68 69 70
1924/1986 65 3 80 86 2⁄3 93 1⁄3 100 103 106 109 112 115
1925-
1926/1987-
1988
65 3 1⁄2 80 86 2⁄3 93 1⁄3 100 103 1⁄2 107 107 1⁄2 114 117 1⁄2
1927-
1928/1989-
1990
65 4 80 86 2⁄3 93 1⁄3 100 104 108 112 116 120
1929-
1930/1991-
1992
65 4 1⁄2 80 86 2⁄3 93 1⁄3 100 104 1⁄2 109 113 1⁄2 118 122 1⁄2
1931-
1932/1993-
1994
65 5 80 86 2⁄3 93 1⁄3 100 105 110 115 120 125
1933-
1934/1995-
1996
65 5 1⁄2 80 86 2⁄3 93 1⁄3 100 105 1⁄2 111 116 1⁄2 122 127 1⁄2

Social Security: Benefit Calculation
Congressional Research Service 23
Year of
Birth/Age
62
FRA DRC 62 63 64 65 66 67 68 69 70
1935-
1936/1997-
1998
65 6 80 86 2⁄3 93 1⁄3 100 106 112 118 124 130
1937/1999 65 6 1⁄2 80 86 2⁄3 93 1⁄3 100 106 1⁄2 113 119 1⁄2 126 132 1⁄2
1938/2000 65, 2
mo. 6 1⁄2 79 1⁄6 85 5⁄9 92 2⁄9 98 8⁄9 105 5⁄12
111 11⁄1
2 118 5⁄12
124 11⁄1
2
131 5⁄1
2
1939/2001 65, 4
mo. 7 78 1⁄3 84 4⁄9 91 1⁄9 97 7⁄9 104 2⁄3 111 2⁄3 118 2⁄3 125 2⁄3 132 2⁄3
1940/2002 65, 6
mo. 7 77 1⁄2 83 1⁄3 90 96 2⁄3 103 1⁄2 110 1⁄2 117 1⁄2 124 1⁄2 131 1⁄2
1941/2003 65, 8
mo. 7 1⁄2 76 2⁄3 82 2⁄9 88 8⁄9 95 5⁄9 102 1⁄2 110 117 1⁄2 125 132 1⁄2
1942/2004 65, 10
mo. 7 1⁄2 75 5⁄6 81 1⁄9 87 7⁄9 94 4⁄9 101 1⁄4 108 3⁄4 116 1⁄4 123 3⁄4 131 1⁄4
1943-
1954/2005-
2016
66 8 75 80 86 2⁄3 93 1⁄3 100 108 116 124 132
1955/2017 66, 2
mo. 8 74 1⁄6 79 1⁄6 85 5⁄9 92 2⁄9 98 8⁄9 106 2⁄3 114 2⁄3 122 2⁄3 130 2⁄3
1956/2018 66, 4
mo. 8 73 1⁄3 78 1⁄3 84 4⁄9 91 1⁄9 97 7⁄9 105 1⁄3 113 1⁄3 121 1⁄3 129 1⁄3
1957/2019 66, 6
mo. 8 72 1⁄2 77 1⁄2 83 1⁄3 90 96 2⁄3 104 112 120 128
1958/2020 66, 8
mo. 8 71 2⁄3 76 2⁄3 82 2⁄9 88 8⁄9 95 5⁄9 102 2⁄3 110 2⁄3 118 2⁄3 126 2⁄3
1959/2021 66, 10
mo. 8 70 5⁄6 75 5⁄6 81 1⁄9 87 7⁄9 94 4⁄9 101 1⁄3 109 1⁄3 117 1⁄3 125 1⁄3
1960 and
later/2022
or later
67 8 70 75 80 86 2⁄3 93 1⁄3 100 116 124 124
Source: CRS.
Notes: If benefits are claimed before reaching FRA (i.e., early retirement), the PIA is reduced five-ninths of 1%
for each month before FRA, up to 36 months. If the number of months is greater than 36, then the PIA is further
reduced five-twelfths of 1% for each month. The DRC is two-thirds of 1% per month for persons born in 1943
or later. DRCs cannot be earned after attaining age 70.

Social Security: Benefit Calculation
Congressional Research Service 24
Appendix C. Auxiliary Benefits
Table C-1. Social Security Benefits for the Worker’s Family Members
Basis for
Entitlement Basic Eligibility Requirements
Basic Benefit Amount
Before Any Applicable
Adjustments
Spouse At least age 62, or
Any age if caring for the child of a retired or
disabled worker. The child must be under the age
of 16 or disabled, and the child must be entitled to
benefits.
50% of worker’s PIA
Divorced Spouse
(The divorced individual
must have been
married to the worker
for at least 10 years
before the divorce
became final.)
At least age 62.
Must be unmarried.
Note: A divorced spouse who is under the age of
62 is not eligible for spousal benefits even if he or
she is caring for the child of a retired or disabled
worker.
50% of worker’s PIA
Aged Widow(er)
and
Divorced Aged
Widow(er)
(The divorced individual
must have been
married to the worker
for at least 10 years
before the divorce
became final.)
At least age 60.
Must be unmarried (unless the marriage occurred
after attainment of age 60).
100% of worker’s PIAa
Disabled Widow(er)
and
Divorced Disabled
Widow(er)
(The divorced individual must have been
married to the worker
for at least 10 years
before the divorce
became final.)
At least age 50 (ages 50-59).
Must be unmarried (unless the marriage occurred
after attainment of age 50).
The qualifying disability must have occurred:
(1) before or within seven years of the worker’s
death;
(2) within seven years of having been previously
entitled to benefits on the worker’s record as a
widow(er) with a child in his or her care; or
(3) within seven years of having been previously
entitled to benefits as a disabled widow(er) that
ended because the qualifying disability ended
(whichever is later).
71.5% of worker’s PIAa
Disabled widow(er)s and
divorced disabled
widow(er)s ages 50-59
receive the same rate of reduction set for
widow(er)s at age 60
(28.5% of the worker’s
PIA) regardless of their age
at the time of entitlement

Social Security: Benefit Calculation
Congressional Research Service 25
Basis for
Entitlement Basic Eligibility Requirements
Basic Benefit Amount
Before Any Applicable
Adjustments
Widowed Mother or
Father
(Young Widow(er)
with Child)
Surviving spouse of any age who is caring for the
deceased worker’s child. The child must be under
the age of 16 or disabled, and the child must be
entitled to benefits.
Must be unmarried.
Must not be entitled to widow(er)’s benefits.
Note: In the case of a surviving divorced parent, the
child must be his or her natural or legally adopted
child. The 10-year marriage requirement that
applies to divorced spouses under other
circumstances does not apply.
75% of deceased worker’s
PIA
Child A dependent, unmarried child of a retired, disabled,
or deceased worker.
The child must be:
(1) under the age of 18,
(2) a full-time elementary or secondary student
under the age of 19, or
(3) a disabled person aged 18 or older whose
disability began before age 22.
The term child refers to a biological child, adopted
child, stepchild, or, in some cases, grandchild of the
worker.
50% of worker’s PIA for
child of a retired or
disabled worker
75% of deceased worker’s
PIA for child of a deceased
worker
Dependent Parent
of a Deceased
Worker
At least age 62.
Must not have married since the worker’s death.
Must have been receiving at least one-half of his or
her support from the worker at the time of the
worker’s death (or, if the worker had a period of
disability that continued until death, at the beginning
of the period of disability).
82.5% of deceased
worker’s PIA if one parent
is entitled to benefits
75% of deceased worker’s
PIA (for each parent) if two
parents are entitled to
benefits
Source: CRS. For more information on auxiliary benefits, see CRS Report R41479, Social Security: Revisiting
Benefits for Spouses and Survivors.
Notes: The family relationship requirement for entitlement to benefits based on the worker’s record may be
met in alternative ways. For example, the relationship requirement can be met if, under state law as interpreted
by the courts of the state, the applicant would be able to inherit a share of the worker’s personal property if the
worker were to die without leaving a will. The table shows the minimum eligibility age for each type of benefit
(i.e., the age at which benefits are first payable on a reduced basis). The maximum family benefit may apply,
reducing the benefit payable to each family member (excluding the worker) on a proportional basis. In the case
of a retired or deceased worker, the maximum family benefit varies from 150% to 188% of the worker’s PIA. In
the case of a disabled worker, the maximum family benefit is equal to the lesser of 85% of the worker’s AIME or
150% of the worker’s PIA but no less than 100% of the worker’s PIA. Other benefit adjustments may apply.
a. A worker’s claiming age affects the widow(er) benefit. If a worker was receiving a reduced benefit due to
claiming benefits before the full retirement age, the widow(er) benefit cannot exceed the worker’s reduced
benefit amount. Alternatively, if a worker was entitled (or would have been entitled) to a higher benefit due
to claiming benefits after the full retirement age, the worker’s PIA—adjusted to take into account the
delayed retirement credit—is used to compute the widow(er) benefit, thereby increasing the benefit.
Social Security: Benefit Calculation
Congressional Research Service R46658 · VERSION 3 · UPDATED 26
Author Information
Barry F. Huston
Analyst in Social Policy
Disclaimer
This document was prepared by the Congressional Research Service (CRS). CRS serves as nonpartisan
shared staff to congressional committees and Members of Congress. It operates solely at the behest of and
under the direction of Congress. Information in a CRS Report should not be relied upon for purposes other
than public understanding of information that has been provided by CRS to Members of Congress in
connection with CRS’s institutional role. CRS Reports, as a work of the United States Government, are not
subject to copyright protection in the United States. Any CRS Report may be reproduced and distributed in
its entirety without permission from CRS. However, as a CRS Report may include copyrighted images or
material from a third party, you may need to obtain the permission of the copyright holder if you wish to
copy or otherwise use copyrighted material.