social security€¦ · · 2016-09-09social security administration baltimore, md 21235-0001 ......
TRANSCRIPT
SOCIAL SECURITY ADMINISTRATION BALTIMORE, MD 21235-0001
SOCIAL SECURITY
Office of the Chief Actuary
September 9, 2016
The Honorable Linda Sánchez
United States House of Representatives
Washington, D.C. 20515
Dear Representative Sánchez:
I am writing in response to your request for estimates of the financial effects on Social Security
of H.R. 5952, the Strengthening Social Security Act of 2016, which you introduced yesterday.
The estimates provided here reflect the intermediate assumptions of the 2016 Trustees Report.
This Bill (hereafter referred to as the proposal) includes five provisions with direct effects on the
Social Security Trust Funds. We have enjoyed working closely with Meghan McConnell of your
staff in developing this proposal to meet your goals. The estimates and analysis provided here
reflect the combined effort of many in the Office of the Chief Actuary, but most particularly
Karen Glenn, Christopher Chaplain, Daniel Nickerson, Kyle Burkhalter, Michael Clingman,
Anna Kirjusina, Katie Sutton, and Tiffany Bosley.
The enclosed tables provide estimates of the effects of the five provisions on the cost, income,
and combined trust fund reserves for the Old Age, Survivors, and Disability Insurance (OASDI)
program, as well as estimated effects on retired worker benefit levels for selected hypothetical
workers. In addition, tables 1b and 1b.n provide estimates of the federal budget implications of
the five provisions. Assuming enactment of the proposal, we estimate the funding for the
combined OASI and DI Trust Funds would be sufficient to extend the projected year of reserve
depletion from 2034 to 2048, under the intermediate assumptions of the 2016 Trustees Report.
Because the OASI and DI Trust Funds are separate legal entities, estimates for the combined
trust funds are consistent with an intent to reallocate the total payroll tax rate as needed to
equalize the years of reserve depletion and the actuarial status of the two separate trust funds.
The proposal includes five basic provisions with direct effects on the OASDI program. The
following list identifies each provision with the corresponding section number in the Bill:
Sections 2-3. Eliminate the OASDI taxable maximum amount starting in 2017. Apply total
payroll tax on all earnings above the current-law taxable maximum of 2.48 percent for 2017,
4.96 for 2018, …, reaching 12.4 percent for 2021 and later. Credit the additional earnings
taxed for benefit purposes using a secondary, separate PIA calculation.
Section 3. Increase the 90 percent PIA formula factor to 91 percent for beneficiaries newly
eligible in 2021, 92 percent for those newly eligible in 2022, …, reaching 95 percent for
those newly eligible in 2025 and later.

Page 2 – The Honorable Linda Sánchez
Section 3. Increase the first PIA bend point above the level it would be in current law by 1
percent for beneficiaries newly eligible in 2021, 2 percent for those newly eligible in 2022,
…, reaching 15 percent higher for those newly eligible in 2035 and later.
Section 5. Starting with the December 2016 COLA, use the Consumer Price Index for the
Elderly (CPI-E). We estimate this new computation will increase the annual COLA by about
0.2 percentage point, on average.
Section 6. Establish an alternative benefit for a surviving spouse. For surviving spouses on
the rolls at the beginning of 2017 and those becoming eligible after 2017, the alternative
benefit would equal 75 percent of the sum of the survivor’s own worker benefit and the
deceased worker’s PIA, including any actuarial reductions or delayed retirement credits
(DRCs). This alternative benefit would be limited to the PIA of a hypothetical worker who
earns the average wage each year.
The balance of this letter provides a summary of the effects of the five provisions on the actuarial
status of the OASDI program, our understanding of the specifications and intent of each of the
five provisions, and descriptions of our detailed financial estimates for trust fund operations,
benefit levels, and implications for the federal budget. See the “Specification for Provisions of
the Proposal” section of this letter for a detailed description of these five provisions.
Summary of Effects of the Proposal on OASDI Actuarial Status
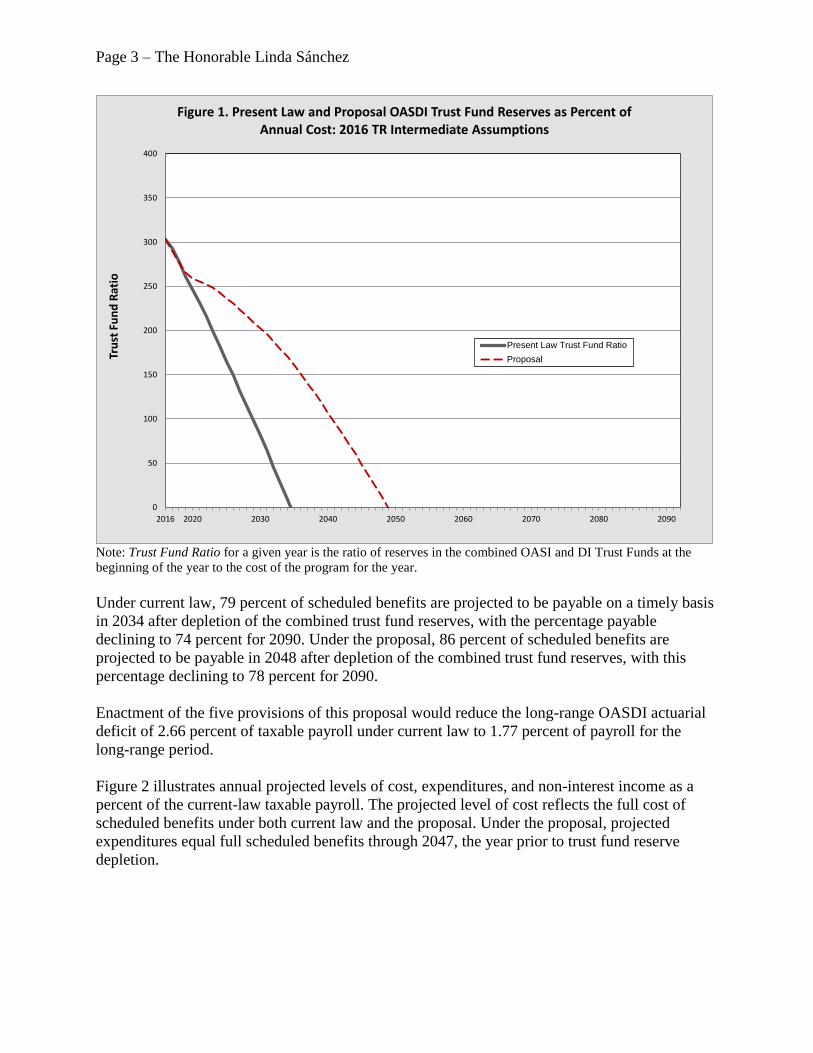
Figure 1 illustrates the estimated trust fund ratio under present law and assuming enactment of
the proposal. The trust fund ratio is defined as the combined Old-Age and Survivors Insurance
(OASI) and Disability Insurance (DI) Trust Fund reserves expressed as a percent of annual
program cost. Assuming enactment of the proposal, we estimate the year of depletion of the
combined OASI and DI Trust Fund reserves would be extended from 2034 under current law to
2048 under the intermediate assumptions of the 2016 Trustees Report.
Page 3 – The Honorable Linda Sánchez
Note: Trust Fund Ratio for a given year is the ratio of reserves in the combined OASI and DI Trust Funds at the
beginning of the year to the cost of the program for the year.
Under current law, 79 percent of scheduled benefits are projected to be payable on a timely basis
in 2034 after depletion of the combined trust fund reserves, with the percentage payable
declining to 74 percent for 2090. Under the proposal, 86 percent of scheduled benefits are
projected to be payable in 2048 after depletion of the combined trust fund reserves, with this
percentage declining to 78 percent for 2090.
Enactment of the five provisions of this proposal would reduce the long-range OASDI actuarial
deficit of 2.66 percent of taxable payroll under current law to 1.77 percent of payroll for the
long-range period.
Figure 2 illustrates annual projected levels of cost, expenditures, and non-interest income as a
percent of the current-law taxable payroll. The projected level of cost reflects the full cost of
scheduled benefits under both current law and the proposal. Under the proposal, projected
expenditures equal full scheduled benefits through 2047, the year prior to trust fund reserve
depletion.
0
50
100
150
200
250
300
350
400
2016 2020 2030 2040 2050 2060 2070 2080 2090
Tru
st F
un
d R
atio
Figure 1. Present Law and Proposal OASDI Trust Fund Reserves as Percent of Annual Cost: 2016 TR Intermediate Assumptions
Present Law Trust Fund Ratio
Proposal

Page 4 – The Honorable Linda Sánchez
OASDI program annual cost under the proposal becomes progressively higher than under current
law, starting in 2017. This difference increases rapidly early in the projection period, and then
increases gradually, reaching about 2.3 percent of current-law payroll for 2090. Beginning in
2017, non-interest income under the proposal is projected to be higher than under current law,
with the difference growing rapidly from 0.5 percent of current-law payroll for 2017 to 2.4
percent of current-law payroll for 2021, and then generally increasing gradually to 2.5 percent of
current-law payroll for 2090. The proposal improves the annual balance (non-interest income
minus program cost) starting in 2017. The improvement in the annual balance increases to 2.1
percent of payroll for 2021, then declines slowly to 0.3 percent of payroll for 2090. The annual
deficit improves from 1.1 percent of payroll for 2016 to 0.1 percent of payroll for 2018, and then
the annual balance turns positive from 2019 through 2024. The annual balance becomes negative
again in 2025, and then this deficit generally increases through the end of the long-range period,
ultimately reaching 4.1 percent of payroll for 2090. Under current law, the projected annual
deficit for 2090 is 4.3 percent of payroll.
It is also useful to consider the projected cost, expenditures, and income for the OASDI program
expressed as a percentage of Gross Domestic Product (GDP). Figure 3 illustrates these levels
under both current law and the proposal.
11
12
13
14
15
16
17
18
19
20
21
2016 2020 2030 2040 2050 2060 2070 2080 2090
Pe
rce
nt
of
Pre
sen
t-La
w T
axab
le P
ayro
llFigure 2. Proposal and Present Law Cost, Expenditures, and Non-Interest Income
as Percent of Taxable Payroll: 2016 TR Intermediate Assumptions
Present Law Cost
Present Law Non-Interest Income
Present Law Expenditures
Proposal Cost
Proposal Non-Interest Income
Proposal Expenditures

Page 5 – The Honorable Linda Sánchez
Specification for Provisions of the Proposal
Sections 2-3. Eliminate the OASDI taxable maximum amount starting in 2017.
This provision would apply total payroll tax on all earnings above the current-law taxable
maximum of 2.48 percent for 2017, 4.96 for 2018, …, reaching 12.4 percent for 2021 and later.
Additional earnings taxed would be credited for benefit purposes by: (a) calculating a second
average indexed monthly earnings (“AIME+”) reflecting only earnings taxed above the current-
law taxable maximum, (b) applying a 5 percent factor on this newly computed “AIME+” to
develop a second component of the PIA, and (c) adding this second component to the current-
law PIA.
We estimate that enactment of this provision alone would reduce the long-range OASDI
actuarial deficit by 2.13 percent of taxable payroll and would reduce the annual deficit for the
75th
projection year (2090) by 2.15 percent of payroll.
Section 3. Increase the 90 percent PIA formula factor to 91 percent for beneficiaries newly
eligible in 2021, 92 percent for those newly eligible in 2022, …, reaching 95 percent for
those newly eligible in 2025 and later.
4.0
4.5
5.0
5.5
6.0
6.5
7.0
2016 2020 2030 2040 2050 2060 2070 2080 2090
Pe
rce
nt
of
GD
PFigure 3. Proposal and Present Law Cost, Expenditures, and Non-Interest Income
as Percent of GDP: 2016 TR Intermediate Assumptions
Present Law Cost
Present Law Non-Interest Income
Present Law Expenditures
Proposal Cost
Proposal Non-Interest Income
Proposal Expenditures

Page 6 – The Honorable Linda Sánchez
We estimate that enactment of this provision alone would increase the long-range OASDI
actuarial deficit by 0.28 percent of taxable payroll and would increase the annual deficit for the
75th
projection year (2090) by 0.44 percent of payroll.
Section 3. Increase the first PIA bend point above the level it would be in current law by 1
percent for beneficiaries newly eligible in 2021, 2 percent for those newly eligible in 2022,
…, reaching 15 percent higher for those newly eligible in 2035 and later.
We estimate that enactment of this provision alone would increase the long-range OASDI
actuarial deficit by 0.39 percent of taxable payroll and would increase the annual deficit for the
75th
projection year (2090) by 0.71 percent of payroll.
Section 5. Starting with the December 2016 COLA, use the Consumer Price Index for the
Elderly (CPI-E).
Under current law, the annual cost-of-living adjustment (COLA) applied to Social Security
benefits is calculated using the Consumer Price Index for Urban Wage Earners and Clerical
Workers (CPI-W). We assume this change to the CPI-E would increase the COLA by an average
of 0.2 percentage point per year. This provision would apply to all OASDI benefits.
We estimate that enactment of this provision alone would increase the long-range OASDI
actuarial deficit by 0.39 percent of taxable payroll and would increase the annual deficit for the
75th
projection year (2090) by 0.52 percent of payroll.
Section 6. Establish an alternative benefit for a surviving spouse.
For surviving spouses on the rolls at the beginning of 2017 and those becoming eligible after
2017, the alternative benefit would equal 75 percent of the sum of the survivor’s own worker
benefit and the deceased worker’s PIA, including any actuarial reductions or delayed retirement
credits (DRCs). If the deceased worker dies before becoming entitled, the age 62 actuarial
reduction would be used if the worker dies before age 62, or the applicable actuarial reduction or
DRC for entitlement at the age of death if the worker dies after age 62. The alternative benefit
would be limited to the PIA of a hypothetical earner who earns the SSA average wage index
(AWI) every year, and who becomes eligible for retired-worker benefits in the same year in
which the deceased worker became eligible for worker benefits or died (if before age 62). The
alternative benefit would be paid only if it is more than the current-law benefit.
We estimate that enactment of this provision alone would increase the long-range OASDI
actuarial deficit by 0.12 percent of taxable payroll and would increase the annual deficit for the
75th
projection year (2090) by 0.12 percent of payroll.
Page 7 – The Honorable Linda Sánchez
Detailed Financial Results for the Provisions of the Proposal
Summary Results by Provision
Table A provides estimates of the effects on the OASDI long-range actuarial balance for each of
the five provisions of the proposal separately and on a combined basis. The table also includes
estimates of the effect of each provision on the annual balance (the difference between income
rate and the cost rate, expressed as a percent of current-law taxable payroll) for the 75th
projection year, 2090. Interaction among individual provisions is reflected only in the total
estimates for the combined provisions.
Benefit Illustrations
Tables B1 and B2 provide illustrative examples of the projected change in benefit levels under
the five provisions that affect benefit levels for beneficiaries retiring at age 65 in future years at
five selected earnings levels, with selected numbers of years of work. The “Maximum-AIME
Steady Earner” is assumed to have earnings at ages 22 through 64 that equal the current-law
taxable maximum level (equivalent to $118,500 for 2016). As a result, the provision to increase
the taxable maximum does not affect the benefit levels illustrated in these tables. Table B3
provides additional important information on characteristics of retired workers represented by
these illustrations.
Table B1 compares the initial scheduled benefit levels, assuming retirement at age 65 under the
provisions of the proposal, to both scheduled and payable current-law benefit levels. Benefit
amounts scheduled under the proposal are higher than those scheduled in current law, because
the three provisions included in the table increase benefits for all workers. The final two columns
of this table show the level of scheduled benefits under the proposal as a percentage of current-
law scheduled and current-law payable benefits, respectively.
Table B2 compares the change in scheduled benefit levels at ages 65, 75, 85, and 95 under the
proposal to scheduled benefits under current law, assuming retirement at age 65. Table B2 shows
that projected scheduled benefits under the provisions of the proposal increase in relation to
current-law scheduled benefits between ages 65 and 85, because of the change in computing the
COLA.
The hypothetical workers represented in these tables reflect average career-earnings patterns of
workers who started receiving retirement benefits under the Social Security program in recent
years. The tables subdivide workers with very low and low career-average earnings levels by
their numbers of years of non-zero earnings.
Table B3 provides information helpful in interpreting the benefit illustrations in tables B1 and
B2. Percentages in Table B3 are based on tabulations from a 10-percent sample of newly-entitled
retired workers in 2007. Table B3 displays the percentages of these newly-entitled retired
workers in 2007 that are closest to each of the illustrative examples and are:

Page 8 – The Honorable Linda Sánchez
1) “Dually Entitled”, meaning they received a higher spouse or widow(er) benefit based on
the career earnings of their husband or wife,
2) “WEP” (Windfall Elimination Provision), meaning that they received a reduced benefit
due to having a pension based on earnings that were not covered under the OASDI
program (primarily certain government workers), and they had less than 30 years of
substantial earnings that were taxable under the OASDI program,
3) “Foreign Born”, meaning that they entered the Social Security coverage area after birth
(and generally after entering working ages), and
4) “All Others”, meaning they had none of the three characteristics listed above.
The extent to which retired-worker beneficiaries represented by each of the illustrative examples
have any of the characteristics listed above (dually entitled, WEP, foreign born) is important
because such individuals are less dependent on the OASDI benefit that relates to their own
career-average earnings level.
Detailed Tables Containing Annual and Summary Projections
Enclosed with this letter are tables 1, 1a, 1b, 1b.n, 1c, and 1d, which provide annual and
summary projections for the proposal.
Trust Fund Operations
Table 1 provides projections of the financial operations of the OASDI program under the
proposal and shows that the year of reserve depletion for the combined OASDI Trust Funds
would be extended by 14 years, from 2034 under current law to 2048. The table shows the
annual cost and income rates, annual balances, and trust fund ratios (reserves as percent of
annual program cost) for OASDI, as well as the change from current law in these cost rates,
income rates, and annual balances. Included at the bottom of this table are summarized rates for
the 75-year (long-range) period.
The actuarial balance for the OASDI program over the 75-year projection period is improved by
0.89 percent of taxable payroll, from an actuarial deficit of 2.66 percent of payroll under current
law to an actuarial deficit of 1.77 percent of taxable payroll under the proposal.
Program Transfers and Trust Fund Reserves
Column 4 of Table 1a provides a projection of the level of reserves for the theoretical combined
OASI and DI Trust Funds, assuming enactment of the five Social Security provisions of the
proposal. These trust fund reserve amounts are expressed in present value dollars discounted to
January 1, 2016. The table indicates that the provisions include no new specified transfers of
general revenue to the trust funds. For purpose of comparison, the OASDI Trust Fund reserves,
expressed in present value dollars, are also shown for the current-law Social Security program
both without and with the added proposal general fund transfers (zero in this case) in columns 6
and 7.
Page 9 – The Honorable Linda Sánchez
Note that negative values in columns 4, 6, and 7 represent the “unfunded obligation” for the
program through the year. The unfunded obligation is the present value of the shortfall of
revenue needed to pay full scheduled benefits on a timely basis from the date of trust fund
reserve depletion through the end of the indicated year. Gross Domestic Product (GDP),
expressed in present value dollars, is shown in column 5 for comparison with other values in the
table.
Effect of the Social Security Provisions on the Federal Budget
Table 1b shows the projected effect, in present value discounted dollars, on the federal budget
(unified-budget and on-budget) annual cash flows and balances, assuming enactment of the five
Social Security provisions of the proposal. Table 1b.n provides the estimated nominal dollar
effect of enactment of the proposal on annual budget balances for years 2016 through 2026. All
values in these tables represent the amount of change from the level projected under current law.
In addition, changes reflect the budget scoring convention that presumes benefits, not payable
under the law after depletion of trust fund reserves, would still be paid using revenue provided
from the General Fund of the Treasury. The reader should be cautioned that this presumption of
payment of benefits beyond the resources of the trust funds is prohibited under current law and is
also inconsistent with all past experience under the Social Security program.
Column 1 of Table 1b shows the added proposal general fund transfers (zero for this proposal).
Column 2 shows the net changes in OASDI cash flow from all provisions of the proposal.
We expect the net effect of the proposal on unified budget cash flow (column 3) to be positive in
years 2017 and later, with increased revenue from eliminating the taxable maximum more than
offsetting benefit increases.
Column 4 of Table 1b indicates that the effect of implementing the proposal is a reduction of the
federal debt held by the public, reaching about $4.1 trillion in present value at the end of the 75-
year projection period. Column 5 provides the projected effect of the proposal on the annual
unified budget balances, including both the cash flow effect in column 3 and the additional
interest on the accumulated debt in column 4. Columns 6 and 7 indicate that the provisions of
this proposal would have no expected direct effects on the on-budget cash flow, or on the total
federal debt, in the future.
It is important to note that we base these estimates on the intermediate assumptions of the 2016
Trustees Report, so these estimates are not consistent with estimates made by the Office of
Management and Budget or the Congressional Budget Office based on their assumptions. In
particular, all present values are discounted using trust fund yield assumptions under the
intermediate assumptions of the 2016 Trustees Report.
Annual Trust Fund Operations as a Percent of GDP
Table 1c provides annual cost, annual expenditures (amount that would be payable), and annual
tax income for the OASDI program expressed as a percentage of GDP for both current law and
assuming enactment of the five Social Security provisions of the proposal. Showing the annual

Page 10 – The Honorable Linda Sánchez
trust fund cash flows as a percent of GDP provides an additional perspective on these trust fund
operations in relation to the total value of goods and services produced in the United States. The
relationship between income and cost is similar when expressed as a percent of GDP to that
when expressed as a percent of taxable payroll (Table 1).
Effects on Trust Fund Reserves and Unfunded Obligations
Table 1d provides estimates of the changes in trust fund reserves and unfunded obligations on an
annual basis. Values in this table are expressed in present value dollars discounted to January 1,
2016.
For the 75-year (long-range) period as a whole, the current-law unfunded obligation of $11.4
trillion would be reduced to $7.2 trillion in present value assuming enactment of the proposal.
This change of $4.1 trillion results from:
A $10.6 trillion net increase in revenue (column 2), primarily from additional payroll
tax revenue, minus
A $6.4 trillion net increase in cost (column 3), primarily from establishing an
alternative benefit for surviving spouses, calculating the COLA using the CPI-E rather
than the CPI-W, and increasing future benefits through changes in the PIA formula.
We hope these estimates are helpful. Please let me know if we may provide further assistance.
Sincerely,
Stephen C. Goss, ASA, MAAA
Chief Actuary
Enclosures

Table A—Estimated Long-Range OASDI Financial Effects of H.R. 5952,
the “Strengthening Social Security Act of 2016,”
Introduced by Representative Linda Sánchez
Provision
Estimated Change in
Long-Range OASDI
Actuarial Balance 1
(as a percent of payroll)
Estimated Change
in Annual Balance
for 75th
year 2
(as a percent of payroll)
Sections 2-3) Eliminate the taxable maximum amount starting
in 2017. Apply total payroll tax on all earnings above the
current-law taxable maximum of 2.48 percent for 2017, 4.96
percent for 2018, ..., reaching 12.4 percent for 2021 and later.
Credit the additional earnings taxed for benefit purposes by: (a) calculating a second average indexed monthly earnings
("AIME+") reflecting only earnings taxed above the current-
law taxable maximum, (b) applying a 5 percent factor on this newly computed
"AIME+" to develop a second component of the PIA, and (c) adding this second component to the current-law PIA ......... 2.13 2.15
Section 3) Increase the 90 percent PIA formula factor to 91
percent for beneficiaries newly eligible in 2021, 92 percent for
those newly eligible in 2022, ..., reaching 95 percent for those
newly eligible in 2025 and later .................................................. -0.28 -0.44
Section 3) Increase the first PIA bend point above the level it
would be in current law by 1 percent for beneficiaries newly
eligible in 2021, 2 percent for those newly eligible in 2022, ...,
reaching 15 percent higher for those newly eligible in 2035 and
later ............................................................................................. -0.39 -0.71
Section 5) Starting with the December 2016 COLA, use the
Consumer Price Index for the Elderly (CPI-E). We estimate
this new computation will increase the annual COLA by about
0.2 percentage point, on average ................................................ -0.39 -0.52

Table A—Estimated Long-Range OASDI Financial Effects of H.R. 5952,
the “Strengthening Social Security Act of 2016,”
Introduced by Representative Linda Sánchez
Provision
Estimated Change in
Long-Range OASDI
Actuarial Balance 1
(as a percent of payroll)
Estimated Change
in Annual Balance
for 75th
year 2
(as a percent of payroll)
Section 6) Establish an alternative benefit for a surviving
spouse. For the surviving spouse, the alternative benefit would
equal 75 percent of the sum of the survivor's own worker
benefit and the deceased worker's PIA (including any actuarial
reductions or delayed retirement credits (DRCs)). If the
deceased worker died before becoming entitled, use the age 62
actuarial reduction if deceased before age 62, or the applicable
actuarial reduction/DRC for entitlement at the age of death if
deceased after 62. The alternative benefit would be limited to
the PIA of a hypothetical earner who earns the SSA average
wage index (AWI) every year, and who becomes eligible for
retired-worker benefits in the same year in which the deceased
worker became eligible for worker benefits or died (if before
age 62). The alternative benefit would be paid only if more
than the current-law benefit. This benefit would be available to
surviving spouses on the rolls at the beginning of 2017 and
those becoming eligible after 2017 ............................................ -0.12 -0.12
Total for all provisions, including interaction ................... 0.89 0.25
1Under current law, the estimated long-range OASDI actuarial balance is -2.66 percent of taxable payroll.
2Under current law, the estimated 75
th year annual balance is -4.35 percent of taxable payroll.
Notes: All estimates are based on the intermediate assumptions of the 2016 OASDI Trustees Report.
Estimates of individual provisions appear on a stand-alone basis relative to current law, unless otherwise stated.
Social Security Administration
Office of the Chief Actuary
September 9, 2016

Year
Attain Increased Benefit
Age 65 (Wage-Indexed (CPI-Indexed COLA4
Formula5 Total Scheduled Payable
2015 Dollars) 2015 Dollars)
2016 718 718 0.0 0.0 0.0 100 100
2030 660 812 0.6 10.0 10.6 111 111
2050 661 1,036 0.6 14.4 15.1 115 144
2080 665 1,469 0.6 14.4 15.0 115 153
2016 718 718 0.0 0.0 0.0 100 100
2030 660 812 0.6 10.0 10.6 111 111
2050 661 1,036 0.6 14.4 15.1 115 144
2080 665 1,469 0.6 14.4 15.0 115 153
2016 718 718 0.0 0.0 0.0 100 100
2030 660 812 0.6 10.0 10.6 111 111
2050 661 1,036 0.6 14.4 15.1 115 144
2080 665 1,469 0.6 14.4 15.0 115 153
2016 940 940 0.0 0.0 0.0 100 100
2030 863 1,062 0.6 7.6 8.3 108 108
2050 865 1,356 0.6 11.7 12.4 112 141
2080 869 1,921 0.6 11.7 12.4 112 150
2016 940 940 0.0 0.0 0.0 100 100
2030 863 1,062 0.6 7.6 8.3 108 108
2050 865 1,356 0.6 11.7 12.4 112 141
2080 869 1,921 0.6 11.7 12.4 112 150
2016 940 940 0.0 0.0 0.0 100 100
2030 863 1,062 0.6 7.6 8.3 108 108
2050 865 1,356 0.6 11.7 12.4 112 141
2080 869 1,921 0.6 11.7 12.4 112 150
2016 1,548 1,548 0.0 0.0 0.0 100 100
2030 1,423 1,750 0.6 4.6 5.2 105 105
2050 1,425 2,234 0.6 7.1 7.7 108 135
2080 1,433 3,166 0.6 7.1 7.7 108 143
2016 1,548 1,548 0.0 0.0 0.0 100 100
2030 1,423 1,750 0.6 4.6 5.2 105 105
2050 1,425 2,234 0.6 7.1 7.7 108 135
2080 1,433 3,166 0.6 7.1 7.7 108 143
2016 2,053 2,053 0.0 0.0 0.0 100 100
2030 1,885 2,319 0.6 3.5 4.1 104 104
2050 1,888 2,960 0.6 5.4 6.0 106 133
2080 1,899 4,195 0.6 5.4 6.0 106 141
2016 2,492 2,492 0.0 0.0 0.0 100 100
2030 2,308 2,839 0.6 2.9 3.5 103 103
2050 2,309 3,622 0.6 4.4 5.0 105 132
2080 2,317 5,119 0.6 4.4 5.0 105 140
1Average of highest 35 years of earnings wage indexed to 2016.
2Projected percent of new retired worker awards in 2050 closest to AIME levels and years of work.
3After the trust fund reserves deplete under present law continuing taxes are expected to be enough to pay about three fourths of scheduled benefits.
4
5
All estimates based on the intermediate assumptions of the 2016 Trustees Report.
Monthly Benefits3 Percent of Present Law:
Table B1. Changes in Benefits for Hypothetical Workers Beginning Benefit Receipt at age 65
H.R. 5952, the "Strengthening Social Security Act of 2016," Introduced by Representative Linda Sánchez
Scheduled Benefit Level Percent Change at age 65
Present Law Scheduled Proposal Scheduled Benefit
High-AIME ($78,594 for 20161) 44-Year Scaled Earner (19.8% of Retirees
2)
(Percent change) (Percents)
Very-Low-AIME ($12,280 for 20161) 20-Year Scaled Earner (5.2% of Retirees
2)
Very-Low-AIME ($12,280 for 20161) 14-Year Scaled Earner (4.2% of Retirees
2)
Low-AIME ($22,105 for 20161) 44-Year Scaled Earner (16.9% of Retirees
2)
Low-AIME ($22,105 for 20161) 30-Year Scaled Earner (4.4% of Retirees
2)
Low-AIME ($22,105 for 20161) 20-Year Scaled Earner (2.0% of Retirees
2)
Medium-AIME ($49,121 for 20161) 44-Year Scaled Earner (29.2% of Retirees
2)
Medium-AIME ($49,121 for 20161) 30-Year Scaled Earner (3.2% of Retirees
2)
Office of the Chief Actuary, Social Security Administration September 9, 2016
Maximum-AIME ($118,500 for 20161) 43-Year Steady Earner (6.3% of Retirees
2)
Starting Dec 2016, compute the COLA using the CPI-E, producing 0.2% higher annual COLAs on average.
Increase the 90% PIA factor to 95% phasing in for those newly eligible in 2021-2025, and increase the first bend point by 15% phasing in from 2021-2035.

Year
Attain
Age 65 Age 65 Age 75 Age 85 Age 95
2016 100.0 102.0 104.0 106.0
2030 110.6 112.8 115.0 117.3
2050 115.1 117.3 119.6 122.0
2080 115.0 117.3 119.6 122.0
2016 100.0 102.0 104.0 106.0
2030 110.6 112.8 115.0 117.3
2050 115.1 117.3 119.6 122.0
2080 115.0 117.3 119.6 122.0
2016 100.0 102.0 104.0 106.0
2030 110.6 112.8 115.0 117.3
2050 115.1 117.3 119.6 122.0
2080 115.0 117.3 119.6 122.0
2016 100.0 102.0 104.0 106.0
2030 108.3 110.4 112.5 114.8
2050 112.4 114.6 116.8 119.1
2080 112.4 114.6 116.8 119.1
2016 100.0 102.0 104.0 106.0
2030 108.3 110.4 112.5 114.8
2050 112.4 114.6 116.8 119.1
2080 112.4 114.6 116.8 119.1
2016 100.0 102.0 104.0 106.0
2030 108.3 110.4 112.5 114.8
2050 112.4 114.6 116.8 119.1
2080 112.4 114.6 116.8 119.1
2016 100.0 102.0 104.0 106.0
2030 105.2 107.3 109.4 111.6
2050 107.7 109.8 112.0 114.2
2080 107.7 109.8 112.0 114.2
2016 100.0 102.0 104.0 106.0
2030 105.2 107.3 109.4 111.6
2050 107.7 109.8 112.0 114.2
2080 107.7 109.8 112.0 114.2
2016 100.0 102.0 104.0 106.0
2030 104.1 106.1 108.2 110.4
2050 106.0 108.1 110.2 112.3
2080 106.0 108.1 110.2 112.3
2016 100.0 102.0 104.0 106.0
2030 103.5 105.5 107.6 109.7
2050 105.0 107.1 109.2 111.3
2080 105.0 107.1 109.2 111.3
1Average of highest 35 years of earnings wage indexed to 2016.
2Projected percent of new retired worker awards in 2050 closest to AIME levels and years of work.
Note: Starting Dec 2016, compute the COLA using the CPI-E, producing 0.2% higher annual COLAs on average.
Other Changes:
-
All estimates based on the intermediate assumptions of the 2016 Trustees Report.
Low-AIME ($22,105 for 20161) 30-Year Scaled Earner (4.4% of Retirees
2)
Medium-AIME ($49,121 for 20161) 30-Year Scaled Earner (3.2% of Retirees
2)
Table B2. Changes in Benefits for Hypothetical Workers Beginning Benefit Receipt at age 65
H.R. 5952, the "Strengthening Social Security Act of 2016," Introduced by Representative Linda Sánchez
Proposal Scheduled Benefit as Percent of Present Law Scheduled
(Percent)
Very-Low-AIME ($12,280 for 20161) 30-Year Scaled Earner (8.9% of Retirees
2)
Very-Low-AIME ($12,280 for 20161) 20-Year Scaled Earner (5.2% of Retirees
2)
Very-Low-AIME ($12,280 for 20161) 14-Year Scaled Earner (4.2% of Retirees
2)
Low-AIME ($22,105 for 20161) 44-Year Scaled Earner (16.9% of Retirees
2)
Low-AIME ($22,105 for 20161) 20-Year Scaled Earner (2.0% of Retirees
2)
Medium-AIME ($49,121 for 20161) 44-Year Scaled Earner (29.2% of Retirees
2)
Office of the Chief Actuary, Social Security Administration September 9, 2016
High-AIME ($78,594 for 20161) 44-Year Scaled Earner (19.8% of Retirees
2)
Maximum-AIME ($118,500 for 20161) 43-Year Steady Earner (6.3% of Retirees
2)
Increase the 90% PIA factor to 95% phasing in for those newly eligible in 2021-2025, and increase the first bend point by 15% phasing in from 2021-2035.

Category Dually Entitled2
WEP3
Foreign Born All Others4
Very-Low-AIME ($12,280 for 20161):
30-Year Scaled Earner (9.3% of Retirees) 47 6 11 40
20-Year Scaled Earner (5.8% of Retirees) 38 16 21 31
14-Year Scaled Earner (5.3% of Retirees) 22 21 45 20
Low-AIME ($22,105 for 20161):
44-Year Scaled Earner (13.1% of Retirees) 15 2 6 78
30-Year Scaled Earner (5.9% of Retirees) 16 9 18 59
20-Year Scaled Earner (3.1% of Retirees) 10 23 35 37
Medium-AIME ($49,121 for 20161):
44-Year Scaled Earner (23.0% of Retirees) 1 1 5 93
30-Year Scaled Earner (4.4% of Retirees) 1 8 26 67
High-AIME ($78,594 for 20161):
44-Year Scaled Earner (20.5% of Retirees) 0 0 6 93
Maximum-AIME ($118,500 for 20161):
Steady Earner (9.4% of Retirees) 0 0 7 93
1Average of highest 35 years of earnings wage indexed to 2016.
2
3Covered by pension from government employment and are subject to the windfall elimination provision (WEP).
4Neither foreign born, subject to WEP, or dually entitled.
June 22, 2016
Note 3: The sum of the percentages for each category (sum across rows) could be greater than 100 percent because some beneficiaries can be classified in more than one of the
following groups: dually entitled, WEP, and foreign born.
Under current law, entitled to an additional benefit based on someone else's account. The dually entitled percent is a minimum value. Some beneficiaries that are not
currently dually entitled could become dually entitled in the future.
Office of the Chief Actuary, Social Security Administration
Table B3. Important Characteristics of Hypothetical Workers in 2007
Percent of Beneficiaries Within Each Category That Are:
Note 1:Table B3 displays the percentages of these newly-entitled retired workers in 2007 that are closest to each of the illustrative examples.
Note 2: Percents based on tabulations of a 10-percent sample of newly entitled retired-worker beneficiaries in 2007 (169,725 records). We can be 95 percent confident that each
of the values shown above is within 1.4 percentage points of the value we would find using 100 percent of the retirees in 2007.

Table 1 - OASDI Cost Rate, Income Rate, Annual Balance, and Trust Fund Ratio
H.R. 5952, the "Strengthening Social Security Act of 2016," Introduced by Representative Linda Sánchez
Year Cost Rate
Income
Rate
Annual
Balance Cost Rate
Income
Rate
Annual
Balance
2016 14.05 12.94 -1.10 303 0.00 0.00 0.00
2017 13.86 13.41 -0.45 290 0.14 0.49 0.35
2018 14.02 13.96 -0.06 276 0.17 1.01 0.84
2019 14.18 14.46 0.28 266 0.19 1.49 1.30
2020 14.35 14.93 0.57 259 0.22 1.95 1.73
2021 14.52 15.39 0.87 255 0.25 2.38 2.14
2022 14.77 15.43 0.66 252 0.28 2.39 2.11
2023 15.07 15.43 0.35 248 0.32 2.37 2.05
2024 15.38 15.45 0.07 243 0.36 2.35 2.00
2025 15.69 15.44 -0.24 236 0.40 2.33 1.93
2026 15.92 15.46 -0.46 230 0.45 2.34 1.88
2027 16.15 15.48 -0.67 223 0.51 2.34 1.83
2028 16.37 15.50 -0.88 217 0.56 2.34 1.78
2029 16.59 15.52 -1.07 210 0.62 2.35 1.73
2030 16.78 15.53 -1.25 203 0.68 2.35 1.67
2031 16.97 15.55 -1.42 195 0.75 2.36 1.61
2032 17.14 15.56 -1.58 188 0.81 2.36 1.55
2033 17.28 15.57 -1.71 179 0.87 2.36 1.49
2034 17.40 15.58 -1.82 170 0.94 2.37 1.43
2035 17.49 15.59 -1.91 161 1.00 2.37 1.37
2036 17.62 15.60 -2.02 151 1.06 2.38 1.31
2037 17.72 15.61 -2.12 140 1.13 2.38 1.26
2038 17.80 15.62 -2.18 130 1.19 2.39 1.20
2039 17.85 15.62 -2.23 119 1.24 2.39 1.15
2040 17.89 15.63 -2.26 107 1.30 2.39 1.10
2041 17.91 15.63 -2.28 96 1.35 2.40 1.05
2042 17.93 15.63 -2.30 84 1.40 2.40 1.00
2043 17.95 15.64 -2.31 72 1.45 2.41 0.96
2044 17.96 15.64 -2.32 60 1.49 2.41 0.92
2045 17.99 15.64 -2.34 48 1.54 2.41 0.88
2046 18.01 15.65 -2.36 36 1.58 2.42 0.84
2047 18.02 15.65 -2.37 24 1.62 2.42 0.80
2048 18.04 15.65 -2.39 11 1.66 2.42 0.77
2049 18.06 15.66 -2.40 ---- 1.69 2.43 0.73
2050 18.09 15.66 -2.42 ---- 1.73 2.43 0.70
2051 18.12 15.67 -2.45 ---- 1.76 2.43 0.67
2052 18.16 15.67 -2.49 ---- 1.79 2.44 0.64
2053 18.22 15.68 -2.54 ---- 1.82 2.44 0.62
2054 18.28 15.68 -2.60 ---- 1.85 2.44 0.59
2055 18.34 15.69 -2.66 ---- 1.88 2.44 0.56
2056 18.41 15.69 -2.72 ---- 1.91 2.45 0.54
2057 18.49 15.70 -2.79 ---- 1.93 2.45 0.52
2058 18.56 15.71 -2.86 ---- 1.96 2.45 0.50
2059 18.63 15.71 -2.92 ---- 1.98 2.45 0.48
2060 18.71 15.72 -2.99 ---- 2.00 2.46 0.46
2061 18.78 15.73 -3.05 ---- 2.02 2.46 0.44
2062 18.84 15.73 -3.11 ---- 2.04 2.46 0.43
2063 18.91 15.74 -3.17 ---- 2.05 2.46 0.41
2064 18.97 15.74 -3.23 ---- 2.07 2.47 0.40
2065 19.04 15.75 -3.29 ---- 2.08 2.47 0.38
2066 19.11 15.75 -3.35 ---- 2.10 2.47 0.37
2067 19.17 15.76 -3.41 ---- 2.11 2.47 0.36
2068 19.24 15.76 -3.47 ---- 2.12 2.47 0.35
2069 19.30 15.77 -3.53 ---- 2.14 2.48 0.34
2070 19.37 15.78 -3.59 ---- 2.15 2.48 0.33
2071 19.42 15.78 -3.64 ---- 2.16 2.48 0.32
2072 19.47 15.79 -3.69 ---- 2.17 2.48 0.31
2073 19.52 15.79 -3.73 ---- 2.18 2.48 0.31
2074 19.56 15.79 -3.76 ---- 2.19 2.49 0.30
2075 19.59 15.80 -3.79 ---- 2.19 2.49 0.29
2076 19.60 15.80 -3.80 ---- 2.20 2.49 0.29
2077 19.61 15.80 -3.81 ---- 2.20 2.49 0.29
2078 19.62 15.80 -3.81 ---- 2.21 2.49 0.29
2079 19.62 15.81 -3.81 ---- 2.21 2.49 0.28
2080 19.61 15.81 -3.81 ---- 2.21 2.50 0.28
2081 19.62 15.81 -3.81 ---- 2.21 2.50 0.28
2082 19.62 15.81 -3.81 ---- 2.22 2.50 0.28
2083 19.64 15.81 -3.83 ---- 2.22 2.50 0.28
2084 19.66 15.81 -3.85 ---- 2.22 2.50 0.28
2085 19.70 15.82 -3.88 ---- 2.23 2.50 0.27
2086 19.74 15.82 -3.92 ---- 2.23 2.50 0.27
2087 19.78 15.82 -3.96 ---- 2.24 2.50 0.27
2088 19.83 15.83 -4.00 ---- 2.24 2.51 0.26
2089 19.88 15.83 -4.05 ---- 2.25 2.51 0.26
2090 19.93 15.84 -4.10 ---- 2.26 2.51 0.25
2091 19.99 15.84 -4.14 ---- 2.26 2.51 0.25
Summarized Rates: OASDI Summarized Rates: OASDI
Cost Rate Income Rate
Actuarial
Balance
Change in
Cost rate
Change in
Income Rate
Change in
Actuarial
Balance
2016 - 2090 17.94% 16.17% -1.77% 2048 1.43% 2.32% 0.89%
Based on Intermediate Assumptions of the 2016 Trustees Report. Social Security Administration1Under present law the year of combined Trust Fund reserve depletion is 2034.
Change from Present Law
Year of reserve
depletion1
September 9, 2016
Office of the Chief Actuary
Proposal
Expressed as a percentage of present-law
taxable payrollTrust Fund
Ratio
1-1-year
Expressed as a percentage of present-law
taxable payroll
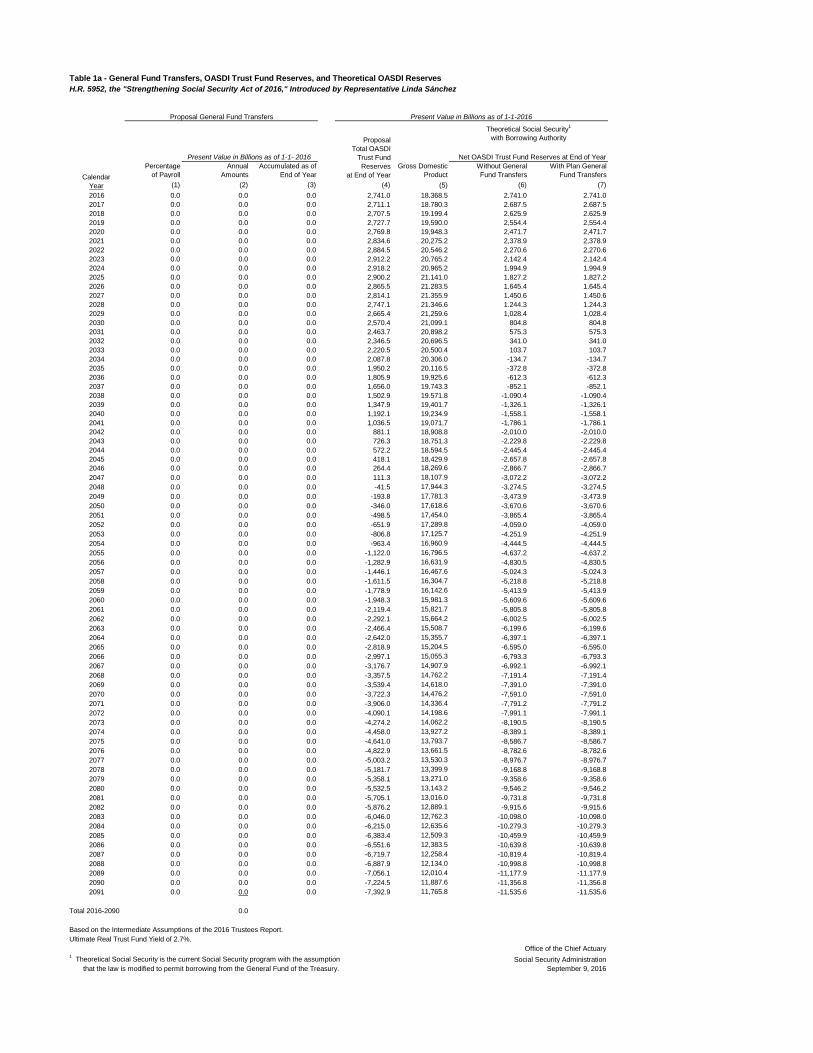
Table 1a - General Fund Transfers, OASDI Trust Fund Reserves, and Theoretical OASDI Reserves
H.R. 5952, the "Strengthening Social Security Act of 2016," Introduced by Representative Linda Sánchez
Percentage
of Payroll
Annual
Amounts
Accumulated as of
End of Year
Gross Domestic
Product
Without General
Fund Transfers
With Plan General
Fund Transfers
(1) (2) (3) (4) (5) (6) (7)
2016 0.0 0.0 0.0 2,741.0 18,368.5 2,741.0 2,741.0
2017 0.0 0.0 0.0 2,711.1 18,780.3 2,687.5 2,687.5
2018 0.0 0.0 0.0 2,707.5 19,199.4 2,625.9 2,625.9
2019 0.0 0.0 0.0 2,727.7 19,590.0 2,554.4 2,554.4
2020 0.0 0.0 0.0 2,769.8 19,948.3 2,471.7 2,471.7
2021 0.0 0.0 0.0 2,834.6 20,275.2 2,378.9 2,378.9
2022 0.0 0.0 0.0 2,884.5 20,546.2 2,270.6 2,270.6
2023 0.0 0.0 0.0 2,912.2 20,765.2 2,142.4 2,142.4
2024 0.0 0.0 0.0 2,918.2 20,965.2 1,994.9 1,994.9
2025 0.0 0.0 0.0 2,900.2 21,141.0 1,827.2 1,827.2
2026 0.0 0.0 0.0 2,865.5 21,283.5 1,645.4 1,645.4
2027 0.0 0.0 0.0 2,814.1 21,355.9 1,450.6 1,450.6
2028 0.0 0.0 0.0 2,747.1 21,346.6 1,244.3 1,244.3
2029 0.0 0.0 0.0 2,665.4 21,259.6 1,028.4 1,028.4
2030 0.0 0.0 0.0 2,570.4 21,099.1 804.8 804.8
2031 0.0 0.0 0.0 2,463.7 20,898.2 575.3 575.3
2032 0.0 0.0 0.0 2,346.5 20,696.5 341.0 341.0
2033 0.0 0.0 0.0 2,220.5 20,500.4 103.7 103.7
2034 0.0 0.0 0.0 2,087.8 20,306.0 -134.7 -134.7
2035 0.0 0.0 0.0 1,950.2 20,116.5 -372.8 -372.8
2036 0.0 0.0 0.0 1,805.9 19,925.6 -612.3 -612.3
2037 0.0 0.0 0.0 1,656.0 19,743.3 -852.1 -852.1
2038 0.0 0.0 0.0 1,502.9 19,571.8 -1,090.4 -1,090.4
2039 0.0 0.0 0.0 1,347.9 19,401.7 -1,326.1 -1,326.1
2040 0.0 0.0 0.0 1,192.1 19,234.9 -1,558.1 -1,558.1
2041 0.0 0.0 0.0 1,036.5 19,071.7 -1,786.1 -1,786.1
2042 0.0 0.0 0.0 881.1 18,908.8 -2,010.0 -2,010.0
2043 0.0 0.0 0.0 726.3 18,751.3 -2,229.8 -2,229.8
2044 0.0 0.0 0.0 572.2 18,594.5 -2,445.4 -2,445.4
2045 0.0 0.0 0.0 418.1 18,429.9 -2,657.8 -2,657.8
2046 0.0 0.0 0.0 264.4 18,269.6 -2,866.7 -2,866.7
2047 0.0 0.0 0.0 111.3 18,107.9 -3,072.2 -3,072.2
2048 0.0 0.0 0.0 -41.5 17,944.3 -3,274.5 -3,274.5
2049 0.0 0.0 0.0 -193.8 17,781.3 -3,473.9 -3,473.9
2050 0.0 0.0 0.0 -346.0 17,618.6 -3,670.6 -3,670.6
2051 0.0 0.0 0.0 -498.5 17,454.0 -3,865.4 -3,865.4
2052 0.0 0.0 0.0 -651.9 17,289.8 -4,059.0 -4,059.0
2053 0.0 0.0 0.0 -806.8 17,125.7 -4,251.9 -4,251.9
2054 0.0 0.0 0.0 -963.4 16,960.9 -4,444.5 -4,444.5
2055 0.0 0.0 0.0 -1,122.0 16,796.5 -4,637.2 -4,637.2
2056 0.0 0.0 0.0 -1,282.9 16,631.9 -4,830.5 -4,830.5
2057 0.0 0.0 0.0 -1,446.1 16,467.6 -5,024.3 -5,024.3
2058 0.0 0.0 0.0 -1,611.5 16,304.7 -5,218.8 -5,218.8
2059 0.0 0.0 0.0 -1,778.9 16,142.6 -5,413.9 -5,413.9
2060 0.0 0.0 0.0 -1,948.3 15,981.3 -5,609.6 -5,609.6
2061 0.0 0.0 0.0 -2,119.4 15,821.7 -5,805.8 -5,805.8
2062 0.0 0.0 0.0 -2,292.1 15,664.2 -6,002.5 -6,002.5
2063 0.0 0.0 0.0 -2,466.4 15,508.7 -6,199.6 -6,199.6
2064 0.0 0.0 0.0 -2,642.0 15,355.7 -6,397.1 -6,397.1
2065 0.0 0.0 0.0 -2,818.9 15,204.5 -6,595.0 -6,595.0
2066 0.0 0.0 0.0 -2,997.1 15,055.3 -6,793.3 -6,793.3
2067 0.0 0.0 0.0 -3,176.7 14,907.9 -6,992.1 -6,992.1
2068 0.0 0.0 0.0 -3,357.5 14,762.2 -7,191.4 -7,191.4
2069 0.0 0.0 0.0 -3,539.4 14,618.0 -7,391.0 -7,391.0
2070 0.0 0.0 0.0 -3,722.3 14,476.2 -7,591.0 -7,591.0
2071 0.0 0.0 0.0 -3,906.0 14,336.4 -7,791.2 -7,791.2
2072 0.0 0.0 0.0 -4,090.1 14,198.6 -7,991.1 -7,991.1
2073 0.0 0.0 0.0 -4,274.2 14,062.2 -8,190.5 -8,190.5
2074 0.0 0.0 0.0 -4,458.0 13,927.2 -8,389.1 -8,389.1
2075 0.0 0.0 0.0 -4,641.0 13,793.7 -8,586.7 -8,586.7
2076 0.0 0.0 0.0 -4,822.9 13,661.5 -8,782.6 -8,782.6
2077 0.0 0.0 0.0 -5,003.2 13,530.3 -8,976.7 -8,976.7
2078 0.0 0.0 0.0 -5,181.7 13,399.9 -9,168.8 -9,168.8
2079 0.0 0.0 0.0 -5,358.1 13,271.0 -9,358.6 -9,358.6
2080 0.0 0.0 0.0 -5,532.5 13,143.2 -9,546.2 -9,546.2
2081 0.0 0.0 0.0 -5,705.1 13,016.0 -9,731.8 -9,731.8
2082 0.0 0.0 0.0 -5,876.2 12,889.1 -9,915.6 -9,915.6
2083 0.0 0.0 0.0 -6,046.0 12,762.3 -10,098.0 -10,098.0
2084 0.0 0.0 0.0 -6,215.0 12,635.6 -10,279.3 -10,279.3
2085 0.0 0.0 0.0 -6,383.4 12,509.3 -10,459.9 -10,459.9
2086 0.0 0.0 0.0 -6,551.6 12,383.5 -10,639.8 -10,639.8
2087 0.0 0.0 0.0 -6,719.7 12,258.4 -10,819.4 -10,819.4
2088 0.0 0.0 0.0 -6,887.9 12,134.0 -10,998.8 -10,998.8
2089 0.0 0.0 0.0 -7,056.1 12,010.4 -11,177.9 -11,177.9
2090 0.0 0.0 0.0 -7,224.5 11,887.6 -11,356.8 -11,356.8
2091 0.0 0.0 0.0 -7,392.9 11,765.8 -11,535.6 -11,535.6
Total 2016-2090 0.0
Based on the Intermediate Assumptions of the 2016 Trustees Report.
Ultimate Real Trust Fund Yield of 2.7%.
Office of the Chief Actuary1 Theoretical Social Security is the current Social Security program with the assumption Social Security Administration
that the law is modified to permit borrowing from the General Fund of the Treasury. September 9, 2016
Calendar
Year
Proposal General Fund Transfers Present Value in Billions as of 1-1-2016
Proposal
Total OASDI
Trust Fund
Reserves
at End of Year
Theoretical Social Security1
with Borrowing Authority
Present Value in Billions as of 1-1- 2016 Net OASDI Trust Fund Reserves at End of Year

Table 1b - OASDI Changes & Implications for Federal Budget and Debt of Specified Plan Provision Effects on OASDI1 (Present Value Dollars)
H.R. 5952, the "Strengthening Social Security Act of 2016," Introduced by Representative Linda Sánchez
Year
Specified
General Fund
Transfers
Basic Changes
in OASDI
Cash Flow
Change
in Annual
Unified Budget
Cash Flow
Change in
Debt Held
by Public at
End of Year
Change
in Annual
Unified Budget
Balance
Change
in Total
Federal Debt
End Of Year
Change
in Annual
On Budget
Balance
(1) (2) (3) (4) (5) (6) (7)
2016 0.0 0.0 0.0 0.0 0.0 0.0 0.0
2017 0.0 23.6 23.6 -23.6 23.6 0.0 0.0
2018 0.0 58.0 58.0 -81.6 58.7 0.0 0.0
2019 0.0 91.8 91.8 -173.3 94.3 0.0 0.0
2020 0.0 124.8 124.8 -298.1 130.2 0.0 0.0
2021 0.0 157.5 157.5 -455.6 166.9 0.0 0.0
2022 0.0 158.3 158.3 -613.9 172.9 0.0 0.0
2023 0.0 155.9 155.9 -769.8 176.1 0.0 0.0
2024 0.0 153.4 153.4 -923.2 179.5 0.0 0.0
2025 0.0 149.8 149.8 -1,073.0 182.1 0.0 0.0
2026 0.0 147.0 147.0 -1,220.0 187.9 0.0 0.0
2027 0.0 143.5 143.5 -1,363.6 193.8 0.0 0.0
2028 0.0 139.2 139.2 -1,502.8 199.7 0.0 0.0
2029 0.0 134.2 134.2 -1,637.0 205.8 0.0 0.0
2030 0.0 128.6 128.6 -1,765.6 212.1 0.0 0.0
2031 0.0 122.8 122.8 -1,888.4 212.8 0.0 0.0
2032 0.0 117.0 117.0 -2,005.4 213.2 0.0 0.0
2033 0.0 111.3 111.3 -2,116.8 213.5 0.0 0.0
2034 0.0 105.8 105.8 -2,222.6 213.7 0.0 0.0
2035 0.0 100.5 100.5 -2,323.1 213.8 0.0 0.0
2036 0.0 95.1 95.1 -2,418.2 213.5 0.0 0.0
2037 0.0 90.0 90.0 -2,508.1 213.2 0.0 0.0
2038 0.0 85.2 85.2 -2,593.3 213.0 0.0 0.0
2039 0.0 80.6 80.6 -2,673.9 212.8 0.0 0.0
2040 0.0 76.4 76.4 -2,750.3 212.6 0.0 0.0
2041 0.0 72.3 72.3 -2,822.6 212.5 0.0 0.0
2042 0.0 68.5 68.5 -2,891.1 212.4 0.0 0.0
2043 0.0 64.9 64.9 -2,956.1 212.3 0.0 0.0
2044 0.0 61.6 61.6 -3,017.6 212.2 0.0 0.0
2045 0.0 58.3 58.3 -3,075.9 212.1 0.0 0.0
2046 0.0 55.2 55.2 -3,131.1 212.0 0.0 0.0
2047 0.0 52.3 52.3 -3,183.4 211.9 0.0 0.0
2048 0.0 49.6 49.6 -3,233.0 211.8 0.0 0.0
2049 0.0 47.0 47.0 -3,280.1 211.8 0.0 0.0
2050 0.0 44.6 44.6 -3,324.7 211.8 0.0 0.0
2051 0.0 42.3 42.3 -3,367.0 211.7 0.0 0.0
2052 0.0 40.1 40.1 -3,407.1 211.7 0.0 0.0
2053 0.0 38.0 38.0 -3,445.1 211.6 0.0 0.0
2054 0.0 36.0 36.0 -3,481.1 211.6 0.0 0.0
2055 0.0 34.1 34.1 -3,515.2 211.5 0.0 0.0
2056 0.0 32.3 32.3 -3,547.5 211.5 0.0 0.0
2057 0.0 30.7 30.7 -3,578.2 211.5 0.0 0.0
2058 0.0 29.1 29.1 -3,607.3 211.5 0.0 0.0
2059 0.0 27.7 27.7 -3,635.0 211.5 0.0 0.0
2060 0.0 26.3 26.3 -3,661.3 211.6 0.0 0.0
2061 0.0 25.1 25.1 -3,686.4 211.7 0.0 0.0
2062 0.0 23.9 23.9 -3,710.3 211.8 0.0 0.0
2063 0.0 22.9 22.9 -3,733.2 212.0 0.0 0.0
2064 0.0 21.9 21.9 -3,755.1 212.2 0.0 0.0
2065 0.0 21.0 21.0 -3,776.1 212.3 0.0 0.0
2066 0.0 20.1 20.1 -3,796.2 212.5 0.0 0.0
2067 0.0 19.3 19.3 -3,815.4 212.7 0.0 0.0
2068 0.0 18.5 18.5 -3,833.9 212.9 0.0 0.0
2069 0.0 17.7 17.7 -3,851.6 213.1 0.0 0.0
2070 0.0 17.1 17.1 -3,868.7 213.4 0.0 0.0
2071 0.0 16.4 16.4 -3,885.1 213.6 0.0 0.0
2072 0.0 15.9 15.9 -3,901.0 213.9 0.0 0.0
2073 0.0 15.3 15.3 -3,916.3 214.1 0.0 0.0
2074 0.0 14.9 14.9 -3,931.2 214.5 0.0 0.0
2075 0.0 14.4 14.4 -3,945.6 214.8 0.0 0.0
2076 0.0 14.1 14.1 -3,959.7 215.2 0.0 0.0
2077 0.0 13.8 13.8 -3,973.5 215.6 0.0 0.0
2078 0.0 13.6 13.6 -3,987.1 216.1 0.0 0.0
2079 0.0 13.4 13.4 -4,000.4 216.6 0.0 0.0
2080 0.0 13.2 13.2 -4,013.6 217.1 0.0 0.0
2081 0.0 13.0 13.0 -4,026.6 217.5 0.0 0.0
2082 0.0 12.8 12.8 -4,039.4 218.0 0.0 0.0
2083 0.0 12.6 12.6 -4,052.0 218.5 0.0 0.0
2084 0.0 12.3 12.3 -4,064.3 218.9 0.0 0.0
2085 0.0 12.1 12.1 -4,076.4 219.2 0.0 0.0
2086 0.0 11.8 11.8 -4,088.2 219.6 0.0 0.0
2087 0.0 11.5 11.5 -4,099.7 219.9 0.0 0.0
2088 0.0 11.2 11.2 -4,110.9 220.1 0.0 0.0
2089 0.0 10.9 10.9 -4,121.8 220.4 0.0 0.0
2090 0.0 10.6 10.6 -4,132.4 220.6 0.0 0.0
Total 2016-2090 0.0 4,132.4 4,132.4
Based on Intermediate Assumptions of the 2016 Trustees Report.
Ultimate Real Trust Fund Yield of 2.7%.
Note: Changes reflect the budget scoring convention that presumes benefits not payable after reserve depletion would Office of the Chief Actuary
nonetheless be paid, based on transfers from the General Fund of the Treasury resulting in additional borrowing from the public. Social Security Administration1 Effects of tax provisions on the On-Budget are not reflected in this table.
Billions of Present Value Dollars as of 1-1-2016
September 9, 2016

Table 1b.n - OASDI Changes & Implications for Federal Budget and Debt of Specified Plan Provision Effects on OASDI1 (Nominal Dollars)
H.R. 5952, the "Strengthening Social Security Act of 2016," Introduced by Representative Linda Sánchez
Year
Specified
General Fund
Transfers
Basic Changes
in OASDI
Cash Flow
Change
in Annual
Unified Budget
Cash Flow
Change in
Debt Held
by Public at
End of Year
Change
in Annual
Unified Budget
Balance
Change
in Total
Federal Debt
End of Year
Change
in Annual
On Budget
Balance
(1) (2) (3) (4) (5) (6) (7)
2016 0.0 0.0 0.0 0.0 0.0 0.0 0.0
2017 0.0 24.7 24.7 -25.1 25.1 0.0 0.0
2018 0.0 62.6 62.6 -89.6 64.5 0.0 0.0
2019 0.0 102.2 102.2 -196.7 107.1 0.0 0.0
2020 0.0 143.4 143.4 -349.5 152.8 0.0 0.0
2021 0.0 186.9 186.9 -551.8 202.4 0.0 0.0
2022 0.0 194.0 194.0 -768.9 217.0 0.0 0.0
2023 0.0 197.5 197.5 -998.5 229.6 0.0 0.0
2024 0.0 201.0 201.0 -1,241.6 243.2 0.0 0.0
2025 0.0 203.3 203.3 -1,498.0 256.3 0.0 0.0
2026 0.0 207.1 207.1 -1,772.9 274.9 0.0 0.0
Based on Intermediate Assumptions of the 2016 Trustees Report.
Note: Changes reflect the budget scoring convention that presumes benefits not payable after reserve depletion would Office of the Chief Actuary
nonetheless be paid, based on transfers from the General Fund of the Treasury resulting in additional borrowing from the public. Social Security Administration1 Effects of tax provisions on the On-Budget are not reflected in this table.
Billions of Nominal Dollars
September 9, 2016

Table 1c - Present Law and Proposal Cost, Expenditures, and Income: As Percent of Gross Domestic Product
Cost
Expenditures
(Payable)
Non-Interest
Income Cost
Expenditures
(Payable)
Non-Interest
Income
(1) (2) (3) (4) (5) (6)
2016 4.98 4.98 4.59 4.98 4.98 4.59
2017 4.91 4.91 4.62 4.96 4.96 4.80
2018 4.98 4.98 4.65 5.04 5.04 5.02
2019 5.05 5.05 4.68 5.12 5.12 5.22
2020 5.12 5.12 4.70 5.20 5.20 5.41
2021 5.18 5.18 4.72 5.27 5.27 5.59
2022 5.28 5.28 4.75 5.38 5.38 5.62
2023 5.39 5.39 4.77 5.50 5.50 5.63
2024 5.50 5.50 4.79 5.63 5.63 5.65
2025 5.60 5.60 4.81 5.75 5.75 5.66
2026 5.67 5.67 4.81 5.83 5.83 5.66
2027 5.73 5.73 4.81 5.91 5.91 5.66
2028 5.78 5.78 4.81 5.98 5.98 5.66
2029 5.83 5.83 4.81 6.06 6.06 5.66
2030 5.87 5.87 4.81 6.12 6.12 5.66
2031 5.91 5.91 4.80 6.18 6.18 5.66
2032 5.94 5.94 4.80 6.23 6.23 5.66
2033 5.96 5.96 4.80 6.28 6.28 5.66
2034 5.98 5.29 4.80 6.32 6.32 5.65
2035 5.98 4.79 4.79 6.34 6.34 5.65
2036 6.00 4.79 4.79 6.38 6.38 5.65
2037 6.01 4.79 4.79 6.41 6.41 5.65
2038 6.01 4.78 4.78 6.44 6.44 5.65
2039 6.00 4.78 4.78 6.45 6.45 5.64
2040 5.99 4.78 4.78 6.46 6.46 5.64
2041 5.97 4.77 4.77 6.46 6.46 5.64
2042 5.96 4.77 4.77 6.46 6.46 5.64
2043 5.94 4.77 4.77 6.47 6.47 5.63
2044 5.93 4.76 4.76 6.47 6.47 5.63
2045 5.92 4.76 4.76 6.47 6.47 5.63
2046 5.91 4.76 4.76 6.48 6.48 5.63
2047 5.90 4.76 4.76 6.48 6.48 5.63
2048 5.89 4.76 4.76 6.48 6.35 5.63
2049 5.88 4.75 4.75 6.49 5.62 5.62
2050 5.87 4.75 4.75 6.49 5.62 5.62
2051 5.87 4.75 4.75 6.50 5.62 5.62
2052 5.87 4.75 4.75 6.52 5.62 5.62
2053 5.88 4.75 4.75 6.53 5.62 5.62
2054 5.89 4.75 4.75 6.55 5.62 5.62
2055 5.90 4.74 4.74 6.57 5.62 5.62
2056 5.91 4.74 4.74 6.59 5.62 5.62
2057 5.92 4.74 4.74 6.61 5.62 5.62
2058 5.94 4.74 4.74 6.64 5.62 5.62
2059 5.95 4.74 4.74 6.66 5.61 5.61
2060 5.97 4.74 4.74 6.68 5.61 5.61
2061 5.98 4.73 4.73 6.70 5.61 5.61
2062 5.99 4.73 4.73 6.72 5.61 5.61
2063 6.01 4.73 4.73 6.74 5.61 5.61
2064 6.02 4.73 4.73 6.75 5.60 5.60
2065 6.03 4.72 4.72 6.77 5.60 5.60
2066 6.04 4.72 4.72 6.79 5.60 5.60
2067 6.06 4.72 4.72 6.81 5.59 5.59
2068 6.07 4.71 4.71 6.82 5.59 5.59
2069 6.08 4.71 4.71 6.84 5.59 5.59
2070 6.09 4.71 4.71 6.85 5.58 5.58
2071 6.10 4.70 4.70 6.87 5.58 5.58
2072 6.11 4.70 4.70 6.88 5.58 5.58
2073 6.12 4.70 4.70 6.89 5.57 5.57
2074 6.12 4.69 4.69 6.90 5.57 5.57
2075 6.13 4.69 4.69 6.90 5.56 5.56
2076 6.12 4.68 4.68 6.90 5.56 5.56
2077 6.12 4.68 4.68 6.89 5.55 5.55
2078 6.11 4.67 4.67 6.89 5.55 5.55
2079 6.11 4.67 4.67 6.88 5.54 5.54
2080 6.10 4.66 4.66 6.87 5.54 5.54
2081 6.09 4.66 4.66 6.87 5.53 5.53
2082 6.09 4.66 4.66 6.86 5.53 5.53
2083 6.09 4.65 4.65 6.86 5.53 5.53
2084 6.09 4.65 4.65 6.87 5.52 5.52
2085 6.09 4.64 4.64 6.87 5.52 5.52
2086 6.10 4.64 4.64 6.88 5.51 5.51
2087 6.11 4.64 4.64 6.89 5.51 5.51
2088 6.12 4.64 4.64 6.90 5.51 5.51
2089 6.13 4.63 4.63 6.91 5.51 5.51
2090 6.14 4.63 4.63 6.93 5.50 5.50
Based on Intermediate Assumptions of the 2016 Trustees Report. Office of the Chief Actuary
Social Security Administration
Present Law OASDI Proposal OASDI
Calendar
Year
H.R. 5952, the "Strengthening Social Security Act of 2016," Introduced by Representative Linda Sánchez
September 9, 2016

Table 1d - Change in Long-Range Trust Fund Reserves / Unfunded Obligation
H.R. 5952, the "Strengthening Social Security Act of 2016," Introduced by Representative Linda Sánchez
Year
Present Law OASDI
Trust Fund Reserves /
Unfunded Obligation
Through End of Year
Changes
in OASDI
Income
Changes
in OASDI
Cost
Basic
Changes
in OASDI
Cash Flow
Total Change
Through
End of Year
Proposal OASDI
Trust Fund Reserves /
Unfunded Obligation
Through End of Year
(1) (2) (3) (4) = (2)-(3) (5) = cumulative sum(4) (6) = (1)+(5)
2016 2,741.0 0.0 0.0 0.0 0.0 2,741.0
2017 2,687.5 33.2 9.6 23.6 23.6 2,711.1
2018 2,625.9 69.6 11.6 58.0 81.6 2,707.5
2019 2,554.4 105.5 13.7 91.8 173.3 2,727.7
2020 2,471.7 140.7 15.9 124.8 298.1 2,769.8
2021 2,378.9 175.7 18.2 157.5 455.6 2,834.6
2022 2,270.6 179.1 20.8 158.3 613.9 2,884.5
2023 2,142.4 179.8 23.9 155.9 769.8 2,912.2
2024 1,994.9 180.8 27.4 153.4 923.2 2,918.2
2025 1,827.2 181.0 31.2 149.8 1,073.0 2,900.2
2026 1,645.4 182.3 35.3 147.0 1,220.0 2,865.5
2027 1,450.6 183.0 39.5 143.5 1,363.6 2,814.1
2028 1,244.3 183.0 43.8 139.2 1,502.8 2,747.1
2029 1,028.4 182.4 48.2 134.2 1,637.0 2,665.4
2030 804.8 181.2 52.5 128.6 1,765.6 2,570.4
2031 575.3 179.6 56.7 122.8 1,888.4 2,463.7
2032 341.0 177.9 60.9 117.0 2,005.4 2,346.5
2033 103.7 176.4 65.0 111.3 2,116.8 2,220.5
2034 -134.7 174.8 69.0 105.8 2,222.6 2,087.8
2035 -372.8 173.3 72.8 100.5 2,323.1 1,950.2
2036 -612.3 171.8 76.7 95.1 2,418.2 1,805.9
2037 -852.1 170.4 80.5 90.0 2,508.1 1,656.0
2038 -1,090.4 169.1 83.9 85.2 2,593.3 1,502.9
2039 -1,326.1 167.8 87.2 80.6 2,673.9 1,347.9
2040 -1,558.1 166.5 90.2 76.4 2,750.3 1,192.1
2041 -1,786.1 165.2 92.9 72.3 2,822.6 1,036.5
2042 -2,010.0 164.0 95.5 68.5 2,891.1 881.1
2043 -2,229.8 162.8 97.8 64.9 2,956.1 726.3
2044 -2,445.4 161.6 100.0 61.6 3,017.6 572.2
2045 -2,657.8 160.3 102.1 58.3 3,075.9 418.1
2046 -2,866.7 159.1 103.9 55.2 3,131.1 264.4
2047 -3,072.2 157.8 105.5 52.3 3,183.4 111.3
2048 -3,274.5 156.5 106.9 49.6 3,233.0 -41.5
2049 -3,473.9 155.2 108.2 47.0 3,280.1 -193.8
2050 -3,670.6 153.9 109.3 44.6 3,324.7 -346.0
2051 -3,865.4 152.6 110.3 42.3 3,367.0 -498.5
2052 -4,059.0 151.3 111.2 40.1 3,407.1 -651.9
2053 -4,251.9 150.0 112.0 38.0 3,445.1 -806.8
2054 -4,444.5 148.6 112.6 36.0 3,481.1 -963.4
2055 -4,637.2 147.3 113.1 34.1 3,515.2 -1,122.0
2056 -4,830.5 145.9 113.6 32.3 3,547.5 -1,282.9
2057 -5,024.3 144.6 113.9 30.7 3,578.2 -1,446.1
2058 -5,218.8 143.2 114.1 29.1 3,607.3 -1,611.5
2059 -5,413.9 141.8 114.2 27.7 3,635.0 -1,778.9
2060 -5,609.6 140.5 114.1 26.3 3,661.3 -1,948.3
2061 -5,805.8 139.1 114.0 25.1 3,686.4 -2,119.4
2062 -6,002.5 137.7 113.8 23.9 3,710.3 -2,292.1
2063 -6,199.6 136.4 113.5 22.9 3,733.2 -2,466.4
2064 -6,397.1 135.0 113.1 21.9 3,755.1 -2,642.0
2065 -6,595.0 133.7 112.7 21.0 3,776.1 -2,818.9
2066 -6,793.3 132.4 112.3 20.1 3,796.2 -2,997.1
2067 -6,992.1 131.1 111.8 19.3 3,815.4 -3,176.7
2068 -7,191.4 129.8 111.3 18.5 3,833.9 -3,357.5
2069 -7,391.0 128.5 110.7 17.7 3,851.6 -3,539.4
2070 -7,591.0 127.2 110.1 17.1 3,868.7 -3,722.3
2071 -7,791.2 126.0 109.5 16.4 3,885.1 -3,906.0
2072 -7,991.1 124.7 108.9 15.9 3,901.0 -4,090.1
2073 -8,190.5 123.5 108.2 15.3 3,916.3 -4,274.2
2074 -8,389.1 122.3 107.4 14.9 3,931.2 -4,458.0
2075 -8,586.7 121.1 106.6 14.4 3,945.6 -4,641.0
2076 -8,782.6 119.9 105.8 14.1 3,959.7 -4,822.9
2077 -8,976.7 118.6 104.8 13.8 3,973.5 -5,003.2
2078 -9,168.8 117.4 103.9 13.6 3,987.1 -5,181.7
2079 -9,358.6 116.3 102.9 13.4 4,000.4 -5,358.1
2080 -9,546.2 115.1 101.9 13.2 4,013.6 -5,532.5
2081 -9,731.8 113.9 100.9 13.0 4,026.6 -5,705.1
2082 -9,915.6 112.8 100.0 12.8 4,039.4 -5,876.2
2083 -10,098.0 111.6 99.0 12.6 4,052.0 -6,046.0
2084 -10,279.3 110.5 98.1 12.3 4,064.3 -6,215.0
2085 -10,459.9 109.4 97.3 12.1 4,076.4 -6,383.4
2086 -10,639.8 108.2 96.4 11.8 4,088.2 -6,551.6
2087 -10,819.4 107.1 95.6 11.5 4,099.7 -6,719.7
2088 -10,998.8 106.0 94.8 11.2 4,110.9 -6,887.9
2089 -11,177.9 104.9 94.1 10.9 4,121.8 -7,056.1
2090 -11,356.8 103.8 93.3 10.6 4,132.4 -7,224.5
Total 2016-2090 10571.1 6438.7 4132.4
Based on Intermediate Assumptions of the 2016 Trustees Report. Office of the Chief Actuary
Social Security Administration
Ultimate Real Trust Fund Yield of 2.7%. September 9, 2016
(Billions of Dollars, Present Value on 1-1-2016)