social, psychological, emotional, concepts of self, and
TRANSCRIPT
1
Social, Psychological, Emotional, Concepts of self, and Resilience outcomes: Understanding and Measurement (SPECTRUM)
A brief guide to the selection, use, and interpretation of SPECTRUM measures
Michael Wigelsworth, Neil Humphrey, Louise Black, Wendy Symes, Kirsty Frearson, Emma Ashworth, Kim Petersen, Tamsin McCaldin, Jess Runacres, Ola Demkowicz, Kirsty Pert, Patricio Tronsco & Louise Anders

2
Contents
Introduction ............................................................................................................... 2 Section 1: SPECTRUM – The importance of terminology .......................................... 3 Section 2: Selecting measures ................................................................................... 6 Section 3: Administration ........................................................................................ 12 Section 4: Calculating and interpreting results ........................................................ 16 Conclusions: A final word of caution ....................................................................... 17 References and further reading ............................................................................... 18
Introduction The measurement and assessment of personal qualities beyond that of cognitive ability has continued in growth and importance for the last couple of decades, not only reflecting changes in the intended purpose and role of schooling (e.g. as primary settings by which many initial concerns such as good mental health can be effectively remediated (Greenberg, 2010), but also as possible facilitators for improved academic outcomes as well. However, this growth in interest has been accompanied by a range of difficulties, both conceptual (for example, definition and scope of competing theoretical frameworks) and empirical (for example, the availability and quality of measures). This document is intended as guide and summary to compliment work commissioned by the EEF to explore the current state of the field regarding measurement of a broad range of personal qualities. It brings together two substantive pieces of work: a conceptual mapping exercise conducted to identify key theoretical domains, and a systematic review of measures (undertaken between August and November 2016), designed to identify and prioritise available instruments in each of these domains. A further explanation of the conceptual mapping, an online searchable database of measures, and an accompanying brief technical user are available to accompany this document. This brief guide is organised as follows: SECTION 1: SPECTRUM: the importance of terminology A summary of key findings from a conceptual mapping exercise exploring the relationship among the theoretical domains of interest, and highlighting some of the inherent assumptions and limitations of the database.
SECTION 2: Selection of measures Guidance on measure selection. SECTION 3: Administration Presents considerations for optimal implementation of measures. SECTION 4: Calculating and interpreting results Considers key issues in the calculation and interpretation of data generated by SPECTRUM measures.

3
Section 1: SPECTRUM – The importance of terminology Establishing clear criteria is an absolutely critical first step in measurement and assessment. Therefore, no guide towards the assessment and measurement of outcomes is complete without a consideration of ‘what’ exactly is being measured. This is particularly true in relation to outcomes not otherwise included under the rubric of ‘academic aptitude’. This is because measures are selected based on perceived constructs (e.g. ’self-esteem’) and how these constructs are understood influences how we understand and interpret scores from these measures. Metrics for academic performance are arguably relatively well-understood and measurement tools assessing academic aptitude have been deployed in education settings for almost 100 years, leaving an indelible impression on the notion of schooling and importance for later life outcomes (Roberts, Markham, Matthews, & Zeidner, 2005). More recently, attention has been focused on exploring the importance of a broad constellation of skills and attributes beyond those directly associated with academic aptitude (Levin, 2013); for instance, ‘social skills’, ‘self-efficacy’, or ‘emotional intelligence’. Although there is arguably an increasing parity as to the relevance of these skills and attributes (with some claiming equal if not greater importance than academic aptitude; see for example, Goleman, 1996), there remains a deeper asymmetry in how these skills are understood or even defined. Indeed, the current field shows a confusing array of psychological frameworks, with little clarity or specificity in terminology. Thus, in order to examine the relative importance of the array (or spectrum) of non-academic skills and attributes for later life outcomes (or indeed, academic attainment itself), we must start with a clear working definition. Currently, there are several frameworks in the field that focus on how these skills and aptitudes may be encapsulated: ‘Non-cognitive’ is defined as “attitudes, behaviours, and strategies which facilitate success in school and workplace, such as motivation, perseverance, and self-control” (Gutman & Schoon, 2013, p.4) and is a frequently used term to describe the constellation of non-academic skills. However, this term is problematic for a number of reasons. Aside from difficulties with the breadth of the term (definition by exclusion), there is an implication that the qualities under consideration do not include cognitive aspects of human functioning. When examining specific psychological frameworks encapsulated by this definition (such as motivation or self-control), cognitive aspects of behaviour are distinctly apparent. For instance, goal-setting in motivation requires ‘self-talk’ and executive functioning to rationalise realistic targets, both of which could be considered cognitive elements (Mischel et al., 2011). ‘Character’ is another term often used, though also subject to criticism. Described as an interlocked set of personal values and virtues that normally guide conduct, character is about who we are and who we become (Arthur, Powell, & Lin, 2014). It is often associated with ‘virtue’ or ‘civic pride’ (Arthur, Harding, & Godfrey, 2004). This poses problems, as character education may be viewed as an approach or process, rather than as an outcome or skill, which has implications for measurement. Indeed, difficulties in evaluating character education programmes have been noted because of issues in establishing suitable assessments for outcomes (Peterson & Skiba, 2001). Additional concerns have also been raised in relation to the moral connotations of the term ‘character’ (Duckworth & Yeager, 2015). Other nomenclature has included ‘social and emotional skills’ (see below) ‘personal qualities’ or ‘soft-skills’ (Heckman & Kautz, 2012), but these terms lack clarity, with the additional caveat that belief-orientated concepts (e.g. intrinsic motivation or growth mindset) are not included in accompanying definitions. The term used in this review, SPECTRUM (Social, Psychological, Emotional, Concepts of self, and Resilience: Understanding and Measurement), represents an umbrella term in which overlapping conceptual domains (e.g. self-esteem, social and emotional competence, motivation) are united. A conceptual domain is defined as a skill, behavior, competence, or attribute that is recognised in academic literature. To qualify, a conceptual domain must demonstrate ‘terminological consensus’; i.e., several authors and papers discuss the same array of skill, behavior, competence or attribute. In literature, conceptual domains are often broad, and are partially defined by the inclusion of subdomains (i.e. separate elements that

4
make a ‘whole’). A good example is ‘Social and Emotional Competence’ which is widely agreed to describe the subdomains of self-management; self-awareness; social awareness; relationship skills; and responsible decision making (CASEL.org). The SPECTRUM review framework represents a composite of identified domains (and their subdomains), with a focus on practical application in the evaluation of educational interventions. This provides a balance between inclusiveness, specificity and utility. The SPECTRUM domains for inclusion were identified through a literature search. Relevant literature was derived from 4 main sources: (i) the authors’ knowledge and understanding of the field; (ii) key literature identified by the EEF (specifically Gutman and Schoon, 2013); (iii) key public policy and literature from other organisations (e.g. Early Intervention Foundation); and (iv) literature searches utilising relevant databases (e.g. PsycINFO) and journals.
1. Identified concepts are part of, or can be associated with, domains identified in the Gutman and Schoon (2013) review;
2. Identified concepts form part of an established conceptual domain (e.g. social and emotional comptence) that has theoretical and/or demonstrable links to school outcomes or later life success such as labour market outcomes (i.e. skills recognised as contributing to individual or aggregated economic performance – for instance, motivation is linked to greater productivity (Brunello & Schlotter, 2011); and
3. Identified concepts do not directly encapsulate academic abilities or skills. The following domains are included within SPECTRUM:
Diagram 1. SPECTRUM domains & subdomains

5
Arrows indicate inter-connections between domains and subdomains. For instance, many of the ideas and terminologies are shared between emotional intelligence and social and emotional competence. The reality is far more complex than necessarily indicated in the above diagram (for instance, there is much discussion around how truly unique several concepts are and whether concepts are related or are causational); however, the diagram serves as an indicative indication of the major areas (and overlap) encapsulated under SPECTRUM. Further information about how the SPECTRUM domains were established through the conceptual mapping exercise can be seen at www.spectrum-review.info. For a more comprehensive definition of each domain, see Appendix 1 (also available within the online SPECTRUM database). CAVEATS As with any review, it is worth considering the inherent caveats, in order to better understand the use and limits of this resource.
First, it is worth noting that SPECTRUM, although encompassing a wide range of measures, cannot be considered fully exhaustive. Indeed, key domains of behavioural and mental health difficulties (as examples) are omitted from this review on the basis of conceptual scope and the existence and strength of previous reviews (for example, see Deighton et al., 2014).
Second, there must be caution in selecting domains within the SPECTRUM ‘umbrella’. As briefly discussed above, there are many overlapping terms, and this conceptual ambiguity is translated into measurement. This difficulty is known as the ‘jingle-jangle fallacy’. This refers to the erroneous assumptions that two different things are the same because they bear the same name (jingle fallacy). For example, the term ‘emotional intelligence’ is not an umbrella term, but is used by different authors to describe different, often divergent, theoretical constructs. The jangle fallacy refers to instances where two identical or almost identical things are different because they are labelled differently. For example, ‘emotional self-efficacy’ and ‘emotional literacy’ have been considered as synonymous terms. Within the SPECTRUM database, measures are ascribed to their underlying theoretical frameworks, descriptions of which have been summarized in Appendix 1. This helps address ‘jingle terms’. Measures that share overlap between categories (i.e. ‘jangle terms’) are included under all appropriate domains. However, it is worth being mindful of the co-occurrence (jangle) and inter-changeability (jingle) of concepts when deciding ‘what’ is being measured.
Finally, it is important to briefly note that the included domains do not necessarily indicate what is important for education (though each domain is associated with favourable academic and/or labour market outcomes), only what is measurable. This is suitable summarised in the adage, “everything that can be counted counts, and not everything that counts can be counted” (Cameron, 1963, p.13).

6
Section 2: Selecting measures An important consideration at the outset is to ensure clarity of purpose, as this affects selection, administration and interpretation of measures. SPECTRUM measures may be used for a variety of purposes, including (but not limited to): - Evaluation of interventions - General accountability and practice improvement - Screening and identification
Differing purposes will have different requirements for measurement. For instance, evaluation will likely require relatively large numbers of pupils completing measures, and therefore ease of implementation (including cost/affordability) may be an important requirement. General accountability may require detailed information, in which specificity and scope of measure is important. Screening and identification will require carefully calibrated and sensitive tools that are able to detect individual differences between pupils (however, an important caveat is that very few of the instruments identified in the SPECTRUM review are suitable for ‘identifying’ children with ‘abnormal’ levels of the outcome domains in question, given the scope of the review discussed above). MEAUREMENT PROPERTIES It is important to note that there is no perfect solution or single, ideal measure. Often goals are mutually exclusive (e.g. the desire for a measure that provides accurate and detailed information about a child but does so with a small number of individual items, or a measure that is well validated and provides support in the scoring and interpretation but is also free or cheap to administer). Instead, there are a number of considerations (and often compromises) to best suit a given context and purpose, several of which are discussed in this guide and the accompanying online SPECTRUM database. In addition to establishing a clear purpose for using SPECTRUM measures, it is useful to briefly consider some of the ways in which measures
1 differ in order to compare available
instruments. One useful distinction we can make is between the ‘psychometric properties’ and ‘implementation properties’ of available measures. These are outlined in the diagram on the following page.
1 Many different terms are used to denote ‘measurement’ e.g. instrument, questionnaire, survey, test, battery… etc.
Although there are technical differences (e.g. ‘test’ denotes right/wrong answers, in comparison to opinion- or belief-based approaches), the terms are often used interchangeably. For the purposes of clarity, ‘measure’ will be used to reflect the broad gamut of terminology. For further information, readers are directed to Robson, C., & MCartan, K. (2016). Real world research (4
th ed.). Chichester: John Wiley & Sons Ltd

7
Diagram 2. Useful properties of measures
Psychometric Properties2
Offers consistent, repeatable and reliable results with little error
Good reliability ensures an accurate response – e.g. if asked to complete the measure twice, a pupil would give the same response. This can be assessed through test-retest reliability (which does exactly that). (Relevant categories in the online database: Cronbach’s α, test retest, inter-rater reliability (where appropriate)
Items and scales accurately represent the measure's domain
This is an assessment of a measure’s validity. This is assessed in different ways, for instance through an examination of its internal structure (construct validity), or by using it across different ages and contexts. This also aids generalisability. (Relevant categories in the online database: EFA, CFA,
2 Several of the technical terms used in assessing psychometric properties are used inter-changeably between
researchers, and there is not always a clear distinction between them depending on the purpose of the measure. For instance, two tests of emotional intelligence can be compared to see whether the measures are similar (convergent validity) or different (divergent validity), depending on the underlying construct or domain. An authoritative and effective summary of the different types of reliability and validity can be seen in the COSMIN checklist manual (Mokkink et al., 2012). Although designed to offer improvements in the standards used to select health measures, the COSMIN criteria are equally applicable to measurement in other fields.
Implementation properties
Psychometric properties
Choice of measure
Low cost or free to use
Quick and easy to
adminster
Can be easily scored
and interpreted
Has strong utility i.e. provides helpful results
Can be used by multiple
respondents Has close theoretical fit
with the concept under
investigation
Responsive to change
Compares well to similar
measures
Items and scales
accurately represent the
measure's domain
Offers consistent, repeatable and reliable results with little error

8
construct validity)
Compares well to other, similar measures
Another assessment of validity is one where measures are compared to already existing ‘gold standard’ measures (criterion) or other measures (concurrent) to see if they compare favourably. (Relevant categories in the online database: criterion validity, concurrent validity, predictive validity)
Responsive to change Dependent on the intended purpose and domain, measures can be used to identify ‘meaningful change’ (e.g. above a threshold for intervention). See Section 4 for more detail. (Relevant categories in the online database: responsiveness)
Has close theoretical fit with the concept under investigation
The content of the measure should fit the purpose of the measurement. (Relevant categories in the online database: criterion validity; concurrent validity)
Implementation properties
Low cost or free to use Measures that are not freely available may have different charging structures. For instance, there may be a ‘one off’ and/or ‘per use’ fee. Sometimes the fee is dependent on the format (e.g. by paper or online) or use (e.g. for research), and should be checked prior to use. (Relevant categories in the online database: cost single purchase, cost per child)
Quick and easy to administer Complexity and length of measures are a worthwhile consideration, especially as boredom or attrition (not completing all the questions) can negatively affect subsequent interpretation. (Relevant categories in the online database: length, time taken to complete)
Can easily be scored and interpreted
Complex scoring methods (e.g. requiring judgement or reference to complex scoring sheets) can be a ‘hidden cost’ and should be considered when selecting appropriate measures. (Relevant categories in the online database: scoring)
Has strong utility (i.e. provides helpful results)
The results should have some meaning and use to the various stakeholders involved, i.e. what does a ‘good / bad’ score mean? (Relevant categories in the online database: UK Norms)
Can be used by multiple respondents
There can be advantages from gathering results from several viewpoints (e.g. parent / teacher / peer). See Section 3 for more detail. (Relevant categories in the online database: respondent)

9
The SPECTRUM database offers ‘star ratings’ for both psychometric and implementation properties, which provide a broad indication as the quality of the measure in these two respects. More details can be seen in Appendix 2 and online at www.spectrum-review.info. However, there is rarely a ‘one size fits all’ approach, and quality can also be judged on suitability as to the purpose of the intended task. RESPONSE BIAS IN MEASURES Response bias describes any situation in which respondents are influenced away from accurate or truthful responses. It has long been known (e.g. Bernreuter, 1933) that the assessment of SPECTRUM domains (e.g. ‘soft’ or ‘non-cognitive’ domains) poses unique problems around response bias intrinsically associated with the mode of measurement. In comparison to the straightforward dichotomy of measuring ‘right or wrong’ responses (known as ‘maximal performance’, and evident in academic achievement tests), assessments of opinion or beliefs do not offer an inherently ‘correct’ response (known as ‘typical performance’ because respondents rate what is usual for them). Typical performance measures are therefore potentially susceptible to various response biases that can negatively affect reliability and validity (Paunonen & LeBel, 2012). Examples of response bias include socially desirable responding, role faking, and making alternative responses based on your participation in a study or experiment (also known as demand characteristics). There are other sources of bias that require consideration, which are discussed below. Reference bias: This describes a difficulty where there is little or no ‘anchor’ to any objective outcome for measurement, most typically occurring when asking about beliefs or attitudes. For instance, a typical item might be “I am a very kind person” (scale of 1 – 10). There is little objective definition of what a score of 10 would involve, and therefore people must interpret their own definition of kindness. Reference bias occurs as definitions are typically drawn from comparison to other people – i.e. the question is likely interpreted, as “on a scale of 1-10 how kind am I in comparison to my immediate reference group”. If different groups have different standards or reference points, then comparison across groups can lead to misleading results. This is mostly evident in international comparisons (rather than local comparators – e.g. different schools), as the topics being measured are broadly understood within national cultural boundaries (see Mõttus et al., 2012 for an example). Therefore, if seeking a normative value for a given measure, priority should be given to UK-based studies where possible (indicated as ‘UK Norms’ in the SPECTRUM database). Socially desirable responding: This describes the phenomenon whereby a respondent is more likely to select responses that are more positive or desirable than warranted by their corresponding traits or behaviours. For instance, a respondent may rate him/herself very highly on a scale of pro-social behaviour, yet rarely feel or demonstrate the type of behaviours associated with this (e.g. thinking of others or sharing). This may be a conscious, deliberate act – e.g. trying to make a good impression on those who might eventually see his or her responses. Socially desirable responding may also be subconscious. For instance, positive responding may represent a latent need for self-enhancement (“I want to be this person”) or ego maintenance (“it is important to me to think I am this person”) (Paulhus, 2002). Role faking: A similarly conscious approach might involve ‘role faking’ (Kroger, 1967) in which items are selected on the basis of the respondent’s role. For instance, although a respondent may have little personal desire to be seen as a ‘good pupil’, they may select positive responses to items such as ‘listens well, does their homework, answers questions’ as this is a representation of what they perceive as their expected role. This is different to socially desirable responding, as the respondent may not necessarily place importance on the given outcome domain (e.g. it is not important for their own ego or necessarily important that others view them as scoring highly in these areas), but rather that they ‘confirm’ the role expected of them.

10
Demand characteristics: This phenomenon is described as occurring when respondents alter their answers simply because they are part of a study or experiment (Orne, 1962). Several theories have been put forward to suggest why a response bias may occur under these circumstances, including a general desire to be a ‘good participant’ (similar to socially desirable responding) (Nichols & Maner, 2008) or that insight into the purpose or nature of the experiment may lead respondents to answer in favour of their preferred hypothesis (e.g. responding more positively because they believe they are in the experimental group of an intervention which they favour) (Cook et al., 1970). Regardless of the motivation, response biases represent potential threat to the reliability and validity of measures, and efforts for remediating or removing biases should be considered. There are two approaches to addressing these difficulties (Nederhof, 1985). The first concerns the instrument itself. Elements to address potential response biases should already be ‘built in’ to the measure and should result in stronger ratings of reliability and validity, though there are few definitive ways to know if this true (rather, this approach reflects ‘best practice’ in measure design). Measures with strong ratings of reliability and validity have a better star rating for ‘Psychometric Properties’ in the SPECTRUM database. The second approach lies in the hands of the administrator, specifically the selection of the measure and the context of its implementation. Considerations around final measure selection are briefly given below, and additional consideration regarding implementation are covered in the next section. TYPICAL AND MAXIMAL MEASURES One obvious solution to concerns around response biases associated with typical performance measures might be the selection and use of maximal measures. Typical performance measures are characterised by opinion- or belief-based items (typically on a Likert scale). These are usually prefaced with instructions such as “there is no right or wrong answer” and include items such as “I like to think of myself as a kind person”. Maximal measures are characterised by having ‘objectively’ correct and incorrect answers (e.g. when presented with a scenario such as being caught stealing, respondents can select their likely response, e.g. a) run away: b) deny everything; c) return the stolen item and apologize). However, several caveats should be noted. First, maximal measures are usually much more complex to assess and score (Willhelm, 2005). Second, they reply on both expert and consensus opinion when identifying a “correct” score. This poses difficulties as beliefs and behavioural norms differ widely between cultures and contexts. Third, the correlation between maximal and typical measures tends to be very small. For instance, Bracket and Mayer (2003) found a correlation of only 4% between a typical and maximal measure of emotional intelligence. This raises questions as to what exactly is being measured. Fourth, there is the matter of availability; although included in the database where possible, many domains do not have maximal-type measures available. DEVELOPMENTAL AGE Measures within SPECTRUM domains are typically self-report (i.e. completed by the child). This offers a practical advantage as it is significantly less burdensome for individual children to complete measures, compared to alternatives such as a teacher reporting on each child in their class (see below). Furthermore, children are arguably in the best place to reflect on their own thoughts and feelings through introspection. However, for many of the SPECTRUM domains (e.g. ‘concepts of self’), patterns of self-report follow developmental trajectories, with responses being dependent on the child’s current understanding and abilities regarding introspection. Older children and adolescents are likely to be more accurate in their self-reflections compared to younger children (Denham, 2005). There is a tendency for young children to provide responses to the ‘here and now’ (Wigelsworth, Humphrey, Kalambouka, & Lendrum 2010). For instance, a child is more likely to give a low response to item such as “I get along well with others”, if they have recently fallen out with a friend, even if they typically do get on well with others.

11
There is discussion in the literature regarding the minimum acceptable age by which children are able to provide accurate self-reports. There has been some suggestion that children as young as 5 can describe their internal mental states regarding perceptions, emotions, and cognitions (Stone & Lemanek, 1990). However, more recent work implies that for valid and reliable responses, this may be seen in children from approximately 8 years of age (Deighton et al., 2012; Truman et al., 2003). Overall, the success of a measure is very much dependent on the use of carefully validated and age appropriate measures, and therefore additional consideration of a measure is advised if relying on self-report in younger age groups. CHOICE OF RESPONDENT Alternative and complementary options include obtaining information from parents, teachers, and/or peers. Different perspectives are advantageous as they offer additional information drawn from distinct frames of reference. For instance, parents have access to detailed information about a child’s behaviour at home. However, each respondent type also has discrete limitations. Parental responses are typically very difficult to obtain (reported at less than 50% response compared to pupil or teachers; Humphrey et al., 2008). Depending on the purpose of the data collection, such response rates can represent a significant risk to data quality and/or an expensive and time-consuming activity in ensuring sufficient response rates. Teachers and other school staff may be seen as another useful source of information about a child. Teachers benefit from their collective experience with other children as a frame of reference. However, more experienced teachers have been seen to give children higher ratings (Denham, 2005). It is also important to consider the collective data burden, as a teacher may be responsible for 30 or more children, and there is likely a corresponding loss of accuracy in a given measure when the same member of staff must complete this for each student. Another option is the use of peer data, in which children are asked to rate their classmates on relevant attributes (e.g. Asher, 1985), or nominate those with particular characteristics. Peer ratings provide a unique perspective at the child level in which responses are formed from many interactions and events to which parents or teachers are not privy (Frederickson & Cline, 2009). However, such methods are less well established in many of the SPECTRUM domains and can still be subject to the issues of response bias discussed above. A final consideration is the use of multi-rater assessment. As no single respondent can provide a flawless assessment, strengths and limitations of each may be balanced out through triangulation of data through the collection of data from a combination of child, parent and/or teachers. This is particularly pertinent for assessments in younger children where self-report may be problematic (see above). Examples include the ELAI (Faupel, 2003), the ‘Social Skills Improvement System’ (SSIS) (Gresham & Elliott, 2008), and range of assessments used with the Incredible Years interventions (http://incredibleyears.com/for-researchers/measures/). However, the limited availability of multi-informant measures, as well as the additional cost and resource implications regarding their deployment, must be considered. In addition, there is typically low concurrence between respondents (for example, Humphrey et al., 2008) found as little as 6% shared agreement), meaning it is important to consider whose perspective is prioritised. For a fuller consideration of the topics raised in this section, readers are directed to Wigelsworth, Humphrey, Kalambouka and Lendrum (2010).

12
Section 3: Administration Having selected an appropriate measure (or measures) for use, there are a number of considerations regarding optimal presentation and administration, which are outlined in this section. PRE-ADMINISTRATION – PREPARING AND PRESENTING ITEMS Many measures are ready ‘out of the box’, providing administration instructions and packs for deployment, with some even offering online access to websites that offer scoring and interpretation services. Unsurprisingly, the cost of the measure is often proportionate to the services offered. Also, such services may not always be fit for purpose or context (e.g. online vs. paper) and may be restrictive, dependent on the intended purpose for the measurement. For instance, online only services may not be useful (dependent on the available IT provision within a school) and some services may offer interpretation services (such as individual pupil summaries) but will not offer to return individual item scores, which prevents further analysis. Some measures are not provided as ready ‘out of the box’, instead there may be varying degrees of preparation required prior to administration. As a minimum, all measures will have a list of items or questions and accompanying brief instructions about how the scoring should be presented (e.g. ‘for all items, these should be presented with a 3-point Likert scale; 0 = not like me, 1 = a bit like me; 2 = a lot like me’). It is then the responsibly of the person ultimately administering the measure to prepare suitable administration instructions and to prepare and format the presentation of the measure (e.g. placing the items into a list or table, ensuring each item has a corresponding Likert scale to respond to, etc.). Where there is ambiguity in preparing and presenting measures (i.e. there are not clear instructions or restrictions in a measure’s user manual), the FAQs below are designed to address common questions. However, the best source of information is typically the measure’s author or publisher. - If the measure is provided on paper, can I put it online?
In some cases, it may be beneficial to have a measure that is easily accessible online. Firstly, it is important to check whether there are licence restrictions on copyrighted measures. For instance, the Strengths and Difficulties Questionnaire (SDQ) (sdqinfo.org) is free-for-use in paper format, but one-off and per-pupil use charges are applied for online use. There are also restrictions on how the instrument may be presented online. Secondly, for copyright-free measures there are number of considerations. Will putting a measure online affect its reliability and/or validity? Literature indicates that, providing that the online form is faithful to any paper-based counterpart (e.g. as little change as possible has been made and all provided administrative instructions are still able to be followed – see Choi and Pak (2005) as an example for how to present items) then the risk to reliability and/or validity is negligible (Yun & Trumbo, 2000). There are also considerations of response rate and representation. Regarding response rate, literature indicates a greater attrition or ‘drop out’ for online measurement (most often associated with methodologies such as email links, rather than in-class computer-based assessments, dependent on who the respondent is) (see Nulty, (2008), and this should be taken into consideration when considering the purpose of the measurement. Regarding representation, expanded availability and use of internet services means that wider populations are reached, but it may be worth considering whether all intended recipients (e.g. parents) are equally equipped and satisfied to use this mode of data collection. A final consideration is that of security – the use of online platforms for data collection do not negate the importance of keeping personal data secure.

13
- Can I change the wording of the questionnaire? This is generally not recommended except in limited cases where culture-specific language may cause confusion in the understanding the question. For instance, it may be permissible to change “sidewalk” for “pavement”. Questionnaire design includes the careful consideration of neutrally worded items to avoid bias, and small (seemingly innocent) changes can create bias, affecting the quality of the measure and the usefulness of the results (Choi & Pak, 2005).
- Can I remove individual items? Sometimes there is a desire to remove items that may be considered potentially unsettling or inappropriate (e.g. “when I am lonely, I think about death”). Understandably, this may allow a questionnaire to better suit a particular audience or context, however this is at the cost of the reliability and validity of the measure and therefore subsequent usefulness of the scoring (which would, in any case, need to be edited to allow for less items). Instead, it is advisable to check the acceptability of the questionnaire with respondents and/or (in the case of children) parent/guardians by providing an example item as part of the consent procedure.
- Can I use only a select number of items?
Similar to the above, it may be considered useful to select or score only particular items. This has an obvious and serious detriment to the reliability and validity of the questionnaire. The only exception to this is the select use of subdomains. Where questionnaires are ‘multi-dimensional’ i.e. offer multiple scores for different subsets of a concept (for instance, the ‘Social Skills Improvement System’ (SSIS) offers scores of 15 different subdomains including communication, bullying, and motivation to learn) it may be permissible to use only the subdomains that are considered relevant to the intended purpose of measurement. This helps keep measures short, ensuing participants do not become bored. However, restrictions can apply (for instance, online use of the SDQ must be administered in its entirety) and can negate the use of composite scores. For instance, both the ‘Conner-Davidson Resilience Scale’ (CD-RISC) and the ‘College Achievement Inventory’ (CAI) contain subdomains but must be completed in their entirety. It is therefore best to check that the instrument is suitable for use in this manner. To be clear, it is not recommended that individual items are picked from across measures to create a composite measure. - Can I change the order of the questions?
Measures typically change the order of questions, randomising the presentation of individual items to help ensure participants respond to each question, rather than responding with the same score they gave the last item. Some online measures randomise the presentation of items in each sitting, helping to reduce practice effects. However, if using more than one measure it is not recommended to randomise items across measures. This can cause confusion in the scoring and understanding of items. Instead, a method of ‘counterbalancing’ is recommended. This is where individual respondents are given measures in different orders. For instance, if pupil A completes a social skills measure followed by a bullying measure, then pupil B should complete the bullying measure first, followed by social skills. - Can I give the measure to a younger or older age than recommended?
As noted previously, instruments are sensitive to the developmental ages of their intended respondents (Denham, 2005). Accordingly, using a measure with a younger or older audience may result in potentially inaccurate results as neither the language of instrument or the concepts being examined (e.g. emotional self-awareness) are suitable. There is obviously some leeway in a precise cut-off meaning there may be a range of children around the cut-off that can access (or not access) a given measure. This is also worth considering when estimating how long measure completion may take. If alternative or better-suited measures (including peer, teacher or parent report options) are not available, then additional support may be required (e.g. having items read out and/or difficult words explained on request).
14
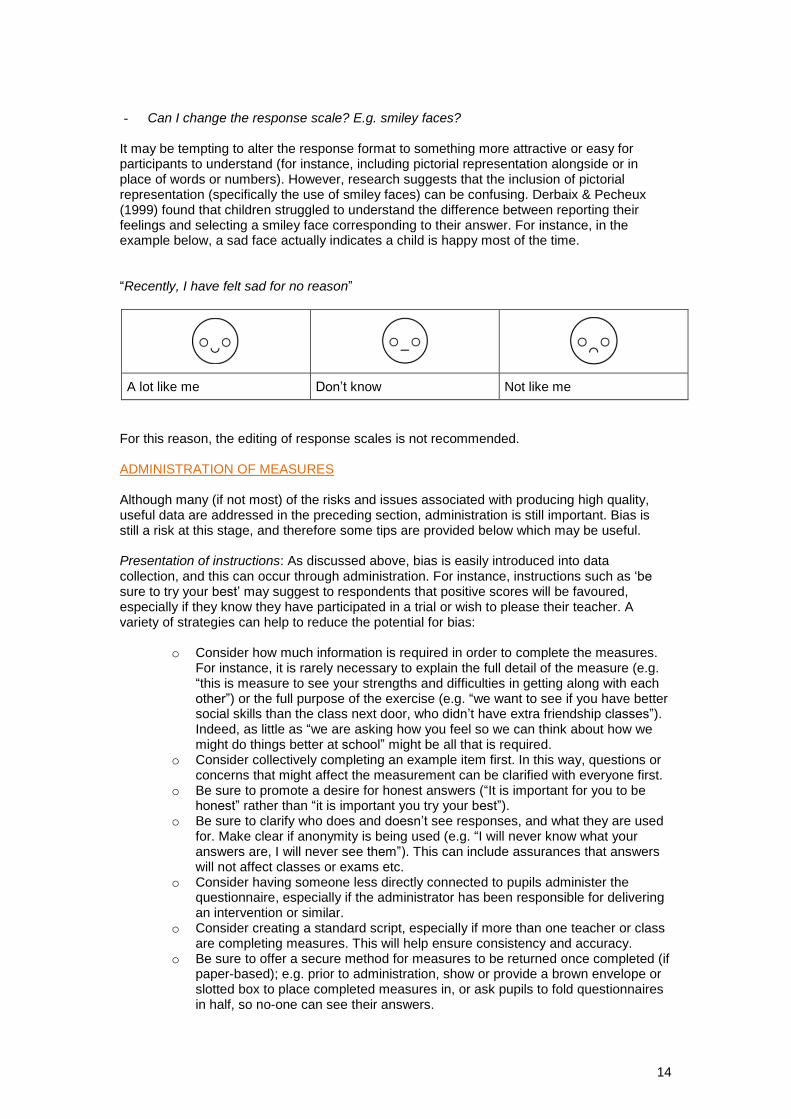
- Can I change the response scale? E.g. smiley faces?
It may be tempting to alter the response format to something more attractive or easy for participants to understand (for instance, including pictorial representation alongside or in place of words or numbers). However, research suggests that the inclusion of pictorial representation (specifically the use of smiley faces) can be confusing. Derbaix & Pecheux (1999) found that children struggled to understand the difference between reporting their feelings and selecting a smiley face corresponding to their answer. For instance, in the example below, a sad face actually indicates a child is happy most of the time. “Recently, I have felt sad for no reason”
A lot like me Don’t know Not like me
For this reason, the editing of response scales is not recommended. ADMINISTRATION OF MEASURES Although many (if not most) of the risks and issues associated with producing high quality, useful data are addressed in the preceding section, administration is still important. Bias is still a risk at this stage, and therefore some tips are provided below which may be useful. Presentation of instructions: As discussed above, bias is easily introduced into data collection, and this can occur through administration. For instance, instructions such as ‘be sure to try your best’ may suggest to respondents that positive scores will be favoured, especially if they know they have participated in a trial or wish to please their teacher. A variety of strategies can help to reduce the potential for bias:
o Consider how much information is required in order to complete the measures. For instance, it is rarely necessary to explain the full detail of the measure (e.g. “this is measure to see your strengths and difficulties in getting along with each other”) or the full purpose of the exercise (e.g. “we want to see if you have better social skills than the class next door, who didn’t have extra friendship classes”). Indeed, as little as “we are asking how you feel so we can think about how we might do things better at school” might be all that is required.
o Consider collectively completing an example item first. In this way, questions or concerns that might affect the measurement can be clarified with everyone first.
o Be sure to promote a desire for honest answers (“It is important for you to be honest” rather than “it is important you try your best”).
o Be sure to clarify who does and doesn’t see responses, and what they are used for. Make clear if anonymity is being used (e.g. “I will never know what your answers are, I will never see them”). This can include assurances that answers will not affect classes or exams etc.
o Consider having someone less directly connected to pupils administer the questionnaire, especially if the administrator has been responsible for delivering an intervention or similar.
o Consider creating a standard script, especially if more than one teacher or class are completing measures. This will help ensure consistency and accuracy.
o Be sure to offer a secure method for measures to be returned once completed (if paper-based); e.g. prior to administration, show or provide a brown envelope or slotted box to place completed measures in, or ask pupils to fold questionnaires in half, so no-one can see their answers.

15
During completion: Opportunities for bias still exist during the completion of measures. Considerations for ensuring accurate and successful data collection include:
o Making sure that for the duration of the data collection, there are no unnecessary disturbances or interruptions.
o For class-based administrations, ensure pupils have adequate space to answer their own questions in private, without discussing responses with others.
o If providing help for pupils (or for pupils with additional support) ensure that this is restricted to defining terms or providing examples only. Indeed, piloting a measure to identify commonly misunderstood or ambiguous words that can be defined on a standardised ‘crib sheet’ held by the administrator is a useful approach. Discussion or providing suggestions for the pupils to respond to are not recommended.
16
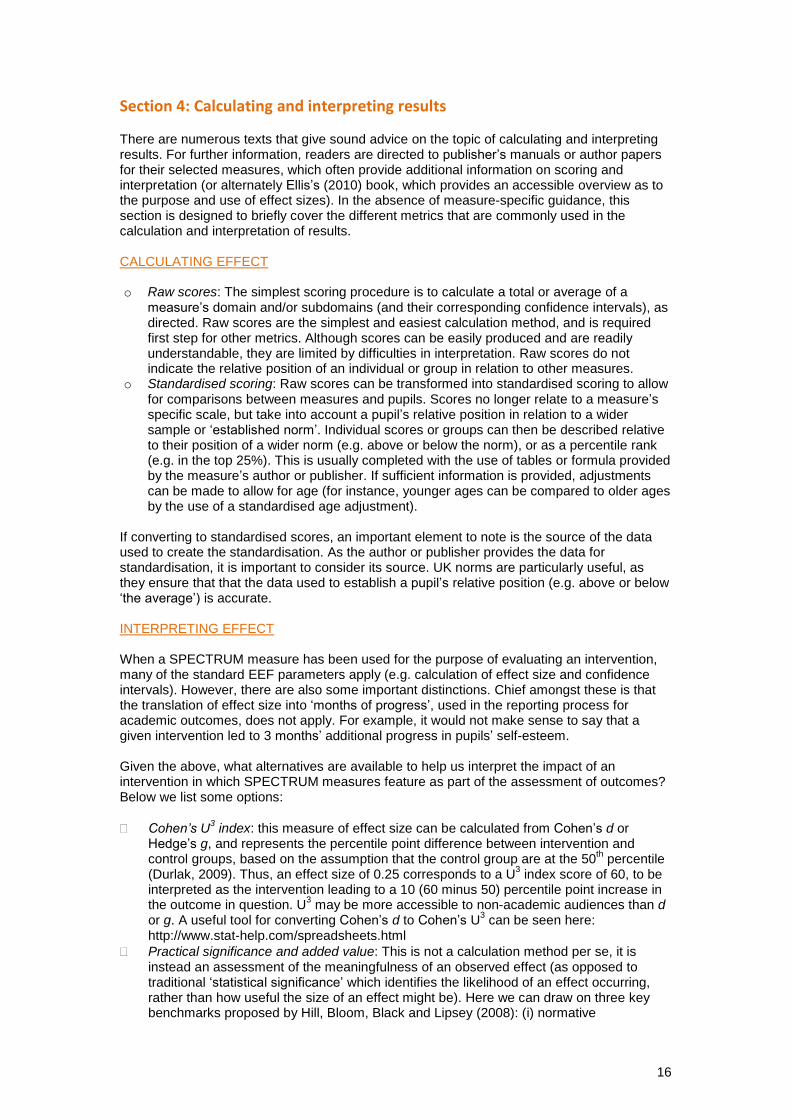
Section 4: Calculating and interpreting results There are numerous texts that give sound advice on the topic of calculating and interpreting results. For further information, readers are directed to publisher’s manuals or author papers for their selected measures, which often provide additional information on scoring and interpretation (or alternately Ellis’s (2010) book, which provides an accessible overview as to the purpose and use of effect sizes). In the absence of measure-specific guidance, this section is designed to briefly cover the different metrics that are commonly used in the calculation and interpretation of results. CALCULATING EFFECT o Raw scores: The simplest scoring procedure is to calculate a total or average of a
measure’s domain and/or subdomains (and their corresponding confidence intervals), as directed. Raw scores are the simplest and easiest calculation method, and is required first step for other metrics. Although scores can be easily produced and are readily understandable, they are limited by difficulties in interpretation. Raw scores do not indicate the relative position of an individual or group in relation to other measures.
o Standardised scoring: Raw scores can be transformed into standardised scoring to allow for comparisons between measures and pupils. Scores no longer relate to a measure’s specific scale, but take into account a pupil’s relative position in relation to a wider sample or ‘established norm’. Individual scores or groups can then be described relative to their position of a wider norm (e.g. above or below the norm), or as a percentile rank (e.g. in the top 25%). This is usually completed with the use of tables or formula provided by the measure’s author or publisher. If sufficient information is provided, adjustments can be made to allow for age (for instance, younger ages can be compared to older ages by the use of a standardised age adjustment).
If converting to standardised scores, an important element to note is the source of the data used to create the standardisation. As the author or publisher provides the data for standardisation, it is important to consider its source. UK norms are particularly useful, as they ensure that that the data used to establish a pupil’s relative position (e.g. above or below ‘the average’) is accurate.
INTERPRETING EFFECT When a SPECTRUM measure has been used for the purpose of evaluating an intervention, many of the standard EEF parameters apply (e.g. calculation of effect size and confidence intervals). However, there are also some important distinctions. Chief amongst these is that the translation of effect size into ‘months of progress’, used in the reporting process for academic outcomes, does not apply. For example, it would not make sense to say that a given intervention led to 3 months’ additional progress in pupils’ self-esteem. Given the above, what alternatives are available to help us interpret the impact of an intervention in which SPECTRUM measures feature as part of the assessment of outcomes? Below we list some options:
Cohen’s U3 index: this measure of effect size can be calculated from Cohen’s d or
Hedge’s g, and represents the percentile point difference between intervention and control groups, based on the assumption that the control group are at the 50
th percentile
(Durlak, 2009). Thus, an effect size of 0.25 corresponds to a U3 index score of 60, to be
interpreted as the intervention leading to a 10 (60 minus 50) percentile point increase in the outcome in question. U
3 may be more accessible to non-academic audiences than d
or g. A useful tool for converting Cohen’s d to Cohen’s U3 can be seen here:
http://www.stat-help.com/spreadsheets.html
Practical significance and added value: This is not a calculation method per se, it is instead an assessment of the meaningfulness of an observed effect (as opposed to traditional ‘statistical significance’ which identifies the likelihood of an effect occurring, rather than how useful the size of an effect might be). Here we can draw on three key benchmarks proposed by Hill, Bloom, Black and Lipsey (2008): (i) normative

17
expectations for change (e.g. how does the effect of the intervention compare to an equivalent period of growth for a given target population of pupils?); (ii) policy-relevant performance gaps (e.g. does the effect of an intervention attenuate existing differences among particular groups of pupils, such as those from poorer vs more affluent backgrounds?); and (iii) observed effect sizes for similar interventions (e.g. how do the effects of an intervention compare to those from previous studies?).
Clinically significant change: of particular importance for targeted interventions, we can also ask, ‘is the amount of change observed socially and/or clinically meaningful?’ A fundamental principle of clinically significant change is the extent to which individuals have moved from the ‘dysfunctional population’ to the ‘functional population’ on a given measure (Evans, Margison, & Barkham, 1998). So, for example, one might examine the relative probability of the ‘Social Skills Improvement System’ (SSIS) scores of pupils undergoing a targeted intervention moving from the ‘well-below’ or ‘below’ average ranges when compared to a control group.
Reliable change: we might also ask, ‘is the amount of change beyond that which we might expect to result from measurement error? Here we consider whether the amount of movement observed exceeds a pre-specified threshold that means that it is likely to be genuine change as opposed to error associated with the fallibility of the outcome measure (Jacobson & Truax, 1991). For the SDQ total difficulties scale, for example, research has indicated that change greater than 8.66 can be considered reliable (Edbrooke-Childs, Jacob, Law, Deighton, & Wolpert, 2015). Reliable change can be calculated by subtracting an individual’s post-test and pre-test scores (i.e. the amount of change before and after an intervention), and dividing by the standard error of the difference of the test (i.e. how much the measure varies due to measurement error). A downloadable excel file designed to help calculate reliable change can be found here: https://www.psychoutcomes.org/OutcomesMeasurement/ReliableChangeIndex
.
Conclusions: A final word of caution
A final, but critically important, consideration is to remind users that measures do not ‘diagnose’. Although data from SPECTRUM measures can offer useful insights, to interpret these as strongly indicative or conclusive of diagnosis or difficulty among respondents is a haphazard enterprise at best. The degree of information required for diagnoses of difficulties goes far beyond what is available in even the most rigorous and clearly specified measures. Any diagnosis should be provided by appropriate educational and clinical judgement. Even the most well-validated instruments invariably suffer from innate measurement issues associated with this mode of enquiry, and will always require additional consideration that can only be provided by appropriate educational and clinical judgement. Referring back to the history of the development of measurement, Alfred Binet (Binet & Simon, 1905, cited in Gould, 1996) wrote that measurement scores are practical devices that do not define anything innate or permanent, do not measure any refined concept, and should not be used to mark a child as incapable (even for purposes of remediation). Instead, measurement is one tool of many in an educator’s (or academic’s) toolkit.

18
References and further reading Andrews, J., Saklofske, D. & Janzen, H. (Eds.). (2001). Handbook of psychoeducational
assessment: Ability, achievement and behaviour in children. San Diego, CA: Academic Press.
Arthur, J., Harding, R., & Godfrey, R. (2009). Citizens of character: The values and character dispositions of 14-16 year olds in the Hodge Hill constituency. Birmingham, United Kingdom: University of Birmingham/Learning for Life.
Arthur, J., Powell, S., & Lin, H.-C. (2014). Foundations of character: Methodological aspects of a study of character development in three- to six-year-old children with a focus on sharing behaviours. European Early Childhood Education Research Journal, 22, 105–122. doi:10.1080/1350293X.2012.707413
Asher, S. R. (1985). An evolving paradigm in social skills training research. In B. H. Schneider, K. H. Rubin & J. E. Ledingham (Eds.), Children’s peer relations: Issues in assessment and intervention (pp. 157–174). New York, NY: Springer.
Bernreuter, R. G. (1933). The measurement of self-sufficiency. The Journal of Abnormal and Social Psychology, 28, 291–300. doi:10.1037/h0071005
Brackett, M., & Mayer, J. (2003). Convergent, discriminant, and incremental validity of competing measures of emotional intelligence. Personality and Social Psychology Bulletin, 29, 1–12. doi:10.1177/0146167203254596
Brunello, G., & Schlotter, M. (2011). Non cognitive skills and personality traits: Labour market relevance and their development in education & training systems (discussion paper no. 5743). Bonn, Germany: Institute for the Study of Labour.
Cameron, W. (1963). Informal sociology: a casual introduction to sociological thinking. New York, NY: Random House.
Choi, B. C. K., & Pak, A. W. P. (2005). A catalog of biases in questionnaires. Preventing Chronic Disease, 2, A13.
Cook, T. D., Bean, J. R., Calder, B. J., Frey, R., Krovetz, M. L., & Reisman, S. R. (1970). Demand characteristics and three conceptions of the frequently deceived subject. Journal of Personality and Social Psychology, 14, 185–194. doi:10.1037/h0028849
Deighton, J., Croudace, T., Fonagy, P., Brown, J., Patalay, P., & Wolpert, M. (2014). Measuring mental health and wellbeing outcomes for children and adolescents to inform practice and policy: A review of child self-report measures. Child and Adolescent Psychiatry and Mental Health, 8, 14. doi:10.1186/1753-2000-8-14
Deighton, J., Tymms, P., Vostanis, P., Belsky, J., Fonagy, P., Brown, A., … Wolpert, M. (2012). The development of a school-based measure of child mental health. Journal of Psychoeducational Assessment, 31, 247-257. doi:10.1177/0734282912465570
Denham, S. A. (2005). Assessing social-emotional development in children from a longitudinal perspective for the National Children’s Study. Columbus, OH: Battelle Memorial Institute.
Derbaix, C., & Pecheux, C. (1999). Mood and children: Proposition of a measurement scale. Journal of Economic Psychology, 20, 571–591. doi:10.1016/S0167-4870(99)00025-2
Duckworth, A. L., & Yeager, D. S. (2015). Measurement matters: Assessing personal qualities other than cognitive ability for educational purposes. Educational Researcher, 44, 237–251. doi:10.3102/0013189X15584327
Durlak, J. A. (2009). How to select, calculate, and interpret effect sizes. Journal of Pediatric Psychology, 34, 917. doi:10.1093/jpepsy/jsp004
Edbrooke-Childs, J., Jacob, J., Law, D., Deighton, J., & Wolpert, M. (2015). Interpreting standardized and idiographic outcome measures in CAMHS: What does change mean and how does it relate to functioning and experience? Child and Adolescent Mental Health, 20, 142–148. doi:10.1111/camh.12107
Ellis, P. (2010). The essential guide to effect sizes: Statistical power, meta-analysis, and the interpretation of research results. Cambridge, United Kingdom: Cambridge University Press.
Evans, C., Margison, F., & Barkham, M. (1998). The contribution of reliable and clinically significant change methods to evidence-based mental health. Evidence-Based Mental Health, 1, 70–72. doi:10.1136/ebmh.1.3.70
Faupel, A. (Ed.). (2003). Emotional literacy: Assessment and intervention. Southampton: Southampton Psychology Services.
Frederickson, N., & Cline, T. (2009). Special educational needs, inclusion and diversity: A
19
textbook (2nd ed.). Maidenhead, United Kingdom: Open University Press. Goleman, D. (1996). Emotional Intelligence: Why it can matter more than IQ. London, United
Kingdom: Bloomsbury Publishing Plc. Gould, S. (1996). The Mismeasure of Man. New York, NY: W.W. Norton & Company, Inc. Gresham, F., & Elliott, S. N. (2008). Social skills improvement system (SSIS) rating scales.
Bloomington, MN: Pearson. Gutman, L. M., & Schoon, I. (2013). The impact of non-cognitive skills on outcomes for young
people. London, United Kingdom: University of London/Education Endowment Foundation
Heckman, J., & Kautz, T. (2012). Hard evidence on soft skills. Labour Economics, 19, 451–464. doi:10.1016/j.labeco.2012.05.014
Hill, C. J., Bloom, H. S., Black, A. R., & Lipsey, M. W. (2008). Empirical benchmarks for interpreting effect sizes in research. Child Development Perspectives, 2, 172–177. doi:10.1111/j.1750-8606.2008.00061.x
Hu, L., & Bentler, P. M. (1999). Cutoff criteria for fit indexes in covariance structure analysis: Conventional criteria versus new alternatives. Structural Equation Modeling: A Multidisciplinary Journal, 6, 1–55. doi:10.1080/10705519909540118
Humphrey, N., Kalambouka, A., Bolton, J., Lendrum, A., Wigelsworth, M., Lennie, C., & Farrell, P. (2008). Primary social and emotional aspects of learning (SEAL): Evaluation of small group work. Nottingham, United Kingdom: DCSF Publications.
Jacobson, N. S., & Truax, P. (1991). Clinical significance: A statistical approach to defining meaningful change in psychotherapy research. Journal of Consulting and Clinical Psychology, 59, 12–19. doi:10.1037/0022-006X.59.1.12
Kroger, R. (1967). Effects of role demands and test-cue properties upon personality test performance. Journal of Consulting Psychology, 31, 304–312. doi:10.1037/h0024657
Levin, H. (2013). The utility and need for incorporating noncognitive skills into large-scale educational assessments. In M. von Davier, E. Gonzalez, I. Kirsch & K. Yamamoto (Eds.), The role of international large-scale assessments: Perspectives from technology, economy, and educational research (pp. 67–86). London, United Kingdom: Springer.
Mischel, W., Ayduk, O., Berman, M. G., Casey, B. J., Gotlib, I. H., Jonides, J., … Shoda, Y. (2011). “Willpower” over the life span: Decomposing self-regulation. Social Cognitive and Affective Neuroscience, 6, 252–256. doi:10.1093/scan/nsq081
Mõttus, R., Allik, J., Realo, A., Pullman, H., Rossier, J., Zecca, G… Ng Tseung, C. (2012). Comparability of self-reported conscientiousness across 21 countries. European Journal of Personality, 26, 303-317. doi:10.1002/per840
Mokkink, L. B., Terwee, C. B., Patrick, D. L., Alonso, J., Stratford, P. W., Knol, D. L., … de Vet, H. C. W. (2012). The COSMIN checklist manual. Amsterdam, The Netherlands: EMGO Institute for Health and Care Research.
Nederhof, A. J. (1985). Methods of coping with social desirability: A review. European Journal of Social Psychology, 15, 263–280. doi:10.1002/ejsp.2420150303
Nichols, A. L. , & Maner, J. K. (2008). The good-subject effect: Investigating participant demand characteristics. The Journal of General Psychology, 135, 151–166. doi:10.3200/GENP.135.2.151-166. PMID 18507315
Nulty, D. D. (2008). The adequacy of response rates to online and paper surveys: what can be done? Assessment & Evaluation in Higher Education, 33, 301–314. doi:10.1080/02602930701293231
Nunnally, J. C. (1978). Psychometric theory (2nd ed.). New York, NY: McGraw Hill. Orne, M. (1962). On the social psychology of the psychological experiment: With particular
reference to demand characteristics and their implications. American Psychologist, 17, 776–783. doi:10.1037/h0043424
Paulhus, D. (2002). Socially desirable responding: The evolution of a construct. In H. Braun, D. Jackson & D. E. Wiley (Eds.), The role of constructs in psychological and educational measurement (pp. 49–69). Mahwah, NJ: Lawrence Erlbaum Associates.
Paunonen, S. V., & LeBel, E. P. (2012). Socially desirable responding and its elusive effects on the validity of personality assessments. Journal of Personality and Social Psychology, 103, 158–175. doi:10.1037/a0028165
Peterson, R. L., & Skiba, R. (2001). Creating school climates that prevent school violence. Clearing House, 74, 155-163. doi:10.1080/00098650109599183
Roberts, R. D., Markham, P. M., Matthews, G., & Zeidner, M. (2005). Assessing intelligence: Past, present, and future. In O. Wilhelm & R. W. Engle (Eds.), Handbook of

20
understanding and measuring intelligence (pp. 333–360). London, United Kingdom: Sage Publications Ltd.
Stone, W. L., & Lemanek, K. L. (1990). Developmental issues in children’s self-reports. In A. M. La Greca (Ed.), Through the eyes of the child: Obtaining self-reports from children and adolescents (pp. 18–56). Needham, MA: Allyn & Bacon.
Truman, J., Robinson, K., Evans, A. L., Smith, D., Cunningham, L., Millward, R., & Minnis, H. (2003). The strengths and difficulties questionnaire: A pilot study of a new computer version of the self-report scale. European Child and Adolescent Psychiatry, 12, 9–14. doi:10.1007/s00787-003-0303-9
Van Rooy, D., Viswesvaran, C., & Pluta, P. (2005). An evaluation of construct validity: What is this thing called emotional intelligence? Human Performance, 18, 445-462. doi:10.1207/s15327043hup1804_9
Wigelsworth, M., Humphrey, N., Kalambouka, A., & Lendrum, A. (2010). A review of key issues in the measurement of children’s social and emotional skills. Educational Psychology in Practice, 26, 173–186. doi:10.1080/02667361003768526
Willhelm, O. (2005). Measures of emotional intelligence: Practice and standards. In R. Schulze & R. D. Roberts (Eds.), Emotional intelligence: An international handbook (pp. 131–154). Cambridge, MA: Hogrefe and Huber Publishers.
Yun, G. W., & Trumbo, C. W. (2000). Comparative response to a survey executed by post, e-mail, & web form. Journal of Computer-Mediated Communication, 6. doi:10.1111/j.1083-6101.2000.tb00112.x

21
Appendix 1: Definitions of SPECTRUM domains
SPECTRUM Domain
Broad-based definition Definition (as identified from the literature)
Motivation, goal orientation and perseverance
How children and adolescents think, feel and behave in relation to pursuing goals. This includes how capable and engaged children and adolescents feel, and their attitude and sense of control when faced with challenges or setbacks.
Motivation: The active pursuit of temporally extended goals involving high-level incentives (power, achievement, and affiliation) and assessing self-reported beliefs and goal striving behaviours. (Braver et al, 2014). Goal orientation: disposition toward developing or demonstrating ability in
achievement situations (Pintrich, 2000).
Perseverance: Passion for long term goals - working strenuously toward challenges, maintaining effort and interest over years despite failure, adversity, and plateaus in progress (Duckworth, Peterson, Matthews & Kelly, 2007).
Emotional Intelligence (mixed and trait)
A measure of a person’s skill in being aware of and managing their own emotions and being able to express them. This also includes skill in being aware of others’ emotions and using this skill to build good relationships. Mixed: skills that are not located within other ideas about psychological functioning, and are instead a ‘broad’ indication of useful skills pertaining to interpersonal communication and ‘life success’. Trait: skills that are part of personality and other similar elements such as impulsiveness and stress management.
Mixed: The ability to identify, assess, and control one’s own emotions, the emotions of others, and that of groups (Goleman, 1995). Trait: a constellation of emotional self-perceptions located at the lower levels of personality (Petrides & Furnham, 2001).
Social and Emotional Competence
Behaviours, thoughts and feelings related to how a person manages their own emotions and builds positive relations with others. This includes emotional awareness and regulation, relationship and social and skills, and using these skills to make
The process through which children and adults acquire and effectively apply the knowledge, attitudes, and skills necessary to understand and manage emotions, set and achieve positive goals, feel and show empathy for others, establish and maintain positive relationships, and make responsible decisions (SEL.org).

22
responsible decisions.
Mental health and wellbeing
A very broad area that includes how children and adolescents feel in relation to positive ideas about normal functioning. For instance, that individuals feel happy, connected to others, confident, and able (and willing) to grow and learn.
There have been numerous attempts to create positively focused taxonomies of mental health skills, including self-understanding, the ability to manage emotions, motivation, resilience and optimism, having a sense of coherence, and the ability to make relationships and empathise with others (Seligman, 1996; Macdonald & O’Hara, 1998; Weare, 2000; NICE 2009).
Resilience and coping
Relating to a body of literature that views the child or adolescent as part of a wider eco-system (e.g. parents and community), resilience examines how capable an individual feels able to deal with difficulties or adversities, and how well they can identify and use support.
The capacity of individuals to navigate their way to health-enhancing resources and the capacity of individuals’ physical and social ecologies to provide those resources in meaningful ways (Ungar, 2006).
Perceptions of Self
How an individual identifies themselves, specifically in relation to self-concept (e.g. what are they good or capable at), ideal self (e.g. what are they capable of becoming), and self-esteem (the difference between the two).
One's belief in one's ability to succeed in specific situations or accomplish a task (Bandura, 1977). Related to self-concept (constructed from the beliefs one holds about oneself and the responses of others) and self-esteem (evaluated and opinionated).
Meta-cognition
Assess individual’s beliefs and skills in how well
they think, plan and monitor their own learning. For
example, how well they use strategies such as
planning, and evaluating their own performance in
relation to academic progress.
Goal-oriented efforts to influence one’s own learning behaviours and
processes by focusing awareness on thinking and selecting, monitoring,
and planning strategies that are most conducive to learning (Zimmerman,
2001). Meta-cognitive strategies, for example, include setting goals,
planning and problem solving, being aware of one’s strengths and
weakness, monitoring one’s progress and understanding, and knowing
when and why to use certain strategies (Pintrich, 2002).

23
Appendix 2: Star Ratings
All measures included within the SPECTRUM database have been given a ‘star rating’. The criteria for star ratings can be seen below - These allow for a broad estimate of their relative quality in the areas of psychometrics and implementation. Star ratings are allocated on the basis of the following criteria:
Implementation Details
Freely available The measure is completely free to use (i.e. no cost to obtain the measure).
Potential for follow-up The measure covers at least 3 years of a period of schooling (within either primary or secondary school).
Brevity If the measure takes less than 30 minutes to complete (if self-report) or if no time is reported then the measure is less than 50 items.
Ease of scoring Simple scoring instructions (e.g. no need to estimate or judge open-ended scoring).
Psychometric Details
UK norms The measure provides average values for a UK population. UK norms increase the potential generalizability of a measure, as they provide a better idea of normative values.
Reliability All subscales have a Cronbach’s alpha above .70 (or equivalent if alternative calculations are used)0.7 is a widely accepted threshold for the reliability of a scale (or subscale) (Nunnally, 1978). NB: The star rating is only applied if all subscales meet or surpass the .70 threshold. In some instances, specific subscales of instruments may be considered reliable, whereas will not. If the instrument allows, specific subscales may be used, omitting the less reliable ones (see Section 5 – ‘can I only use select items?’).
Construct Validity Confirmatory Factor Analysis shows strong results - at least CFI≥ .95 and RMSEA< .05. Related to the above, an additional star is awarded when the measure meets or surpasses widely accepted threshold criteria for ‘good fitting’ (i.e. internally valid) data (Hu & Bentler, 1999).
Criterion/Construct Validity A star is awarded where information is available regarding criterion and/or construct validity. Specific threshold criteria for these forms are difficult, as they are dependent on norms and the availability of other measures with their conceptual domains (for instance, there are different expectations of construct validity in EI assessment, dependent on whether typical performance or maximal measures are used) (Van Rooy, Viswesvaran, & Pluta, 2005).
Test-retest Reliability A star is awarded where information is available regarding test-retest. As test-test occurs across different time periods, additional threshold criteria do not apply.