social networks and exchange self confirming …
TRANSCRIPT
SOCIAL NETWORKS AND EXCHANGE:SELF-CONFIRMING DYNAMICS IN HOLLYWOODB
OLAV SORENSONAnderson Graduate School of Management
University of California – Los Angeles110 Westwood Plaza, Box 951481
Los Angles, [email protected]
DAVID WAGUESPACKDepartment of Political Science
State University of New York at Buffalo
Draft: November 3, 2003
Word count: ~10,800
B We wish to thank Linda Peak and Melissa Wang for their able research assistance, the UCLA Center forCommunication Policy for financial support, and Andrew Anslie and Xavier Drèze for data access. Thedevelopment of this paper benefited from discussions with Misiek Piskorski and Mike Ryall, commentsfrom Bjørn Løvås and Ezra Zuckerman, and remarks by seminar participants at Harvard and Stanford; theusual disclaimer nonetheless applies.
Self-confirming Dynamics 2
ABSTRACT
Studies have consistently found that social structure influences who transacts with whom,and that actors appear to benefit when exchange occurs embedded within these relationsrather than in an unstructured market. Explanations for these results frequently point totheir effectiveness in solving problems inherent in the trade of certain products andservices, focusing on the ability of these social networks to provide access to privateinformation regarding the quality of the goods or to allow participants to enforce theterms of the exchange agreement. In investigating these dynamics in the interactionbetween movie producers and distributors, this paper, however, suggests that a type ofself-confirming prophecy can also produce such effects: One party frequently offersbetter terms of trade in transactions embedded within existing social relations, therebycontributing to the apparent benefits of such exchange patterns. In the motion pictureindustry, not only do distributors show a preference for carrying films involving keypersonnel with whom they have prior relations, but also they tend to favor these filmswhen making decisions regarding their release – in determining opening dates and theamount of resources devoted to marketing. Empirical estimates of the performance ofmovies in the U.S. box office reveal that – when models fail to account for these keydecisions – distributors appear to benefit from carrying movies affiliated with knownparties, suggesting that they have private information regarding the quality of the talentinvolved. After controlling for marketing effort and seasonality, however, these effectsdisappear, indicating that, rather than arbitraging price-quality inconsistencies,distributors produce these effects through their own efforts.
Self-confirming Dynamics 3
INTRODUCTION
One of the best-known findings in economic sociology is that pre-existing socialstructures play a prominent role in determining who transacts with whom.1 Evidence forthis patterning of exchange appears both in the local and global topologies of tradingnetworks. At the most narrow, dyadic, level, for example, researchers find thatindividuals and organizations tend to interact repeatedly with the same trading partnerseven when many alternatives (i.e. substitutes) exist (Gouldner, 1960; Geertz, 1978;Baker, 1990). Meanwhile extensions investigating the structure of the indirect relationssurrounding a potential exchange dyad demonstrate that the cohesiveness of these localstructures appears to increase the probability of exchange (Simmel, 1908; Portes andSensenbrenner, 1993; DiMaggio and Louch, 1998). Though developed in a largelydistinct line of literature, this logic also underlies the more macro-level (global topology)arguments surrounding the importance of status as a characteristic structuring the market:Central positions in the exchange network attract more potential trading partners (Veblen,1899; Podolny, 1993; see Gould, 2002, for an analytical treatment), once againsuggesting that social structure influences patterns of trade.
A closely related line of empirical research meanwhile demonstrates that these embeddedexchanges provide economic benefits to those that engage in them. Uzzi (1996), forinstance, finds lower failure rates among garment manufacturers that interact moreintensively with a limited set of exchange partners. Stuart (2000) demonstrates that semi-conductor firms in alliances with highly innovative partners benefit both in terms of theirown rate of innovation and in sales growth. And in the Sydney hotel market, Ingram andRoberts (2000) show that hotels with managers who have more extensive and cohesivenetworks to rivals enjoy higher utilization rates, a key measure of success in thatindustry.2 Investigating the broader pattern of relations, Podolny (1993) finds that highstatus investment banks – those occupying axial positions in debt syndication networks –can extract larger margins (fees) on the most attractive deals in the corporate debt market(see also Stuart, Hoang and Hybels, 1999, for an examination of initial public offerings).Though the granularity of the measurement of social structure differs across thesesettings, all point to a link between position in this structure and rewards.
In seeking to explain these patterns, social scientists have typically highlighted twomechanisms through which social networks might engender more efficient exchange. Thefirst centers on the access to private information that these networks afford prior to atransaction. In cases where potential exchange partners differ substantially in the quality
1 Though this assertion likely holds true for the broader definition of social structure as well, our usage ofthe term denotes only its more narrow sense of referring to the pattern of relations linking actors in a socialsystem (Laumann, 1966).2 Evidence for the benefits of embedded exchange has accumulated with particular speed in the literatureon organizations. Several studies, for example, find positive relationships between position in corporatedirectorate interlocks and firm performance (e.g., Mizruchi, 1992; Geletkanycz and Hambrick, 1997),connect repeated transactions between buyers and suppliers to more cooperative behavior and improvedperformance of buyers (e.g., Heide and Miner, 1992; Zaheer, McEvily and Perrone, 1998), and link thestability of a firm’s network of strategic alliance partners to its financial performance, innovativeness andlongevity (e.g., Mitchell and Singh, 1996; Powell, Koput and Smith-Doerr, 1996), to name but a few.
Self-confirming Dynamics 4
of their offerings and actors find it difficult to evaluate this heterogeneity a priori,information regarding the likely quality of these alters or their wares through priorexperience with them, or through the prior experience of others, may inform the selectionof exchange partners (Granovetter, 1985; Podolny, 1993). A second explanation revolvesaround the ability of social networks to aid in the enforcement of contracts, either throughbetter observation of whether the other party completed their side of the bargain, orinduced via the application of more effective threats of punishment in response to non-compliance (Bott, 1957; Coleman, 1990).
Though both of these factors likely explain the frequency of embedded exchange in manyimportant settings, these circumstances need not exist to foment the development ofstable, network-based patterns of trade. Indeed, we contend that a type of self-confirmingprophecy might also account for this pattern of findings: Not only do actors prefer toexchange with known parties (i.e. those with whom they share prior relations or indirectties), but also – most likely believing these parties higher quality or more trustworthy –they offer them better terms of trade and invest more in the transaction when they doexchange. Such favorable treatment itself can contribute to the success of their partners.Consider an example: An investor might offer better terms to a businessperson withwhom he shares a connection because he feels less uncertain regarding the likely successof the venture. The lower cost of capital implied, however, may well boost the venture'sperformance, thereby confirming the investor’s original expectations – even though theventure would have under-performed if it had obtained market interest rates. By virtue oftheir actions, market participants thus enact the very results that they expect.3
Despite the fact that prior work has alluded to such a self-confirming dynamic, it hasremained in the background in both theoretical and empirical research on the dynamics ofexchange. Many discussing the importance of trust in facilitating transactions, forexample, note that trust may have little grounding in actual differences in the reliabilityof potential exchange partners (e.g., Geertz, 1978; Coleman, 1990); nonetheless, effortsto portray trust as a rational basis for action largely dominate the literature. Podolny(1993) similarly defines status only in terms of perceived quality and notes that thestructure of exchange relations may impede the alignment of these perceptions with thetrue underlying values, but nonetheless maintains that status rankings loosely correspondto true quality distinctions among producers. Hence, though admitting its possibility, theliterature has largely downplayed it and – to our knowledge – failed to investigate itempirically.4
3 The idea of self-confirming dynamics enjoys a long history. Indeed, the concept appears in many classicliterary works, particularly tragedies. Merton (1948) first identified the importance of these processes toissues of sociological interest (though he attributes the idea to the earlier – though far less explicit –writings of W.I. Thomas), largely in the context of labeling and stratification. Recent analytic work (e.g.,Fudenberg and Levine, 1993; Kalai and Lehrer, 1993; Ryall, 2003; see also Hayek, 1937) has brought thisnotion to the economic realm and demonstrated the potential for stable ‘subjective’ equilibrium whenobserved payoffs correspond to actors’ expectations.4 A more robust history of emphasizing the importance of these self-reinforcing processes, however,appears in the sociology of science (Merton’s, 1968, work on the ‘Matthew effect’ in scientific careers).And a strong awareness of the potential for self-confirming dynamics and a research tradition also exists inthe sociology of education where experimental manipulation has been used to identify these effects.
Self-confirming Dynamics 5
In addition to elaborating a theory of how these self-confirming dynamics might persist,this paper also provides evidence that this explanation appears to explain embeddedexchange in at least one setting: the motion picture industry. In particular, we examinethe relationship between production companies – teams of producers, writers, directorsand actors who cooperate to make a film – and distribution companies. Our results showthat distribution companies show a strong preference for working repeatedly with thesame sets of individuals, and that – without controls for the effort the distributor investsin marketing these films – a strategy of repeated interaction appears to yield higher U.S.box office revenue. If one controls for the actions of the distributor, however, thesedifferences disappear, suggesting that distribution companies produce this result throughtheir own actions. Distributors, moreover, apparently would benefit from allocating theirresources more evenly across exchange partners.
The results potentially have a wide range of important applications. At a theoretical level,it reinforces one of the most central ideas in sociology – the distinction between the actorand the position. Particularly among work that attributes the benefits of embeddedexchange to search, researchers rely heavily on an exogenously determined distributionof underlying quality as an explanation for the patterns of exchange. These results, on theother hand, suggest that researchers should exercise particular caution when attributingthe benefits of social position to qualities of the actors occupying them, as manyimportant aspects of exchange behavior may remain hidden from participants andresearchers alike. At a more applied level, these ideas call attention to the importance ofunobserved (and endogenous) behaviors across many types of exchange. For example, ininternal labor markets, sponsorship networks may engender replication of thedemographic characteristics among the upper echelon of employees, creating a ‘glassceiling’ for those employees excluded from these mentoring relations.
THE ANTECEDENTS OF EMBEDDED EXCHANGE
In the large and growing body of studies demonstrating the importance of social structurein channeling the movement of resources and shaping the patterns of exchange,researchers have focused primarily on two classes of theory to explain their results.5 Thefirst highlights the value of access to private information regarding the true quality of agood prior to exchange. A second points to the importance of social networks in Rosenthal and Jacobson (1968), for example, demonstrate in their classic experiment that randomlyassigning students to a ‘gifted’ condition improved their performance in the classroom. More recently,Lovaglia and his colleagues (1998) produced similar effects on standardized test scores by randomlyidentifying students as ‘high status’ prior to the administration of the exam. The relative paucity of researchin economic contexts may reflect the difficulty of obtaining systematic information on the interveningvariable: the amount of effort and resources allocated to exchange.5 Though less common in the literature, some explanations – for example, those based on power (e.g.,Pfeffer and Salancik, 1978; Markovsky, Willer and Patton, 1988) – draw on alternative explanations forembedded exchange. Power-based accounts, in particular, offer little purchase in this setting: Our researchseeks to explain why distributors favor known parties when selecting among films. If certain productioncompanies had substantial power over distributors that might explain their ability to extract favorableterms, but if anything the power asymmetry in this industry runs in the opposite direction (i.e., distributorshave more power than film production companies; Cones, 1997; Caves, 2000).
Self-confirming Dynamics 6
mitigating opportunism when the nature of the transaction opens actors to this agencyproblem.
PRE-EXCHANGE: ACCESS TO INFORMATION
Much of the work seeking to explain the prevalence of embedded exchange has identifiedaccess to private information as a key issue in understanding the value of transacting witha circumscribed set of potential exchange partners. The idea that information diffusesthrough social networks has a long tradition in sociology, particularly investigating thediffusion of innovations (Ryan and Gross, 1943; Coleman, Katz and Mendel, 1966).Studies emphasizing the importance of access to private information prior to exchangeextend this insight to the process of selecting from a menu of potential products orproducers: Many types of goods and services vary along a quality dimension. Whenbuyers have difficulty accurately observing this quality a priori, atomistic markets fail.Buyers worried about receiving low quality goods only offer bids for the value of theseinferior products; sellers of high quality goods, unable to receive fair compensation forthem, meanwhile may remove their wares from the market – a situation labeled byAkerlöf (1970) as the ‘lemons’ problem. Access to private information – for example,from personal experience or from other parties that have previously transacted with avendor – can ameliorate this problem by reducing buyer uncertainty regarding the qualityof the goods being offered. Geertz (1978) points to this explanation as a key reason whyindividuals repeatedly purchase goods from the same vendors in peasant bazaars. AndDiMaggio and Louch (1998) find that when uncertainty afflicts the quality of a good,consumers prefer to purchase from suppliers with whom they share mutual contacts sincethey assume they would have heard about quality problems, if any existed, through theirnetwork. Even the growing literature on the importance of ‘structural holes’ points to thisissue, highlighting the value of the extensiveness of the reach of an actor’s networks inproviding information regarding the availability of exchange opportunities (Burt, 1992).6
To a large extent, this logic also underlies the substantial literature highlighting thebenefits of status in exchange. Under conditions of uncertainty, actors prefer to exchangewith higher status partners. This pattern occurs, according to Podolny (1993), becausestatus itself acts as a signal in the absence of more direct evidence of the underlyingquality of goods offered by a producer (Gould, 2002, demonstrates analytically andprovides some evidence that these status differences likely exaggerate actualheterogeneity in the quality distribution, but stratification still arises from theseunderlying quality differentials). Hence, explanations of the rents associated with statusfrequently attribute them to signals of an actor or good’s quality. Stuart, Hoang andHybels (1999), for instance, point prominently to such an account in discussing theirfinding that biotech firms affiliated with higher status partners enjoy both better odds ofgoing public (i.e. selling stock on an exchange) and greater investor demand when theydo sell equity. Kim and Laumann (2003) similarly attribute the greater wages earned by
6 A structural hole refers to a situation in which an actor has ties to two otherwise unconnected parties. Burt(1992) argues that this relational pattern reduces redundancy in the information that the focal actor receivesthrough his network.
Self-confirming Dynamics 7
lawyers affiliated with higher status attorneys, particularly early in their careers, to thesignaling that these relations provide regarding their (difficult to observe) skill.
Though less commonly identified as a key factor, access to information can also benefitactors subsequent to the selection of a trading partner. Embedded relations facilitate thetransfer of highly tacit knowledge, which might allow one or both parties in an exchangeto improve their production processes or to innovate more effectively. Studying productdevelopment teams in a high tech company, for instance, Hansen (1999) finds that strongties appear particularly valuable in transferring the dense technological knowledgeimportant to these projects. The value of dense relations between parties also appears inthe literature on organizational learning. Darr, Argote and Epple (1995), for example,show that spillovers in learning across pizza franchisees occur only among thosebelonging to the same owner (see also, Thorton and Thompson, 2001, for evidence fromship building). Strong relations between broadcaster and recipient of knowledge proveparticularly important when sharing complex, tacit knowledge that requires bi-directionalcommunication for effective transfer. Hence, the potential value of access to informationin embedded exchange extends beyond the selection process.
In the film industry, access to at least two types of information might prove advantageousto distributors. On the one hand, distributors must select among the thousands of projectspitched to them to decide which they will choose to market and distribute to theaters.Though a famous quip claims that “Nobody knows anything” (Goldman, 1984, p. 39),industry participants clearly believe that certain stars draw audiences, that some directorsusually deliver good films and that a few producers have good instincts for producingwinning pictures (Litwak, 1986). And they act on these beliefs. Better access toinformation may allow distributors to either pursue likely winners with the hopes oflocking up a contract before rivals become aware of the opportunity, or see hidden valuein a project comprising participants whose true talent the market has not generallyrealized (e.g., the undiscovered talent or the rising star). Once an agreement has beenmade, strong ties might also facilitate the exchange of dense information crucial totargeting the right audience and marketing the picture successfully. Distributors couldtherefore benefit from transacting repeatedly with the same parties, or with those withwhom they have strong indirect connections.
POST-EXCHANGE: ENFORCEMENT OF AGREEMENTS
Embedded relations can also prove useful following an exchange in ensuring itscompletion according to the terms of the (possibly implicit) contract. When exchangedoes not occur simultaneously, uncertainty frequently surrounds whether the individualor organization moving last in the sequence of transactions agreed upon will fulfill theirobligations (Løvås and Sorenson, 2003).7 In these situations, social networks facilitate 7 The importance of this uncertainty appears quite starkly in the comparison of finite and infinite periodrepeated games. In Prisoners’ Dilemma games, for example, rational actors cooperate under a wide varietyof conditions in infinite period games. In situations where players know the final period, on the other hand,all players usually defect. The behavioral difference reflects uncertainty on the outcome of the finalexchange (and a weak assumption of opportunistic behavior): Players fail to cooperate because they believethat the other party will defect on them in the final round (backward induction then propagates these effects
Self-confirming Dynamics 8
exchange in several ways. Both prior experience between the parties and secondaryconnections through other actors allow each participant to develop stronger – thoughpossibly inaccurate – expectations of the behavior of the other (Granovetter, 1985;Sorenson and Stuart, 2001). A more intense relationship, involving both more frequentand more intimate contact, and shared indirect ties also increases the capacity of eachactor to monitor the other (Merry, 1984). Moreover, the ability to coordinate sanctioningactivity afforded by cohesive network structures raises the expected severity ofpunishment to actors that might consider reneging on their agreements (Bott, 1957;Coleman, 1990). Though difficult to disentangle from the effects of pre-exchangeselection in many contexts, situations in which the primary risk involves defection – asopposed to unobserved heterogeneity in quality – offer the clearest examples of thesemechanisms in practice. Portes and Sensenbrenner’s (1993) description of the lendingpractices among members of ethnic enclaves thus comes to mind: Business owners inthese communities lend each other substantial amounts, frequently even without writingcontracts, yet defection (default) on these loans occurs infrequently. Baker (1984) alsopoints to social cohesion as an important factor in keeping options traders in the market,maintaining liquidity and reducing volatility.
Though less prominent in the literature on status, reputation may also play a role inensuring the faithful completion of a contract. To the extent that exchange partners canextract better prices based on their status, these very reputations may hold them hostageto honoring the terms of an agreement lest they lose this advantage. This argumentappears most frequently in the game theoretic economics literature examining whyrational actors would invest in the establishment of brand names and how this brandingactivity can solve market failures due to information asymmetry (e.g., Akerlöf, 1970;Kreps and Wilson, 1982; see Charness and Garoupa, 2000, for experimental evidence).This literature, however, differs substantially in its flavor from sociological accountsbecause it assumes that all actors in a market can observe the faithful completion of anagreement, while the latter, when identifying the potential value of social networks,points precisely to the difficulty of obtaining such information in many cases.
While in many contexts an important factor, this aspect of embedded exchange likelyplays a minor role, at most, in the relationships between film production companies anddistributors. Distribution contracts typically specify that the owners of the film receivetheir payments after the distributor has recouped its own expenses (Cones, 1997).Moreover, these agreements pay a percentage of the gross receipts after marketingexpenditures to the film production company. This tight alignment of incentives virtuallyeliminates the incentives for opportunistic behavior (Chisholm, 1997). Though one mightstill worry about the risk of non-completion, modern contracts routinely requirecompletion risk insurance, mitigating the importance of this hazard (Squire, 1992). Ourconsideration of the potential advantage of embedded exchange in the movie industryhence focuses on the benefits of information access.
such that rational players never cooperate once they anticipate such defection). Interestingly, work on self-confirming equilibrium in economics began as an investigation of how the equilibrium could deviate fromNash equilibrium in finite period games (e.g., Fudenberg and Levine, 1993).
Self-confirming Dynamics 9
SELF-CONFIRMING DYNAMICS: EFFORT AND OUTCOMES
Both pre-exchange information and post-exchange monitoring likely explain thepropensity for actors to exchange with known parties in a variety of circumstances;nonetheless, embedded exchange might easily persist even if it does not provide aneffective solution to market failure. Rather, individuals and organizations might exchangewith known parties believing that these parties offer better investments or higher qualitygoods and services. Further acting on those beliefs, actors offer better terms (e.g., prices)or favor these parties when making decisions regarding the value of an exchange. Theseagreeable terms themselves, however, then enact the beneficial outcomes expected bytheir exchange partners.
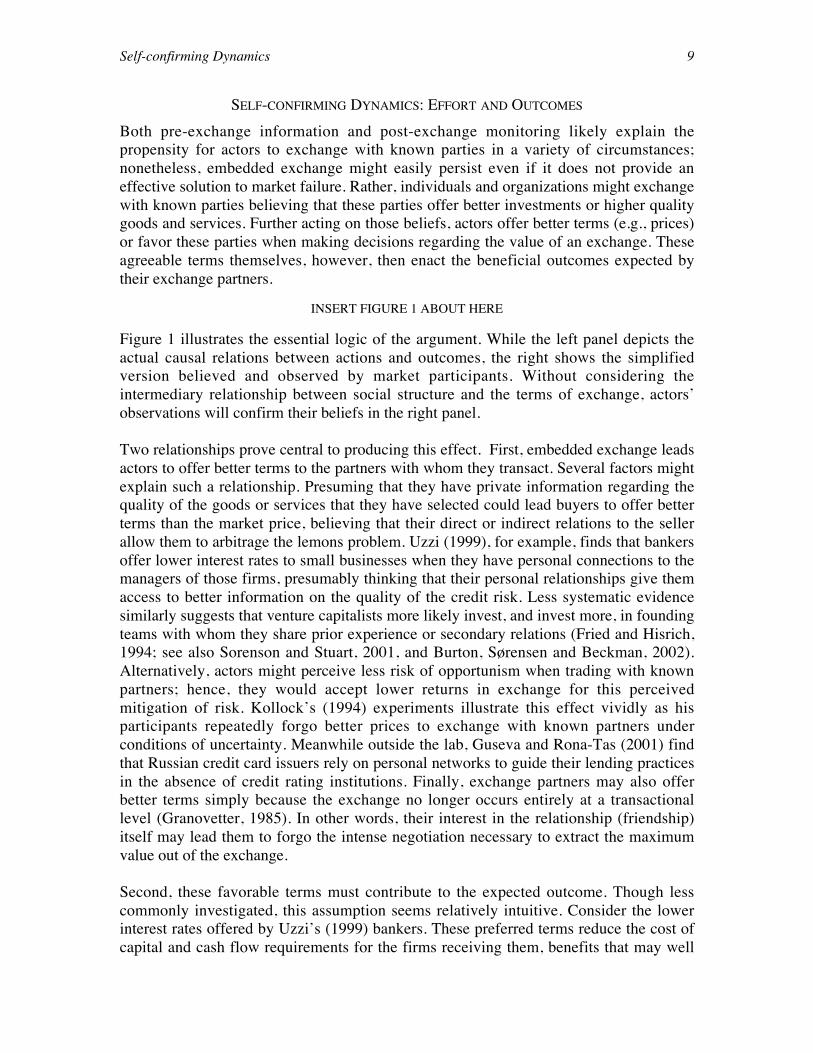
INSERT FIGURE 1 ABOUT HERE
Figure 1 illustrates the essential logic of the argument. While the left panel depicts theactual causal relations between actions and outcomes, the right shows the simplifiedversion believed and observed by market participants. Without considering theintermediary relationship between social structure and the terms of exchange, actors’observations will confirm their beliefs in the right panel.
Two relationships prove central to producing this effect. First, embedded exchange leadsactors to offer better terms to the partners with whom they transact. Several factors mightexplain such a relationship. Presuming that they have private information regarding thequality of the goods or services that they have selected could lead buyers to offer betterterms than the market price, believing that their direct or indirect relations to the sellerallow them to arbitrage the lemons problem. Uzzi (1999), for example, finds that bankersoffer lower interest rates to small businesses when they have personal connections to themanagers of those firms, presumably thinking that their personal relationships give themaccess to better information on the quality of the credit risk. Less systematic evidencesimilarly suggests that venture capitalists more likely invest, and invest more, in foundingteams with whom they share prior experience or secondary relations (Fried and Hisrich,1994; see also Sorenson and Stuart, 2001, and Burton, Sørensen and Beckman, 2002).Alternatively, actors might perceive less risk of opportunism when trading with knownpartners; hence, they would accept lower returns in exchange for this perceivedmitigation of risk. Kollock’s (1994) experiments illustrate this effect vividly as hisparticipants repeatedly forgo better prices to exchange with known partners underconditions of uncertainty. Meanwhile outside the lab, Guseva and Rona-Tas (2001) findthat Russian credit card issuers rely on personal networks to guide their lending practicesin the absence of credit rating institutions. Finally, exchange partners may also offerbetter terms simply because the exchange no longer occurs entirely at a transactionallevel (Granovetter, 1985). In other words, their interest in the relationship (friendship)itself may lead them to forgo the intense negotiation necessary to extract the maximumvalue out of the exchange.
Second, these favorable terms must contribute to the expected outcome. Though lesscommonly investigated, this assumption seems relatively intuitive. Consider the lowerinterest rates offered by Uzzi’s (1999) bankers. These preferred terms reduce the cost ofcapital and cash flow requirements for the firms receiving them, benefits that may well
Self-confirming Dynamics 10
reduce the risk of firm failure and with it loan default. The same holds true for equityinvestments: Venture capitalists by offering more funds to founders improve the likelysuccess of these fledgling firms as well; research shows a positive relationship betweenthe level of venture capital investment and firm growth (Davila, Foster and Gupta, 2001)and the likelihood of a successful IPO (Stuart and Sorenson, 2003). Other types of non-financial investments may also benefit transaction partners.
In the success of films, the key terms of trade likely concern the amount of resourcesallocated to marketing.8 Distributors believing that they have special knowledgeregarding the probable success of a project invest more in marketing films when theyenjoy a strong tie with the principals involved in the project. Repeated interaction alsolikely promotes an exaggerated belief in the underlying quality of the participantsinvolved. In either case, distributors have control over two decisions important to thefinancial success of a film: its release date, and the amount spent on advertising it.Therefore, distributors, believing these films to have better odds of becoming a box officehit, allocate the films with which they have the strongest ties to the most desirableopening dates (e.g., the 4th of July) and expend more resources promoting them. Thismarket support, in turn, can contribute to the success of these films, thereby (inappearance) confirming the distributor’s expectations.
At least two factors help maintain the stability of this subjective equilibrium. On the onehand, actors likely see little reason to test the counterfactual. To the extent that thefeedback from their perception of the environment matches their expectations, marketparticipants avoid behavior that would produce evidence that could invalidate their view(Ryall, 2003). Such behavior can occur at two levels. Actors refrain from transacting on aregular basis with unknown parties, thereby making it difficult for them to assess thepotential benefits of embedded exchange. Even when they do interact, however, withfirst-time (or less well known) partners they uniformly favor their closest exchangepartners when deciding on the terms of trade, eliminating the possibility of falsifyingtheir expectations.
Though even rational actors can fall prey to these dynamics, common psychologicalbiases likely crystallize the stability of these systems. Ambiguity aversion, for example,would lead actors to avoid unknown risks (Ellsberg, 1961). Though the success of anyfilm seems uncertain, Fox and Tversky (1995) argue that comparative ignorance drivesambiguity aversion. In other words, individuals avoid the option about which they knowthe least. As a bias, ambiguity aversion appears both quite common and surprisingdifficult to inoculate against. Even professional decision makers appear susceptible. Bothoptions traders and elite decision scientists exhibit ambiguity aversion, despite beingperfectly risk-neutral when making choices (e.g., Fox, Rogers and Tversky, 1996). Thisbias should reinforce actors’ failure to test the counterfactual.
8 Contracts between production companies and distributors rarely specify either a minimum advertisingexpenditure level or a specific release period, obligating distributors only to engage in ‘reasonable efforts’marketing the films they carry. Hence, these marketing decisions remain almost entirely at the discretion ofdistributors (Cones, 1997).
Self-confirming Dynamics 11
Even when access to the counterfactual exists, psychological biases may impede actors’ability to realize that the information conflicts with their expectations. One of the betterdocumented behaviors in the psychology of decision-making finds that humans seek outand allocate undo attention to information that confirms their existing beliefs orexpectations, a tendency recognized as early as Bacon (1620). Experimental research hasdemonstrated that subjects actively avoid information that might disconfirm their beliefs(Wason, 1968). Even when confronted with evidence that should lead them to updatetheir beliefs, subjects frequently interpret somewhat ambiguous information as supportiveof their expectations (e.g., Jones and Sugden, 2001). Given these tendencies, it seemslikely that actors could maintain their beliefs in the value of transacting with knownpartners even in the face of occasional evidence to the contrary – especially in a marketwith as high variance outcomes as film exhibition.
EMPIRICAL CONTEXT: MOTION PICTURE DISTRIBUTION
To examine the potential for these dynamics empirically, we have collected and analyzeddata on the U.S. motion picture industry. In particular, our study investigatesrelationships between production companies, their principals and distributors.
In the film industry, distributors provide an important link between productioncompanies, which assemble and coordinate the resources necessary to create a motionpicture, and theaters, which exhibit these films to the movie-going public. Though at onetime firms, known as the ‘major studios’ (20th Century Fox, Metro Goldwyn Mayer,Paramount, RKO and Warner Brothers), integrated across these stages of the value chain,antitrust action led to a 1948 consent decree where the majors agreed to divest theirtheater holdings (Conant, 1960). During the same time period, competition forced themto end exclusive contracting with talent, greatly reducing the extent of in-houseproduction (Litman, 1998; Caves, 2000). The industry now comprises three sets of firms– production companies, distributors, and theaters – each focusing on a different stage ofthe process of bringing a new movie to market.
Though technically production companies make films, the principals involved frequentlyform these companies to make a single film, simply as an accounting convenience. Giventhe ephemeral nature of these organizations and the frequent recombination of individualsacross projects in the industry, we measure the attributes of the production firms bysumming the qualities of the principals involved. These principals include producers,who usually assemble the team and arrange financing, writers, responsible for the scriptor screenplay, directors and actors.
In the modern motion picture, the process of assembling the resources to produce a newfilm has an archetypal sequence (see, for example, accounts in: Litwak, 1986; Squire,1992; Caves, 2000). The producer first purchases rights to a story (e.g., a popular novel) ascript or a screenplay. Next, the producer (tentatively) hires a director. The directorgenerally assists in the selection and recruitment of the other members of the team, butenjoys a non-binding contract until production actually begins. Together the producer anddirector, generally with the assistance of a casting agent, select actors to fill the various
Self-confirming Dynamics 12
roles in the film. Once these individuals have signed on to the project, and the team hassecured financing, filming begins.
Production companies can engage in contracts with distributors at various stages in thisprocess. Deals most commonly take one of the following three forms (see Cones, 1997,for details on distribution contracting). In a production, distribution and financing (PDF)agreement, following the assembly of a project (a producer with a script, a director andcommitments from key actors), distributors commit to providing funds and distributionfor the nascent movie before filming begins.9 The negative pick-up, which occurs afterproduction has been completed, involves an advance on movie proceeds by thedistributor to cover the production costs, as well as a commitment to distribute the filmdomestically. The final main type of deal, the acquisition, follows the completion of thepicture and involves only an agreement to distribute the film. Only in very rare cases, forexample with MGM and the Bond franchise pictures, does a distributor essentiallyproduce the entire film in-house, in essence committing to finance and market a filmbefore the selection of principals.
Two relatively unusual features of this industry make it a prime candidate fordetermining whether these self-confirming dynamics exist. First and most significantly,we can observe with relative accuracy the most important activities that distributorsundertake to the potential benefit of the film’s production company, in this case theirmarketing decisions. Distributors have control over two important factors affecting thesuccess of the movies they carry – the amount of resources devoted to marketing them,and their release dates – both of which can be observed with relative accuracy. Second, asFaulkner and Anderson (1987) note, short-term production systems provide ideal settingsfor the study of market behavior. In this case, the fluid mixing of principals into differentsets of teams usefully allows us to estimate individual-level measures of quality (to somedegree), thereby directly testing whether these differences account for selection effects inembedded transactions.
Data SourcesTo test these dynamics within the context of the motion picture industry, we haveassembled a database of all films ever generating a minimal level of ticket revenue intheatrical exhibition in the United States between 1982 and 2002.10 The data for each ofthese films comes primarily from two sources: the Internet Movie Database (imdb.com)and the weekly box office listings reported in Variety. For inclusion in the dataset, a filmhad to appear on the Variety listings of top-grossing films for at least one week during the
9 Virtually all contracts with producers under development deals, a small number, fall in this category. Inthese deals, a distributor purchases the option to finance and distribute a producer’s films in exchange for a‘salary’ (in essence, the option price). Even in these cases though, agreements generally occur after theassembly of a team. We nonetheless return to this issue in the discussion.10 The data begin in 1982 because the analysis rests to some extent on the assumption that the number ofopening screens reflects marketing expenditures. Prior to the ‘wide release’ – where films open in the sameweek across all domestic markets – distributors restricted the opening to a small number of large markets toeconomize on the cost of prints, regardless of the marketing budget. Distributors began experimenting withthe wide release strategy in the early 1970s and adopted it widely by the early 1980s.
Self-confirming Dynamics 13
observation period. Though one might worry that such a requirement would exclude alarge number of films, the Variety listings include even films with extremely limiteddistribution; indeed, as few as 100 ticket sales could qualify a movie for inclusion on theVariety lists and nearly 10% of the motion pictures included in the dataset never appearedon more than one screen in the United States.
CHOOSING EXCHANGE PARTNERS
The first step in our analysis involves confirming that social networks do in fact influencethe matching of films to distributors. This amounts to an analysis of tie formation (e.g.,Podolny, 1994; Sorenson and Stuart, 2001). Following prior studies, we generated adyadic dataset in which each case represents a possible match between a film and adistributor. To construct such a dataset required us to make a decision regarding the riskset of potential distributors. We took a conservative approach and assumed that anydistributor active in a particular year potentially could have carried a film being releasedin that year. Depending on the year, then, each film had between 25 and 100 potentialsuitors (the number of distributors has been rising steadily over the study period). As inprior research on the choice of exchange partners, a dichotomous variable, taking a valueof one when a tie exists, represents the establishment of an exchange relation (i.e., adistributor choosing to market a particular picture).
To estimate the determinants of tie formation, we use a maximum likelihood conditionallogistic regression (Chamberlain, 1980). The conditional logistic calculates the likelihoodrelative to other cases in the group. Since we group observations by film, it essentiallyestimates the likelihood of a film being distributed by one company versus another. Onecould also think of our approach as analogous to a McFadden choice model, since filmproduction companies nearly always maintain exclusive contracts with distributors withina geographic territory (the entire United States falls within a single territory for thepurposes of these distribution rights).
Although the estimation technique controls for any film-level attributes, since film-levelcharacteristics do not vary across the set of potential distributors, the models contain twocontrols for the traits of the distribution companies (Table 1 provides descriptive statisticsfor all of the models). The first, distributor capacity, simply counts the number of filmsthat a distributor carried in the same year as the film’s release. The likelihood of beingdistributed through a particular distributor obviously increases with that distributor’sprevalence in the market. Second, we construct a measure of distributor specialization –the percentage of films that the distributor carried during the previous three years in thesame genre as the film currently being considered.11 Distributors may show particularinterest in carrying certain types of films. Descriptive statistics for these and othervariables used in the models appear in Table 1.
INSERT TABLES 1 & 2 ABOUT HERE
11 Genre here refers to the classifications assigned by Variety. Though we recognize the absence of anobjective means of categorizing cultural products (DiMaggio, 1987), we use these classifications only tocontrol for consistency in the projects chosen by distributors. Of course, the social construction of suchcategories may mean that distributors to some extent enact these mappings through their affiliation.
Self-confirming Dynamics 14
Table 2 reports the estimates of the conditional logistic regressions. The first modelsimply provides a baseline. As one would expect, distributors with greater capacity aremore likely agree to market films, and distributors with strong specialization in aparticular genre show a preference for maintaining their niches. Model 2 introducesmeasures of the strength of the social connection between the film and its potentialdistributor. The first variable, prior tie, takes a value of one if at least one of the film’sprincipals has worked with the distributor before, or zero otherwise. A second variable,number of ties, counts the number of ties in excess of one that the group of principals hashad to the distributor. Not only does having any prior connection dramatically increasethe odds of a film being carried by a particular distributor, but also each additional priorconnection appears to augment this probability. Though the difference between themagnitude of the coefficients between the first and subsequent ties seems to suggestdecreasing returns to increasingly intensive connections, the relationship actually appearsnearly linear. Figure 2 displays the results of a piece-wise estimation of the number ofprior ties to tie likelihood. The first prior connection has a noticeably larger effect, but allsubsequent ties contribute roughly the same amount to the likelihood of a futuredistribution relationship. Model 3 splits the prior ties among the principals, in essencetesting whether prior relationships among principals in certain roles play a stronger rolein securing distribution contracts. Perhaps not surprising given their role as coordinatorsof the team and of business relationships, prior relations between the producer and apotential distributor appear much more important than those of other participants inarranging distribution.
INSERT FIGURE 2 ABOUT HERE
EMBEDDED EXCHANGE AND PERFORMANCE
Following prior research, the next step involves determining whether embeddedexchange appears to benefit the parties that engage in it. In the film industry, one canusefully investigate the apparent success of each transaction (agreement to market a film)separately. The ability to decompose the results to the level of the individual film affordsus two advantages not available in many situations. Isolating effects to the level of thefilm – the level at which the networks themselves come into play – avoids potentialaggregation bias inherent in a distributor-level measure of success. Moreover, the factthat the participants themselves also have access to this information should make it lesslikely for self-confirming dynamics to arise, hence providing a more conservative test ofthe thesis.
Dependent variableThe most direct measure of performance in the movie industry comes in the form of boxoffice receipts.12 For much of the history of the film industry, these revenues represented 12 In assessing the performance of new motion pictures some argue that researchers should focus onrevenues net of costs (‘profit’). The analyses presented in the paper do not account for costs for two reasons– one methodological, the other practical. Including budget in the performance equation seems problematicin two respects: First, depending on the stage at which distributors agree to carry motion pictures, thebudget may well depend on this agreement itself, and hence vary endogenously with our primary variablesof interest (potentially another type of self-confirming dynamic). Indeed, a multivariate analysis of the
Self-confirming Dynamics 15
the only real source of income from the production of a motion picture. From 1900 to1990, for example, theatrical exhibition accounted for 96% of the industry’s revenue(Vogel, 2001). Though new technologies – television, VCR, cable, DVD – have openedadditional channels from which to extract revenue, box office remains the most importantbenchmark when considering a film, as these ancillary revenues tend to correlate highlyto the movie’s performance during its theatrical exhibition period: Ravid and Basuroy(2003) found correlations of .86 between domestic (U.S.) and international box officerevenue and .70 between domestic box office and video rentals.13 Moreover, those studiesinvestigating the correlates of these revenue sources find identical patterns of relationsacross the various sources (Ravid, 1999).
Two common practices in the industry make these box office figures easily comparableacross motion pictures. First, agreements between distribution companies and theaterowners essentially split proceeds as a function of a percentage of total revenue, with anincreasing portion going to the theater owners as the film matures; the arrangementroughly amounts to theater owners pro-rating their average cost of exhibition across thefilms they carry (Verter and McGahan, 1998; Vogel, 2001). Exhibitors earn profitsprimarily through concession sales – popcorn, candy and soda. Second, the contractsbetween distributors and the owners of the film also nearly universally specify the feesdue to the distributor as a straight percentage of the revenue earned (Litwak, 1998; Vogel,2001). All participants hence benefit from maximizing total sales.
Independent variablesTo assess the importance of embedded exchange – in this case, repeated transactions – inthe success of films, we estimate the effect of the strength of the direct tie to thedistributor. We define this variable as the proportion of the principals’ projects over theprior three years carried by the same distributor as the current project. This measureallows us to distinguish the concentration from the frequency of exchange.14 In theconditional logistic regression models, the estimation procedure makes a similaradjustment, but here we must explicitly account for experience. If repeated exchange
determinants of the reported budgets indicates that a one standard deviation increase in the strength of theconnection between the film and the distribution company increases the expected budget by 7% (p < .10).Second, some production companies record costs such that the budget includes expenses tied to the successof the film (e.g., bonuses in actors’ contracts); though this practice induces a correlation between budgetand revenues, it problematically mixes types of costs. From a practical point of view, only a small portionof the movies in the sample report budget data, requiring us to drop 76% of the cases to include thisinformation. In any case, models accounting for film budget produce qualitatively equivalent results tothose reported.13 Though the popularity of a film in the theaters correlates strongly to its ability to garner revenue fromhome video rentals and television rights, contracts also tighten this relationship as video retailers andtelevision stations sometimes pre-negotiate (before the film’s release in theaters) a price for rights to a filmas a function of its performance in the U.S. box office (Litman, 1998).14 An obvious alternative would be to use the number of prior interactions as a measure of embeddedexchange, but this measure correlates strongly with the overall number of prior projects makingsimultaneous estimation of the separate effects problematic without making the two measures orthogonal(as the proportion does). Models with the number of prior interactions, rather than the proportion, andexcluding total prior experience, nonetheless yield qualitatively equivalent results.
Self-confirming Dynamics 16
allows distributors to select better projects, then this measure should vary positively withfilm performance.
The models also include several controls for other characteristics of the team ofprincipals involved in the film. At the most basic level, the number of principals, simplycounts the number of different individuals involved in principal roles in the project. Ifeach principal draws a particular audience (i.e., some people attend the movie becausethey like the director, while others go to see their favorite actress), projects with moreprincipal participants might attract larger audiences, and hence greater theatrical revenue.In addition, the number of principals involved likely controls to some extent for the scaleof the production itself. Recognizing, however, the likely heterogeneity in theseparticipants, principals’ experience, sums the experience of the principals, in terms of thenumber of films in which they have been involved, over the three years preceding therelease date of a film.15 Experience likely captures several factors. On the one hand,principals may actually learn to perform their roles better or accumulate human capitalover time. On the other hand, a selection process might simply weed out the least ableover time. Also, since experience reflects the number of recent films in which anindividual participated, it also captures the degree to which someone is ‘hot’ – both infavor with audiences at the moment and subject to particularly intense media attention(the controls introduced below, however, should limit the importance of this last factor).
In addition to these simple measures, the estimation includes two controls that providedifferent types of information on the underlying quality of the participants involved.Observable past performance averages the performance of other motion picture projectsthat the principals participated in over the three years preceding the release of the currentfilm. As all industry participants (and even casual observers) can easily access thisinformation, it seems difficult to believe that it might contain private information on thequality of particular principals. It does, however, provide a control for the fact that certainindividuals (e.g., Arnold Schwarzenegger) have been involved in many high-grossingfilms and hence may act somewhat like a brand name in attracting audiences (Rosen,1981; for a history of the emergence of stars in Hollywood, see Bakker, 2001).
The second measure, unexplained past performance, attempts to assess the more difficultto observe quality of principals in determining the success of their projects. In essence,this measure asks: how much better or worse did films with this principal do than onewould have expected given their genre and rating, the amount spent on marketing them,and their release date? Practically, our estimation involves summing the residuals acrossthe previous three years for the principals involved in the film. In the first stage, we
15 The selection of a window involves two choices: its length and when it should end. We chose to end theexperience measure one year prior to the release of the current film as distributors typically commit to filmsmany months prior to their release, often before filming even begins (Squire, 1992); hence, these measuresshould capture the information available to the distributor at the time it makes a decision. The choice ofwindow length involves balancing the size of the sample used for estimation (since a three year window,for example, requires us to exclude our first three years of data from the analysis) with the reliability of theexperience measures. We investigated longer window lengths with similar results, and given the stability ofactivity patterns within the industry, we adopted a shorter window length.
Self-confirming Dynamics 17
estimated the expected success of each film based on its distributor, genre, rating,opening week screens, release timing and year of release. The residuals between thepredicted box office from this estimation and the actual box office provided the‘unexpected’ performance of a film. We then calculated individual-level scores for eachperson in the data set for each year based on the residuals of the films they had beeninvolved in over the preceding three years. To calculate our control, we averaged thesescores across all principals involved with a film.
In addition to these measures of the principals involved, the models include twoadditional film-level attributes. First, a dummy variable indicates whether the productionof a film took place in the United States. Films produced outside the United States mayhave been developed for a different audience, and hence may under-perform U.S.-produced films in the box office. Second, the models include controls for a film’s MPAArating.16 Both industry participants and students of the industry widely believe thatfamily-oriented films (G-rated) perform better, and that features produced for matureaudiences (R-rated) perform worse, at the box office (Litman, 1983; DeVany and Wallis,2002; Ravid and Busaroy, 2003). Dummy variables mark G- and R-rated features, withPG-rated films serving as the baseline category.
INSERT TABLE 3 ABOUT HERE
EstimationThe following equation represents our modeling approach for estimating logged boxoffice revenue (ln R):
ln Ri = aDTi + Sbxxi + si + gi + ti + eIi ,
where DT represents the strength of the direct tie linking the team of principals in film ito distributor j, x refers to a vector of control variables, s denotes a set of fixed effects fordistribution companies, g indicates fixed effects with respect to the film genre, and trepresents fixed effects for the year of the motion picture’s theatrical release. Though weremain agnostic about these effects, prior research has found significant effects on boxoffice performance due to both film genre (Litman, 1983; Prag and Casavant, 1994) anddistributor. If embedded exchange allows distribution companies to make betterselections, one would expect a > 0.
INSERT TABLE 3 ABOUT HERE
Table 3 reports the results of these estimates. The first column provides a baselineestimate of the determinants of box office success without considering who participatesin the film or their relations to the distributor. Films produced in the U.S. enjoy higherrevenues, perhaps because they had been developed to appeal to the American market;meanwhile R-rated movies garner less revenue, consistent with previous studies 16 MPAA ratings, initiated in 1968, represent a form of self-regulation by the movie industry in the UnitedStates. Distribution companies submit films to a review board for a rating recommendation. These ratingsreflect the content of the film: PG and R ratings alert potential viewers that the film contains some type ofcontent (profane language, sensuality, violence or nudity) deemed inappropriate for less mature audiences.
Self-confirming Dynamics 18
suggesting that Hollywood produces too many adult-oriented films (DeVany and Wallis,2002; Ravid and Busaroy, 2003). Distribution companies, genre and year all significantlyinfluence theatrical revenues. Model 5 introduces measures of the size of the team ofprincipals involved in the film and their cumulative experience. Both have significantpositive effects on the expected performance of the film. As noted above, each principalmay draw from a relatively distinct audience allowing films with more participants toattract a greater number of viewers, or consumers may consider principals additivelywhen deciding whether to see a feature (e.g., moviegoers that like both Sally Field andReese Witherspoon would have found Legally Blond 2 especially enticing). The fact thatexperience has a positive effect on box office could reflect several factors including theprominence of the principals, learning on the part of the film’s participants, or simplyselection.
The third set of estimates finally introduces the key variable of interest: the strength ofthe relationship tying the principals to the distributors. This variable has a substantialeffect on the expected box office of the film; a one standard deviation increase in thestrength of the team’s tie raises its expected revenue by 12% (= e.513 * .213). Controlling forboth easily observable and unexplained differences in the past performance of theprincipals does not eliminate the positive effect of the strength of the direct tie, thoughthese variables do improve the overall ability of the model to predict box office receipts(see model 7). Without further analysis, one might then conclude that these effects reflectthe ability of distributors to make a better selection of films when they have strongerrelations to the principals in the film, presumably thanks to their access to privateinformation. These results, however, fail to account for the distributor’s own behaviorand how those actions might influence the success of the film.
ACCOUNTING FOR EFFORT
Two variables – both under the control of the distributor – matter tremendously indetermining the box office success of a motion picture: the resources allocated tomarketing the film and the date on which theaters begin screening the movie.
A variety of issues likely contribute to the value of marketing in this setting. At the mostbasic level, advertising and other forms of promotion make consumers aware of theavailability of new films. Given the limited time that the typical movie spends in thetheaters, potential viewers have limited opportunities to learn about new offeringsthrough word of mouth; hence, advertising importantly broadcasts information on theavailability of new products. Beyond this basic level, advertising also plays an importantrole in allowing consumers to assess the likely fit between the film and their own tastes.Movies vary greatly in their appeal to audiences, and both distributors and consumersbenefit from appropriate matching – consumers in the pleasure received from the viewingand distributors in the positive word of mouth garnered from viewers (which caninfluence the success of a film). Distributors also likely hope to create positive affect forthe movies they promote.
Several factors account for the importance of release dates: mostly significantly, demandfluctuates substantially over the course of a year. This seasonality when coupled with the
Self-confirming Dynamics 19
short box office life means that release timing can critically affect the success of a film;or as Barry Reardon, Warner Brothers President of Distribution bluntly asserts, “If youdon’t pick the right release date, you can destroy a movie.” (Korts, 2001, pg. 514) Anarticle in the Wall Street Journal expands on this noting that:
Studio executives insist the release date is critical, in part because a film’sopening weekend is usually the most lucrative one for its studio. Financialagreements with theaters normally give the filmmaker a greater percentageof the box office during the first weeks of release. And in this gluttedmarket, studio executives also worry that theaters will replace a film withanother if it doesn’t win audience quickly (King, 1991).
Dependent variablesThe number of opening screens on which a film played in its first week of publicexhibition provides us with a measure of the level of resources allocated to promoting afilm.17 Though one might prefer an exact measure of the dollars devoted to marketing,distributors generally do not report these expenditures, making it impossible to assemblecomprehensive data. Incentives on both sides of the distributor-exhibitor relationship,however, ensure a tight link between marketing expenditures and the number of screens:When distributors promote a film heavily prior to its release, it makes sense for them toopen on as many screens as possible since the positive effects of advertising in the filmindustry appear to decay very rapidly, reaching nearly zero within two to three weeksafter the film’s release (Lehmann and Weinberg, 2000). On the other side, substantialadvertising expenditures entice more theater owners to exhibit the film because theyknow that the advertising will help bring customers to the theaters.
Despite these incentives, an accurate mapping of the number of screens to marketingeffort likely requires adjustment for two external factors: supply and demand. Whentheater owners have more movies from which to choose, each will, on average, appear onfewer screens. And as the number of screens available increases (from 1985 to 2002 thenumber of theater screens in the U.S. grew from roughly 20,000 to more than 35,000;NATO, 2002), each film will on average open on more screens. To account for theseeffects, we normalize the number of screens using a measure that accounts for bothforces: the average number of screens on which a movie opened in the same year ofrelease.18 Hence, our measure divides the raw count by this average.
Corroboration of this proxy involved comparing it to two datasets. The first set includesall films, released from 1991 to 1996, for which we could locate reports of marketingbudgets in Lukk (1997), the Hollywood Reporter, Variety, or through LEXIS/NEXIS.Within this set of 56 films, our measure correlated .890 with real dollar marketingexpenditures. A second sample of actual marketing effort came from a civil case privy to 17 Since limited release films – those first shown on a small number of screens to generate word-of-mouthwith the intention of being exhibited on hundreds of screens after a few weeks – follow a very differentmarketing strategy, we exclude these films from our study (roughly 2% of cases).18 Zuckerman and Kim (2003) also use the number of screens to proxy for marketing, though they(appropriately given their short window) do not adjust for the supply of and demand for movies.
Self-confirming Dynamics 20
private (probably more accurate) information on actual media expenditures for a randomsample of 250 films with a budget of more than $5 million opening between April 1995and April 1998 on at least 1000 screens. Even within this relatively truncated range, ourmeasure correlates .410 with actual marketing expenditures.
Seasonality captures the second type of marketing decision, whether a distributor releasesa film during a high demand period. Industry participants and observers have longunderstood that demand varies from week-to-week across the course of a year (Litman,1983; Radas and Shugan, 1998). Though most peak seasons revolve around holidays, wedevelop a continuous measure of seasonality by taking a moving average of total boxoffice receipts across all films for a three-week window centered around the film’srelease date during the previous three years.19 The three-week average allows the measureto accommodate the fact that some holidays shift slightly from year-to-year, while usingthe prior three years of data minimizes the effects of outliers on our seasonality measure.Figure 2 depicts the average value of the seasonality variable over the course of the year.One can clearly see that some weeks, particularly those surrounding major holidays andthe height of summer offer much larger potential audiences.
INSERT FIGURE 3 ABOUT HERE
EstimationOur approach to estimating marketing behavior essentially parallels that of ourperformance models:
Mi = aDTi + Sbxxi + si + gi + ti + eIi ,
where M can either denote the relative number of screens or seasonality (total demand inthe three week window following a film’s release), DT again represents the strength ofthe direct tie linking the team of principals to the distributor, x refers to a vector ofcontrol variables, and s , g, and t denote fixed effects for distribution companies, filmgenre and year respectively. The models estimating correlates of marketing decisionsdiffer in two respects from the performance models. On the one hand, the modelsreported in table 3 lack controls for the number of principals in the film. Though eachprincipal might represent a draw to a unique audience, we found it more difficult toimagine why the number of principals might influence these marketing decisions.20 Onthe other hand, the models here do include controls for the length of the film. Particularlywhen considering determinants of the number of opening week screens, theaters needmore screens with a longer movie to meet the same level of demand (since the longerlength necessarily entails fewer show times per day on each screen).
INSERT TABLE 4 ABOUT HERE
19 Prior research investigating seasonality in the film industry has typically looked only at whether a releasefalls on a holiday (e.g., Litman, 1983), though Ravid (1999) takes a similar approach to seasonality. Figure2 clearly shows the importance of non-holiday related variation in sales.20 The results nonetheless remain robust to the inclusion of this control.
Self-confirming Dynamics 21
The first two columns of Table 4 report the correlates of the number of opening weekscreens, a proxy for marketing expenditures. Model 8 demonstrates that distributorschoose to open films on more screens when they have a stronger direct tie to theprincipals involved in the film. This result holds even after controlling for easily-observable and difficult-to-observe quality differences among these principals (model11); interestingly, distribution companies appear insensitive to quality differences acrossfilms’ participants when making decisions regarding the amount of effort to allocate tomarketing a new film. Among the control variables, U.S. produced films, G-rated filmsand longer movies open on more screens; R-rated movies open on fewer screens than allothers. These results seem sensible as industry participants believe that G-rated filmsattract larger audiences while R-rated features appeal to a smaller set (or at least, some ofthose to whom they appeal likely find it difficult to gain admittance; see Medved, 1992,for qualitative evidence), also longer movies require more screens to schedule the samenumber of showings during the peak daily demand period from 7pm to 11pm.
The final two columns provide a parallel analysis of the determinants of a film’s openingdate. Once again, model 10 reveals that distribution companies favor films involvingprincipals with whom they have previously worked, this time with respect to schedulingthese films for attractive release dates. As with the number of screens, the observable andunexplained past performance of the participants involved in a project appear to have noeffect on the scheduling of its release.
Re-estimating box officeTo see how these marketing decisions influenced the performance of the films, Table 5re-estimates the revenue models controlling for these factors. The first column in thetable simply recounts the last model from Table 3 to ease comparisons. Model 12, thesecond column, includes the number of opening week screens and seasonality to accountfor marketing decisions. Both have very large and significant effects. Increasingmarketing effort, as represented by a larger number of opening week screens,dramatically improves the expected performance of the film. For example, opening ondouble the average number of screens more than triples the expected box office revenue(348% = e1.248 * (2-1)). Though less pronounced, release timing has a similar effect onperformance. Each unit of total demand (seasonality) raises a film’s expected box officeby roughly 17%. Since the total demand varies by a factor of more than three across thecourse of a year, opening a movie between Christmas and New Year’s Day (the peakperiod) versus the middle of September (the weakest time) increases its expected revenueby more than 80%. Notably, the effect of prior relations with the distributor disappearsafter controlling for these factors; thus, it would appear that the positive effect ofembedded transaction exists not because distributors show greater acuity in selectingfilms when they have prior experience with the principals, but rather because they favorthese films when allocating their valuable marketing dollars and release windows.
INSERT TABLE 5 ABOUT HERE
Model 13 examines this finding in somewhat more detail. The non-significant effect ofprior relations, while interesting, merely reveals that the choice does not appear to matter;in the absence of a better method for choosing which pictures to promote, this bias in
Self-confirming Dynamics 22
favor of repeated transactions does not necessarily imply any economic inefficiency. Thethird column evaluates, somewhat more saliently, whether the returns to marketinginvestments vary across movies as a function of the strength of the direct tie between thedistributor and the film’s principals. We examine this question by interacting each of themarketing variables – number of screens and seasonality – with the strength of the directtie linking the principals to the distributor.21 The results reveal that distributors receivelower average returns from their efforts to open movies with which they have strongerties. Likewise, these films also benefit less from favorable opening dates. In each case, aone standard deviation increase in the strength of the tie linking the distributor to the filmreduces the effectiveness of promotion effort by about 6%.22 These negative coefficientssuggest a suboptimal equilibrium, since distributors apparently would have benefitedfrom allocating their effort more evenly across the films that they carried.23
These results also allow us to rule out a subtle alternative explanation for our results. Onemight argue that distributors allocate more to marketing films with principals with whomthey have previously worked because they learn how best to promote these pictures. Ifthat story held, however, one would expect to see a positive coefficient on the interactionterm between the strength of the tie and marketing effort and seasonality becausedistributors should realize increasing returns to their investments in a particular set ofprincipals. The models nonetheless find the opposite.
Three additional alternative explanations struck us as important to consider in detail. Thefirst argues that distributors benefit in repeated transactions not by selecting better qualityfilms, but rather through economizing on search costs. Though this explanation couldaccount for both the prevalence of repeated interactions and the absence of a film-levelperformance advantage to repeated exchange (because this cost savings would benefitfirm-level performance), it cannot explain the excessive marketing of films made byknown parties or the negative interactions between marketing effort and repeatedexchange. Conditional on having selected a set of pictures, economizing on search costsshould not influence marketing expenditures. Hence, while repeated transactions mayindeed reduce search costs, this explanation cannot account for our results.
Second, one might worry that our measure of the strength of the tie connecting the film tothe distributor captures other important characteristics of the film, most notably thecontracts governing the property rights to the film. Three issues seem relevant. In somecases, distributors pay for all of the production costs (i.e. they do ‘in house’ production),thereby absorbing all of the risk and potentially shifting their incentives to promote thefilm. Though these situations represent a small proportion of projects (6% according to
21 We mean deviate the variables before calculating the interaction terms to minimize the co-linearity of theinteractions with their components.22 The effect of the relative number of screens declines from roughly 1.3 to 1.21, a 7% decline, with a onestandard deviation increase in tie strength, and the seasonality coefficient shrinks from .17 to .16, a 6%reduction in effect.23 The optimal point technically occurs where the distributor equalizes the marginal, rather than theaverage, returns to their advertising expenditures. If one assumes, however, that the returns to marketingdecline at a similar rate across films, then lower average returns suggest lower marginal returns as well.
Self-confirming Dynamics 23
Vogel, 2001), they might nonetheless influence the results. In other situations,distributors form output deals with producers (see footnote 9). Though rare, these outputdeals link producers to distributors and hence may influence our results. Finally, sequelsrepresent another situation in which contracts (in this case for the original film) mightexplicitly link principals to distributors across films.24
To test the robustness of the results to the exclusion of these cases, we estimated themodels for the subset of cases in which the producer does not have a prior connection tothe distributor. In all of the circumstances described above, we would expect a priorproducter-distributor tie. In the case of in house production, distributors assign internalemployees to manage the project. As permanent employees of the distributor, they willappear to work repeatedly across projects with the same distribution company. Outputdeals similarly link producers and distributors across multiple projects, and sequels nearlyalways have the same producers as the original film (also carried by the same distributor).Hence, excluding all films with prior producer-distributor ties from the analysiseliminates those cases one would worry about (though it also removes many additionalcases that should not raise concerns).
INSERT TABLE 6 ABOUT HERE
Table 6 reports these models. The identification of the effect in these analyses comesonly from prior interactions between distributors and the writers, directors and actorsworking on a project. As one can clearly see, the results hold even while excluding caseswith prior producer-distributor ties. Moreover, the coefficients remain largely unchanged.Hence, it would appear that these contractual issues have little bearing on our results.
INSERT TABLE 7 ABOUT HERE
Third, a rather subtle alternative suggests that selection through embedded exchangeimproves performance not through an increase in the mean revenues, but rather in areduction in their variability (potentially a very important concern in high risk industries,such as entertainment). To address this possibility, we analyzed the absolute value of theresiduals (from model 13). Table 7 reports the results of these models using maximumlikelihood estimation methods for data with a truncated normal distribution (Amemiya,1973). Although some factors, most notably marketing expenditures, do reduce thevariability of performance, repeated interactions offer no such advantage. Hence, sometype of risk-return tradeoff does not appear to account for our findings.
DISCUSSION
The results appear broadly consistent with what one would expect if self-confirmingdynamics account for the stable patterns of repeated interactions between parties in thefilm industry. Distributors work with the same parties from film to film. Even when theydo work with new individuals, distributors invest less in the promotion of these projects,thereby dramatically reducing their odds of commercial success. Hence, a belief in the
24 Virtually every distribution contract includes a clause assigning the rights to distribute future sequels aswell as the current film to the distributor (Cones, 1997).
Self-confirming Dynamics 24
superiority of working with known parties remains unchallenged in the absence ofrelatively sophisticated and unbiased analysis.
Though our results focus on repeated interaction as a form of embedded exchange, thesedynamics likely extend to indirect ties as well. In other words, when transacting with newparties, distributors likely favor friends of individuals with whom they have a great dealof experience. Not only do they more likely begin working with these individuals, butalso when they do first work with them, they probably invest more resources in theirprojects, increasingly the likelihood of their success and concomitantly of a positive firstexperience. These favorable first transactions then increase the likelihood of subsequentexchange. Social structure thus engenders behavior that reinforces that very structure.
Other types of self-confirming dynamics also likely operate both in and beyond the filmindustry. Careful examination of the coefficients, for example, reveals another interestingtype of self-confirming dynamic: Consistent with both industry beliefs and prior findings(which did not account for marketing effects), the models that do not control formarketing effort show that R-rated movies garner lower revenues than similar G- andPG-rated features. This effect appears to exist, however, as a result of distributors’ ownmarketing decisions: They both open these movies on fewer screens, 27% fewer onaverage, and release them during lower demand times of the year. After controlling forthese decisions, R-rated features show no distinguishable difference in box officeperformance from movies targeted at younger audiences. Thus, it would appear then thatdistributors should actually devote greater resources to promoting adult-oriented films.25
Though not explicitly identified as such, additional evidence on self-confirmingdynamics in the film industry also appears in Zuckerman and Kim (2003). Art housedistributors market their films far more narrowly than those oriented at the mass market,virtually assuring that these pictures receive less attention. Interestingly, this marketsegmentation may perpetuate beliefs that the art market represents but a small niche inthe market. As art market breakouts, such as My Big, Fat, Greek Wedding and Bend ItLike Beckham, occasionally remind us: many films relegated to these niche marketsmight appeal to a broad audience if only given the chance.
These self-confirming dynamics might also account, for example, for the difficulty thatboth women and minorities have faced in breaking into leading positions in the industry.Consider a quote from Carolyn Shelby, a writer, offered by Bielby and Bielby (1996):
You come in with an action project, and they see you’re a woman, and youcan see it’s not something they’re comfortable with. They’re thinking ‘smallpicture’ rather than Terminator 2 when you’re sitting there talking to them.
25 Indeed, interaction effects parallel to those included in models 10 and 11 suggest that distributors receivehigher average returns to marketing R-rated movies than more family-oriented fare, though it does notappear that they would benefit from re-thinking the release timing of these films (perhaps not surprising asthe school holidays that seem to drive much of the seasonality in demand likely have less influence on adultmovie-goers).
Self-confirming Dynamics 25
Given the ability of distributors to enact these results, one could easily imagine how thesedynamics would play out: The distributor might agree to Carolyn’s project, but investlittle in it. And when considering their decision in the future, managers at the distributormight even for congratulate themselves for “correctly” seeing that her project would onlyattract a small audience – not recognizing that they produced this effect themselves.
Though the analysis here focuses on the film industry, these dynamics undoubtedly playout in many other industries and settings. A wide variety of markets exhibit embeddedexchange; though in some cases, these structures undoubtedly address market failures, inother cases – as in the film industry – participants themselves may enact these effects.Labor markets, in particular, strike us as an interesting setting for considering theseprocesses. Research has repeatedly demonstrated that social networks strongly structurethe matching process between workers and positions (Granovetter, 1973), and morerecent research suggests that employees identified through social networks perform betterthan those hired without a connection (e.g., Fernandez and Weinberg, 1997). Theseresults, however, may reflect the fact that individuals hired through a connection receivebetter treatment (perhaps more extensive mentoring) when they arrive at the firm.
As researchers consider these dynamics in other settings, however, careful attention mustbe paid to potential asymmetry in the direction of the advantages of embedded exchange.Though efficiency explanations (search and monitoring benefits) for embeddedtransaction frequently pose these effects as advantageous to both parties involved, theself-confirming dynamics described here convey an image of something more like a zero-sum game. In repeated transactions, the distributors in the film industry invest too muchin marketing – to the benefit of the principals involved in the film. To the extent thatbanks enact the success of the firms to which they extend credit, they may transfer wealthto the owners of the firms. Who likely benefits from embedded exchange, buyers versussellers, does not appear consistent across situations; thus, researchers must remain alert tothe particulars of the settings they examine.
Ultimately, these effects can not only influence who exchanges with whom, but also reifythe patterns of stratification in communities and societies at large. As Eliza Doolittleremarks in George Bernard Shaw’s Pygmalion, the play from which one of the originalstudies of self-confirming dynamics in education took its name:
You see, really and truly, apart from the things anyone can pick up (thedressing and the proper way of speaking and so on), the difference between alady and a flower girl is not how she behaves, but how she’s treated. I shallalways be a flower girl to Professor Higgins, because he always treats me as aflower girl, and always will, but I know I can be a lady to you because youalways treat me as a lady, and always will.
Self-confirming Dynamics 26
REFERENCES
Akerlöf, George A. (1970). “The market for ‘lemons’: Quality, uncertainty and themarket mechanism.” Quarterly Journal of Economics, 84: 488-500
Amemiya, Takeshi. (1973). “Regression analysis when the dependent variable istruncated normal.” Econometrica, 41: 997-1016
Bacon, Francis. (1620|2002). The New Organon, edited by Lisa Jardine and MichaelSilverthorne. Boston: Cambridge University Press.
Baker, Wayne E. (1984). “The social structure of a national securities market.” AmericanJournal of Sociology, 90: 775-811
Baker, Wayne E. (1990). “Market networks and corporate behavior.” American Journalof Sociology, 96: 589-625
Bakker, Gerben. (2001). “Stars and stories: How films became branded products.”Enterprise and Society, 2: 461-502
Bielby, Denise D., and William T. Bielby. (1996). “Women and men in film: Genderinequality among writers in a culture industry.” Gender and Society, 10: 248-270
Bott, Elizabeth. (1957). Family and Social Network: Roles, Norms and ExternalRelationships in Ordinary Urban Families. London: Tavistock
Burt, Ronald S. (1992). Structural Holes. Cambridge, MA: Harvard University Press.
Burton, M. Diane, Jesper B. Sørensen, and Christine Beckman. (2002). “Coming fromgood stock: Career histories and new venture formation.” Research in the Sociology ofOrganizations, 19: 229-262
Caves, Richard E. (2000). Creative Industries: Contracts between Art and Commerce.Cambridge, MA: Harvard University Press
Chamberlain, Gary. (1980). “Analysis of covariance with qualitative data.” Review ofEconomic Studies, 47: 225-238
Charness, Gary, and Nuno Garoupa. (2000). “Reputation, honesty and efficiency withinsider information: An experiment.” Journal of Economics and Management Strategy, 9:425-451
Chisholm, Darlene. (1997). “Profit-sharing versus fixed-payment contracts: Evidencefrom the motion pictures industry.” Journal of Law, Economics and Organization, 13:169-201
Self-confirming Dynamics 27
Coleman, James S. (1990). Foundations of Social Theory. Cambridge, MA: HarvardUniversity Press
Coleman, James S., Elihu Katz and Herbert Mendel. (1957). “The diffusion of aninnovation among physicians.” Sociometry, 20: 253-270
Conant, Michael. (1960). Antitrust in the Motion Picture Industry. Berkeley, CA:University of California Press
Cones, John W. (1997). The Feature Film Distribution Deal. Carbondale, IL: SouthernIllinois University Press
Darr, Eric D., Linda Argote, and Dennis Epple. (1995). “The acquisition, transfer anddepreciation of knowledge in service organizations: Productivity in franchises.”Management Science, 41: 1750-1762
Davila, Antonio, George Foster, and Mahendra Gupta. (2001). “The impact of rounds ofventure capital funding on the growth strategy of startups.” Research paper #1727,Graduate School of Business, Stanford University.
DeVany, Arthur, and W. David Wallis. (2002). “Does Hollywood make too many R-rated movies? Risk, stochastic dominance and the illusion of expectation.” Journal ofBusiness, 75: 425-451
DiMaggio, Paul J. (1987). “Classification in art.” American Sociological Review, 52:440-455.
DiMaggio, Paul J., and Hugh Louch. (1998). “Socially embedded consumer transactions:For what kinds of purposes do people use networks most?” American SociologicalReview, 63: 619-637
Ellsberg, Daniel. (1961). “Risk, ambiguity, and the Savage axioms.” Quarterly Journal ofEconomics, 75: 643-669
Faulkner, Robert R., and Andy B. Anderson. (1987). “Short-term projects and emergentcareers: Evidence from Hollywood.” American Journal of Sociology, 92: 879-909
Fernandez, Roberto M., and Nancy Weinberg. (1997). “Sifting and sorting: Personalcontacts and hiring in a retail bank.” American Sociological Review, 62: 883-902
Fried, Vance H., and Robert D. Hisrich. (1994). “Toward a model of venture capitalinvestment decision making.” Financial Management, 23: 28-37
Fox, Craig R., and Amos Tversky. (1995). “Ambiguity aversion and comparativeignorance.” Quarterly Journal of Economics, 110: 585-603
Self-confirming Dynamics 28
Fox, Craig R., Brett A. Rogers, and Amos Tversky. (1996). “Options traders exhibitsubadditive decision weights.” Journal of Risk and Uncertainty, 13: 5-17
Fudenberg, D. and D. Levine. (1993). “Self-confirming equilibrium” Econometrica, 61:523-545
Geertz, Clifford. (1978). “The bazaar economy: Information and search in peasantmarketing.” American Economic Review, 68: 28-32
Geletkanycz, Marta A., and Donald C. Hambrick. (1997). “The external ties of topexecutives: Implications for strategic choice and performance.” Administrative ScienceQuarterly, 42: 654-681
Gould, Roger V. (2002). “The origins of status hierarchies: A formal theory andempirical test.” American Journal of Sociology, 107: 1143-1178
Gouldner, Alvin W. (1960). “The norm of reciprocity: A preliminary statement.”American Sociological Review, 25: 161-179
Granovetter, Mark S. (1973). “The Strength of Weak Ties.” American Journal ofSociology, 78: 1360–1380.
Granovetter, Mark S. (1985). “Economic action and social structure: The problem ofembeddedness.” American Journal of Sociology, 91: 481-510
Guseva, Alya, and Akos Rona-Tas. (2001). “Uncertainty, risk and trust: Russian andAmerican credit card markets compared.” American Sociological Review, 66: 623-646
Hansen, Morten T. (1999). “The search-transfer problem: The role of weak ties in sharingknowledge across organization subunits.” Administrative Science Quarterly, 44: 82-111
Hayek, Fredrich A. von. (1937). “Economics of knowledge.” Economica, 4: 33-54
Heide, Jan B., and Anne S. Miner. (1992). “The shadow of the future: Effects ofanticipated interaction and frequency of contact on buyer-supplier cooperation.” Academyof Management Journal, 35: 265-291
Ingram, Paul and Peter W. Roberts. (2000). “Friendships among competitors in the in theSydney hotel industry.” American Journal of Sociology, 106: 387-423
Jones, Martin, and Robert Sugden. (2001). “Positive confirmation bias in the acquisitionof information.” Theory and Decision, 50: 59-99
Kalai, Ehud, and Ehud Lehrer. (1993). “Subjective equilibrium in repeated games.”Econometrica, 61: 1231-1240
Self-confirming Dynamics 29
Kim, Harris H., and Edward O. Laumann. (2003). “Network endorsement and socialstratification in the legal profession.” Research in the Sociology of Organizations, 20:
King, Thomas R. (1991). “Trying to enhance new films’ prospects, studios increasinglyshift release dates.” Wall Street Journal, October 15: B1
Kollock, Peter. (1994). “The emergence of exchange structures: An experimental study ofuncertainty, commitment and trust.” American Journal of Sociology, 100: 313-345
Korts, Kenneth S. (2001). “The strategic effects of vertical market structure: Commonagency and divisionalization in the U.S. motion picture industry.” Journal of Economicsand Management Strategy, 10: 509-528
Kreps, David M., and Robert Wilson. (1982). “Reputation and imperfect information.”Journal of Economic Theory, 27: 253-279
Laumann, Edward O. (1966). Prestige and Association in Urban Community.Indianapolis: Bobbs-Merrill
Lehmann, Donald R., and Charles B. Weinberg. (2000). “Sales through sequentialdistribution channels: An application to movies and videos.” Journal of Advertising, 64:18-33
Litman, Barry R. (1983). “Predicting the success of theatrical movies: An empiricalstudy.” Journal of Popular Culture, 17: 159-175
Litman, Barry R. (1998). The Motion Picture Mega-Industry. Boston: Allyn and Bacon
Litwak, Mark. (1986). Reel Power. Los Angeles: Silman-James Press
Litwak, Mark. (1998). Contracts for the Film and Television Industry (2nd Edition). LosAngeles: Silman-James Press
Lovaglia, Michael J., Jeffrey W. Lucas, Jeffrey A. Houser, Shane R. Thye, and BarryMarkovsky. (1998). “Status processes and mental ability test scores.” American Journalof Sociology, 104: 195-228
Løvås, Bjørn, and Olav Sorenson (2003). “Social capital, competition and resourcemobilization.” Working paper, London Business School
Lukk, Tiiu. (1997). Movie Marketing: Opening the Picture and Giving It Legs. LosAngeles: Silman-James Press.
Markovsky, Barry, David Willer, and Travis Patton. (1988). “Power relations inexchange networks.” American Sociological Review, 53: 220-236

Self-confirming Dynamics 30
Medved, Michael. (1992). Hollywood vs. America: Popular Culture and the War onTraditional Values. New York: Harper Collins.
Merry, Sally E. (1984). “Rethinking gossip and scandal.” Pp. 271-302 in Toward aGeneral Theory of Social Control. Vol. 1, Fundamentals, edited by Donald Black. NewYork: Academic Press
Merton, Robert K. (1948). “The self-confirming prophecy.” Antioch Review, Summer:193-210
Merton, Robert K. (1968). “The Matthew effect in science.” Science, 159: 56-63
Mitchell, William, and Kulwant Singh (1996). “Survival of businesses usingcollaborative relationships to commercialize complex goods.” Strategic ManagementJournal, 17: 169-196
Mizruchi, Mark S. (1992). The Structure of Corporate Political Action: InterfirmRelationships and Their Consequences. Cambridge, MA: Harvard University Press
National Association of Theater Owners (NATO). (2002). Encyclopedia of Exhibition.North Hollywood, CA: National Association of Theater Owners.
Pfeffer, Jeffrey, and Gerald R. Salancik. (1978). The External Control of Organizations.New York: Harper & Row
Podolny, Joel M. (1993). “A status-based model of market competition.” AmericanJournal of Sociology, 98: 829-872
Podolny, Joel M. (1994). “Markey uncertainty and the social character of economicexchange.” Administrative Science Quarterly, 39: 458-483
Portes, Alejandro and Julia Sensenbrenner. (1993). “Embeddedness and immigration:Notes on the social determinants of economic action.” American Journal of Sociology,98: 1320-1350
Powell, Walter W., Ken W. Koput, and Laurel Smith-Doerr. (1996). “Interorganizationalcollaboration and the locus of innovation: Networks of learning in biotechnology.”Administrative Science Quarterly, 41: 116-145
Prag, Jay, and James Casavant. (1994). “ An empirical study of the determinants ofrevenues and marketing expenditures in the motion picture industry.” Journal of CulturalEconomics, 18: 217-235
Radas, Sonja, and Steven M. Shugan. (1998). “Seasonal marketing and timing newproduct introductions.” Journal of Marketing Research, 35: 296-315
Self-confirming Dynamics 31
Ravid, S. Abraham. (1999). “Information, blockbusters and stars.” Journal of Business,72: 463-492
Ravid, S. Abraham, and Suman Busaroy. (2003). “Beyond morality and ethics: Executiveobjective function, the R-rating puzzle and the production of violent films.” Journal ofBusiness, forthcoming
Rosen, Sherwin. (1981). “The economics of superstars.” American Economic Review, 71:845-854
Rosenthal, Robert, and Leonore Jacobson. (1968). Pygmalion in the Classroom: TeacherExpectations and Pupils’ Intellectual Development. New York: Rinehart & Winston
Ryall, Michael D. (2003). “Subjective rationality, self-confirming equilibrium andcorporate strategy.” Management Science, 49: 936-949
Ryan, Bryce, and Neil C. Gross. (1943). “The diffusion of hybrid seed corn in two Iowacommunities.” Rural Sociology, 8: 15-24
Simmel, Georg. (1908|1950). The Sociology of Georg Simmel, translated by Kurt Wolff.New York: Free Press.
Sorenson, Olav and Toby E. Stuart. (2001). “Syndication networks and the spatialdistribution of venture capital investments.” American Journal of Sociology, 106: 1546-1588
Squire, Jason E. (Ed.) (1992). The Movie Business Book. New York: Fireside
Stuart, Toby E. (2000). “Inorganizational alliances and the performance of firms: A studyof growth and innovation rates in a high-technology industry.” Strategic ManagementJournal, 21: 791-811
Stuart, Toby E., Ha Hoang and Ralph C. Hybels. (1999). “Interorganizationalendorsements and the performance of entrepreneurial ventures.” Administrative ScienceQuarterly, 44: 315-349
Stuart, Toby E., and Olav Sorenson. (2003). “The geography of opportunity: Spatialheterogeneity in founding rates and the performance of biotechnology firms.” ResearchPolicy, 32: 229-253
Thorton, Rebecca Achee, and Peter Thompson. (2001). “Learning from experience andlearning from others: An exploration of learning and spillovers in wartime shipbuilding.”American Economic Review, 91: 1350-1368
Self-confirming Dynamics 32
Uzzi, Brian. (1996). “The sources and consequences of embeddedness for the economicperformance of organizations: The network effect.” American Sociological Review, 61:674-698
Uzzi, Brian. (1999). “Embeddedness in the making of financial capital: How socialnetworks and relations benefit firms seeking financing.” American Sociological Review,64: 481-505
Veblen, Thorstein B. (1899|1979) The Theory of the Leisure Class: An Economic Studyof Institutions. London: Penguin Classics.
Verter, Geoffrey, and Anita McGahan. (1998). “Coming soon: A theater near you.”Harvard Business School case (9-797-011)
Vogel, Harold L. (2001). Entertainment Industry Economics: A Guide for FinancialAnalysis (5th Edition). Boston: Cambridge University Press.
Wason, Peter C. (1968). “Reasoning about a rule.” Quarterly Journal of ExperimentalPsychology, 20: 273-281
Zaheer, Akbar, Bill McEvily, and Vincenzo Perrone. (1998). “Does trust matter?Exploring the effects of interorganizational and interpersonal trust on performance.”Organization Science, 9: 141-159
Zuckerman, Ezra W., and Tai-Young Kim. (2003). “The critical tradeoff: Identityassignment and box-office success in the feature film industry.” Industrial and CorporateChange, 12: 27-67

Self-confirming Dynamics 33
Table 1: Descriptive statisticsVariable Mean Std. Dev. Min. Max.
Dyad analysisPrior tie .06 .23 0 1Number of ties .10 .63 0 64Distributor capacity 5.10 6.19 1 35Distributor specialization .27 .36 0 1
Film-level analysisLn (box office receipts) 14.00 3.08 5.36 20.21Opening screens 1.02 1.29 0 6Seasonality 3.28 1.00 1.84 7.06Number of principals 7.67 2.08 1 18Principals’ experience (3-year) 7.36 7.32 0 77Strength of direct tie to distributor .12 .21 0 1Observable past performance 12.72 5.94 0 18.42Unexplained past performance .14 .43 -4.45 2.57G rating .02 .15 0 1R rating .49 .50 0 1US film .75 .43 0 1Film length 103.1 17.38 39 280

Self-confirming Dynamics 34
Table 2: Conditional logit estimates of film-distributor agreement*Variable Model 1 Model 2 Model 3Prior tie (0/1) 1.284••
(.044)Prior producer tie 1.757••
(.056)Prior writer tie .891••
(.072)Prior director tie .674••
(.077)Prior actor tie .642••
(.047)Number of ties (not indummies)
.479••(.017)
.305••(.021)
Distributor capacity .132••(.002)
.099••(.002)
.104••(.002)
Distributorspecialization
2.522••(.054)
2.409••(.064)
2.418••(.056)
N 323,475 323,475 323,475Log-likelihood -17792.7 -16302.3 -16136.3Pseudo R2 .163 .233 .241* Significance levels: • p < .05; •• p < .01

Self-confirming Dynamics 35
Table 3: Fixed effects estimates of logged box office receipts*Variable Model 4 Model 5 Model 6 Model 7Number of principals .090••
(.015).091••(.015)
.083••(.015)
Principals’ experience(3-year window)
.073••(.005)
.070••(.005)
.056••(.005)
Strength of direct tie todistributor
.513••(.140)
.364••(.141)
Observable pastperformance
.025••(.007)
Unexplained pastperformance
.515••(.068)
G rating .124(.243)
.386(.236)
.378(.235)
.354(.233)
R rating -.287••(.064)
-.287••(.062)
-.281••(.062)
-.294••(.061)
US film .740••(.081)
.499••(.080)
.501••(.079)
.488••(.080)
Distributor fixedeffects
368 groupsF = 16.10••
368 groupsF = 11.57••
368 groupsF = 11.26••
368 groupsF = 10.02••
Genre fixed effects 13 groupsF = 13.12••
13 groupsF = 12.22••
13 groupsF = 11.49••
13 groupsF = 12.85••
Year fixed effects 17 groupsF = 4.73••
17 groupsF = 2.16••
17 groupsF = 2.09••
17 groupsF = 2.04•
N 5065 5065 5065 5065Overall R2 .181 .316 .327 .368* Significance levels: • p < .05; •• p < .01
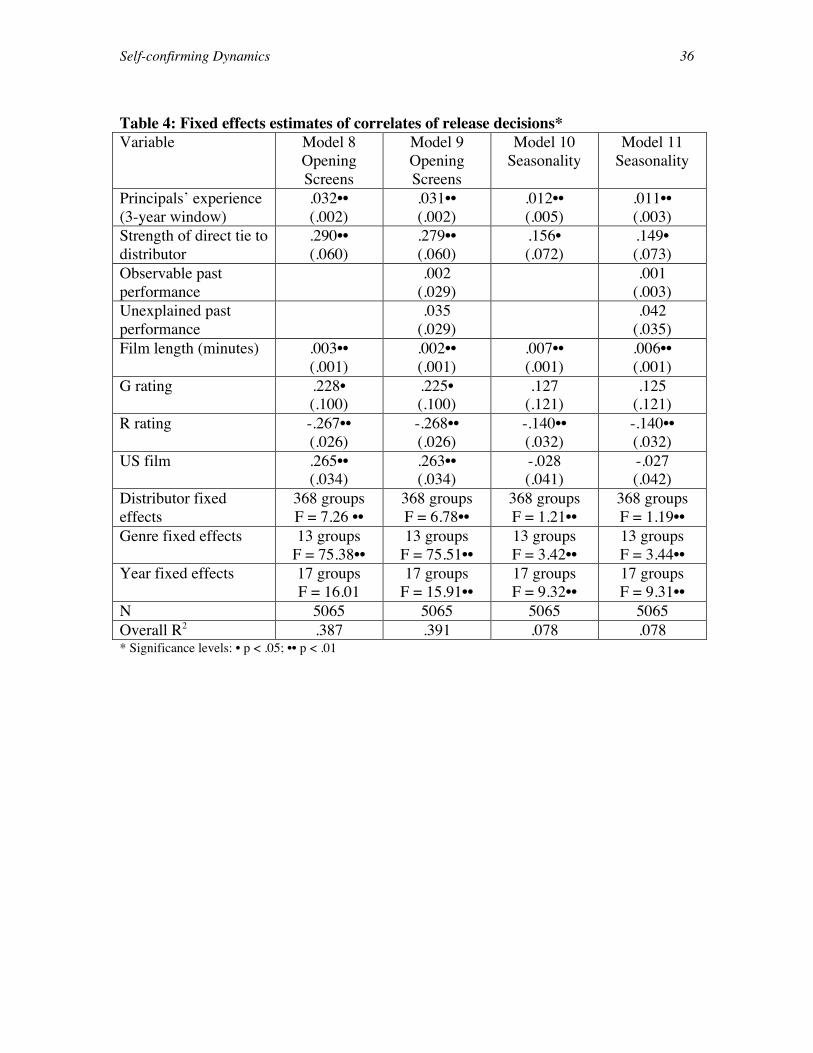
Self-confirming Dynamics 36
Table 4: Fixed effects estimates of correlates of release decisions*Variable Model 8
OpeningScreens
Model 9OpeningScreens
Model 10Seasonality
Model 11Seasonality
Principals’ experience(3-year window)
.032••(.002)
.031••(.002)
.012••(.005)
.011••(.003)
Strength of direct tie todistributor
.290••(.060)
.279••(.060)
.156•(.072)
.149•(.073)
Observable pastperformance
.002(.029)
.001(.003)
Unexplained pastperformance
.035(.029)
.042(.035)
Film length (minutes) .003••(.001)
.002••(.001)
.007••(.001)
.006••(.001)
G rating .228•(.100)
.225•(.100)
.127(.121)
.125(.121)
R rating -.267••(.026)
-.268••(.026)
-.140••(.032)
-.140••(.032)
US film .265••(.034)
.263••(.034)
-.028(.041)
-.027(.042)
Distributor fixedeffects
368 groupsF = 7.26 ••
368 groupsF = 6.78••
368 groupsF = 1.21••
368 groupsF = 1.19••
Genre fixed effects 13 groupsF = 75.38••
13 groupsF = 75.51••
13 groupsF = 3.42••
13 groupsF = 3.44••
Year fixed effects 17 groupsF = 16.01
17 groupsF = 15.91••
17 groupsF = 9.32••
17 groupsF = 9.31••
N 5065 5065 5065 5065Overall R2 .387 .391 .078 .078* Significance levels: • p < .05; •• p < .01

Self-confirming Dynamics 37
Table 5: Fixed effects estimates of logged box office receipts (including controls forrelease decisions)*Variable Model 7 Model 12 Model 13 Model 14Number of principals .083••
(.015).029•(.013)
.032•(.013)
.024(.013)
Principals’ experience.(3-year window)
.056••(.005)
.017••(.004)
.017••(.004)
.021••(.004)
Strength of direct tie todistributor
.364••(.141)
-.014(.118)
.086(.120)
.109(.121)
X opening screens -.364••(.080)
-.350••(.081)
X seasonality -.054••(.016)
-.053••(.016)
Opening screens 1.248••(.029)
1.289••(.030)
1.293••(.030)
Seasonality .161••(.024)
.170••(.024)
.175••(.024)
Observable pastperformance
.025••(.007)
.028••(.006)
.026••(.006)
.032••(.006)
Unexplained pastperformance
.515••(.068)
.430••(.057)
.438••(.056)
.
G rating .354(.233)
.105(.195)
.131(.195)
.135(.196)
R rating -.294••(.061)
.045(.052)
.039(.052)
.038(.052)
US film .488••(.080)
.169•(.067)
.170•(.069)
.132•(.067)
Distributor fixedeffects
368 groupsF = 10.02••
368 groupsF = 6.88••
368 groupsF = 6.71••
368 groupsF = 6.95••
Genre fixed effects 13 groupsF = 12.85••
13 groupsF = 4.38••
13 groupsF = 4.46••
13 groupsF = 5.20••
Year fixed effects 17 groupsF = 2.04•
17 groupsF = 6.23••
17 groupsF = 6.13••
17 groupsF = 5.79••
N 5065 5065 5065 5065Overall R2 .368 .636 .641 .633* Significance levels: • p < .05; •• p < .01

Self-confirming Dynamics 38
Table 6: Fixed effects estimates of logged box office receipts (excluding cases withprior producer-distributor relations)*Variable Model 14 Model 15 Model 16Number of principals .074••
(.018).028
(.015).028
(.015)Principals’ experience.(3-year window)
.010••(.008)
.033••(.007)
.032••(.007)
Strength of direct tie todistributor
.321••(.081)
-.048(.198)
-.039(.197)
X opening screens -.326•(.150)
X seasonality -.051•(.022)
Opening screens 1.316••(.036)
1.317••(.037)
Seasonality .173••(.029)
.167••(.029)
Observable pastperformance
.008(.008)
.018••(.006)
.018••(.006)
Unexplained pastperformance
.435••(.081)
.415••(.069)
.419••(.069)
G rating .505(.261)
.137(.222)
.161(.222)
R rating -.280••(.072)
.054(.062)
.049(.062)
US film .432••(.087)
.134(.074)
.139(.074)
Distributor fixedeffects
368 groupsF = 7.77••
368 groupsF = 5.62••
368 groupsF = 5.56••
Genre fixed effects 13 groupsF = 6.41••
13 groupsF = 3.68••
13 groupsF = 3.75••
Year fixed effects 17 groupsF = 1.44
17 groupsF = 3.26••
17 groupsF = 3.22••
N 4005 4005 4005Overall R2 .334 .593 .595* Significance levels: • p < .05; •• p < .01

Self-confirming Dynamics 39
Table 6: Maximum likelihood truncated normal estimates of the absolute residualsof logged box office receipts (from model 13)*Variable Model 17Number of principals -.086••
(.022)Principals’ experience.(3-year window)
.008(.008)
Strength of direct tie todistributor
-.282(.215)
Opening screens -1.354••(.069)
Seasonality .170••(.041)
Observable pastperformance
-.020•(.010)
Unexplained pastperformance
-.132(.097)
G rating -.503(.348)
R rating -.429••(.086)
US film .561••(.099)
Constant 1.305••(.216)
N 5065* Significance levels: • p < .05; •• p < .01
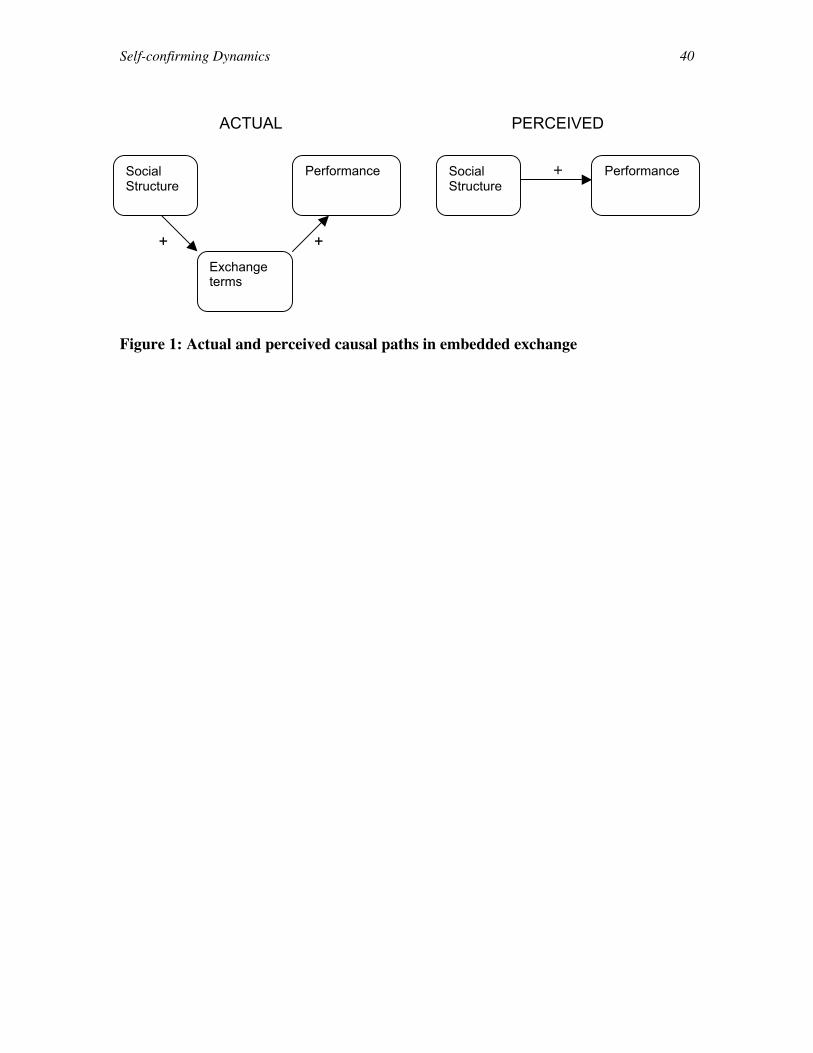
Self-confirming Dynamics 40
ACTUAL PERCEIVED
Figure 1: Actual and perceived causal paths in embedded exchange
SocialStructure
Performance
+
Exchangeterms
+
SocialStructure
Performance+
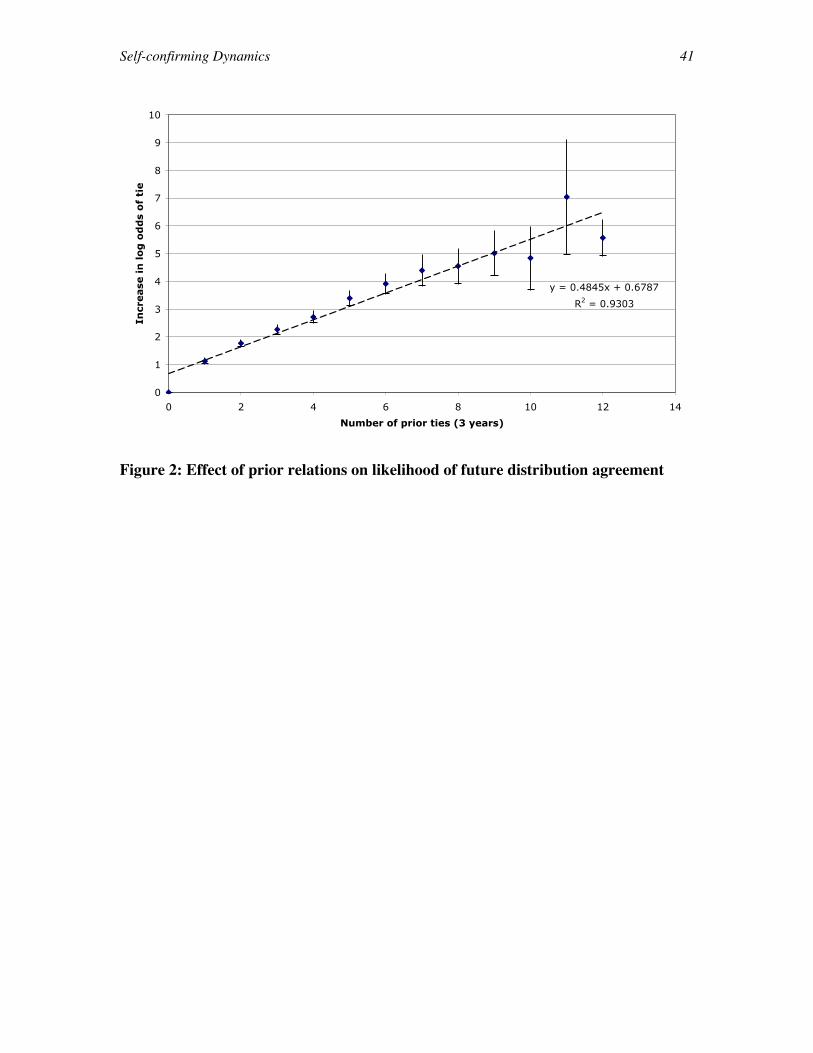
Self-confirming Dynamics 41
y = 0.4845x + 0.6787
R2 = 0.9303
0
1
2
3
4
5
6
7
8
9
10
0 2 4 6 8 10 12 14
Number of prior ties (3 years)
Incr
ease
in
lo
g o
dd
s o
f ti
e
Figure 2: Effect of prior relations on likelihood of future distribution agreement
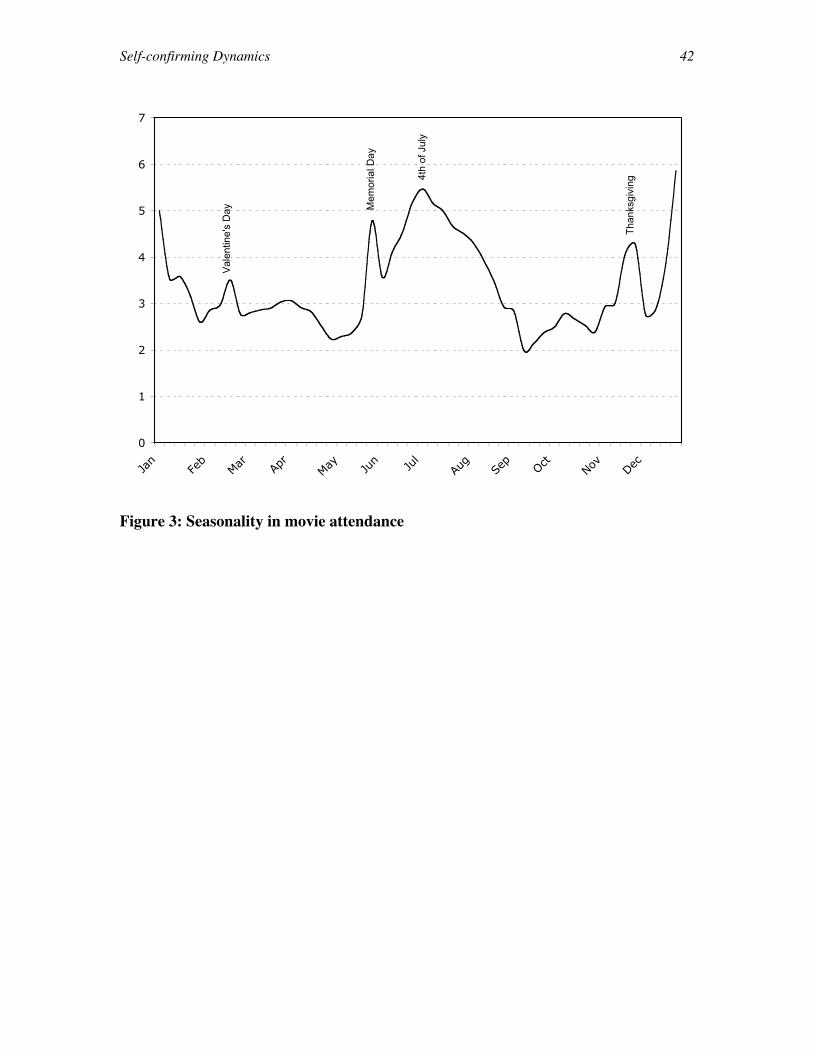
Self-confirming Dynamics 42
0
1
2
3
4
5
6
7
Jan
Feb
Mar Apr
May Jun Ju
lAu
gSe
pOct
Nov Dec
Val
entin
e's
Day M
emor
ial D
ay
4th
of J
uly
Tha
nksg
ivin
g
Figure 3: Seasonality in movie attendance