(social) networks analysis iii prof. dr. daning hu department of informatics university of zurich...
TRANSCRIPT

(Social) Networks Analysis III
Prof. Dr. Daning HuDepartment of InformaticsUniversity of Zurich
Oct 16th, 2012

2
Outline Network Topological Analysis
Network Models Random Networks
Small-World Networks
Scale-Free Networks
Ref Book: Social Network Analysis: Methods and Applications
(Structural Analysis in the Social Sciences) http://www.amazon.com/Social-Network-Analysis-Applications-Structural/d
p/0521387078
Network Topological Analysis
Network topology is the arrangement of the various elements (links, nodes, etc). Essentially, it is the topological structure of a network.
How to model the topology of large-scale networks?
What are the organizing principles underlying their topology?
How does the topology of a network affect its robustness against errors and attacks?
4
Network Models
Random graph model (Erdős & Rényi, 1959)
Small-world model (Watts & Strogatz, 1998)
Scale-free model (Barabasi & Alert, 1999)

5
Random Networks
Erdős–Rényi Random Graph model is used for generating
random networks in which links are set between nodes with
equal probabilities Starting with n isolated nodes and connecting each pair of nodes with
probability p
As a result, all nodes have roughly
the same number of links
(i.e., average degree, <k>).

6
Random Networks
In a random network, each pair of nodes i, j has a connecting link with an independent probability of p
This graph has 16 nodes, 120 possible connections, and 19 actual connections—about a 1/7 probability than any two nodes will be connected to each other.
In a random graph, the presence of a connection between A and B as well as a connection between B and C will not influence the probability of a connection between A and C.

7
Random Graphs (Cont’d)
Average path length:
Clustering coefficient:
Degree distribution Binomial distribution for small n and
Poisson distribution for large n Probability mass function (PMF)
)ln(
)ln(~
k
nL
n
kpC
!)(
k
kekp
k
k
However, real networks are not random!

8
Small-World Network
Social networks usually are small world networks in which a group of people are closely related, while a few people have far-reaching connections with people out side of the group
Starting with a ring lattice of n nodes, each connected to its neighbors out to form a ring <k>. Shortcut links are added between random pairs of nodes, with probability ф (Watts & Strogatz, 1998)
Watts-Strogatz Small World model large clustering coefficient
high average path length

9
Small-World Networks A small-world network is defined to be a network where the typical
distance L between two randomly chosen nodes (the number of steps required) grows proportionally to the logarithm of the number of nodes N in the network, that is:
and Lsw Lrand
Clustering coefficient: Csw >> Crandom
Degree distribution Similar to that of random networks
Thus, small-world networks are characterized by large clustering coefficient, small path length relative to n.
10
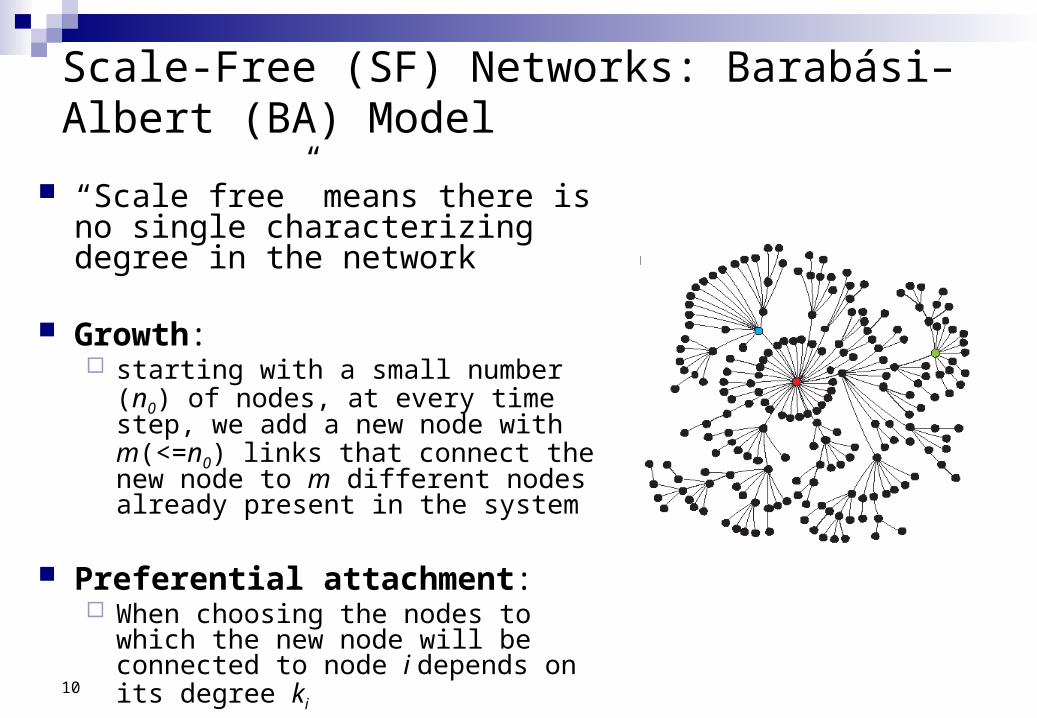
Scale-Free (SF) Networks: Barabási–Albert (BA) Model
“Scale free” means there is no single characterizing degree in the network
Growth: starting with a small number (n0) of nodes,
at every time step, we add a new node with m(<=n0) links that connect the new node to m different nodes already present in the system
Preferential attachment: When choosing the nodes to which the
new node will be connected to node i depends on its degree ki

11
Scale-Free Networks (Cont’d)
The degree of scale-free networks follows power-law distribution with a flat tail for large k
Truncated power-law distribution deviates at the tail
kkp ~)(0
0.02
0.04
0.06
0.08
0.1
0.12
0 5 10 15 20 25 30
k
Pow er-law
Truncated
-14
-12
-10
-8
-6
-4
-2
0
0 0.5 1 1.5 2 2.5 3 3.5
ln(k)
Power-law
Truncated
k
ekkp~)(
12
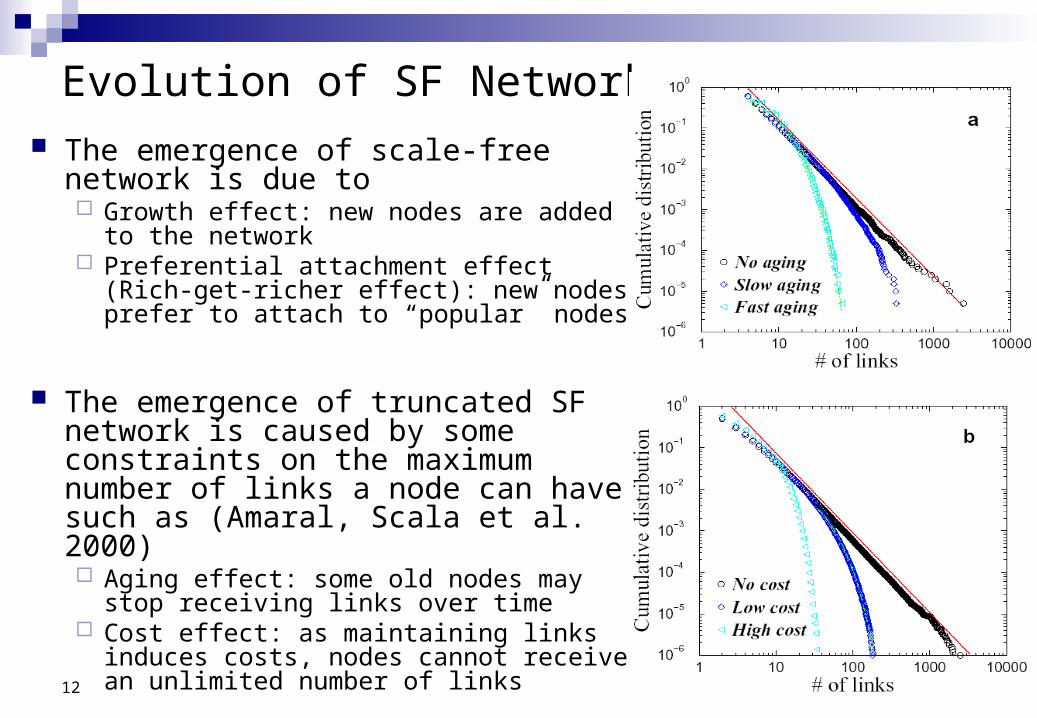
Evolution of SF Networks The emergence of scale-free network is
due to Growth effect: new nodes are added to the
network Preferential attachment effect (Rich-get-
richer effect): new nodes prefer to attach to “popular” nodes
The emergence of truncated SF network is caused by some constraints on the maximum number of links a node can have such as (Amaral, Scala et al. 2000) Aging effect: some old nodes may stop
receiving links over time Cost effect: as maintaining links induces
costs, nodes cannot receive an unlimited number of links

13
Network Analysis: Topology Analysis
Topology Average Path Length (L)
Clustering Coefficient (CC)
Degree Distribution (P(k))
Random Graph Poisson Dist.:
Small World(Watts & Strogatz, 1998)
Lsw Lrand CCsw CCrandSimilar to random graph
Scale-Free network LSF Lrand Power-law Distribution:
P(k) ~ k-
kN
Lrand ln
ln~
N
kCCrand
!)(
k
kekP
kk
k : Average degree

14
Empirical Results from Real-World Networks
15
Implications of Network Modeling The two new models of networks have important implications to
many applications, e.g.,
The 19 degrees of separation on the WWW implies that on average, a user can navigate from an arbitrary web page to another randomly selected page within 19 clicks, even though the WWW consists of millions of pages. Even if the web increase by 10 times in the next few years, the average path length increases only marginally from 19 to 21! (Albert, Jeong, & Barabási, 1999)
The small-world properties of metabolic networks in cell implies that cell functions are modulized and localized
The ubiquity of SF networks lead to a conjecture that complex systems are governed by the same self-organizing principle(s).

16
Robustness and Vulnerability of SF Networks
Many complex systems display a surprising degree of robustness against errors, e.g., Organisms grow, persist, and reproduce despite drastic changes in
environment Although local area networks often fail, they seldom bring the whole
Internet down
In addition to redundant rewiring, what else can play a role in the robustness of networks? Is it because of the structure (topology)?

17
Robustness Testing
How will the topology of a network be affected if some nodes are removed from the network?
How will random node removal (failure) and targeted node removal (attack targeting hubs) affect S: the fraction of nodes in the
largest component L: the average path length of the
largest component

18
Robustness Testing (Cont’d)
SF networks are more robust against failures than random networks due to its skewed degree distribution
SF networks are more vulnerable to attacks than random networks, again, due to its skewed degree distribution
The power-law degree distribution becomes the Achilles’ Heel of SF networks
Failure
Attack