social network size in humans - durham university and dunbar 2003.pdf · social network size in...
TRANSCRIPT

SOCIAL NETWORK SIZE IN HUMANS
R. A. HillUniversity of Durham
and
R. I. M. DunbarUniversity of Liverpool
This paper examines social network size in contemporary Western societybased on the exchange of Christmas cards. Maximum network size aver-aged 153.5 individuals, with a mean network size of 124.9 for those indi-viduals explicitly contacted; these values are remarkably close to the groupsize of 150 predicted for humans on the basis of the size of their neocortex.Age, household type, and the relationship to the individual influence net-work structure, although the proportion of kin remained relatively con-stant at around 21%. Frequency of contact between network members wasprimarily determined by two classes of variable: passive factors (distance,work colleague, overseas) and active factors (emotional closeness, geneticrelatedness). Controlling for the influence of passive factors on contactrates allowed the hierarchical structure of human social groups to be de-limited. These findings suggest that there may be cognitive constraints onnetwork size.
KEY WORDS: Frequency of contact; Group size; Humans; Neocortex size;Social networks
Copyright 2003 by Walter de Gruyter, Inc., New YorkHuman Nature, Vol. 14, No. 1, pp. 53–72. 1045-6767/03/$1.00+.10
53
Received March 22, 2002; accepted July 19, 2002; revised version received October30, 2002.
Address all correspondence to Evolutionary Anthropology Research Group, Department ofAnthropology, University of Durham, 43 Old Elvet, Durham DH1 3HN, U.K. Email:[email protected]

Analyses of human social networks have a long history in both the socio-logical and anthropological literature (Milardo 1988). However, relativelyfew studies have attempted to investigate complete social networks in hu-mans (McCarty et al. 1997), primarily due to the difficulty in estimatingand defining an individual’s “network” from the range of interactions thatexist within everyday life. As a result, studies have tended to focus on de-termining total network size (Johnson et al. 1995; Killworth et al. 1990,1998; McCarty et al. 2001; Pool and Kochen 1978), with relatively little at-tention paid to the interactions within these networks. However, depend-ing on the definition of personal networks, and the required relationships or ties between individuals to warrant inclusion in a network, previousstudies have found total networks to run from about 250 individuals(Killworth et al. 1984) to approximately 5,000 (Pool and Kochen 1978; Kill-worth et al. 1990). There is thus little consensus as to what constitutes a so-cial network in humans.
In primates, social networks are more easy to define (see Kudo and Dun-bar 2001) and are often delimited by the size of the social group. Further-more, primate social relationships are generally characterized by intensesocial grooming (Dunbar 1991), and both primate group size (Dunbar 1992)and grooming clique size (Kudo and Dunbar 2001) are a function of relativeneocortical volume. Similar relationships have been reported for carnivores(Dunbar and Bever 1998) and cetaceans (Marino 1996; Tschudin 1997).These findings suggest that there may be a cognitive constraint on the sizeof social networks in those species that live in intensely social groups (as op-posed to simple aggregations), perhaps because the number or volume ofneocortical neurons limits an organism’s information processing capacity,and hence the number of social relationships that an individual can moni-tor simultaneously (Dunbar 1992, 1998; Barton and Dunbar 1997).
Since the size of the human neocortex is known, the relationship be-tween group size and neocortex size in primates can be used to predict thecognitive group size for humans. Dunbar (1993) utilized this approach topredict that humans should live in social groups of approximately 150 in-dividuals. Evidence from the ethnological literature provides some sup-port for this, since census data from a range of tribal and more traditionalsocieties indicate that groups of about this size are in fact a common com-ponent of human social systems (see data collated by Dunbar 1993; seealso Barrett et al. 2002).
This raises the question as to whether modern, postindustrial societiesalso exhibit a similar pattern, with a discernible grouping of about 150 in-dividuals embedded into the somewhat diffuse and dispersed social sys-tems in which most of us now live. Recent approaches for estimatingpersonal network sizes in contemporary societies have asked respondentsto estimate the number of people they know in specific subpopulations of
54 Human Nature, Vol. 14, No. 1, 2003

known size (e.g., diabetics) to generate estimates of maximum networksize (McCarty et al. 2001). Such methods, while producing reliable esti-mates of maximum network sizes that can have a number of applied im-plications (e.g., Killworth et al. 1998), provide little information on whichrelationships are valued within networks or the way in which networksare maintained. Furthermore, they also estimate the maximum number ofindividuals known, rather than identifying those people an individualconsiders important and whose relationship they value. As a consequence,they tell us little about the way in which humans may actively maintaincontact with a network of specific individuals.
In Western societies at least, the exchange of Christmas cards representsthe one time of year when individuals make an effort to contact all thoseindividuals within their social network whose relationships they value. Asa consequence, this activity provides a unique insight not only into the sizeof individuals’ social networks, but also into the way in which these net-works are structured, both in terms of demographic composition and thefrequencies with which individual relationships are serviced.
METHODS
A questionnaire was designed to be completed as individuals weresending out their Christmas cards. Such timing should ensure that self-reporting errors are minimized (a significant problem in previous studies:Milardo 1988), since responses did not rely upon the memory of thosecompleting the questionnaire. In recent years, questionnaire design hasbeen the focus of considerable discussion (Milardo, ed. 1988; McCarty etal. 1997); the main conclusion from this has been that questionnaires whichtake more than a few minutes to complete or are too complex in their de-sign tend to result in loss of concentration and poor levels of completion(Dunbar and Spoors 1995). Because the information we required was bothdetailed and lengthy, we preferred a design in which a small number of in-dividuals distributed questionnaires to personal acquaintances. Althoughthis drastically reduces the number of individuals who receive question-naires, the sense of obligation that a respondent owes to the distributorfrom whom he/she received the questionnaire greatly increases the returnrate (proportion of all questionnaires completed and returned), especiallywhen that questionnaire is long and complex. Only one questionnaire wascompleted per household, but there remains a potential for overlap be-tween households that belong to the same extended social network. How-ever, everyday experience suggests that even close friends in modernurban society do not share all their friends and acquaintances; moreover,there is no reason to suspect that the size of any one person’s social net-
Human Social Network Size 55

56 Human Nature, Vol. 14, No. 1, 2003
Table 1. Information Requested on Questionnaire To Be Listed for EachChristmas Card
Category Definition
Distance Approximate distance to recipient in miles (overseasindividuals were listed by country—mean distance tothat country was later estimated for analysis)
Relationship Relationship of respondent to contact: relative (statingdegree of relatedness, e.g., brother, sister-in-law, niece),work colleague, friend, neighbor
Social Status Social structure of individuals contacted: single individ-ual, couple, or family (indicating structure of family,e.g., husband, wife, 3 children) as well as which indi-viduals within household were contacted directly (e.g.,wife only)
Last Contact An estimate to the nearest month, or week if contact iswithin last month, of when the respondent was last incontact with their acquaintance, or to indicate that pre-vious contact was by last Christmas card only. If a let-ter or long message was included in the Christmascard this was also noted.
Emotional Closeness A rating of how emotionally close the respondent felt tothe principal contact where 10 is very emotionallyclose and 0 is not emotionally close at all
work dictates in any way the size of anyone else’s when they do not belongto the same household. To minimize possible cultural effects (e.g., Kim andMcKenry 1998), all respondents were white British.
In completing the questionnaire, respondents were initially asked fortheir age and sex and the number and identity of individuals living in theirhousehold. Respondents were also asked to list those individuals to whomthey regularly send cards but were not doing so this year because they ex-pected to see them at Christmas. These individuals, as well as householdmembers, were included in the analyses of network size since they areclearly integral to the respondents’ social networks even though theymight not be included in the Christmas card network. For each Christmascard, respondents were asked to provide a number of details about the in-dividual (or individuals) to whom the card was being sent (see Table 1).For certain analyses, responses were recoded to produce data in a morequantifiable format. In terms of social status, the recipient household wasclassified as one of three categories: individual, couple, or family. Simi-larly, an individual’s relationship to a given recipient was coded as one offour categories: relative, friend, neighbor, or work colleague. In order toaccount for potential differences between genetic relatives and relatives bymarriage, we created two measures of relatedness; genetic relatedness (the
Human Social Network Size 57
coefficient of relatedness) and affinal relatedness (an index that mirroredexactly the equivalent genetic relationship—i.e., a brother-in-law is con-sidered to have the same coefficient of relatedness as a full biologicalbrother, namely 0.5). Although it is possible that not all affinal relativeswere identified as such on the questionnaires (few respondents, for exam-ple, distinguished between biological and affinal nephews and nieces),such that they were taken to be genetic kin, the two categories at leastallow a preliminary exploration of the extent to which distinctions aremade between biological and social relatives in managing social networks.
Because respondents were completing questionnaires on behalf of ahousehold (most Christmas cards are typically sent from all members ofthe household, or at least the adults), we make no attempt to determine theimportance of gender in determining network size. Although sex differ-ences in network size have been reported in previous studies (Dickens andPerlman 1981; for empathy groups and support cliques only: Dunbar and Spoors 1995), the sampling design we have used makes it inappropri-ate to explore this issue in the present case.
All continuous variables were tested for normality, and where they werefound to deviate significantly from the normal distribution (KolmogorovSmirnov, p < 0.05), the data were log-transformed for certain analyses. Alltests are two-tailed.
RESULTS
Forty-three questionnaires were returned, between them involving a totalof 2,984 Christmas cards. The number of individuals contacted via eachcard ranged from 1 to 9. The mean number of Christmas cards sent was68.19 (range 11–149). Since many cards were sent to couples and families,this results in a mean network size of 153.5 (� 84.5) (Figure 1). However,if we consider only those individuals whom respondents stated they ac-tively contacted (as opposed to everyone actually residing in the house-hold to which the card was sent), then mean network size is 124.9 (� 68.0)for the 22 questionnaires for which this distinction was made.
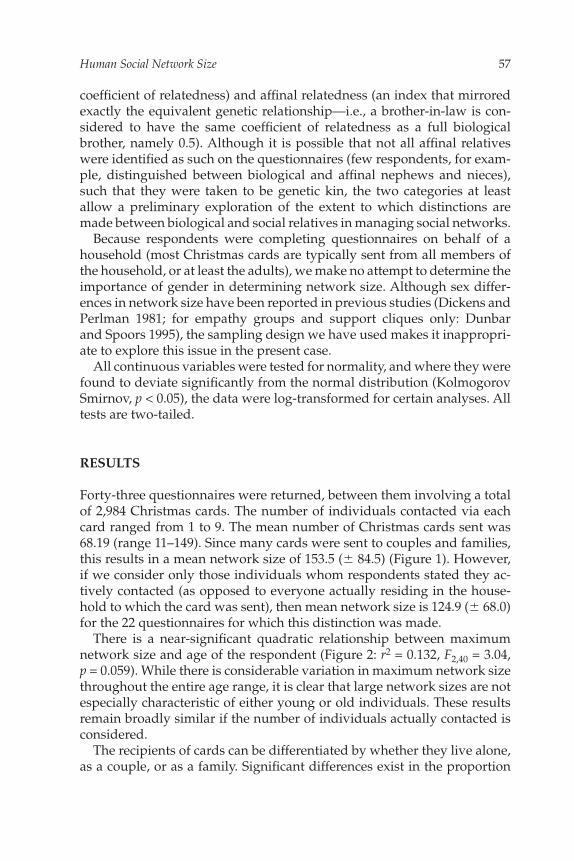
There is a near-significant quadratic relationship between maximumnetwork size and age of the respondent (Figure 2: r2 = 0.132, F2,40 = 3.04, p = 0.059). While there is considerable variation in maximum network sizethroughout the entire age range, it is clear that large network sizes are notespecially characteristic of either young or old individuals. These resultsremain broadly similar if the number of individuals actually contacted isconsidered.
The recipients of cards can be differentiated by whether they live alone,as a couple, or as a family. Significant differences exist in the proportion

58 Human Nature, Vol. 14, No. 1, 2003
Figure 1. Frequency distribution of total number of individuals in respondents’social networks.
of the maximum network that is made up of these three categories ofrecipients, and these compositions are also influenced by age (Figure 3: r2
= 0.559; F14,129 = 11.00, p < 0.001; household type factor: F2,129 = 30.4, p <0.001; household by age interaction: F8,129 = 7.6, p < 0.001). Almost identicalrelationships are observed if the analysis is conducted for those networkmembers actually contacted or by the number of Christmas cards sent.
Previous studies have often sought to examine network composition interms of kinship and other relationship categories. Within this sample,there are significant differences in the proportion of maximum networksize that is made up by five main relationship types (genetic relative, affi-nal relative, friend, neighbor, and work colleague), although these pro-portions are not influenced by age (Figure 4: r2 = 0.857; F24,215 = 57.45, p <0.001; relationship type factor: F4,215 = 229.6, p < 0.001; relationship by ageinteraction: F16,215 = 1.10, p > 0.30). The mean proportion of each relation-ship type within the typical maximum Christmas card network is 0.21 forgenetic relatives, 0.04 for non-genetic relatives (thus 0.25 for all relativescombined), 0.63 for friends, 0.04 for neighbors, and 0.08 for work col-

Human Social Network Size 59
Figure 2. Relationship between maximum network size and age.
leagues. Again the results are virtually identical if the analysis is repeatedby number of Christmas cards sent or only for those network memberscontacted directly.
Stepwise least-squares regression was used to determine the factors thatbest explain the patterns of contact within an individual’s network. Thebest-fitting model, given in Table 2, incorporates seven variables in the finalmodel (r2 = 0.394, F7,2909 = 269.66, p < 0.0001), with only the variable forwhether an individual is a spouse/partner excluded from the list of avail-able independent variables. Time since last contact increases as distance tothe individual increases, decreases as emotional closeness increases, de-creases if the individual is a work colleague, decreases if the contact is over-seas, decreases as the coefficient of relatedness increases for both geneticand affinal relatives, and increases with age. The sign of the relationship foroverseas contacts has changed relative to a simple bivariate correlation (r =0.192, N = 2984, p < 0.0001), suggesting that people overseas are contactedmore frequently once distance, emotional closeness, and whether the indi-vidual is a work colleague have been controlled for.

60 Human Nature, Vol. 14, No. 1, 2003
Figure 3. Mean proportion of total network made up of different household typesfor five age categories.
In cases where recipients were contacted only once a year, respondentssometimes included a letter or extended message in their card. This prac-tice might indicate that these recipients were held in higher regard. Forthis subset of the social network, distance to contact, emotional closeness,and relatedness for genetic relatives all form significant components of alogistic regression model determining whether or not a letter is includedwith the card (Table 3). The probability of a letter being included with aChristmas card increases with distance to contact and emotional closeness,but decreases with genetic relatedness. The coefficient of relatedness foraffinal relatives does not form a significant component of this model.However, since all affinal relatives may not have been identified as such onthe questionnaires (and thus classified as genetic relatives), there may stillbe a partial effect for affinal relatives. This is suggested by the fact thattreating the coefficient of relatedness for all relatives combined as a singleindependent variable results in a slight improvement on the overall model(r2 = 0.192, �2LL = 783.15, df = 3, p < 0.0001; relatedness term: r2 = 0.014,

Human Social Network Size 61
Figure 4. Mean proportion of total network made up of kin, non-genetic relatives,friends, neighbors, and work colleagues for five age categories.
Table 2. Stepwise Regression Analysis of Factors Determining Time to MostRecent Contact (An independent variable not incorporated in the finalmodel is Spouse/Partner [YES/NO].)
r2 F7,2902 p
Final Model 0.393 268.855 <0.0001
Variable r2 B p
Constant — 0.292 <0.01Log (Distance to Contact) 0.221 0.243 <0.0001Log (Emotional Closeness) 0.099 �0.610 <0.0001Work Colleague (YES/NO) 0.051 �0.385 <0.0001Overseas (YES/NO) 0.012 �0.245 <0.0001Log (Relatedness—Genetic) 0.004 �0.738 <0.0001Log (Relatedness—Affinal) 0.004 �0.922 <0.0001Log (Age of Respondent) 0.002 0.217 <0.0001

62 Human Nature, Vol. 14, No. 1, 2003
Table 3. Logistic Regression Analysis of Factors Determining Whether a Letter IsIncluded with the Christmas Card (for those individuals in the networkcontacted by Christmas card only). Independent variables in initial modelare those included in the linear regression analysis.
r2 �2 Log L χ2 df p
Final Model 0.187 783.149 111.617 3 < 0.0001
Variable r2 B Wald df p
Log (Distance to Contact) 0.153 0.845 63.96 1 < 0.0001Log (Emotional Closeness) 0.026 2.034 17.73 1 < 0.0001Log (Genetic Relatedness) 0.008 �6.961 4.75 1 < 0.03Constant — �4.479 121.80 1 < 0.0001
Wald = 7.78, df = 1, p = 0.005). Nevertheless, the possibility exists that therespondent may only make the effort of writing a letter if the recipient istheir own genetic kin.
Recent studies have suggested that human social networks have a hier-archical structure, with frequency of contact being used to differentiate be-tween levels within the social network (Dunbar 1993; Dunbar and Spoors1995). However, since frequency of contact is dependent on stochastic fac-tors it is not surprising that there is considerable variation in the reportedhierarchical group size estimates (e.g., published sympathy group sizesrange from 7 to 20: Dunbar and Spoors 1995; Hays and Oxley 1986; Mc-Cannell 1988; Rands 1988). The preceding analysis indicated that three“passive” factors might influence frequency of contact between networkmembers independent of any intentional contact: distance to individualand whether the contact is a work colleague or lives overseas. If the com-bined influence of these factors is controlled for, we should get a clearerpicture of whether social networks are differentiated hierarchically on thebasis of frequency of contact.
Figure 5 displays cumulative network size against residual frequency ofcontact, controlling for distance and whether the contact is a work col-league or overseas. Reference lines are displayed to indicate the approxi-mate hierarchical grouping levels identified by Dunbar (1998). Clearinflection points can be observed at 7, 20, and 35 individuals, respectively.Inspection of the pattern in Figure 5 suggests that further grouping levelsmight also be identified at about 70 and 100 individuals.
Figure 6 suggests that, once stochastic factors have been accounted for,emotional closeness is likely to be the key parameter underlying the fre-quency of contact between individuals: time since last contact declines asthe level of emotional closeness increases. The apparently high contact

Human Social Network Size 63
Figure 5. Cumulative network size on the basis of frequency of contact, control-ling for distance to contact and whether the contact is a work colleague oroverseas, for maximum network reached and those actively contacted. Hori-zontal lines indicate approximate hierarchical grouping levels reported in theliterature (Dunbar 1998: support cliques � 5; sympathy groups � 12; bands �35; cognitive group size � 150).
frequencies for individuals ranked as zero emotional closeness are almostcertainly a sampling artifact. Only four questionnaires utilized the zeroemotional closeness value, and two-thirds of these data were from a singlequestionnaire. Thus the low degree of emotional differentiation employedby this respondent, coupled with a small sample size for this emotionalcloseness category, may be the explanation for the apparently anomalousdownturn on the left-hand side of Figure 6. Despite this, there is a cleartrend for contact latency to decline as emotional closeness increases, suchthat those of the highest emotional closeness are invariably contacted on a weekly basis. In turn, this suggests that emotional closeness may be the key parameter underlying the hierarchical differentiation of socialnetworks.

64 Human Nature, Vol. 14, No. 1, 2003
Figure 6. Mean (and standard error) number of months since last contact betweenindividuals based on their degree of emotional closeness.
DISCUSSION
In contemporary Western societies, we regularly interact with a wide arrayof other individuals: social networks of up to 5000 individuals have, for ex-ample, been reported (Pool and Kochen 1978; Killworth et al. 1990). How-ever, many of the individuals we meet in this way do not form a part of ourintimate social network, and we have no formal relationships with them.In contrast, the relationship between neocortex size and group size acrossprimates suggests that humans live in groups (or, rather, social networks)of approximately 150 individuals (Dunbar 1993). While there is some evi-dence to support this claim in the ethnographic literature (Dunbar 1993),no concerted attempt has so far been made to test this prediction in con-temporary society.
We proposed that Christmas represents the one time of year when indi-viduals in Western cultures make a concerted effort to make contact withtheir entire social network, or at least with those individuals whose rela-

Human Social Network Size 65
tionships they value and consider important. In addition to personal face-to-face contact, the sending of Christmas cards allows us to reach those in-dividuals for whom physical distance or time prevent us from meeting inperson. Estimated on this basis, the mean network size for the individualsin this sample was 153.5 individuals, with a slightly lower figure of 124.9if only those individuals that respondents actually intended to contact areconsidered (i.e., excluding certain other members of the recipient’s house-hold). Both of these values fall well within the confidence limits (100 to231) for human group sizes predicted on the basis of the relationship be-tween neocortex size and group size across primates (Dunbar 1993), theobserved maximum network size being remarkably close to the value of147.8 (� 45.8) predicted for humans. Furthermore, the network size forthose individuals actively contacted is close to the value of 134 obtained byKillworth et al. (1984) in their attempt to estimate the number of individu-als that subjects felt they could ask a favor of in small world experiments.This could be interpreted as suggesting that social networks contain a(small) number of individuals who might be considered peripheral to thecore network, but who are nonetheless included because they form part ofthe immediate household or family of a core network member. Such indi-viduals might not be considered appropriate people to seek favors fromand might not themselves be granted support so readily. However, the ex-tent to which these results can be generalized to all individuals cannot re-ally be addressed.
Previous studies have shown that there can be considerable variation insocial network size between individuals, with factors such as age (Dickensand Perlman 1981), marital status (Rands 1988), gender (Dunbar andSpoors 1995), physical attractiveness (Reis et al. 1982), personality (Wilson1995), and levels of education, occupation, and income (Belle 1982) beingmajor influences on network size and structure. These factors almost cer-tainly account for some of the variation observed in the present study. Al-though our methodology precludes us from commenting on genderdifferences in network size, and we did not request details of respondents’social or personal circumstances, we are able to comment on the effects ofage. In our study, significant changes were observed in network structurewith age, most notably with respect to the demographic composition.From about 30 years of age onward, couples and families make up a highera proportion of the total network, and this trend persists until late in life.One likely explanation for this is that changes in network composition areinfluenced by the presence of dependent children. However, despite thechanges in general network composition, there is little change in the pro-portion of kin in the network, suggesting that these relationships remainrelatively constant throughout life.
Kinship is known to play an important role in human social relationships

66 Human Nature, Vol. 14, No. 1, 2003
(Dunbar and Spoors 1995; Hughes 1988; Keesing 1975), even though kin do not necessarily account for a large proportion of the network. In Kill-worth et al.’s (1984) study, less than 10% of the total network was identi-fied as kin, with the vast majority (86%) considered friends. Dunbar andSpoors (1995) reported a figure of 37.5% for the proportion of kin, althoughthis study focused on sympathy group sizes and so the figure is likely to be an overestimate of kin in the total network because kin are more likelyto appear in the more proximal segments of the network. The proportion of kin in the total network reported here (approximately 21%) lies com-fortably between these two values. The fact that only 4% of the network was identified as non-genetic (affinal) relatives could be explained by one of two possibilities. First, it may be that not all affinal relatives were soidentified on the questionnaire, but may instead have been listed as bio-logical relatives. This suggestion is given credence by the fact that the inci-dence of single individuals and divorcees in our sample is unlikely to havebeen such as to produce such a significant level of bias. The second possi-bility is that affinal kin receive much less attention than biological kin. Ei-ther way, the results of this study suggest that, even though most of anindividual’s social network is composed of unrelated individuals, kin (andprincipally biological kin) are included with disproportionately high fre-quencies given their actual representation within both the national and thelocal populations.
Frequency of contact with members of the social network is determinedby two general groups of factors: extrinsic factors (that impact on the like-lihood of face-to-face meetings) and intrinsic factors (that determine thefrequency with which individuals are intentionally contacted). Distanceand whether the individual is a work colleague are the primary extrinsicfactors influencing frequency of contact, although the former is supple-mented by whether or not the individual concerned lives overseas. Note,however, that the sign for this factor is reversed in the multivariate analy-sis: overseas individuals are contacted more frequently than would be ex-pected on the basis of distance, suggesting that special efforts may bemade to keep contact with those core network members that live so faraway that direct personal contact is precluded. This suggestion is givensome support by the fact that, in such cases, a letter is often also includedwith the Christmas card (i.e., a greater effort is made to keep recipientsabreast of news about the sender’s family).
As far as intrinsic factors are concerned, emotional closeness and the co-efficient of relatedness, for both genetic and affinal relatives, are the keyparameters influencing frequency of contact. In both cases, individuals arecontacted more frequently as closeness increases, reflecting the impor-tance of these relationships. (Note that, although we can expect these vari-

Human Social Network Size 67
ables to be correlated with each other, the regression equation given inTable 2 reports their independent effects.) With regard to relatedness, how-ever, extrinsic factors could also be involved, since family gatheringscould result in a higher frequency of contact that is independent of directpersonal contact between individuals. Nevertheless, kin networks are alsohighly interconnected and frequency of contact might be “policed,” en-suring that high rates of interchange are maintained. Hames (1979), for ex-ample, found that Ye’kwana villagers of Venezuela interact more oftenwith close relatives.
Previous studies have suggested that social networks may be hierar-chically differentiated, with larger numbers of progressively less intenserelationships maintained at higher levels. Dunbar (1998) suggested thatclusterings of relationships tended to occur at 5 (support cliques), 12–15(sympathy groups), and 35 (bands) individuals, with further higher-levelgroupings at 500 and 1500–2000 (equating in the ethnographic literature tomega-bands and tribes, respectively). Support cliques (defined as all thoseindividuals from whom one would seek advice, support, or help in timesof severe emotional or financial distress) averaged 4.72 (� 2.95) individu-als in one UK sample (Dunbar and Spoor 1995) and 3.01 (� 1.77) in a USsample (Marsden 1987), while an estimate of women’s “hair care” net-works among the !Kung San yielded a mean of 3.8 (Sugawara 1984). Thevalue of 7 suggested by Figure 5 lies within the upper limits for the mar-gin of error for these estimates. Published sympathy group sizes typicallylie within the range of 10–15 individuals (mean of 10.9 � 6.8: Buys and Lar-son 1979; mean of 11.6 � 5.64: Dunbar and Spoor 1995), although values aslow as 7 (Hays and Oxley 1986) and as high as 15–20 individuals (McCan-nell 1988; Rands 1988) have been reported. Much of this variation canprobably be explained by methodological differences between the studies:Buys and Larson (1979), for example, considered those individuals whosedeath would be personally devastating, whereas other studies havetended to use frequencies of contact over various time periods. The valueof 21 suggested by Figure 3 lies at the upper limit of these estimates. How-ever, two points are worth noting. First, frequency of contact displays aconsiderable degree of stochastic variation and such methods are alsoprone to self-reporting errors (Milardo 1988). Second, the value obtainedin this study may be an overestimate because all household members wereascribed the same contact frequency but almost certainly do not share thesame level of intimacy with the respondent. A figure in the region of 12–15may thus not be unrealistic. Finally, in Dunbar’s (1993) analysis of thegroup sizes characteristic of modern hunter-gatherer societies, a level ofsocial organization of 30 to 50 individuals (mean = 37.7 � 16.8) was ob-served; these groupings were often described as bands or overnight camps

68 Human Nature, Vol. 14, No. 1, 2003
Table 4. Probability of the Four Grouping Levels Identified in Figure 5 Being anEstimate of the Four Types of Grouping Hitherto Identified in the Literature.In each case, the probability of identity is derived from the standard normaldeviate separating the observed (row) and putative (column) value, giventhe variance in the latter. Values in bold indicate value is not significantlydifferent from column value.
Estimated Sizes of Grouping Types Identified in Literature
This Study 3.8 � 2.29 11.3 � 6.19 37.7 � 16.8 147.8 � 45.8
7 z = 1.4 (p = 0.090)
z = 0.7 (p = 0.244)
z = 1.8 (p = 0.034)
z = 3.1 (p = 0.001)
21 z = 7.5 (p « 0.001)
z = 1.6 (p = 0.058)
z = 1.0 (p = 0.162)
z = 2.8 (p = 0.003)
35 z = 13.6 (p « 0.001)
z = 3.8 (p < 0.001)
z = 0.2 (p = 0.436)
z = 2.5 (p = 0.007)
153.5 z = 65.4 (p « 0.001)
z = 23.0 (p « 0.001)
z = 6.9 (p < 0.001)
z = 0.1 (p = 0.450)
in the ethnographic literature. The grouping level at 35 individuals ob-served in the present study is sufficiently close to this value to suggest thatits origins in hunter-gatherer societies may not be entirely ecological (ashas previously been assumed). We attempt no explanations for the appar-ent grouping levels at 70 and 100 individuals that are tentatively sug-gested by Figure 5. It is possible that these may in part be simple artifactsof our methodology, which required that all individuals must be contactedat least once a year if they were to be included in the study.
If we compare the four main grouping levels tentatively identified inFigure 5 (7, 21, 35, and 153.5) with the mean values obtained for the vari-ous groupings identified in the literature (means of 3.8 � 2.29, 11.3 � 6.19,37.7 � 16.8, and 147.8 � 45.8), it is clear that the values observed in Figure5 are better estimates of their nominally corresponding values from the lit-erature than of any other group type (Table 4). In each case, the value fromFigure 5 is significantly different (as reflected in the number of standarddeviations that separate the two values) from all other values except theone to which it nominally corresponds (or, in some cases, the adjacentvalue). The only exceptions are the values of 7 and 21, which do not differsignificantly from the values of the nominal grouping or the next higherone. However, this is principally a consequence of the fact that sympathygroups have a relatively larger standard deviation than do either supportcliques or bands. This obscures the fact that the value of 21, for example,actually lies closer to the mean value for sympathy groups than it does tothat for bands. Taken as a whole, Table 4 suggests that the deviations are

Human Social Network Size 69
least significant along the main diagonal, suggesting that there is an asso-ciation between the grouping levels identified within this one sample andthose identified in previous studies that focused on more specific types ofrelationship.
Note that these grouping levels are strictly cognitively defined: in effect,they are cognitive constraints on the number of individuals that can bemaintained at a given intensity of relationship (presumably involving fa-miliarity, trust, etc). The social characteristics attributed to these groupingsor the way they are used within the social system and the labels attachedto them are wholly open to negotiation: each society may make quite dif-ferent use of these groupings. The only constraint is that if the social func-tion requires or depends on a particular intensity of relationship, then thatfunction may be restricted to a particular size of group. While cultural dif-ferences will exist in network structure (Kim and McKenry 1998), and net-works within cultures may change through time (Ruan et al. 1997), thegeneral grouping levels defined by cognitive constraints should remainconsistent.
In summary, it seems that Christmas card networks provide useful in-sights into human social networks and support the idea that they are uti-lized to make (at least annual) contact with all those individuals whoserelationships are considered important. Total network sizes estimated fromChristmas card lists are remarkably close to the value of 150 predicted forhuman social group size based on the relationship between group size andbrain size across primates. Furthermore, the hierarchical structure ofhuman social groups hinted at by other studies seems to have some basisin reality, at least insofar as it is observed in the Christmas card networks ofthis UK sample. Thus, even in contemporary western societies, where in-dividuals are operating egocentric networks within a virtually infinitearray of social possibilities, social network size and differentiation reflectthe sociocentric networks observed in traditional societies, suggesting thatthe cognitive constraints on network size may apply universally to all mod-ern humans.
This project was funded by a grant from Hewlett Packard Research Laboratories(Bristol) and the Economic and Social Research Council (ESRC). The support of theESRC is gratefully acknowledged. This work was part of the programme of theESRC Research Centre for Economic Learning and Social Evolution (ELSE). We aregrateful to all those who distributed and completed questionnaires, in particular J. M. Hill and R. Grainger.
Russell Hill (B.Sc., M.Phil, Ph.D.) is an Addison Wheeler Research Fellow at the University of Durham. His main research interests are in the evolution of

70 Human Nature, Vol. 14, No. 1, 2003
mammalian social systems. Robin Dunbar (B.A., Ph.D.) is a professor of evolu-tionary psychology at the University of Liverpool. His research interests spanmammalian behavioral ecology, including humans, cognitive mechanisms, andDarwinian psychology.
REFERENCES
Barrett, L., R. I. M. Dunbar, and J. E. Lycett2002 Human Evolutionary Psychology. Basingstoke: Palgrave/Macmillan, and
Princeton: Princeton University Press.Barton, R. A., and R. I. M. Dunbar
1997 Evolution of the Social Brain. In Machiavellian Intelligence II, A. Whitenand R. Byrne, eds. Pp. 240–263. Cambridge: Cambridge University Press.
Belle, D. E.1982 The Impact of Poverty on Social Networks and Supports. Marriage and
Family Review 5:89–103.Buys, C. J., and K. L. Larson
1979 Human Sympathy Groups. Psychology Reports 45:547–553.Dickens, W. J., and D. Perlman
1981 Friendship over the Life Cycle. In Personal Relationships 2: Developing Per-sonal Relationships, S. Duck, and R. Gilmour, eds. Pp. 91–122. London: Aca-demic Press.
Dunbar, R. I. M.1991 Functional Significance of Social Grooming in Primates. Folia Primatolo-
gica 57:121–131.1992 Neocortex Size as a Constraint on Group Size in Primates. Journal of
Human Evolution 22:469–493.1993 Coevolution of Neocortical Size, Group Size and Language in Humans.
Behavioural and Brain Sciences 16:681–735.1998 The Social Brain Hypothesis. Evolutionary Anthropology 6:178–190.
Dunbar, R. I. M., and J. Bever1998 Neocortex Size Predicts Group Size in Some Insectivores. Ethology 104:
695–708.Dunbar, R. I. M., and M. Spoors
1995 Social Networks, Support Cliques, and Kinship. Human Nature 6:273–290.
Hames, R. D.1979 Relatedness and Interaction among the Ye’kwana: A Preliminary Analy-
sis. In Evolutionary Biology and Human Social Behavior, N. A. Chagnon and W. Irons, eds. Pp. 238–249. North Scituate: Duxbury Press.
Hays, R. B., and D. Oxley1986 Social Network Development and Functioning during a Lifetime Transi-
tion. Journal of Personality and Social Psychology 50:305–313.Hughes, A.
1988 Evolution and Human Kinship. Oxford: Oxford University Press.

Human Social Network Size 71
Johnson, E., H. R. Bernard, P. D. Killworth, G. A. Shelley, and C. McCarty1995 A Social Network Approach to Corroborating the Number of AIDS/
HIV+ Victims in the U.S. Social Networks 17:169–187.Keesing, R. M.
1975 Kin Groups and Social Structure. New York: Holt, Rinehart, Winston.Killworth, P. D., H. R. Bernard, and C. McCarty
1984 Measuring Patterns of Acquaintanceship. Current Anthropology 25:391–397.
Killworth, P. D., E. Johnson, H. R. Bernard, G. A. Shelley, and C. McCarty1990 Estimating the Size of Personal Networks. Social Networks 12:289–312.
Killworth, P. D., C. McCarty, H. R. Bernard, G. A. Shelley, and E. C. Johnson1998 Estimation of Seroprevalence, Rape and Homelessness in the United
States Using a Social Network Approach. Evaluation Review 22:289–308.Kim, H. K., and P. C. McKenry
1998 Social Networks and Support: A Ccomparison of African Americans,Asian Americans, Caucasians, and Hispanics. Journal of Comparative FamilyStudies 29:313–334.
Kudo, H., and R. I. M. Dunbar2001 Neocortex Size and Social Network Size in Humans. Animal Behaviour
62:711–722.McCannell, K.
1988 Social Networks and the Transition to Motherhood. In Families and SocialNetworks, R. M. Milardo, ed. Pp. 83–106. Newbury Park: Sage.
McCarty, C., H. R. Bernard, P. D. Killworth, G. A. Shelley, and E. C. Johnson1997 Eliciting Representative Samples of Personal Networks. Social Networks
19:303–323.McCarty, C., P. D. Killworth, H. R. Bernard, E. C. Johnson, and G. A. Shelley
2001 Comparing Two Methods for Estimating Network Size. Human Organiza-tion 60:28–39.
Marino, L.1996 What Dolphins Can Tell Us about Primate Evolution. Evolutionary An-
thropology 5:81–86.Marsden, P. V.
1987 Core Discussion Networks of Americans. American Sociological Review52:122–131.
Milardo, R. M.1988 Families and Social Networks: An Overview of Theory and Methodology.
In Families and Social Networks, R. M. Milardo, ed. Pp. 13–47. Newbury Park:Sage.
Milardo, R. M., ed. 1988 Families and Social Networks. Newbury Park: Sage.
Pool, I. S., and M. Kochen1978 Contacts and Influence. Social Networks 1:5–51.
Rands, M.1988 Changes in Social Networks Following Marital Separation and Divorce.
In Families and Social Networks, R. M. Milardo, ed. Pp. 127–146. Newbury Park:Sage.

72 Human Nature, Vol. 14, No. 1, 2003
Reis, H., L. Wheeler, N. Spiegel, M. Kernis, J. Nezlek, and M. Perri1982 Physical Attractiveness and Social Interaction II: Why Does Appearance
Affect Social Experience? Journal of Personality and Social Psychology 43:979–996.
Ruan, D., L. C. Freeman, X. Dai, Y. Pan, and W. Zhang1997 On the Changing Structure of Social Networks in Urban China. Social
Networks 19:75–89.Sugawara, K.
1984 Spatial Proximity and Bodily Contact among the Central Kalahari San.African Study Monograph (Supplement) 3:1–43.
Tschudin, A.1997 Relative Neocortex Size and Its Correlates in Dolphins: Comparisons with Hu-
mans and Implications for Mental Evolution. Ph.D. Thesis, University of Natal.Wilson, R.
1995 An Investigation into the Effects of Individual Differences upon the Sizeand Composition of Individuals Social Networks. B.Sc. Dissertation, Univer-sity of Liverpool.