social network analysis - · pdf filesocial network analysis matthew denny friday 26th...
TRANSCRIPT

Social Network AnalysisM AT T H E W D E N N Y F R I D A Y 2 6 T H S E P T E M B E R , 2 0 1 4
Welcome to this tutorial introducing Social Network Theory and Social Network Analysis (SNA) moregenerally. The study of networks is not restricted to sociology or even the social sciences; the relationshipsbetween entities can be gainfully studied in neuroscience (Neves et al., 2008), physics (Newman, 2003),political science (Fowler, 2006; Cranmer and Desmarais, 2011; Kirkland, 2011), economics (D’Exelle andHolvoet, 2011; Sundararajan et al., 2012; Jackson and Lopez-Pintado, 2013), anthropology (Zachary,1977), management science (Levin and Cross, 2004; Aral and Alstyne, 2011; Aral et al., 2013), statistics,(Hoff et al., 2002; Raftery et al., 2012), computer science (Gomez Rodriguez et al., 2010; Krafft et al.,2012), psychology (Moreno, 1934; Aral and Walker, 2012), engineering (Lubin et al., 2013) and of coursesociology (Marwell et al., 1988; Stackman and Pinder, 1999; McPherson et al., 2001; Watts et al., 2002).
This tutorial will introduce a number of foundational concepts in network theory and analysis, with afocus on how a network perspective might be useful to the study of a wide range of phenomena. We willfocus on general definitions and properties of individuals, their relationships and networks as a whole.Throughout this tutorial I will include citations to relevant articles and resources, please use them as astarting point for further exploration and realize that network theory is very often mis-applied, so takethe time to really understand these concepts before applying them! Take the time to read as much as youcan and if possible pursue further coursework in network analysis; this is just the beginning – you willhave a lot of fun.
Figure 1: Inferred Latent Influence Relationships between Senators in the 107th Session of Congress (2001-2003)
1

Network analysis is still a growing field with a great deal of opportunity for new and transformativecontributions, but its history goes back atleast 80 years (Moreno, 1934). It is important to build on thisexisting body of theory and empirical results before striking out on your own, even if you are working inan area where network analysis is just starting to catch on.
While social network theory can be readily applied in theoretical research and qualitative empiricalstudies, there is a general emphasis on the use of software to analyze and visualize network data oncethey have been collected. There are a number of different software packages available for this purpose,but two R packages (Statnet and iGraph) have become perhaps the most flexible and powerful tools forperforming network analysis. As you considder getting into network analysis, please consider enrolling ina class or workshops that uses R as its primary computing language. If you put time and effort into gainingproficiency in R for data management it will pay huge dividends when you look to start doing moreadvanced network analysis using R. You can find out more about R and access a number of instructionalmaterials at the following websites:
1. R is a free and open source statistical computing language with a vibrant community of contributorswho are constantly updating its functionality through the creation of user defined add-on packages.To get started, check out this website: http://www.r-project.org/.
2. Quick-R is my favorite resources for learning basic R commands and is also available in book form.Check out the website: http://www.statmethods.net/
3. RStudio is an integrated development environment for R that provides a lot of useful features forbeginner R users and powerful tools for advanced users as well (I primarily use it). Check out theirwebsite and download the program for free here: https://www.rstudio.com/
The rest of this tutorial will not focus on computing or statistic methods for network analysis so takewhat is provided above as a starting point. The rest of this tutorial will focus on an intuitive and visualintroduction to social network theory.
1 Some Definitions
Before we can get started we need to define some terminology so we can use a consistent language whentalking about social networks:
1. Actor: also called a node or a vertex, referrers to an individual hat can have relationships withother individuals and in this case, an individual or group of individuals we are choosing to study.
A
B
C
D
Actors
A
B
C
D
A
B
C
D
Undirected Ties
Directed Ties
2. Tie: also called a relation or edge, describes a particular, well specified, relationship between twoActors. This could refer to a relationship like “went to the same school” or “likes potato chips” orsomething like “likes” or “trades with”. Ties can be un-directed (like went to the same school),when the relationship means the same thing to both actors:
2

A
B
C
D
Actors
A
B
C
D
A
B
C
D
Undirected Ties
Directed Ties
Ties can also be directed (such as “looks up to”) and either one directional or bidirectional:
A
B
C
D
Actors
A
B
C
D
A
B
C
D
Undirected Ties
Directed Ties
3. Network: also called a Graph, particularly in the physics and CS literature, referres to a collectionof Actors and the Ties between them. Figure 2depicts a set of unidirected friendship relationshipsbetween members of a Karate club.
Figure 2: Zachary’s Karate Club Network (Zachary, 1977)
1
2
3
4
5
6
7
8
9
10
11
1213
1415
16
17
18
19
20 21
22
2324
25 26
27
28
29 30
31
32
3334
4. Multiplex networks: are networks where more than one kind of tie is present. For example, if wewere to collect information about several different kinds of relationships between bank managers(goes to for advice, is friends with, works for, etc. ) we essentially end up with a network containingmultiple tie types between actors.
3

5. Weighted Ties: just as networks can contain multiple different kinds of edges between actors, theycan also contain relationships of varying strength. For example A might like B a whole lot, but B andC only like each other moderately.
A
B
C
D
Actors
A
B
C
D
Directed Ties
A
B
C
D
Undirected Ties
Weighted Ties
A
BD
C
6. Group: A group in a network is just a subset of the actors which share some characteristic incommon. If we were to look at an organizational network, one group could be made up of all actorsthat work in the human resources department. The definition of groups as commonality on somesalient trait allows us to examine a number of network hypotheses and defined useful measures thatare conditional on knowing the group membership of actors. For example we might want to testa hypothesis about the number of friendship ties between workers at a company who are part ofdifferent departments versus those in the same departments.
7. Geodesic Distance: is defined as the least number of connections (ties) that must be traversed to getbetween any two nodes. For example, in the network depicted below, the geodesic distance betweenactor A and actor D is 3, while the distance between actor B and C is only 1.
A
B
C
D
Actors
A
B
C
D
A
B
C
D
Undirected Ties
Directed Ties
Social Network Data
There are two main kinds of social network data: edge lists and sociomatricies. Each of these dataformats has its own advantages and weaknesses, mainly having to do with a trade off between ease ofentering and storing the data and ease of using the data for analysis.
1. A Sociomatrix (also known as an Adjacency Matrix): is a way of representing directed or un-directed ties between actors using a numerical matrix. There is one column for each actor and one
4

row for each actor. In general, the diagonal elements of this matrix (eg. second row, second column)are always equal, signaling that actors do not tie to themselves. To specify which entry in the matrixwe are talking about we always use the same convention: [row i, column j] so that if we were tosay the [3,5] entry in the sociomatrix we would be talking about the third row and fifth column.
Each row in the sociomatrix represents the ties that Actor i sends to all other actors (j’s). As wenotice in figure 3, manager one sends a directed friendship tie to manager two, as indicated by thevalue 1 in the [1,2] entry of the sociomatrix. The upside of taking this approach to storing dataabout a network is that it naturall encodes the fact that some actors may not send or receive anyties (something we call being a network isolate) and the format is very ready for many statisticalanalyses. The downside to using this data format is that it can take up a lot of space and be difficultto enter data into by hand.
Figure 3: Sociomatrix of Directed Network of Friendship Ties Between Managers (Krackhardt, 1987)
Appendix
Figure 2: The directed friendship choice sociometric data among the 21 managers (Krackhardt,1987).
Figure 3: The directed advice-seeking sociometric data among the 21 managers (Krackhardt, 1987).
6
2. An Edgelist is the other primary form of data storage for social network analysis. This only capturesinformation about existing ties so it needs to be supplemented with knowledge of the total numberof actors in the network (even if they do not have any ties). In the example edgelist in Figure 4,directed friendship ties for the network shown in Figure 2 are presented in edgelist form where thefirst number on each line denotes the actors sending a tie to the second actor in the row.
This form of data entry is best for storing information about data that are collected by hand asit is very efficient to store and relatively easy to enter, but one must be careful to use a commonnaming system and keep track of any nodes that do not have any ties to them.
5

Figure 4: Zachary’s Karate Club Network Edgelist Representation (Zachary, 1977)
1 32
1 22
1 20
1 18
1 14
1 13
1 12
1 11
1 9
1 8
1 7
1 6
1 5
1 4
1 3
1 2
2 31
2 22
2 20
2 18
2 14
2 8
2 4
2 3
3 14
3 9
3 10
3 33
3 29
3 28
3 8
3 4
4 14
4 13
4 8
5 11
5 7
6 17
6 11
6 7
7 17
9 34
9 33
9 33
10 34
14 34
15 34
15 33
16 34
16 33
19 34
19 33
20 34
21 34
21 33
23 34
23 33
24 30
24 34
24 33
24 28
24 26
25 32
25 28
25 26
26 32
27 34
27 30
28 34
29 34
29 32
30 34
30 33
31 34
31 33
32 34
32 33
33 34
2 Properties of Nodes
Now that we have some basic terminology down, we can get into the heart of actor level properties thatserve as the language for social network analysis. I am going to spend a majority of my time in thissection explaining how to conceptualize social phenomena and hypotheses in a networks frameworkwithout going into too much detail on substantive theories of relational phenomena. The goal is to helpyou be literate enough to interface with and understand theories posed in the literature using a socialnetworks/ relational framework.
1. Degree Centrality: is the most basic network measure and captures the number of ties to a givenactor. For un-directed ties this is simply a count of the number of ties for every actor. For directednetworks, actors can have both indegree and outdegree centrality scores. As the name implies,centrality measures how central or well connected an actor is in a network. This theoretically signalsimportance or power and increased access to information or just general activity level and highdegree centrality is generally considered to be an asset to an actor. Degree centrality is depicted forthe Karate club network in Figure 5 where each actor is now labeled with their undirected degreecentrality score.
6

Figure 5: Degree Centrality for Zachary’s Karate Club Network (Zachary, 1977)
169
10
6
34
4
4
5
2
3
1 2
5
2
2
2
2
2
3
2
2
25
3
3
2
4
3
4
3
6 1317
2. Betweenness Centrality: is roughly defined as the number of shortest paths between alters that gothrough a particular actor. More precisely, it is the sum of [the shortest path lengths between everyset of alters where the path goes through the actor we are calculating the measure for divided by theshortest path lengths (not necessarily through the target actor) between those actors]. This intuitivelymeasures the degree to which information or relationships have to flow through a particular actorand their relative importance as an intermediary in the network. Betweenness scores for Zachary’sKarate club network are displayed in figure 6.
Figure 6: Betweenness Centrality for Zachary’s Karate Club Network (Zachary, 1977)
231.6731.91
73.92
6.25
0.3315.83
15.83
0
32.65
0.45
0.33
0 0
23.07
0
0
0
0
0
16.08
0
0
09.33
1.17
1.94
0
11.62
0.95
1.54
7.04
70.28 83.63155.18
7

3. Closeness centrality: measures how many steps (ties) are required for a particular actor to accessevery other actor in the network. This is measured as 1 divided by the sum of geodesic distancesfrom an actor to all alters in the network. The measure will reach its maximum for a given networksize when an actor is directly connected to all others in the network and its minimum when an actoris not connected to any others. This captures the intuition that short path lengths between actorssignal that they are closer to each other. Note that this measure is sensitive to network size and isdecreasing in the number of actors in the network. This makes intuitive sense in many situationsbecause it gets more difficult to maintain close relationships with all members of the network as thenetwork grows but can also be corrected for by multiplying by the number of actors in the network.Closeness scores for Zachary’s Karate club network are displayed in figure 7.
Figure 7: Closeness Centrality for Zachary’s Karate Club Network (Zachary, 1977)
0.020.01
0.02
0.01
0.010.01
0.01
0.01
0.02
0.01
0.01
0.01 0.01
0.02
0.01
0.01
0.01
0.01
0.01
0.02
0.01
0.01
0.010.01
0.01
0.01
0.01
0.01
0.01
0.01
0.01
0.02 0.020.02
4. Eigenvector centrality: measures the degree to which an actor is connected to other well connectedactors. It takes advantage of a mathematical property of networks (represented as adjacency ma-tricies) that allows for the easy calculation of how well connected an actor is to other well connectedactors. While we will not get into the details of its calculation, this measure captures the valueof having a lot of friends in high places. Eigenvector scores for Zachary’s Karate club network aredisplayed in figure 8.
8

Figure 8: Eigenvector Centrality for Zachary’s Karate Club Network (Zachary, 1977)
0.910.66
0.83
0.53
0.190.2
0.2
0.43
0.67
0.27
0.19
0.13 0.21
0.58
0.28
0.28
0.06
0.23
0.28
0.38
0.28
0.23
0.280.41
0.15
0.16
0.2
0.35
0.34
0.37
0.38
0.51 0.921
5. Brokerage: describes the position of actors such that they occupy an advantageous position wherethey can broker interactions between other actors in the network. Brokerage Centrality is then ameasure of the degree to which an actor occupies a brokerage position across all pairs of alters. It ismeant to capture the intuition that a broker serves as a go-between and thus can gain benefits fromtheir position as an intermediary. There are five kinds of brokerage relationships, each of which wewill discuss briefly below:
(a) A Coordinator is an Actor in the same group as two alters who connects the two nodes. Anexample might be a graduate student who makes sure that all of the rest of their cohort is madeaware of parties being hosted by anyone in their cohort.
(b) An Itinerant broker is a member of an outside group that connects two others who share groupmembership.
(c) A Gatekeeper is a member of the same group as the target a member of another group hopesto connect with that can control whether or not that outside actor is able to gain access to thein group member. An example might be a secretary or office manager.
(d) A Representative is a member of the same group as an Actor that wishes to connect with anactor outside of the group but has to go through an intermediary. An example is an Ambassadorfor a country.
(e) A Liason is a member of a group that is distance from two actors that wish to connect but donot share group membership themselves. A delivery truck driver is a good example.
9
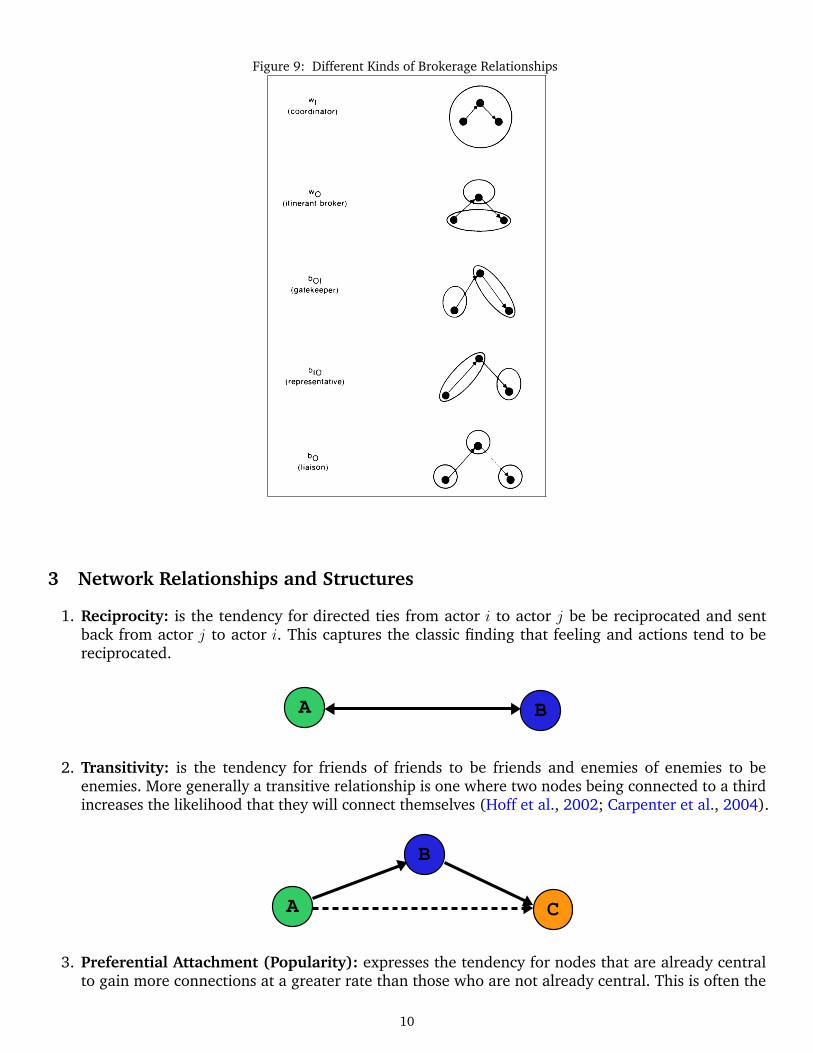
Figure 9: Different Kinds of Brokerage Relationships
Figure 1: The five brokerage types, based on node category membership(Gould and Fernandez, 1989).
of managerial friendships. This is done in R by using the aptly named brokerage() function. Thebrokerage() function takes only two arguments:
1. a graph
2. a vector of class memberships
For instance:
brokerage(friendships,level)
In this example, our graph is the friendships object, and our vector of class memberships canbe one of the vectors of vertex attributes2 that we have for these 21 managers—here, the level
attribute. Now, when you run the brokerage() command in its most basic form, it returns to youa lot of information.
2Keep in mind that a categorical classification variable here will likely yield the most useful results. The idea is tocategorize nodes into distinct groups. The more fine-grained the distinction (such as nodal salaries or ages), the more“thin” the brokerage analysis will be. This is because for any given specific dollar amount or age, there are likely tobe very few brokerage arrangements. When you use broader categories, such as income or age groups, you are likelyto observe more useful statistics.
3
3 Network Relationships and Structures
1. Reciprocity: is the tendency for directed ties from actor i to actor j be be reciprocated and sentback from actor j to actor i. This captures the classic finding that feeling and actions tend to bereciprocated.
A B
A
B
C
A B
C
D
2. Transitivity: is the tendency for friends of friends to be friends and enemies of enemies to beenemies. More generally a transitive relationship is one where two nodes being connected to a thirdincreases the likelihood that they will connect themselves (Hoff et al., 2002; Carpenter et al., 2004).
A B
A
B
C
A B
C
D
3. Preferential Attachment (Popularity): expresses the tendency for nodes that are already centralto gain more connections at a greater rate than those who are not already central. This is often the
10

case in academia where as a researcher becomes more active and collaborates more in publishing,they are more likely to attract new collaborators who want to work with them.
A B
A
B
C
A B
C
D
4. Structural Equivalence: is a concept that describes actors occupying the same position in thenetwork relative to all other actors (Lorrain and White, 1971). In the example figure below, eachgrey circle contains a set of actors that are structurally equivalent to all others. This concept isimportant in making comparisons between nodes about their relative importance and position in anetwork. Check out the following web resources for more information: Robert A. Hanneman’s Pageon Structural Equivalence, Tom Schnijders Lecture on Structural Equivalence.
5. A Clique: is a subset of actors in a network such that every two actors in the subset are connectedby a tie. This definition follows the common english language usage of the word meaning a denselyconnected group. A large example clique is colored red in Figure 10.
Figure 10: Largest Clique in Zachary’s Karate Club Network (Zachary, 1977)
12
3
4
56
7
8
9
10
11
12 13
14
15
16
17
18
19
20
21
22
2324
25
26
27
28
29
30
31
32 3334
11

6. A Star: is a network structure where all ties connect to one central node, making the shape of a star.
1
2
3
4
5
6
7
8
9
10
11
12
13
14
15
4 Network Properties
All of the properties discussed above refer to individual actors or subsets of actors in a network. Whilethese are important characteristics to measure, we can also think about properties that a network asa whole exhibits. These properties are important because they impost structure on the entire space ofinteractions and relationships and can have profound aggregate effects on how actors in the networkbehave and function as a whole.
1. Centralization (Degree, Betweenness, Closeness, Eigenvector, etc.): is a measure of the uneven-ness of the centrality scores of actors in a network. It ranges from zero, when every actor is just ascentral for whatever score we are interested in, to 1, when one node is maximally central and allothers are minimally central. This measure is a good way to express the idea that there are coupleof very powerful or important actors in a network or that power/importance is spread out evenly inone simple measure (Ward et al., 2011).
12

Figure 11: An example of a highly centralized network and for comparison, a decentralized network (small centralizedcomponents that are connected), and a distributed network (actors all have a similar degree).
2. The network Clustering Coefficient: measures the degree to which actors form ties in in dense,relatively unconnected (between groups) groups. This measure is agnostic about why the network isclustered. The degree of clustering in a network is related to the efficiency with which informationcan diffuse over the network, as well as its robustness to disruption. (Latora and Marchiori, 2001;Newman, 2003; Suri and Watts, 2011; Mason and Watts, 2012)
13

Figure 12: An example of clusters within a network (Kaiser et al., 2007).
3. Homophily: is a process where actors who are similar on a particular trait are more likely to formties. This has been confirmed in over 100 empirical studies, with a few examples including: (Ibarra,1992; Straits, 1996; McPherson et al., 2001; Centola et al., 2007; Goodreau et al., 2009; Kossinetsand Watts, 2009; McDonald, 2011). This process is the basis for the commonly used phrase “birdsof a feather, flock together”. A classic example of a sociological study of homophily (by race) isprovided in Figure 13. The opposite of homophily is Heterophily, which refers to a process wherebyactors who are different from each other are more likely to form ties. An example of heterophilymay be that of formal academic advising relationships, with students being more likely to form tiesto faculty for advising than to other students.
14

Figure 13: Racial homophily in a high school friendship network. Nodes are connected if students are friends and colored byrace with yellow and green nodes forming two distinguishable groups and even smaller minority students (red) in both mainclusters (Moody, 2001).
4. Modularity: is a measure of the degree to which a network displays Community Structure, withclusters that are not densely connected to others but densely connected within cluster. This measureis very difficult to calculate, but provides a way to identify community structure on a networkwhere where one is unsure if such a structure exists (Newman, 2006; Zhang et al., 2008; Karrerand Newman, 2011). However, this measure is not consistent across networks of different size andgroup size. Graph Compartmentalization – a related measure – does allow for comparison betweennetworks of arbitrary size and structure, but is not designed for detecting communities (Denny,2014). An example of community structure between authors of papers about network analysis ispresented in Figure 14.
15
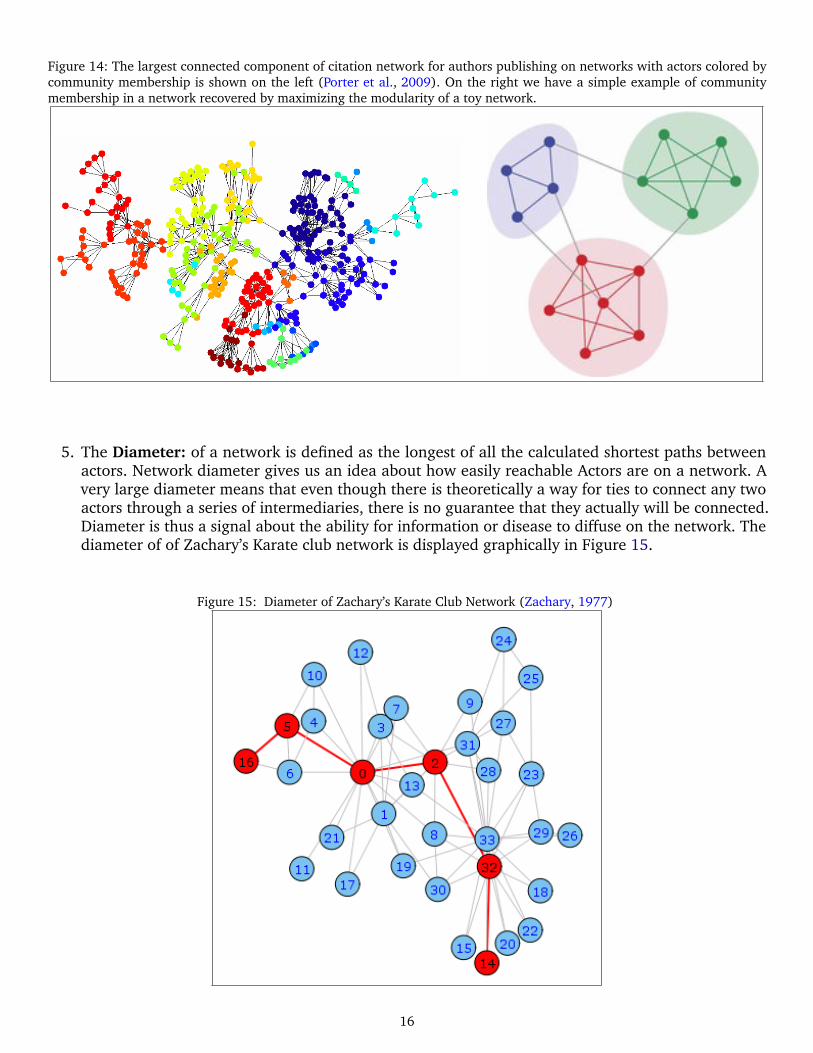
Figure 14: The largest connected component of citation network for authors publishing on networks with actors colored bycommunity membership is shown on the left (Porter et al., 2009). On the right we have a simple example of communitymembership in a network recovered by maximizing the modularity of a toy network.
5. The Diameter: of a network is defined as the longest of all the calculated shortest paths betweenactors. Network diameter gives us an idea about how easily reachable Actors are on a network. Avery large diameter means that even though there is theoretically a way for ties to connect any twoactors through a series of intermediaries, there is no guarantee that they actually will be connected.Diameter is thus a signal about the ability for information or disease to diffuse on the network. Thediameter of of Zachary’s Karate club network is displayed graphically in Figure 15.
Figure 15: Diameter of Zachary’s Karate Club Network (Zachary, 1977)
16

6. There are a number of classic Network Types that can be used to characterize the stereotypicalsocial structure in different situations. Regular networks are characterized by all actors havingthe same degree and are often a starting point for simulation studies of networks (Centola et al.,2007). Small world networks are very efficient for information transfer in that most nodes are notconnected (so a high degree of clustering) but also have a relatively short average path lengthbetween actors (Travers and Milgram, 1969; Watts and Strogatz, 1998). Random networks are veryrobust to disruptions (Latora and Marchiori, 2001; Callaway et al., 2000) but may be difficult forpeople to maintain, especially if ties are across long distances (Dodds et al., 2003; Aral et al., 2012).Examples of network types originally discussed in Watts and Strogatz (1998) are shown in Figure16.
Figure 16: An example of a Regular Network (all actors have the same degree and are structurally equivalent to eachother),a Small World Network where dense clusters are connected by random and far reaching ties and a Random Network, whereactors are randomly connected and there is no discernable structure.
5 Resources
What follows is a non-exhaustive list of my favorite reference materials on social network analysis andtheory:
1. The Bible: Social Network Analysis: Methods and Applications by Wasserman and Faust (1994) isreally the only book you should buy on social network analysis. It is used by everyone, it is thegold standard textbook on the subject and covers the theory and mathematical derivations behind awhole bunch of useful network properties.
2. The structure and function of complex networks (Newman, 2003) is a nice (technical) review of theliterature on network analysis with 492 relevant citations to other articles.
3. ICPSR runs two 4 week summer sessions where they teach an introductory network analysis courseand an advanced topics course. Check out their website for course offerings:http://www.icpsr.umich.edu/icpsrweb/sumprog/index.jsp
4. Some interesting academic websites related to network analysis:
17

(a) Stanford SNAP Lab
(b) Lazer Lab at Northeastern
(c) Carter Butts’ Research Page
References
Aral, Sinan and Marshall Van Alstyne. The Diversity-Bandwidth Trade-off. American Journal of Sociology, 117(1):90–171,2011. http://www.jstor.org/stable/10.1086/661238. 1
Aral, Sinan and Dylan Walker. Identifying influential and susceptible members of social networks. Science (New York, N.Y.),337(6092):337–41, July 2012. http://www.ncbi.nlm.nih.gov/pubmed/22722253. 1
Aral, Sinan, Erik Brynjolfsson, and Marshall Van Alstyne. Information, Technology, and Information Worker Productivity.Information Systems Research, 23(3-part-2):849–867, September 2012. http://pubsonline.informs.org/doi/abs/10.
1287/isre.1110.0408. 17
Aral, Sinan, Lev Muchnik, and Arun Sundararajan. Engineering Social Contagions: Optimal Network Seeding in the Presenceof Homophily. Network Science, pages 0–43, 2013. 1
Callaway, Duncan S., Mark E. J. Newman, Steven H. Strogatz, and Duncan J. Watts. Network robustness and fragility:percolation on random graphs. Physical review letters, 85(25):5468–71, December 2000. http://www.ncbi.nlm.nih.gov/pubmed/11136023. 17
Carpenter, Daniel P., Kevin M. Esterling, and David M. J. Lazer. Friends, Brokers, and Transitivity: Who Informs Whom inWashington Politics? Journal of Politics, 66(1):224–246, February 2004. http://doi.wiley.com/10.1046/j.1468-2508.2004.00149.x. 10
Centola, D, J C Gonzalez-Avella, V M Eguıluz, and M San Miguel. Homophily, cultural drift, and the co-evolution of culturalgroups. Journal of Conflict Resolution, 51(6):905, 2007. 14, 17
Cranmer, Skyler J. and Bruce A. Desmarais. Inferential network analysis with exponential random graph mod-els. Political Analysis, 19(1):66, 2011. http://people.cs.umass.edu/~wallach/courses/s11/cmpsci791ss/readings/cranmer11inferential.pdf. 1
Denny, Matthew J. Graph Compartmentalization. 2014. 15
D’Exelle, Ben and Nathalie Holvoet. Gender and Network Formation in Rural Nicaragua: A Village Case Study. FeministEconomics, 17(2):31–61, April 2011. http://www.tandfonline.com/doi/abs/10.1080/13545701.2011.573488. 1
Dodds, Peter Sheridan, Duncan J. Watts, and Charles F. Sabel. Information exchange and the robustness of organiza-tional networks. Proceedings of the National Academy of Sciences of the United States of America, 100(21):12516–21, Oc-tober 2003. http://www.pubmedcentral.nih.gov/articlerender.fcgi?artid=218789&tool=pmcentrez&rendertype=abstract. 17
Fowler, James H. Connecting the Congress: A Study of Cosponsorship Networks. Political Analysis, 14(4):456–487, March2006. http://pan.oxfordjournals.org/cgi/doi/10.1093/pan/mpl002. 1
Gomez Rodriguez, Manuel, Jure Leskovec, and Andreas Krause. Inferring networks of diffusion and influence. Proceedingsof the 16th ACM SIGKDD international conference on Knowledge discovery and data mining - KDD ’10, page 1019, 2010.http://dl.acm.org/citation.cfm?doid=1835804.1835933. 1
Goodreau, Steven M., James A. Kitts, and Martina Morris. Birds of a feather, or friend of a friend? using exponential randomgraph models to investigate adolescent social networks. Demography, 46(1):103–125, 2009. http://link.springer.com/article/10.1353/dem.0.0045. 14
Hoff, Peter D, Adrian E Raftery, and Mark S Handcock. Latent Space Approaches to Social Network Analysis. Journal of theAmerican Statistical Association, 97(460):1090–1098, December 2002. http://www.tandfonline.com/doi/abs/10.1198/016214502388618906. 1, 10
Ibarra, Herminia. Homophily and Differential Returns : Sex Differences in Network Structure and Access in an AdvertisingFirm. Administrative Sceince Quarterly, 37:422–447, 1992. http://www.jstor.org/stable/10.2307/2393451. 14
18

Jackson, Matthew O. and Dunia Lopez-Pintado. Diffusion and contagion in networks with heterogeneous agents and homophily.Network Science, 1(01):49–67, April 2013. http://www.journals.cambridge.org/abstract_S2050124212000070. 1
Kaiser, M, M Gorner, and C C Hilgetag. Criticality of Spreading Dynamics in Hierarchical Cluster Networks Without Inhibi-tion. New Journal of Physics, 9(5):110–110, May 2007. http://stacks.iop.org/1367-2630/9/i=5/a=110?key=crossref.dfed57894257e4d7543a2907e823ade6. 14
Karrer, Brian and Mark E. J. Newman. Stochastic blockmodels and community structure in networks. Physical Review E, 83(1):1–11, 2011. http://pre.aps.org/abstract/PRE/v83/i1/e016107. 15
Kirkland, Justin H. The Relational Determinants of Legislative Outcomes: Strong and Weak Ties Between Legislators. TheJournal of Politics, 73(03):887–898, August 2011. http://www.journals.cambridge.org/abstract_S0022381611000533.1
Kossinets, Gueorgi and Duncan J. Watts. Origins of Homophily in an Evolving Social Network. American Journal of Sociology,115(2):405–450, September 2009. http://www.jstor.org/stable/10.1086/599247. 14
Krackhardt, D. Cognitive social structures. Social Networks, 9(2):109–134, 1987. 5
Krafft, Peter, Juston Moore, Bruce A Desmarais, and Hanna Wallach. Topic-partitioned multinetwork embeddings. In Advancesin Neural Information Processing Systems Twenty-Five, 2012. http://machinelearning.wustl.edu/mlpapers/paper_
files/NIPS2012_1288.pdf. 1
Latora, Vito and Massimo Marchiori. Efficient Behavior of Small-World Networks. Physical review letters, 2001. http:
//prl.aps.org/abstract/PRL/v87/i19/e198701. 13, 17
Levin, Daniel Z. and Rob Cross. The Strength of Weak Ties You Can Trust: The Mediating Role of Trust in Effective KnowledgeTransfer. Management Science, 50(11):1477–1490, November 2004. http://mansci.journal.informs.org/cgi/doi/10.1287/mnsc.1030.0136. 1
Lorrain, Francois and Harrison C. White. Structural Equivalence of Individuals in Social Networks. The Journal of MathematicalSociology, 1(1):49–80, January 1971. http://www.tandfonline.com/doi/abs/10.1080/0022250X.1971.9989788. 11
Lubin, Ben, Jesse Shore, and Vatche Ishakian. Communication Network Design: Balancing Modularity and Mixing via ExtremalGraph Spectra. 2013. http://mackinstitute.wharton.upenn.edu/wp-content/uploads/2013/07/Shore-Jesse_
Communication-network-design.pdf. 1
Marwell, G, P E Oliver, and R Prahl. Social networks and collective action: A theory of the critical mass. III. American Journalof Sociology, pages 502–534, 1988. 1
Mason, Winter and Duncan J. Watts. Collaborative learning in networks. Proceedings of the National Academy of Sciences, 109(3):764–769, 2012. http://www.pnas.org/content/109/3/764.short. 13
McDonald, Steve. What’s in the old boys network? Accessing social capital in gendered and racialized networks. SocialNetworks, 33(4):317–330, October 2011. http://linkinghub.elsevier.com/retrieve/pii/S0378873311000554. 14
McPherson, M, L Smith-Lovin, and J M Cook. Birds of a feather: Homophily in social networks. Annual review of sociology,pages 415–444, 2001. 1, 14
Moody, James. Race, School Integration, and Friendship Segregation in America. American Journal of Sociology, 107(3):679–716, 2001. http://www.jstor.org/stable/10.1086/338954. 15
Moreno, Jacob Levy. Who shall survive?: A new approach to the problem of human interrelations. 1934. 1, 2
Neves, Guilherme, Sam F Cooke, and Tim V P Bliss. Synaptic plasticity, memory and the hippocampus: a neural networkapproach to causality. Nature reviews. Neuroscience, 9(1):65–75, January 2008. http://www.ncbi.nlm.nih.gov/pubmed/18094707. 1
Newman, M E J. The structure and function of complex networks. SIAM review, pages 167–256, 2003. 1, 13, 17
Newman, Mark E. J. Modularity and community structure in networks. Proceedings of the National Academy of Sciences ofthe United States of America, 103(23):8577–82, June 2006. http://www.pubmedcentral.nih.gov/articlerender.fcgi?artid=1482622&tool=pmcentrez&rendertype=abstract. 15
Porter, Mason A., Jukka-Pekka Onnela, and Peter J. Mucha. Communities in Networks. Notices of the AMS, 56(9), 2009.http://www.ams.org/notices/200909/rtx090901082p.pdf. 16
19

Raftery, Adrian E., Xiaoyue Niu, Peter D. Hoff, and Ka Yee Yeung. Fast Inference for the Latent Space Network ModelUsing a Case-Control Approximate Likelihood. Journal of Computational and Graphical Statistics, 21(4):901–919, 2012.http://www.tandfonline.com/doi/abs/10.1080/10618600.2012.679240. 1
Stackman, Richard W. and Craig C. Pinder. Context and Sex Effects on Personal Work Networks. Journal of Social and PersonalRelationships, 16:39–64, 1999. http://spr.sagepub.com/content/16/1/39.short. 1
Straits, Bruce C. Ego-net diversity: Same- and cross-sex coworker ties. Social networks, 18:29–45, 1996. http://www.
sciencedirect.com/science/article/pii/0378873395002545. 14
Sundararajan, Arun, Foster Provost, Gal Oestreicher-Singer, and Sinan Aral. Information in Digital, Economic and SocialNetworks. SSRN Electronic Journal, 3, 2012. http://www.ssrn.com/abstract=2141682. 1
Suri, Siddharth and Duncan J Watts. Cooperation and contagion in web-based, networked public goods experiments. PloSone, 6(3):e16836, January 2011. http://www.pubmedcentral.nih.gov/articlerender.fcgi?artid=3055889&tool=
pmcentrez&rendertype=abstract. 13
Travers, J and S Milgram. An experimental study of the small world problem. Sociometry, pages 425–443, 1969. 17
Ward, Michael D., Katherine Stovel, and Audrey Sacks. Network Analysis and Political Science. Annual Review of Political Science,14(1):245–264, June 2011. http://www.annualreviews.org/doi/abs/10.1146/annurev.polisci.12.040907.115949.12
Wasserman, Stanley and Katherine Faust. Social Network Analysis: Methods and Applications, volume 8 of Structural analysisin the social sciences, 8. Cambridge University Press, 1994. http://www.amazon.com/dp/0521387078. 17
Watts, Duncan J. and Steven H. Strogatz. Collective dynamics of ’small-world’ networks. Nature, 393(6684):440–2, June1998. http://www.ncbi.nlm.nih.gov/pubmed/9623998. 17, 17
Watts, Duncan J., Peter Sheridan Dodds, and Mark E .J. Newman. Identity and Search in Social Networks. Science (New York,N.Y.), 296(5571):1302–5, May 2002. http://www.ncbi.nlm.nih.gov/pubmed/12016312. 1
Zachary, Wayne W. An Information Flow Model for Conflict and Fission in Small Groups. Journal of Anthropological Research,33(4):452–473, 1977. http://www.maths.tcd.ie/~mnl/store/Zachary1977a.pdf. 1, 3, 6, 7, 7, 8, 9, 11, 16
Zhang, Yan, A. J. Friend, Amanda L. Traud, Mason A. Porter, James H. Fowler, and Peter J. Mucha. Community Structure inCongressional Cosponsorship Networks. Physica A, 387(7):1705–1712, 2008. http://www.sciencedirect.com/science/article/pii/S037843710701206X. 15
20