social network analysis - brown university
TRANSCRIPT

Social Network Analysis
These slides are heavily based on these slides (by Giorgos Cheliotis)

Enron Email Network

Dots that are blue tend to be connected with other dots that are blue, and the same can be said about red dots.
Political Bloggers
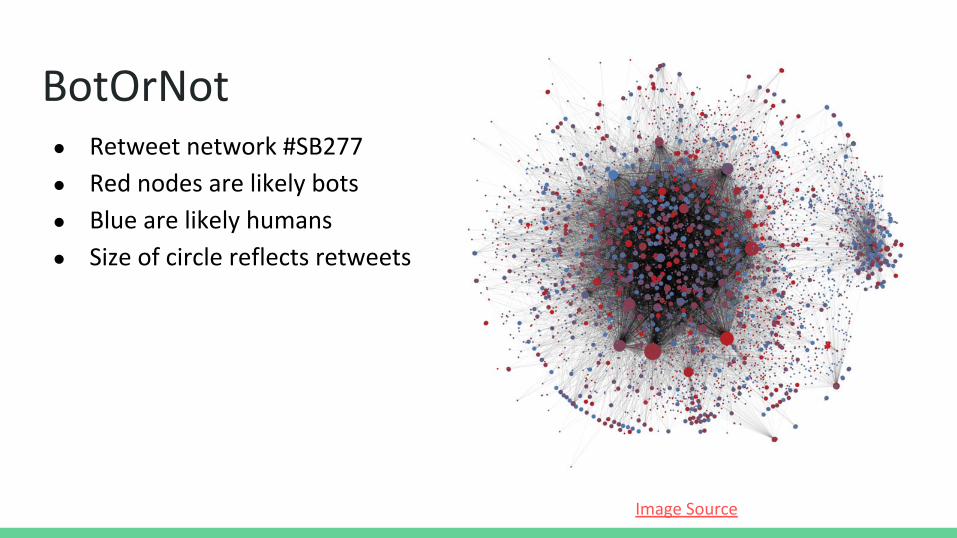
BotOrNot
Image Source
● Retweet network #SB277
● Red nodes are likely bots
● Blue are likely humans
● Size of circle reflects retweets

● Social network analysis lies at the intersection of social science, network analysis, and graph theory. ○ Network analysis involves the formulation of and solutions to problems
with an underlying network structure. ○ Networks can be visualized and analyzed using graph theory.
● Social network analysis centers on the relationships between people, instead of the individual people themselves.
What is Social Network Analysis (SNA)?

● Businesses use SNA to understand communication flow within organizations.
● Library scientists can use SNA to identify transformative research papers.
● Police use SNA when trying to identify criminal and terrorist networks.
● Epidemiologists use SNA to understand disease transmission.
● Civil organizations use SNA to uncover conflicts of interest.
● Facebook uses SNA to recommend friends.
Practical Applications
● Mathematicians
● Statisticians
● Physicists
● Biologists
● Sociologists
● Computer scientists
● etc.
Theory
● A graph is the typical representation of a social network.
● Key players are important/central nodes in a network.
● Cohesion vs. fragmentation: overall network structure.
● Strength of ties identifies strong and weak relationships.
Basic Concepts
Primer on Graphs

● Graphs are comprised of nodes and edges.
● Nodes represent the unit of analysis in the network(e.g., individuals, web sites, etc.)
● Nodes are connected by edges, which denote relationships.
Nodes and Edges

Undirected Graphs● Undirected graphs have only
bidirectional links
● In this sample graph, 1 connects to 4, and 4 connects to 1; 2 connects to 4, and 4 connects to 2; and so on.
● We could use a graph like this to map out Facebook.

Directed Graphs● Directed graphs have
uni-directional links.
● In this sample graph, d points to b, which points to a, but b does not point back to d, and a does not point back to b.
● We could use a graph like this to map out the Web, or Twitter.

Directed vs. Undirected Graphs● Undirected graphs have only bidirectional links
○ We could use a graph like this to map out Facebook.
○ In this sample graph, 1 connects to 4, and 4 connects to 1;
2 connects to 4, and 4 connects to 2; and so on.
● Directed graphs have uni-directional links ○ We could use a graph like this to map out the Web, or Twitter.
○ In this sample graph, d points to b, which points to a, but
b does not point back to d, and a does not point back to b.

Paths● A path between two nodes is a
sequence of unique nodes that connects the two nodes in question.
● The shortest path is the path with the fewest number of edges.
● The shortest paths from 1 to 4are shown in green.

● Weights might be distances in a transportation network, or delay in a communications network, making a shortest path is a path of least total distance or total delay.
● Weights might be the strength of a connection: e.g., the number of times A has retweeted B’s tweets
Weights
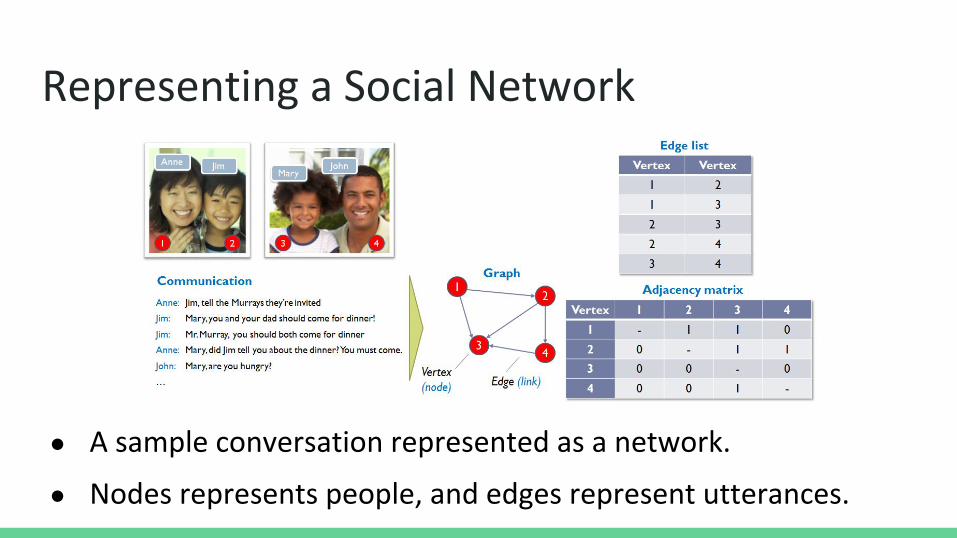
● A sample conversation represented as a network.
● Nodes represents people, and edges represent utterances.
Representing a Social Network

Key Players

Six Degrees of Kevin Bacon / Separation“One of us suggested performing the following experiment to prove that the population of the Earth is closer together now than they have ever been before. We should select any person from the 1.5 billion inhabitants of the Earth – anyone, anywhere at all. He bet us that, using no more than five individuals, one of whom is a personal acquaintance, he could contact the selected individual using nothing except the network of personal acquaintances.”
Frigyes Karinthy, 1929
● Bacon number (in Hollywood)○ Elvis has a Bacon number of 2
● Erdős number (in math)○ I have an Erdős number of 4 (I think)

● Identifying nodes that are central to a network is useful!
● Police can identify the center of a criminal network to arrest the central players and put a stop to the network.
● Most influential tweeters on Twitter: e.g., Trump has many followers, but follows very few people himself.
● Google’s PageRank algorithm, which revolutionized web search, is, at its core, an algorithm that ranks nodes in a web graph according to their degree centrality. The highest-ranked pages are the ones that are most central to the network.
Network Centrality as a Proxy for Influence

● Each node has an in-degree and an out-degree.○ In-degree is the number of edges that point to a node.
○ Out-degree is the number of edges pointing away from a node.
Degree Centrality
The nodes with the highest in-degree and out-degree are 3 & 5.
12
3
5
7
6
4
0 10 1
3 1
0 10 1
1 0
3 2

Eigenvector Centrality ● Google ranks search results in
accordance with this principle.
● A node is central not only if a lot of other nodes deem it central, but if a lot of other nodes that are central themselves deem it central!
● On Twitter, being followed by three celebrities is more significant than being followed by 33 CS professors! 2, 3, and 5 most central

Closeness Centrality● Closeness centrality is used to
measure “reach” in a network.
● Calculate the average length of the shortest paths to or from a node and all other nodes in the network.
● Then take the reciprocal, only so that higher values are associated with greater centrality.
● If a node is close to other nodes,news will reach that node fast.
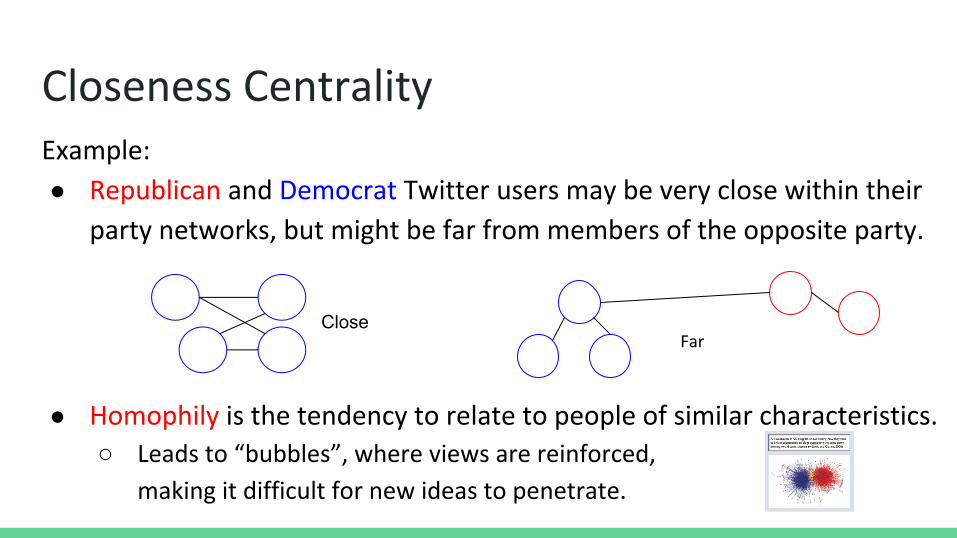
Closeness CentralityExample:
● Republican and Democrat Twitter users may be very close within their
party networks, but might be far from members of the opposite party.
● Homophily is the tendency to relate to people of similar characteristics. ○ Leads to “bubbles”, where views are reinforced,
making it difficult for new ideas to penetrate.
CloseFar

Betweenness Centrality● Fix a node.
● Select two other nodes, and find the fraction of the all the shortest paths between them that go through the given node.
● Repeat for all pairs of nodes, and add them all together.
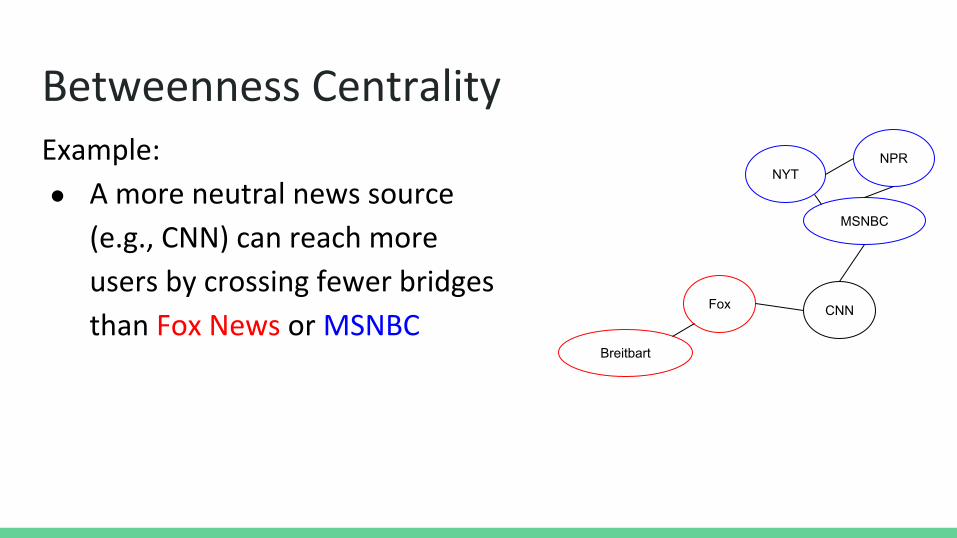
Betweenness CentralityExample:
● A more neutral news source
(e.g., CNN) can reach more
users by crossing fewer bridges
than Fox News or MSNBCCNN
NPRNYT
MSNBC
Fox
Breitbart
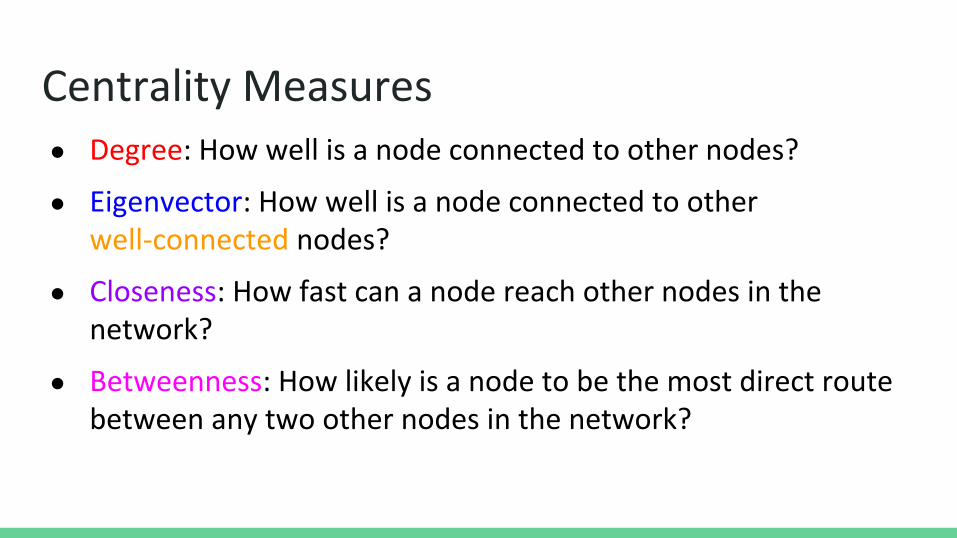
Centrality Measures● Degree: How well is a node connected to other nodes?
● Eigenvector: How well is a node connected to other well-connected nodes?
● Closeness: How fast can a node reach other nodes in the network?
● Betweenness: How likely is a node to be the most direct route between any two other nodes in the network?

Cohesion vs. Fragmentation
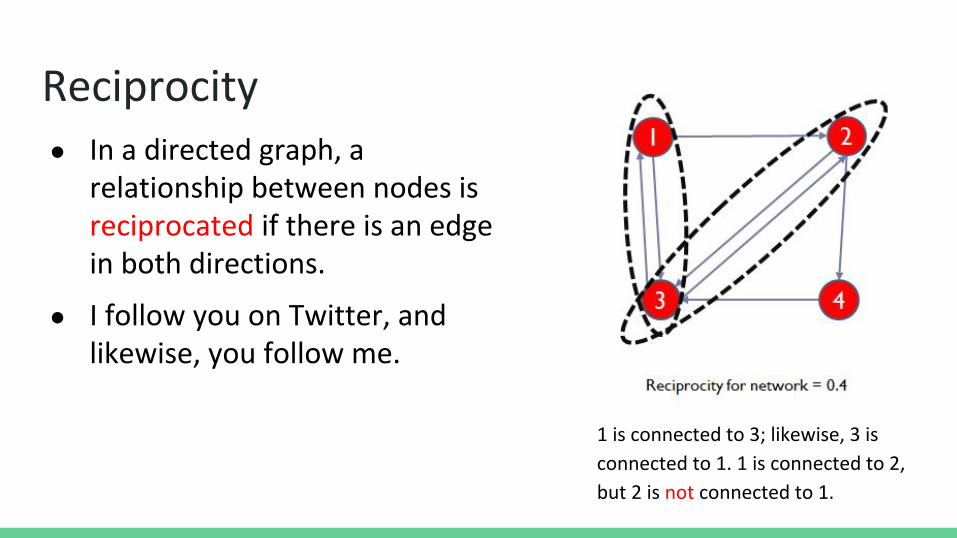
Reciprocity ● In a directed graph, a
relationship between nodes is reciprocated if there is an edge in both directions.
● I follow you on Twitter, and likewise, you follow me.
1 is connected to 3; likewise, 3 is
connected to 1. 1 is connected to 2,
but 2 is not connected to 1.

Density● A network’s density is the
ratio of the number of edges in the network to the maximum possible number of edges.
● A network with a density of 1 is called a clique. “My friends and I are very
close; everyone follows
everyone else on Twitter.”

Diameter● A network’s diameter is the length of the longest shortest path
within the network.
● The average of all shortest paths is also an interesting measure.
A network spanning a small town is very dense, since everyone knows everyone else, and it has a small diameter.
A network spanning a big city is less dense, and requires many more hops to get from one person to another.

Clustering Coefficient● A measure of how tightly the nodes in a
network tend to cluster
● Local clustering coefficient○ A triplet is three connected nodes○ A node’s coefficient is the ratio of the number of
closed triplets to the number of possible triplets○ For node 3, this ratio is 2 / 6 = 0.33
● There is also a notion of a global CC
● Can average the coefficients over the all nodes in the network to calculate a coefficient for the entire network
The dotted lines designate missing edges that would create all the triplets in 3’s neighborhood.

● Homophily is the tendency to relate to people of similar characteristics. ○ Leads to “bubbles”, where views are reinforced,
making it difficult for new ideas to penetrate.
● Transitivity in ties tend to characterize stronger ties. ○ If A & B are related, and B & C are related, then A & C are related○ Homophily and transitivity together lead to cliques.
● Bridges are nodes and edges that connect clusters. ○ These are usually weak ties, but they increase social cohesion,
and help spur innovation.
Terminology
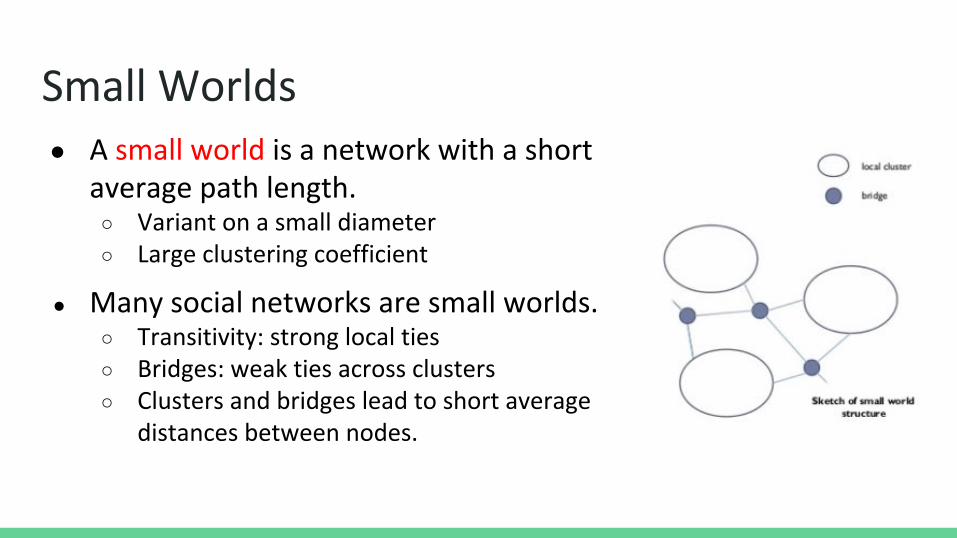
Small Worlds● A small world is a network with a short
average path length. ○ Variant on a small diameter○ Large clustering coefficient
● Many social networks are small worlds.○ Transitivity: strong local ties○ Bridges: weak ties across clusters○ Clusters and bridges lead to short average
distances between nodes.

● A tie (or a connection) between individuals depends on their time, emotion, trust, etc.
● Tendencies towards innovating can be inhibited by strong ties.
● Mark Granovetter (1973):
The Strength of Weak Ties
Image Source
...individuals with few weak ties will be deprived of information from distant parts of the social system and will be confined to the provincial news and views of their close friends. This deprivation will not only insulate them from the latest ideas and fashions but may put them in a disadvantaged position...

Summary● We can use the methodology of SNA to model social
relationships between individuals and groups.
● We use SNA to understand the structure of a network:○ Which are the nodes of influence?○ How coherent or fragmented is a network?○ How strong/weak are its connections? Why does it matter?