social media survey report news release
TRANSCRIPT
Confidential Spot Survey #11 Five Questions on PR/PA Agency Use
of Social Media for Clients
September, 2010
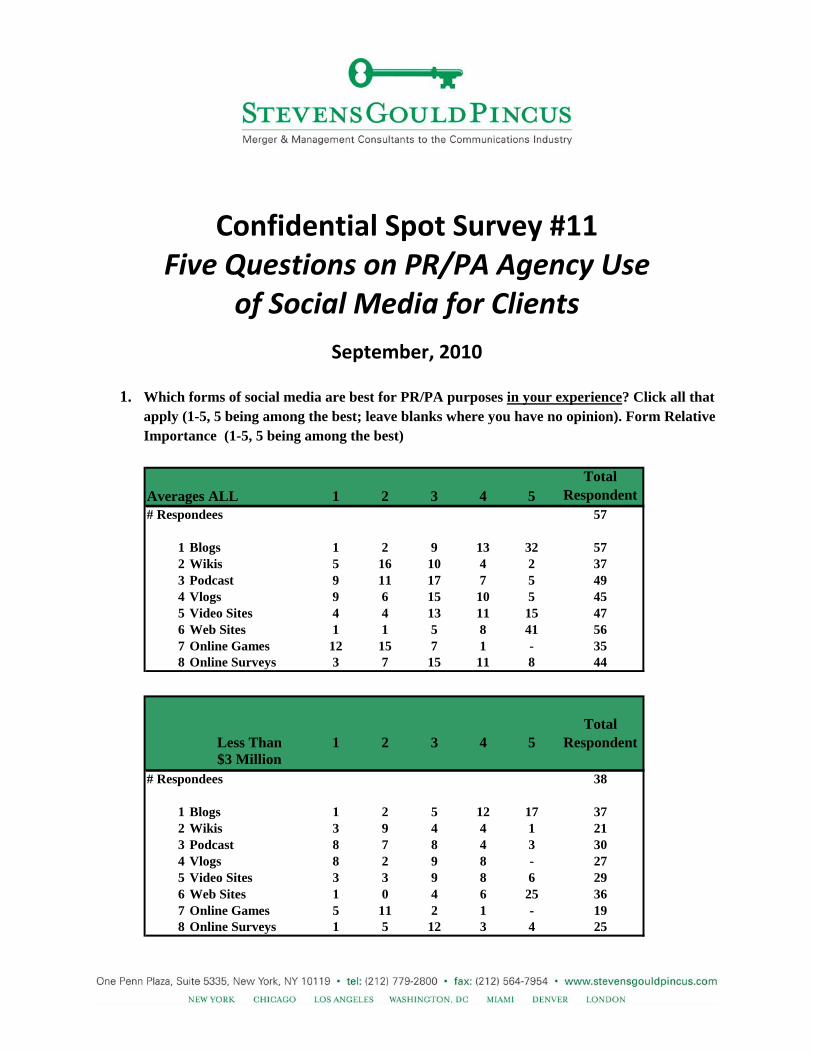
1. Which forms of social media are best for PR/PA purposes in your experience? Click all that apply (1-5, 5 being among the best; leave blanks where you have no opinion). Form Relative Importance (1-5, 5 being among the best)
Averages ALL 1 2 3 4 5Total
Respondent # Respondees 57
1 Blogs 1 2 9 13 32 572 Wikis 5 16 10 4 2 373 Podcast 9 11 17 7 5 494 Vlogs 9 6 15 10 5 455 Video Sites 4 4 13 11 15 476 Web Sites 1 1 5 8 41 567 Online Games 12 15 7 1 - 358 Online Surveys 3 7 15 11 8 44
Less Than 1 2 3 4 5Total
Respondent $3 Million
# Respondees 38
1 Blogs 1 2 5 12 17 372 Wikis 3 9 4 4 1 213 Podcast 8 7 8 4 3 304 Vlogs 8 2 9 8 - 275 Video Sites 3 3 9 8 6 296 Web Sites 1 0 4 6 25 367 Online Games 5 11 2 1 - 198 Online Surveys 1 5 12 3 4 25
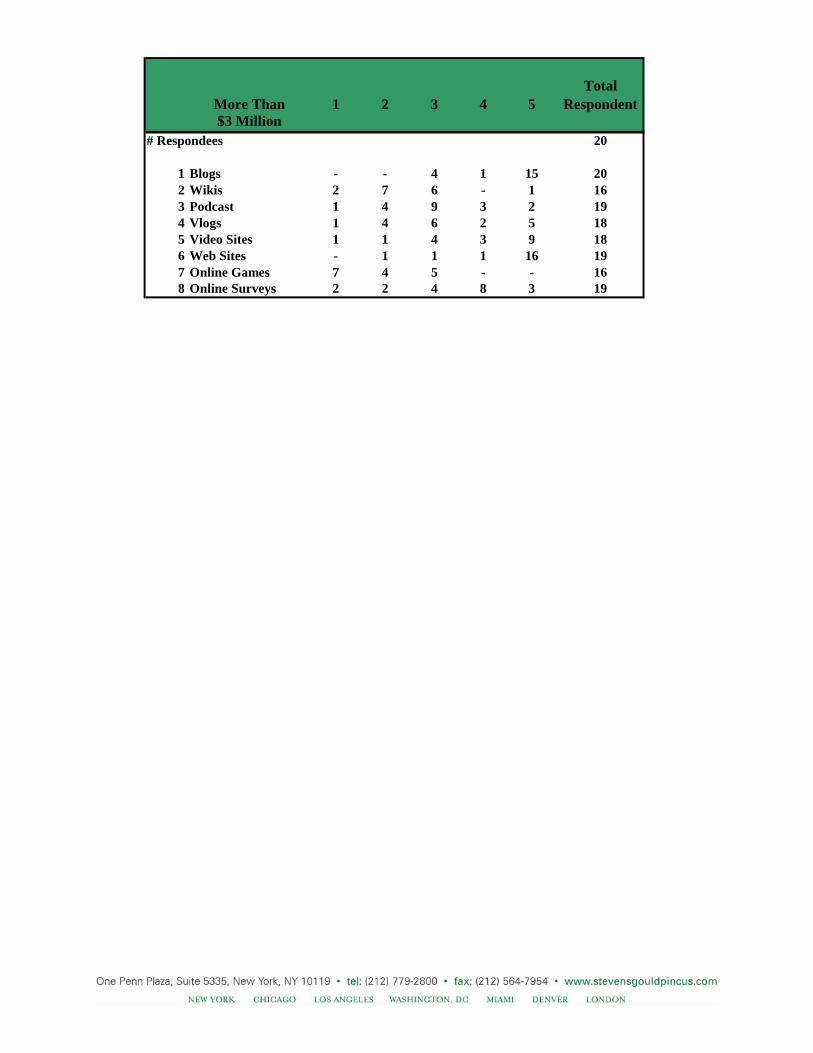
More Than 1 2 3 4 5Total
Respondent $3 Million
# Respondees 20
1 Blogs - - 4 1 15 202 Wikis 2 7 6 - 1 163 Podcast 1 4 9 3 2 194 Vlogs 1 4 6 2 5 185 Video Sites 1 1 4 3 9 186 Web Sites - 1 1 1 16 197 Online Games 7 4 5 - - 168 Online Surveys 2 2 4 8 3 19
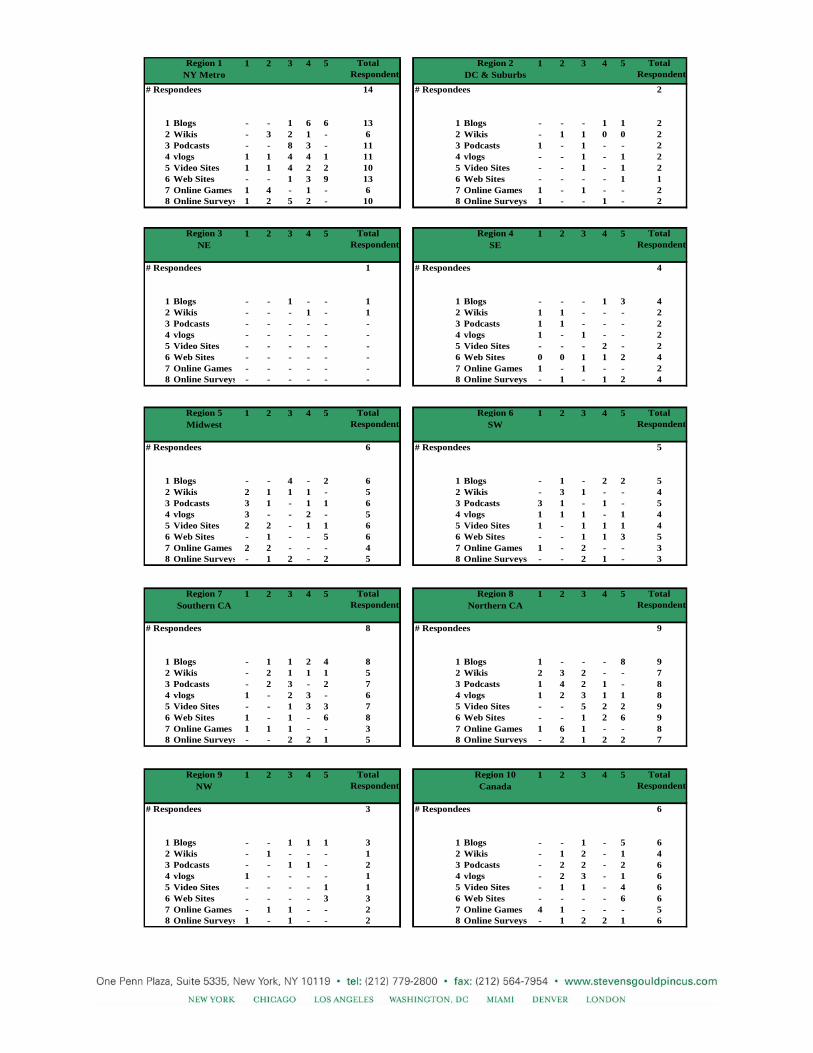
Region 1 1 2 3 4 5 Total Region 2 1 2 3 4 5 Total NY Metro Respondent DC & Suburbs Respondent
# Respondees 14 # Respondees 2
1 Blogs - - 1 6 6 13 1 Blogs - - - 1 1 22 Wikis - 3 2 1 - 6 2 Wikis - 1 1 0 0 23 Podcasts - - 8 3 - 11 3 Podcasts 1 - 1 - - 24 vlogs 1 1 4 4 1 11 4 vlogs - - 1 - 1 25 Video Sites 1 1 4 2 2 10 5 Video Sites - - 1 - 1 26 Web Sites - - 1 3 9 13 6 Web Sites - - - - 1 17 Online Games 1 4 - 1 - 6 7 Online Games 1 - 1 - - 28 Online Surveys 1 2 5 2 - 10 8 Online Surveys 1 - - 1 - 2
Region 3 1 2 3 4 5 Total Region 4 1 2 3 4 5 Total NE Respondent SE Respondent
# Respondees 1 # Respondees 4
1 Blogs - - 1 - - 1 1 Blogs - - - 1 3 42 Wikis - - - 1 - 1 2 Wikis 1 1 - - - 23 Podcasts - - - - - - 3 Podcasts 1 1 - - - 24 vlogs - - - - - - 4 vlogs 1 - 1 - - 25 Video Sites - - - - - - 5 Video Sites - - - 2 - 26 Web Sites - - - - - - 6 Web Sites 0 0 1 1 2 47 Online Games - - - - - - 7 Online Games 1 - 1 - - 28 Online Surveys - - - - - - 8 Online Surveys - 1 - 1 2 4
Region 5 1 2 3 4 5 Total Region 6 1 2 3 4 5 Total Midwest Respondent SW Respondent
# Respondees 6 # Respondees 5
1 Blogs - - 4 - 2 6 1 Blogs - 1 - 2 2 52 Wikis 2 1 1 1 - 5 2 Wikis - 3 1 - - 43 Podcasts 3 1 - 1 1 6 3 Podcasts 3 1 - 1 - 54 vlogs 3 - - 2 - 5 4 vlogs 1 1 1 - 1 45 Video Sites 2 2 - 1 1 6 5 Video Sites 1 - 1 1 1 46 Web Sites - 1 - - 5 6 6 Web Sites - - 1 1 3 57 Online Games 2 2 - - - 4 7 Online Games 1 - 2 - - 38 Online Surveys - 1 2 - 2 5 8 Online Surveys - - 2 1 - 3
Region 7 1 2 3 4 5 Total Region 8 1 2 3 4 5 Total Southern CA Respondent Northern CA Respondent
# Respondees 8 # Respondees 9
1 Blogs - 1 1 2 4 8 1 Blogs 1 - - - 8 92 Wikis - 2 1 1 1 5 2 Wikis 2 3 2 - - 73 Podcasts - 2 3 - 2 7 3 Podcasts 1 4 2 1 - 84 vlogs 1 - 2 3 - 6 4 vlogs 1 2 3 1 1 85 Video Sites - - 1 3 3 7 5 Video Sites - - 5 2 2 96 Web Sites 1 - 1 - 6 8 6 Web Sites - - 1 2 6 97 Online Games 1 1 1 - - 3 7 Online Games 1 6 1 - - 88 Online Surveys - - 2 2 1 5 8 Online Surveys - 2 1 2 2 7
Region 9 1 2 3 4 5 Total Region 10 1 2 3 4 5 Total NW Respondent Canada Respondent
# Respondees 3 # Respondees 6
1 Blogs - - 1 1 1 3 1 Blogs - - 1 - 5 62 Wikis - 1 - - - 1 2 Wikis - 1 2 - 1 43 Podcasts - - 1 1 - 2 3 Podcasts - 2 2 - 2 64 vlogs 1 - - - - 1 4 vlogs - 2 3 - 1 65 Video Sites - - - - 1 1 5 Video Sites - 1 1 - 4 66 Web Sites - - - - 3 3 6 Web Sites - - - - 6 67 Online Games - 1 1 - - 2 7 Online Games 4 1 - - - 58 Online Surveys 1 - 1 - - 2 8 Online Surveys - 1 2 2 1 6
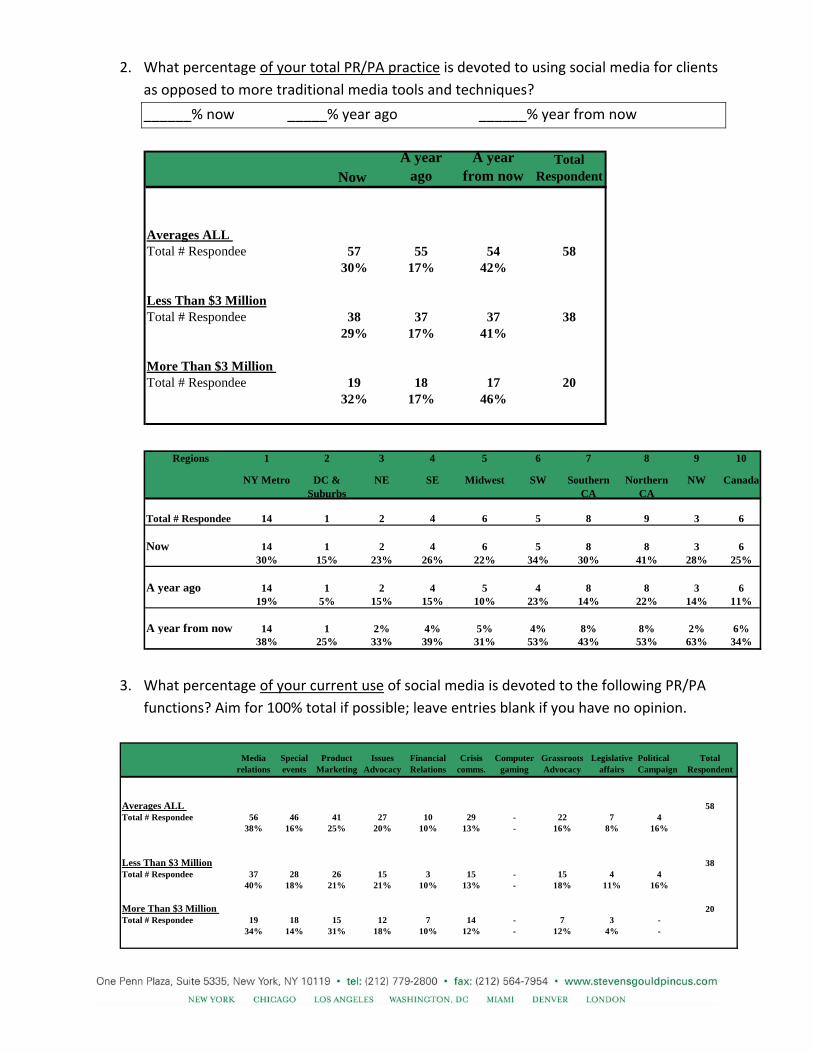
2. What percentage of your total PR/PA practice is devoted to using social media for clients as opposed to more traditional media tools and techniques?
______% now _____% year ago ______% year from now
Now A year
ago A year
from now Total
Respondent
Averages ALL Total # Respondee 57 55 54 58
30% 17% 42%
Less Than $3 MillionTotal # Respondee 38 37 37 38
29% 17% 41%
More Than $3 Million Total # Respondee 19 18 17 20
32% 17% 46%
Regions 1 2 3 4 5 6 7 8 9 10
NY Metro DC & Suburbs
NE SE Midwest SW Southern CA
Northern CA
NW Canada
Total # Respondee 14 1 2 4 6 5 8 9 3 6
Now 14 1 2 4 6 5 8 8 3 630% 15% 23% 26% 22% 34% 30% 41% 28% 25%
A year ago 14 1 2 4 5 4 8 8 3 619% 5% 15% 15% 10% 23% 14% 22% 14% 11%
A year from now 14 1 2% 4% 5% 4% 8% 8% 2% 6%38% 25% 33% 39% 31% 53% 43% 53% 63% 34%
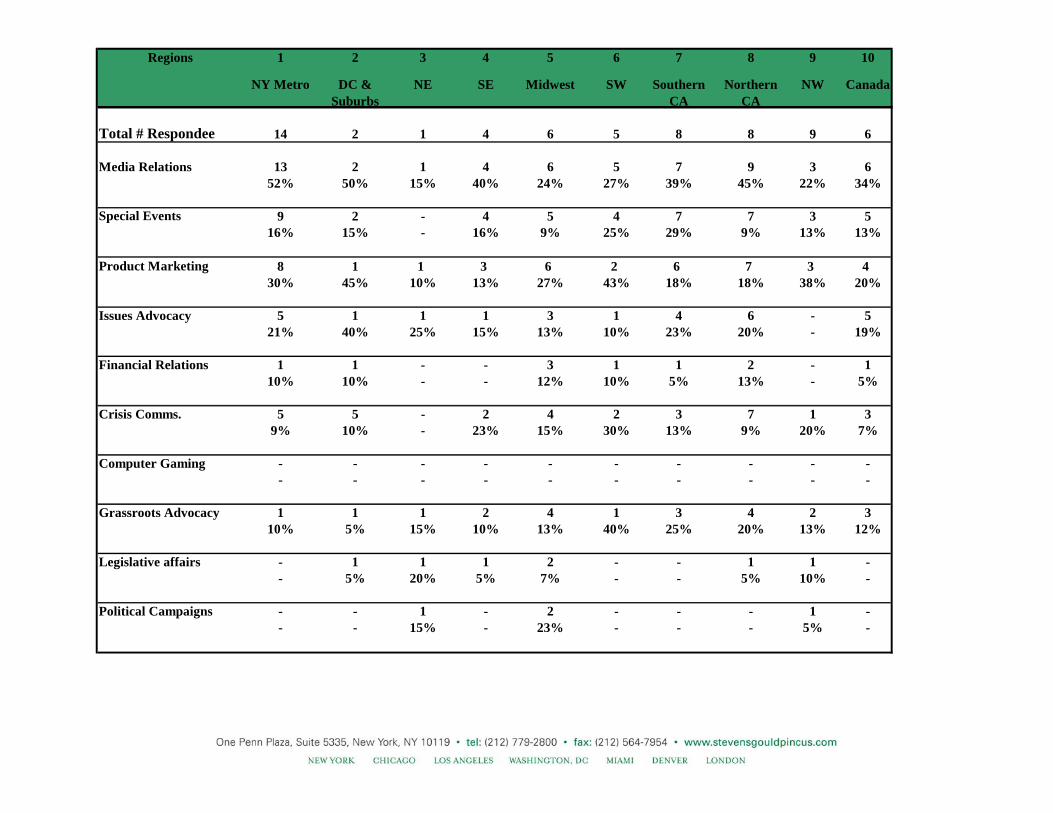
3. What percentage of your current use of social media is devoted to the following PR/PA
functions? Aim for 100% total if possible; leave entries blank if you have no opinion.
Media relations
Special events
Product Marketing
Issues Advocacy
Financial Relations
Crisis comms.
Computer gaming
Grassroots Advocacy
Legislative affairs
Political Campaign
Total Respondent
Averages ALL 58Total # Respondee 56 46 41 27 10 29 - 22 7 4
38% 16% 25% 20% 10% 13% - 16% 8% 16%
Less Than $3 Million 38Total # Respondee 37 28 26 15 3 15 - 15 4 4
40% 18% 21% 21% 10% 13% - 18% 11% 16%
More Than $3 Million 20Total # Respondee 19 18 15 12 7 14 - 7 3 -
34% 14% 31% 18% 10% 12% - 12% 4% -
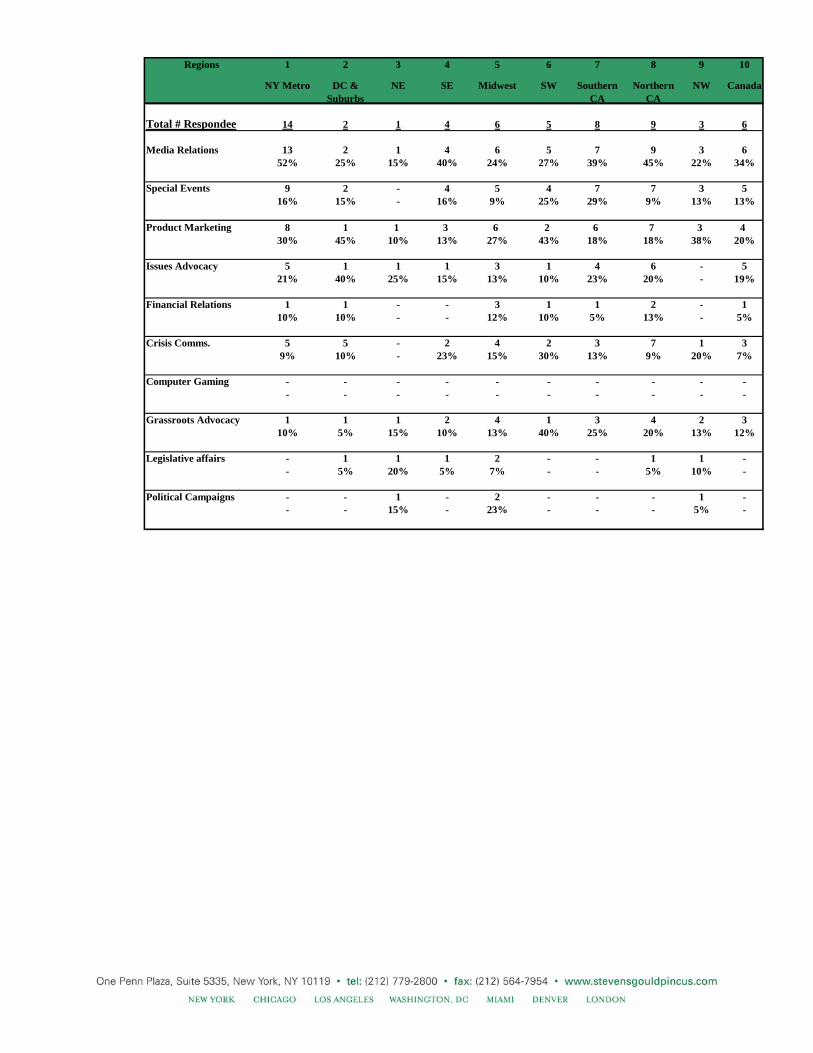
Regions 1 2 3 4 5 6 7 8 9 10
NY Metro DC & Suburbs
NE SE Midwest SW Southern CA
Northern CA
NW Canada
Total # Respondee 14 2 1 4 6 5 8 9 3 6
Media Relations 13 2 1 4 6 5 7 9 3 652% 25% 15% 40% 24% 27% 39% 45% 22% 34%
Special Events 9 2 - 4 5 4 7 7 3 516% 15% - 16% 9% 25% 29% 9% 13% 13%
Product Marketing 8 1 1 3 6 2 6 7 3 430% 45% 10% 13% 27% 43% 18% 18% 38% 20%
Issues Advocacy 5 1 1 1 3 1 4 6 - 521% 40% 25% 15% 13% 10% 23% 20% - 19%
Financial Relations 1 1 - - 3 1 1 2 - 110% 10% - - 12% 10% 5% 13% - 5%
Crisis Comms. 5 5 - 2 4 2 3 7 1 39% 10% - 23% 15% 30% 13% 9% 20% 7%
Computer Gaming - - - - - - - - - -- - - - - - - - - -
Grassroots Advocacy 1 1 1 2 4 1 3 4 2 310% 5% 15% 10% 13% 40% 25% 20% 13% 12%
Legislative affairs - 1 1 1 2 - - 1 1 -- 5% 20% 5% 7% - - 5% 10% -
Political Campaigns - - 1 - 2 - - - 1 -- - 15% - 23% - - - 5% -
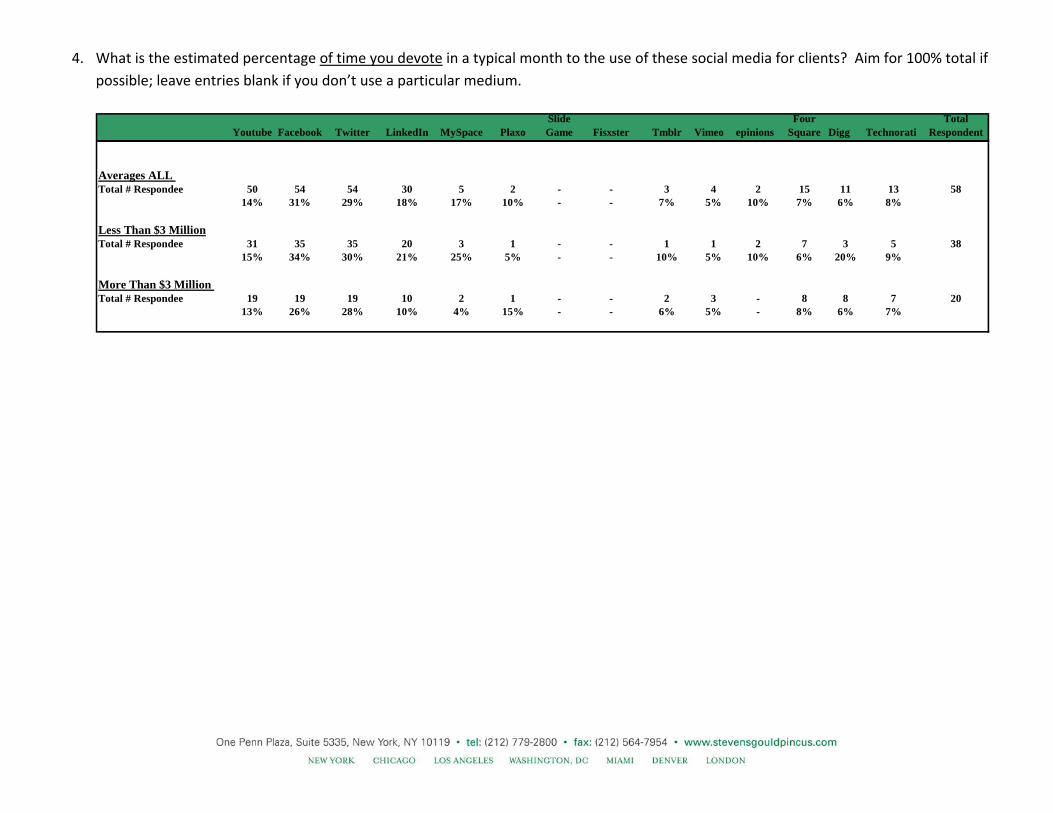
4. What is the estimated percentage of time you devote in a typical month to the use of these social media for clients? Aim for 100% total if possible; leave entries blank if you don’t use a particular medium.
Youtube Facebook Twitter LinkedIn MySpace Plaxo Slide Game Fisxster Tmblr Vimeo epinions
Four Square Digg Technorati
Total Respondent
Averages ALL Total # Respondee 50 54 54 30 5 2 - - 3 4 2 15 11 13 58
14% 31% 29% 18% 17% 10% - - 7% 5% 10% 7% 6% 8%
Less Than $3 MillionTotal # Respondee 31 35 35 20 3 1 - - 1 1 2 7 3 5 38
15% 34% 30% 21% 25% 5% - - 10% 5% 10% 6% 20% 9%
More Than $3 Million Total # Respondee 19 19 19 10 2 1 - - 2 3 - 8 8 7 20
13% 26% 28% 10% 4% 15% - - 6% 5% - 8% 6% 7%
Regions 1 2 3 4 5 6 7 8 9 10
NY Metro DC & Suburbs
NE SE Midwest SW Southern CA
Northern CA
NW Canada
Total # Respondee 14 2 1 4 6 5 8 8 9 6
Media Relations 13 2 1 4 6 5 7 9 3 652% 50% 15% 40% 24% 27% 39% 45% 22% 34%
Special Events 9 2 - 4 5 4 7 7 3 516% 15% - 16% 9% 25% 29% 9% 13% 13%
Product Marketing 8 1 1 3 6 2 6 7 3 430% 45% 10% 13% 27% 43% 18% 18% 38% 20%
Issues Advocacy 5 1 1 1 3 1 4 6 - 521% 40% 25% 15% 13% 10% 23% 20% - 19%
Financial Relations 1 1 - - 3 1 1 2 - 110% 10% - - 12% 10% 5% 13% - 5%
Crisis Comms. 5 5 - 2 4 2 3 7 1 39% 10% - 23% 15% 30% 13% 9% 20% 7%
Computer Gaming - - - - - - - - - -- - - - - - - - - -
Grassroots Advocacy 1 1 1 2 4 1 3 4 2 310% 5% 15% 10% 13% 40% 25% 20% 13% 12%
Legislative affairs - 1 1 1 2 - - 1 1 -- 5% 20% 5% 7% - - 5% 10% -
Political Campaigns - - 1 - 2 - - - 1 -- - 15% - 23% - - - 5% -
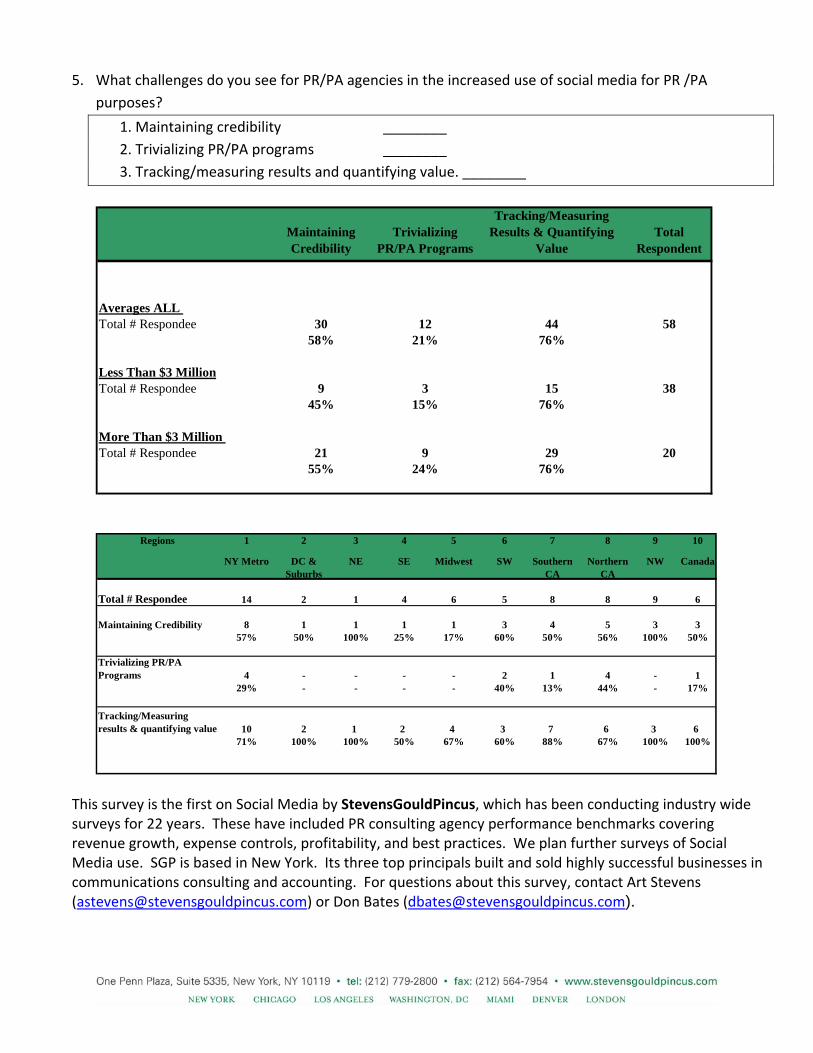
5. What challenges do you see for PR/PA agencies in the increased use of social media for PR /PA
purposes?
1. Maintaining credibility ________ 2. Trivializing PR/PA programs ________ 3. Tracking/measuring results and quantifying value. ________
Maintaining Credibility
Trivializing PR/PA Programs
Tracking/Measuring Results & Quantifying
ValueTotal
Respondent
Averages ALL Total # Respondee 30 12 44 58
58% 21% 76%
Less Than $3 MillionTotal # Respondee 9 3 15 38
45% 15% 76%
More Than $3 Million Total # Respondee 21 9 29 20
55% 24% 76%
Regions 1 2 3 4 5 6 7 8 9 10
NY Metro DC & Suburbs
NE SE Midwest SW Southern CA
Northern CA
NW Canada
Total # Respondee 14 2 1 4 6 5 8 8 9 6
Maintaining Credibility 8 1 1 1 1 3 4 5 3 357% 50% 100% 25% 17% 60% 50% 56% 100% 50%
Trivializing PR/PA Programs 4 - - - - 2 1 4 - 1
29% - - - - 40% 13% 44% - 17%
Tracking/Measuring results & quantifying value 10 2 1 2 4 3 7 6 3 6
71% 100% 100% 50% 67% 60% 88% 67% 100% 100%
This survey is the first on Social Media by StevensGouldPincus, which has been conducting industry wide surveys for 22 years. These have included PR consulting agency performance benchmarks covering revenue growth, expense controls, profitability, and best practices. We plan further surveys of Social Media use. SGP is based in New York. Its three top principals built and sold highly successful businesses in communications consulting and accounting. For questions about this survey, contact Art Stevens ([email protected]) or Don Bates ([email protected]).