social inequalities in self-rated health by age: cross-sectional study of 22 457 middle-aged men and...
TRANSCRIPT

BioMed CentralBMC Public Health
ss
Open AcceResearch articleSocial inequalities in self-rated health by age: Cross-sectional study of 22 457 middle-aged men and womenEmily McFadden*1, Robert Luben1, Sheila Bingham1,2, Nicholas Wareham1, Ann-Louise Kinmonth1 and Kay-Tee Khaw1Address: 1Institute of Public Health, University of Cambridge, UK and 2MRC Dunn Nutrition Unit, Cambridge, UK
Email: Emily McFadden* - [email protected]; Robert Luben - [email protected]; Sheila Bingham - [email protected]; Nicholas Wareham - [email protected]; Ann-Louise Kinmonth - [email protected]; Kay-Tee Khaw - [email protected]
* Corresponding author
AbstractBackground: We investigate the association between occupational social class and self-ratedhealth (SRH) at different ages in men and women.
Methods: Cross sectional population study of 22 457 men and women aged 39–79 years living inthe general community in Norfolk, United Kingdom, recruited using general practice age-sexregisters in 1993–1997. The relationship between self-rated health and social class was examinedusing logistic regression, with a poor or moderate rating as the outcome.
Results: The prevalence of poor or moderate (lower) self-rated health increased with increasingage in both men and women. There was a strong social class gradient: in manual classes, men andwomen under 50 years of age had a prevalence of lower self-rated health similar to that seen inmen and women in non-manual social classes over 70 years old. Even after adjustment for age,educational status, and lifestyle factors (body mass index (BMI), smoking, physical activity andalcohol consumption) there was still strong evidence of a social gradient in self-rated health, withunskilled men and women approximately twice as likely to report lower self-rated health asprofessionals (ORmen = 2.44 (95%CI 1.69, 3.50); ORwomen = 1.97 (95%CI 1.45, 2.68).
Conclusion: There was a strong gradient of decreased SRH with age in both men and women.We found a strong cross-sectional association between SRH and social class, which wasindependent of education and major health related behaviors. The social class differential in SRHwas similar with age. Prospective studies to confirm this association should explore social andemotional as well as physical pathways to inequalities in self reported health.
BackgroundSelf-rated health (SRH) refers to a single item health meas-ure that asks individuals to rate their health as excellent,good, moderate or poor. SRH is generally considered to bea valuable source of data on subjective health status, and
is popular due to its simplicity to collect. It declines withage and has strong associations with all-cause mortalitythat are not explained by existing disease. [1-3] Previousstudies have reported a social class gradient in SRH buthave not explored in detail the magnitude of this differ-
Published: 8 July 2008
BMC Public Health 2008, 8:230 doi:10.1186/1471-2458-8-230
Received: 3 March 2008Accepted: 8 July 2008
This article is available from: http://www.biomedcentral.com/1471-2458/8/230
© 2008 McFadden et al; licensee BioMed Central Ltd. This is an Open Access article distributed under the terms of the Creative Commons Attribution License (http://creativecommons.org/licenses/by/2.0), which permits unrestricted use, distribution, and reproduction in any medium, provided the original work is properly cited.
Page 1 of 8(page number not for citation purposes)

BMC Public Health 2008, 8:230 http://www.biomedcentral.com/1471-2458/8/230
ence across classes nor the extent to which education orhealth related behaviours may explain such differences.We examined the association between SRH and occupa-tional social class by age and gender, and the extent towhich education and health related behaviours explainsuch relationships.
MethodsSampleThe study population is in Norfolk, United Kingdom andincludes the city of Norwich as well as surrounding smalltowns and rural areas. The cohort was recruited from gen-eral practice age sex registers between 1993–1997 as partof the Norfolk component of the European ProspectiveInvestigation of Cancer (EPIC-Norfolk).[4] Detaileddescriptions of the study methodology have beenreported previously.[5] Approval for the study wasobtained from the Norfolk Local Research Ethics Com-mittee. Altogether 77 630 participants were invited, and30 445 gave informed signed consent and completed adetailed health and lifestyle questionnaire[5] Of these 25639 men and women aged 39–79 years attended a healthexamination. Because we required participants who werewilling to provide detailed information and participate ina long-term follow-up study, we only had a populationresponse rate of about 45%, so participants were not arandom population sample. Nevertheless, they were com-parable to national samples with respect to many charac-teristics, but with a slightly lower prevalence of smokers.
MeasuresIn the health and lifestyle questionnaire, participants wereasked to assess their general health using the question "Ingeneral, would you say your health is?" with responseoptions of "excellent, good, moderate or poor".[1]
Social class was classified according to the Registrar Gen-eral's occupation based classification scheme across sixcategories.[6,7] Social class I consists of professionals,class II includes managerial and technical occupations,class III is subdivided into non-manual and manualskilled workers (III nm and III m), class IV consists ofpartly skilled workers, and class V comprises unskilledmanual workers (the detailed classification is describedelsewhere.[7]). For men, social class was coded using theirown occupation except when they were unemployed inwhich case their partner's social class was used. Unem-ployed men without partners were unclassified. Lastemployment was used for men who were retired. Socialclass in women was based on their partner's except whenthe partner's social class was unclassified, missing, or theyhad no partner in which case social class was based ontheir own occupation. An unemployed woman without apartner was coded as unclassified.
Personal medical history was assessed using the questionin the Health and Lifestyle Questionnaire, "Has the doctorever told you that you have any of the following?" fol-lowed by a checklist of diseases including myocardial inf-arction, stroke, cancer and diabetes mellitus. Yes/noresponses to the questions "Have you ever smoked asmuch as one cigarette a day for as long as a year?" and "Doyou smoke cigarettes now?" were used to derive smokinghistory.[8,9] Alcohol consumption was derived from afood frequency questionnaire (FFQ) collected at the base-line clinic visit. The EPIC-FFQ comprised of a list of 130foods. Under the "drinks" category, nine responses rang-ing from never to more than six times per day were givenfor four types of alcoholic drink: half pint of beer, lager orcider, a glass of wine, single unit of spirits (whisky, gin,brandy, vodka, etc.) and a glass of sherry, port, vermouthor liqueurs. Participants were asked to tick each categorybased on their average alcohol consumption in the previ-ous year. Average alcohol consumption in units/week wascalculated.[10,11] For the purpose of this study smokingstatus was re-categorised as current smokers and ex-/non-smokers, and alcohol consumption was grouped as non-drinkers, people who drink 1–13.9 units/week, andpeople who consume ≥ 14 units/week.
Height and weight were measured by trained nurses withparticipants dressed in light clothing and with their shoesremoved.[12] A stadiometer was used to measure heightto the nearest 0.1 cm. Salter scales were used to measureweight to the nearest 100 g. Body mass index (BMI) wasthen calculated as weight (kg)/height2 (m2). Body massindex was used as a proxy for poor diet.
Educational status was based on the highest qualificationattained and was categorised into four groups: degree orequivalent, A-level or equivalent, O-level or equivalent,and less than O-level or no qualifications. O-level indi-cates educational attainment to the equivalent of comple-tion of schooling to the age of 15 years and A-levelindicates educational attainment to the equivalent ofcompletion of schooling to the age of 17 years. This wasregrouped into two groups: those who finished school (Olevels or more), and those who did not (less than O levelor no qualifications).
Habitual physical activity was assessed using two ques-tions referring to activity during the past year. The firstquestion asked about usual physical activity at work, clas-sified as four categories: sedentary, standing (e.g. hair-dresser, guard), physical work (e.g. plumber, nurse) andheavy manual work (e.g. construction worker). The sec-ond question asked about the amount of time spent inhours per week in winter and summer in other physicalactivity. A simple index allocated individuals to fourordered categories: inactive (sedentary job and no recrea-
Page 2 of 8(page number not for citation purposes)

BMC Public Health 2008, 8:230 http://www.biomedcentral.com/1471-2458/8/230
tional activity); moderately inactive (sedentary job with <0.5 hours recreational activity per day, or standing jobwith no recreational activity); moderately active (seden-tary job with 0.5–1 hour recreational activity per day orstanding job with < 0.5 hours recreational activity per dayor physical job with no recreational activity); and active(sedentary job with > 1 hour recreational activity per dayor standing job with > 1 hour recreational activity per dayor physical job with at least some recreational activity orheavy manual job). This index was validated against heartrate monitoring with individual calibration in independ-ent studies. [13-15] We have also previously reported thatthis four point index is inversely related to all cause mor-tality and cardiovascular disease incidence in the EPIC-Norfolk population in men and women across a wide ageand social class range.[16]
Statistical analysisDescriptive statistics including means and percentages areused to show the characteristics of the study sample. Twosample t-tests were used to compare differences in meanvalues. The assumption of equal variances was verified.Differences in percentages were compared using χ2-tests.Analysis of variance was used to obtain mean values ofeach descriptive variable for each category of SRH. Differ-ences in mean total values across the groups were evalu-ated using F-tests.
The proportion of men and women with a poor or mod-erate SRH was examined stratified by age group and socialclass. The relationship between self-rated health andsocial class was examined using logistic regression, with apoor or moderate rating as the outcome. We then exam-ined odds ratios for poor or moderate health after adjust-ing for age and covariates BMI, smoking physical activityand alcohol consumption and educational status.
All statistical analyses will be performed separately formen and women using Stata version 8.0.
ResultsOf the 25 639 participants who attended the health check,28 participants who were admitted to hospital for cardio-vascular disease or cancer between agreeing to participateand attending the health check were excluded. A further2422 participants who reported prevalent heart attack,stroke, and cancer at baseline; 261 with incomplete dataon self-rated health; and 482 with no details of their lastoccupation were also excluded, leaving a total of 22 457men and women in the current analyses.
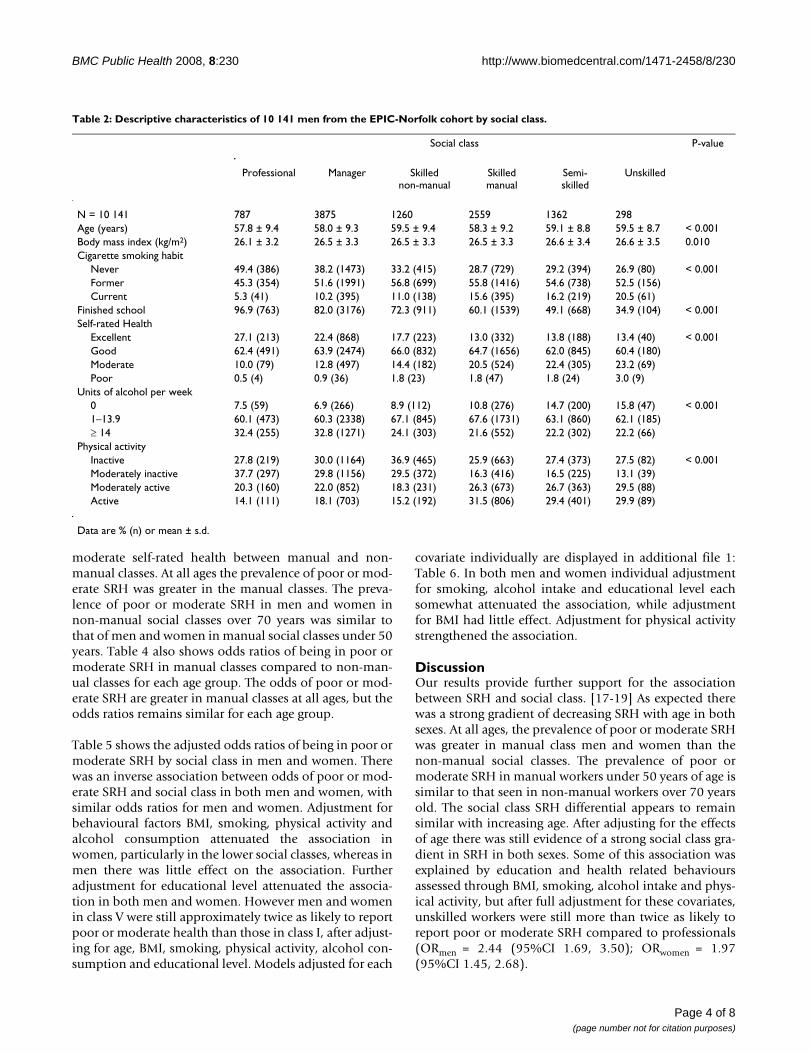
Table 1 shows the sex-specific distribution of variables.Tables 2 and 3 show the descriptive characteristics of thecohort by social class in men and women respectively.Similar patterns were seen in both sexes for most varia-
bles. Mean age, BMI, and the proportion of current smok-ers all increased with decreasing social class fromprofessional to unskilled. The proportion who finishedschool decreased with decreasing social class. The propor-tion of both men and women who did not drink alcoholat all increased with decreasing social class, while the pro-portion drinking over 14 units a week decreased withdecreasing social class. The proportion of active and mod-erately active men increased with decreasing social class.More non-manual class men were moderately inactivecompared to manual. The proportion of inactive womenwas greater in the manual classes while the proportion ofmoderately inactive was greater in the non-manualclasses. A similar proportion of each class was classed asactive.
Table 4 shows that the prevalence of poor or moderateSRH increased with age in a similar manner in both menand women. The age gradient was similar in men andwomen with manual and non-manual occupations, how-ever there was a large difference in prevalence of poor or
Table 1: Descriptive characteristics of the EPIC-Norfolk cohort by sex measured at baseline from 1993–1997.
Variable Variable distribution
Men Women
N 10141 12316Age (years) 58.4 ± 9.2 57.9 ± 9.2Body Mass Index (kg/m2) 26.5 ± 3.3 26.2 ± 4.3Cigarette smoking habit
Never 34.5 (3477) 56.8 (6931)Former 53.1 (5354) 31.9 (3891)Current 12.4 (1249) 11.4 (1389)
Social ClassI Professional 7.8 (787) 6.5 (795)II Manager 38.2 (3875) 35.2 (4329)III nm Skilled non-manual 12.4 (1260) 19.6 (2419)III m Skilled manual 25.2 (2559) 21.4 (2634)IV Semi-skilled 13.4 (1362) 13.4 (1652)V Unskilled 2.9 (298) 4.0 (487)Finished school 70.6 (7161) 53.6 (6599)Self rate health
Excellent 18.4 (1864) 16.1 (1983)Good 63.9 (6478) 64.9 (7990)Moderate 16.3 (1656) 17.6 (2166)Poor 1.4 (143) 1.4 (177)
Units of alcohol per week0 9.5 (960) 16.8 (20741–13.9 63.4 (6432) 75.3 (9270)≥ 14 27.1 (2749) 7.9 (972)
ExerciseInactive 29.3 (2966) 28.8 (3543)Moderately inactive 24.7 (2505) 32.6 (4009)Moderately active 23.3 (2367) 22.7 (2799)Active 22.7 (2302) 16.0 (1965)
(Data are % (n) or mean ± s.d.)
Page 3 of 8(page number not for citation purposes)
BMC Public Health 2008, 8:230 http://www.biomedcentral.com/1471-2458/8/230
moderate self-rated health between manual and non-manual classes. At all ages the prevalence of poor or mod-erate SRH was greater in the manual classes. The preva-lence of poor or moderate SRH in men and women innon-manual social classes over 70 years was similar tothat of men and women in manual social classes under 50years. Table 4 also shows odds ratios of being in poor ormoderate SRH in manual classes compared to non-man-ual classes for each age group. The odds of poor or mod-erate SRH are greater in manual classes at all ages, but theodds ratios remains similar for each age group.
Table 5 shows the adjusted odds ratios of being in poor ormoderate SRH by social class in men and women. Therewas an inverse association between odds of poor or mod-erate SRH and social class in both men and women, withsimilar odds ratios for men and women. Adjustment forbehavioural factors BMI, smoking, physical activity andalcohol consumption attenuated the association inwomen, particularly in the lower social classes, whereas inmen there was little effect on the association. Furtheradjustment for educational level attenuated the associa-tion in both men and women. However men and womenin class V were still approximately twice as likely to reportpoor or moderate health than those in class I, after adjust-ing for age, BMI, smoking, physical activity, alcohol con-sumption and educational level. Models adjusted for each
covariate individually are displayed in additional file 1:Table 6. In both men and women individual adjustmentfor smoking, alcohol intake and educational level eachsomewhat attenuated the association, while adjustmentfor BMI had little effect. Adjustment for physical activitystrengthened the association.
DiscussionOur results provide further support for the associationbetween SRH and social class. [17-19] As expected therewas a strong gradient of decreasing SRH with age in bothsexes. At all ages, the prevalence of poor or moderate SRHwas greater in manual class men and women than thenon-manual social classes. The prevalence of poor ormoderate SRH in manual workers under 50 years of age issimilar to that seen in non-manual workers over 70 yearsold. The social class SRH differential appears to remainsimilar with increasing age. After adjusting for the effectsof age there was still evidence of a strong social class gra-dient in SRH in both sexes. Some of this association wasexplained by education and health related behavioursassessed through BMI, smoking, alcohol intake and phys-ical activity, but after full adjustment for these covariates,unskilled workers were still more than twice as likely toreport poor or moderate SRH compared to professionals(ORmen = 2.44 (95%CI 1.69, 3.50); ORwomen = 1.97(95%CI 1.45, 2.68).
Table 2: Descriptive characteristics of 10 141 men from the EPIC-Norfolk cohort by social class.
Social class P-value
Professional Manager Skilled non-manual
Skilled manual
Semi-skilled
Unskilled
N = 10 141 787 3875 1260 2559 1362 298Age (years) 57.8 ± 9.4 58.0 ± 9.3 59.5 ± 9.4 58.3 ± 9.2 59.1 ± 8.8 59.5 ± 8.7 < 0.001Body mass index (kg/m2) 26.1 ± 3.2 26.5 ± 3.3 26.5 ± 3.3 26.5 ± 3.3 26.6 ± 3.4 26.6 ± 3.5 0.010Cigarette smoking habit
Never 49.4 (386) 38.2 (1473) 33.2 (415) 28.7 (729) 29.2 (394) 26.9 (80) < 0.001Former 45.3 (354) 51.6 (1991) 56.8 (699) 55.8 (1416) 54.6 (738) 52.5 (156)Current 5.3 (41) 10.2 (395) 11.0 (138) 15.6 (395) 16.2 (219) 20.5 (61)
Finished school 96.9 (763) 82.0 (3176) 72.3 (911) 60.1 (1539) 49.1 (668) 34.9 (104) < 0.001Self-rated Health
Excellent 27.1 (213) 22.4 (868) 17.7 (223) 13.0 (332) 13.8 (188) 13.4 (40) < 0.001Good 62.4 (491) 63.9 (2474) 66.0 (832) 64.7 (1656) 62.0 (845) 60.4 (180)Moderate 10.0 (79) 12.8 (497) 14.4 (182) 20.5 (524) 22.4 (305) 23.2 (69)Poor 0.5 (4) 0.9 (36) 1.8 (23) 1.8 (47) 1.8 (24) 3.0 (9)
Units of alcohol per week0 7.5 (59) 6.9 (266) 8.9 (112) 10.8 (276) 14.7 (200) 15.8 (47) < 0.0011–13.9 60.1 (473) 60.3 (2338) 67.1 (845) 67.6 (1731) 63.1 (860) 62.1 (185)≥ 14 32.4 (255) 32.8 (1271) 24.1 (303) 21.6 (552) 22.2 (302) 22.2 (66)
Physical activityInactive 27.8 (219) 30.0 (1164) 36.9 (465) 25.9 (663) 27.4 (373) 27.5 (82) < 0.001Moderately inactive 37.7 (297) 29.8 (1156) 29.5 (372) 16.3 (416) 16.5 (225) 13.1 (39)Moderately active 20.3 (160) 22.0 (852) 18.3 (231) 26.3 (673) 26.7 (363) 29.5 (88)Active 14.1 (111) 18.1 (703) 15.2 (192) 31.5 (806) 29.4 (401) 29.9 (89)
Data are % (n) or mean ± s.d.
Page 4 of 8(page number not for citation purposes)

BMC Public Health 2008, 8:230 http://www.biomedcentral.com/1471-2458/8/230
Thus in this population of middle-aged men and women,there is a large social class differential in SRH. It is unlikelythat variations in self-rated health can have led to the gra-dient in social class, although people with poor health dodrift down the social class gradient. It is more likely thatcharacteristics related to poor social circumstances affectpeople's perceptions of their health. This could representa gradient in physical or emotional health, or could repre-sent different social experiences related to perception ofhealth in different social classes.
SRH is generally considered to be a valuable source of dataon health status, popular due to its simplicity to collectand its strong association with future mortality.[1-3,20]The social class gradient for chronic diseases such as cardi-ovascular disease is well recognised. [21-27] Differencesin SRH might therefore reflect difference in prevalent dis-ease. Although in this study we excluded individuals whohad known serious chronic diseases such as cardiovascu-lar disease and cancer, it is possible that respondents weretaking a range of other illnesses into account.
In any single index self-reported measure of healthresponse styles and reference points against which healthis judged may vary between respondents. [28-31] Individ-uals in different social classes with similar physical healthstatus may thus have different reference levels and criteria
against which they judge their health. However the direc-tion of such variation would arguably be in the oppositedirection to the associations shown, with people sur-rounded by others with illness likely to normalise ratherthan over report poor health, and those surrounded byaffluence being more sensitive to nuances in fitness andbehaviour. The odds ratios may thus be under estimates ofthe true association between social class and self-ratedhealth.[32]
A number of qualitative studies have examined the proc-esses through which individuals evaluate their health sta-tus.[31,33] It appears that there may be importantdifferences in people's perception of health betweensocio-economic groups. Men and women from highersocial groups appeared to use a larger number of factorswhen assessing their health, including aspects such asbeing fit and active and the absence of illness, as well asaspects of well-being such as happiness and feeling in con-trol.[31] In this population the social gradient in SRH wasstill present after adjustment for health related behavioursBMI, smoking, alcohol intake and physical activity, all ofwhich may be related to SRH.
Self-rated health appears to be strongly patterned by socialoccupational class. Prospective studies are needed to con-firm that the association seen in cross sectional studies is
Table 3: Descriptive characteristics of 12 316 women from the EPIC-Norfolk cohort by social class.
Social class P-value
Professional Manager Skillednon-manual
Skilled manual
Semi-skilled
Unskilled
N = 12 316 795 4329 2419 2634 1652 487Age (years) 56.6 ± 9.1 57.1 ± 9.3 59.7 ± 9.4 57.1 ± 8.9 58.4 ± 8.9 59.6 ± 9.1 < 0.001Body mass index (kg/m2) 25.4 ± 4.3 25.8 ± 4.1 26.0 ± 4.2 26.5 ± 4.4 26.8 ± 4.6 27.5 ± 5.1 < 0.001Cigarette smoking habit
Never 63.4 (500) 57.4 (2462) 56.0 (1350) 55.9 (1459) 54.4 (887) 56.9 (273) < 0.001Former 29.0 (229) 32.6 (1397) 32.2 (776) 31.1 (813) 32.6 (532) 30.0 (144)Current 7.6 (60) 10.1 (431) 11.8 (283) 13.0 (340) 13.0 (212) 13.1 (63)
Finished school 81.8 (650) 68.4 (2959) 52.5 (1271) 40.7 (1073) 32.3 (534) 23.0 (112) < 0.001Self-rated Health
Excellent 21.9 (174) 19.5 (842) 15.8 (381) 13.6 (357 11.1 (183) 9.5 (46) < 0.001Good 66.2 (526) 65.0 (2817) 65.3 (1580) 65.4 (1722) 63.7 (1052) 60.2 (293)Moderate 108 (86) 14.3 (620) 17.8 (431) 19.4 (512) 23.2 (384) 27.3 (133)Poor 1.1 (9) 1.2 (50) 1.1 (27) 1.6 (43) 2.0 (33) 3.1 (15)
Units of alcohol per week0 8.8 (70) 12.4 (537) 16.6 (401) 20.1 (529) 23.4 (387) 30.8 (150) < 0.0011–13.9 76.6 (609) 76.4 (3307) 76.8 (1858) 75.0 (1976) 72.3 (1194) 66.9 (326)≥ 14 14.6 (116) 11.2 (485) 6.6 (160) 4.9 (129) 4.3 (71) 2.3 (11)
Physical activityInactive 19.4 (154) 25.6 (1108) 34.6 (836) 28.8 (758) 31.3 (517) 34.9 (170) < 0.001Moderately inactive 35.5 (282) 34.0 (1471) 34.4 (831) 31.5 (829) 29.4 (485) 22.8 (111)Moderately active 28.8 (229) 24.3 (1050) 19.2 (464) 22.7 (598) 20.8 (343) 23.6 (115)Active 16.4 (130) 16.2 (700) 11.9 (288) 17.1 (449) 18.6 (307) 18.7 (91)
Data are % (n) or mean ± s.d.
Page 5 of 8(page number not for citation purposes)

BMC Public Health 2008, 8:230 http://www.biomedcentral.com/1471-2458/8/230
causal and to assess the contribution of SRH to the mor-tality differentials seen across social classes. These studiesshould explore social and emotional, as well as diseasepathways to social inequalities in self-rated health.
Strengths and limitationsThis study has a number of limitations. The cross-sec-tional design limits conclusions on causality. While wewere able to examine how far educational level and healthrelated behaviours might account for some of the socio-economic differential in SRH, we did not examine theroles of all potential factors, including a range of mentaland physical illnesses, and social context, which mightexplain some of the difference. Individuals with majormedical conditions that could potentially have con-founded the relationship between SRH and social classwere however excluded from the analyses.
Occupation details and self-rated health were bothobtained at the baseline survey between 1993–1997.Some degree of inaccuracy in reporting or recording thisinformation is inevitable, however it seems likely thatmisclassifications would be random, and random meas-urement error is likely only to attenuate any relationships,not produce spurious relationships. Some controversyexists over whether a woman's social class should be
graded using her own occupation or that of her hus-band.[16,34-36] Arguments for grading according to awoman's own occupation are that the standard of living inthe household may be influenced by a woman's earnings,or her job may expose her to health hazards.[37] How-ever, no clear difference between the two measures hasbeen shown in women aged > 60, and a stronger associa-tion was seen with husband's social class in women aged20–59 years.[16,34,38] Thus husband's social class wasconsidered an appropriate classification in this cohort.
Selection bias is unlikely to explain the observed associa-tion between social class and self-rated health within thepopulation since it is unlikely that there was a differentialresponse in that people in manual social classes with goodhealth were less likely to participate or vice versa. Thestudy population comprises of participants willing tocomplete detailed questionnaires and attend healthchecks. Nevertheless there was a wide range of social classin this cohort with a distribution similar to the nationaldistribution.[6,39] and the cohort is similar to the generalresident population in England in terms of anthropomet-ric variables, serum lipids and blood pressure[5] and ofphysical and mental functional health,[40] althoughthere were fewer current smokers. Excluding those withunclassified or missing data for SES or SRH could cause
Table 4: Prevalence and odds ratios of poor or moderate self-rated health by age group and social class in 10 141 men and 12 316 women from the EPIC-Norfolk cohort
Age group(years)
Proportion of poor or moderate self-rated health by social class, % (N)
Odds ratio#
MenN=10 141
Non-manual *N=5922
Manual * N=4219
< 50 12 (157) 20 (170) 1.96 (1.55, 2.49)50–54.9 14 (132) 21 (158) 1.72 (1.34, 2.22)55–59.9 12 (107) 22 (154) 2.19 (1.67, 2.87)60–64.9 15 (135) 27 (183) 2.00 (1.56, 2.57)65–69.9 15 (136) 21 (136) 1.45 (1.12, 1.88)≥ 70 17 (154) 29 (177) 1.97 (1.54, 2.52)
Total 14 (821) 23 (978) 1.87 (1.69, 2.08)
WomenN=12 316
Non-manual * N=7543
Manual * N=4773
< 50 13 (235) 20 (216) 1.74 (1.42, 2.13)50–54.9 15 (197) 21 (191) 1.49 (1.19, 1.86)55–59.9 17 (186) 25 (196) 1.64 (1.31, 2.06)60–64.9 17 (186) 22 (157) 1.37 (1.08, 1.74)65–69.9 18 (198) 25 (169) 1.55 (1.23, 1.95)≥ 70 21 (221) 31 (191) 1.74 (1.39, 2.19)
Total 16 (1223) 24 (1120) 1.58 (1.45, 1.73)
* chi squared test between manual and non-manual classes, P < 0.001# Odds ratio for poor or moderate self-rated health in manual classes compared to the baseline non-manual classes.
Page 6 of 8(page number not for citation purposes)

BMC Public Health 2008, 8:230 http://www.biomedcentral.com/1471-2458/8/230
bias, but only if these people differed from those includedin the study with respect to the relation between SES andSRH, which seems unlikely.
ConclusionIn conclusion, our results show a marked social gradientin self-rated health, with the prevalence of poor or moder-ate health in men and women in manual social classesunder 50 years of age similar to that seen in non-manualmen and women over 70 years old. Even after adjustmentfor age, education and health related behaviours, therewas still strong evidence of a social gradient, with menand women in unskilled occupations approximately twiceas likely to report poor or moderate subjective health asthose in professional occupation.
Competing interestsThe authors declare that they have no competing interests.
Authors' contributionsKTK, SB, and NW are principal investigators in the EPIC-Norfolk population study. SB is responsible for the dietarymeasurements and analyses. RL is responsible for datamanagement and computing and data linkages for postcoding. ALK is principal investigator on self-rated healthand well being NIHR National School of Primary CareResearch. EM conducted the data analyses and wrote thepaper with KTK with contributions from other co-authors.
Additional material
AcknowledgementsWe thank the participants and general practitioners who took part in the study and the staff of EPIC-Norfolk.
References1. Idler EL, Benyamini Y: Self-rated health and mortality: a review
of twenty-seven community studies. J Health Soc Behav 1997,38(1):21-37.
2. DeSalvo KB, Bloser N, Reynolds K, He J, Muntner P: Mortality pre-diction with a single general self-rated health question. Ameta-analysis. Journal of General Internal Medicine 2006,21(3):267-275.
3. Singh-Manoux A, Dugravot A, Shipley MJ, Ferrie JE, Martikainen P,Goldberg M, Zins M: The association between self-rated healthand mortality in different socioeconomic groups in theGAZEL cohort study. Int J Epidemiol 2007, 36(6):1222-1228.
4. Riboli E, Kaaks R: The EPIC Project: rationale and study design.European Prospective Investigation into Cancer and Nutri-tion. Int J Epidemiol 1997, 26(Supplement 1):S6-14.
5. Day N, Oakes S, Luben R, Khaw KT, Bingham S, Welch A, WarehamN: EPIC-Norfolk: study design and characteristics of thecohort. European Prospective Investigation of Cancer. Br JCancer 1999, 80(Suppl 1):95-103.
6. Shohaimi S, Luben R, Wareham N, Day N, Bingham S, Welch A,Oakes S, Khaw K-T: Residential area deprivation predictssmoking habit independently of individual educational leveland occupational social class. A cross sectional study in theNorfolk cohort of the European Investigation into Cancer(EPIC-Norfolk). J Epidemiol Community Health 2003,57(4):270-276.
7. Elias P, Halstead K, Prandy K: CASOC: Computer-AssistedStandard Occupational Coding. London: HMSO; 1993.
8. Smith MR, Kinmonth A-L, Luben RN, Bingham S, Day NE, WarehamNJ, Welch A, Khaw K-T: Smoking status and differential whitecell count in men and women in the EPIC-Norfolk popula-tion. Atherosclerosis 2003, 169(2):331-337.
9. Sargeant L, Wareham N, Bingham S, Day N, Luben R, Oakes S, WelchA, Khaw K: Vitamin C and hyperglycemia in the EuropeanProspective Investigation into Cancer–Norfolk (EPIC-Nor-folk) study: a population-based study. Diabetes Care 2000,23(6):726-732.
10. Welch AA, Luben R, Khaw KT, Bingham SA: The CAFE computerprogram for nutritional analysis of the EPIC-Norfolk foodfrequency questionnaire and identification of extreme nutri-ent values. Journal of Human Nutrition and Dietetics 2005,18(2):99-116.
Additional file 1
Click here for file[http://www.biomedcentral.com/content/supplementary/1471-2458-8-230-S1.doc]
Table 5: Adjusted odds ratios of being in poor or moderate self-rated health by social class in 10 141 men and 12 316 women from the EPIC-Norfolk cohort
Odds ratio (95% CI)
Social class MenN=10 141
WomenN=12 316
Model 1I Professional 1.0 1.0II Manager 1.35 (1.06, 1.73) 1.34 (1.06, 1.69)III nm Skilled non-manual 1.61 (1.23, 2.12) 1.63 (1.28, 2.07)III m Skilled manual 2.43 (1.90, 3.10) 1.96 (1.55, 2.47)IV Semi-skilled 2.66 (2.05, 3.45) 2.42 (1.90, 3.08)V Unskilled 2.94 (2.09, 4.15) 3.07 (2.30, 4.09)
Model 2I Professional 1.0 1.0II Manager 1.31 (1.02, 1.69) 1.24 (0.98, 1.57)III nm Skilled non-manual 1.47 (1.12, 1.94) 1.38 (1.08, 1.77)III m Skilled manual 2.49 (1.94, 3.21) 1.61 (1.27, 2.06)IV Semi-skilled 2.65 (2.03, 3.46) 1.92 (1.50, 2.47)V Unskilled 2.92 (2.05, 4.17) 2.26 (1.67, 3.05)
Model 3I Professional 1.0 1.0II Manager 1.25 (0.98, 1.61) 1.20 (0.95, 1.52)III nm Skilled non-manual 1.37 (1.03, 1.81) 1.30 (1.01, 1.66)III m Skilled manual 2.22 (1.72, 2.87) 1.46 (1.14, 1.86)IV Semi-skilled 2.30 (1.75, 3.02) 1.71 (1.32, 2.21)V Unskilled 2.44 (1.69, 3.50) 1.97 (1.45, 2.68)
Model 1 – age adjustedModel 2 – age, BMI, smoking, alcohol intake and physical activity adjustedModel 3 – age, BMI, smoking, alcohol intake, physical activity and education adjusted
Page 7 of 8(page number not for citation purposes)

BMC Public Health 2008, 8:230 http://www.biomedcentral.com/1471-2458/8/230
Publish with BioMed Central and every scientist can read your work free of charge
"BioMed Central will be the most significant development for disseminating the results of biomedical research in our lifetime."
Sir Paul Nurse, Cancer Research UK
Your research papers will be:
available free of charge to the entire biomedical community
peer reviewed and published immediately upon acceptance
cited in PubMed and archived on PubMed Central
yours — you keep the copyright
Submit your manuscript here:http://www.biomedcentral.com/info/publishing_adv.asp
BioMedcentral
11. Myint PK, Luben RN, Surtees PG, Wainwright NWJ, Welch AA, Bing-ham SA, Wareham NJ, Day NE, Khaw K-T: Respiratory functionand self-reported functional health: EPIC-Norfolk popula-tion study. Eur Respir J 2005, 26(3):494-502.
12. Sargeant LA, Khaw K-T, Bingham S, Day NE, Luben RN, Oakes S,Welch A, Wareham NJ: Cigarette smoking and glycaemia: theEPIC-Norfolk Study. Int J Epidemiol 2001, 30(3):547-554.
13. Pocock SJ, Shaper AG, Cook DG, Phillips AN, Walker M: Socialclass differences in ischaemic heart disease in British men.Lancet 1987, 2(8552):197-201.
14. Arber S, Ginn J: Gender and inequalities in health in later life.Soc Sci Med 1993, 36(1):33-46.
15. Arber S, Lahelma E: Inequalities in women's and men's ill-health: Britain and Finland compared. Soc Sci Med 1993,37(8):1055-1068.
16. Martikainen P, Kauppinen TM, Valkonen T: Effects of the charac-teristics of neighbourhoods and the characteristics of peopleon cause specific mortality: a register based follow up studyof 252 000 men. J Epidemiol Community Health 2003, 57(3):210-217.
17. Power C, Matthews S, Manor O: Inequalities in self-rated health:explanations from different stages of life. Lancet 1998,351(9108):1009-1013.
18. Kunst AE, Bos V, Lahelma E, Bartley M, Lissau I, Regidor E, Mielck A,Cardano M, Dalstra JA, Geurts JJ, Helmert U, Lennartsson C, RammJ, Spadea T, Stronegger WJ, Mackenbach JP: Trends in socioeco-nomic inequalities in self-assessed health in 10 Europeancountries. Int J Epidemiol 2005, 34(2):295-305.
19. Huisman M, Kunst AE, Mackenbach JP: Socioeconomic inequali-ties in morbidity among the elderly; a European overview.Soc Sci Med 2003, 57(5):861-873.
20. Singh-Manoux A, Martikainen P, Ferrie J, Zins M, Marmot M, Gold-berg M: What does self rated health measure? Results fromthe British Whitehall II and French Gazel cohort studies. JEpidemiol Community Health 2006, 60(4):364-372.
21. Marmot MG, Adelstein AM, Robinson N, Rose GA: Changingsocial-class distribution of heart disease. Br Med J 1978,2(6145):1109-1112.
22. Heller R, Williams H, Sittampalam Y: Social class and ischaemicheart disease: use of the male:female ratio to identify possi-ble occupational hazards. J Epidemiol Community Health 1984,38(3):198-202.
23. Emberson JR, Whincup PH, Morris RW, Walker M: Social class dif-ferences in coronary heart disease in middle-aged Britishmen: implications for prevention. Int J Epidemiol 2004,33(2):289-296.
24. Coulthard M, Chow Y, Dattani N, White C, Baker A, Johnson B:Health. In Focus on Social Inequalities Edited by: Penny Babb, JeanMartin, Haezewindt P. London: Office for National Statistics;2004:69-84.
25. Rose G, Marmot MG: Social class and coronary heart disease.Br Heart J 1981, 45(1):13-19.
26. Woodward M, Shewry MC, Cairns S, Smith W, Tunstall-Pedoe H:Social status and coronary heart disease: Results from theScottish heart health study. Preventive Medicine 1992,21(1):136-148.
27. Kaplan GA, Keil JE: Socioeconomic factors and cardiovasculardisease: a review of the literature. Circulation 1993, 88(4 Pt1):1973-1998.
28. Jürges H: Self-assessed health, reference levels, and mortality.MEA discussion paper series 2004, 04057:.
29. Jürges H: True health vs response styles: exploring cross-country differences in self-reported health. Health Economics2007, 16(2):163-178.
30. Groot W: Adaptation and scale of reference bias in self-assessments of quality of life. Journal of Health Economics 2000,19(3):403-420.
31. Krause NM, Jay GM: What do global self-rated health itemsmeasure? Med Care 1994, 32(9):930-942.
32. Macintyre S, Der G, Norrie J: Are there socioeconomic differ-ences in responses to a commonly used self report measureof chronic illness? Int J Epidemiol 2005, 34(6):1284-1290.
33. Idler EL, Hudson SV, Leventhal H: The meanings of self-ratings ofhealth: A qualitative and quantitative approach. Research onAging 1999, 21(3):458-476.
34. Arber S, Ginn J: Gender and inequalities in health in later life.Social Science & Medicine 1993, 36(1):33-46.
35. Arber S, Lahelma E: Inequalities in women's and men's ill-health: Britain and Finland compared. Social Science & Medicine1993, 37(8):1055-1068.
36. Krieger N, Chen J, Selby J: Comparing individual-based andhousehold-based measures of social class to assess class ine-qualities in women's health: a methodological study of 684US women. J Epidemiol Community Health 1999, 53(10):612-623.
37. Fein O: The influence of social class on health status: Ameri-can and British research on health inequalities. J Gen InternMed 1995, 10(10):577-586.
38. Arber S: Class, paid employment and family roles: Makingsense of structural disadvantage, gender and health status.Social Science & Medicine 1991, 32(4):425-436.
39. Wainwright NWJ, Surtees PG: Places, people, and their physicaland mental functional health. J Epidemiol Community Health 2004,58(4):333-339.
40. Surtees PG, Wainwright NW, Khaw KT: Obesity, confidant sup-port and functional health: cross-sectional evidence from theEPIC-Norfolk cohort. Int J Obes Relat Metab Disord 2004,28(6):748-758.
Pre-publication historyThe pre-publication history for this paper can be accessedhere:
http://www.biomedcentral.com/1471-2458/8/230/prepub
Page 8 of 8(page number not for citation purposes)