social contacts, dutch language proficiency and …ftp.iza.org/dp9760.pdf · social contacts, dutch...
TRANSCRIPT
Forschungsinstitut zur Zukunft der ArbeitInstitute for the Study of Labor
DI
SC
US
SI
ON
P
AP
ER
S
ER
IE
S
Social Contacts, Dutch Language Proficiency andImmigrant Economic Performance in the Netherlands:A Longitudinal Study
IZA DP No. 9760
February 2016
Barry R. ChiswickZhiling Wang

Social Contacts, Dutch Language Proficiency and Immigrant Economic
Performance in the Netherlands: A Longitudinal Study
Barry R. Chiswick George Washington University
and IZA
Zhiling Wang
Vrije Universiteit Amsterdam and Tinbergen Institute
Discussion Paper No. 9760 February 2016
IZA
P.O. Box 7240 53072 Bonn
Germany
Phone: +49-228-3894-0 Fax: +49-228-3894-180
E-mail: [email protected]
Any opinions expressed here are those of the author(s) and not those of IZA. Research published in this series may include views on policy, but the institute itself takes no institutional policy positions. The IZA research network is committed to the IZA Guiding Principles of Research Integrity. The Institute for the Study of Labor (IZA) in Bonn is a local and virtual international research center and a place of communication between science, politics and business. IZA is an independent nonprofit organization supported by Deutsche Post Foundation. The center is associated with the University of Bonn and offers a stimulating research environment through its international network, workshops and conferences, data service, project support, research visits and doctoral program. IZA engages in (i) original and internationally competitive research in all fields of labor economics, (ii) development of policy concepts, and (iii) dissemination of research results and concepts to the interested public. IZA Discussion Papers often represent preliminary work and are circulated to encourage discussion. Citation of such a paper should account for its provisional character. A revised version may be available directly from the author.
IZA Discussion Paper No. 9760 February 2016
ABSTRACT
Social Contacts, Dutch Language Proficiency and Immigrant Economic Performance in the Netherlands:
A Longitudinal Study* Using longitudinal data on immigrants in the Netherlands for the years 1991, 1994, 1998, 2002, we examined the impacts of social contacts and Dutch language proficiency on adult foreign-born men’s earnings, employment and occupational status. The main conclusions are as follows. On average, social contacts and a good mastery of the Dutch language enhance immigrants’ economic performances. The effects are stronger for immigrants with low-skill-transferability than for immigrants with high-skill-transferability, and are stronger for economic migrants than for non-economic migrants. Contact with Dutch people and Dutch organisations unambiguously enhances all aspects of immigrants’ economic performance, however, we found no evidence for the positive effect of co-ethnic contact on employment status. JEL Classification: J15, J61, Z13 Keywords: social capital, Dutch language proficiency, labour market performance,
Dutch immigrants, skill transferability Corresponding author: Zhiling Wang Faculteit der Economische Wetenschappen en Bedrijfskunde Vrije Universiteit Amsterdam De Boelelaan 1105 1081 HV Amsterdam The Netherlands E-mail: [email protected]
* This paper has benefitted greatly from comments and suggestions made by Thomas de Graaff, Peter Nijkamp and participants at the 55th ERSA conference, Lisbon.

1 Introduction
Turks, Moroccans, Surinamese and Antilleans are the four largest immigrant ethnic
minority groups in the Netherlands, and they earn around 20 % less than the natives in
the Dutch labour market, ceteris paribus (Van Ours and Veenman, 1999). The Turks
and Moroccans were responsive to the ‘guest workers’ program by the Dutch government,
and migrated to the Netherlands in large numbers in the 1960s. Family-reunification in
the 1980s and second-generation children born in the Netherlands have then substantially
increased the proportion of Turks and Moroccans in the Netherlands. The mass inflow of
Surinamese took place after the decolonisation of Surinam in 1975, while large migrant
groups from the Netherlands Antilles (still an autonomous area within the Kingdom of
the Netherlands) have been arriving since the 1990s.
The economic integration of the four ethnic minorities requires a comprehensive under-
standing of immigrant economic success in Dutch society (Zorlu and Hartog, 2001). In
this paper, we are particularly interested in how social contacts affect Dutch immigrant
economic success. We propose the following research questions: to what extent does the
ethnic composition of contacts affect immigrant economic success in the Netherlands?
How do the effects vary across ethnicity, education level, age at migration, and occu-
pation? A second focus is on the effect of acquiring local language. How does Dutch
language proficiency contribute to the economic performance of these four groups?
Many empirical studies on social contacts and economic performance analysed cross-
sectional data, where the causal effect of social contacts is hard to infer (see, e.g., Kanas
and Van Tubergen, 2006; Lancee, 2010; Lin et al., 1981). There is a paucity of studies
of significant adjustment in a dynamic setting. Xue (2008) looks at the role of social
networks using a longitudinal survey of immigrants to Canada, and finds that social
capital facilitates employment, possibly through a more ethnically diverse network. Kanas
et al. (2012) uses data from the German Socio-Economic Panel, and find that inter-ethnic
ties with Germans lead to higher occupational status but not to increased income. Piracha
et al. (2014) uses the Households Income and Labour Dynamics in Australia longitudinal
data, and find a positive effect of social capital on migrants’ employment outcomes and
wages, especially for women. Moreover, it affects the employment probability of obtaining
a white-collar job rather than a blue-collar one.
This paper contributes to the literature in several ways. First, we enrich the social
network and labour market performance literature by distinguishing co-ethnic contact
3

and inter-ethnic contact. Second, we add to the literature on the labour market effects of
Dutch language proficiency in the Netherlands. Third, we study labour market outcomes
more comprehensively than the previous literature by using three measures: labour
market earnings, employment probability, and occupational status. Fourth, the Dutch
immigrant data enables us to test the causal effect of social contacts and Dutch language
proficiency more rigorously in a longitudinal setting.
The remainder of the paper is organised as follows. Section 2 proposes the theory and our
hypotheses. Section 3 describes the data and variables. Section 4 presents the empirical
analysis. Robustness checks are performed in Section 5, confirming our main results. The
final section provides concluding remarks, and discusses avenues for future research.
2 Theory and Hypotheses
The literature both in labour economics and sociology is replete with references to
the importance of social networks for labour market performance (mainly earnings and
employment)(see, e.g., Granovetter, 1974; Ioannides and Loury, 2004; Montgomery, 1991).
Social contacts facilitate economic opportunities by providing access to job information
(Lin, 1999; Mouw, 2003). Equally important is the linguistic skill as a host-country specific
human capital. The positive effect of destination language proficiency for immigrants’
economic well-being has been widely acknowledged in English-speaking countries such
as the US, Canada, Australia and the UK (Carliner, 1981; Chiswick and Miller, 1995;
Chiswick and Miller, 2002; Dustmann and Fabbri, 2003; McManus et al., 1983), as well as
non-English speaking countries such as Germany, Spain and Israel (Budria and Swedberg,
2012; Chiswick, 1998; Dustmann and Van Soest, 2001). Destination language proficiency
directly enhances earnings and enhances the partial effect of other forms of human capital.
Above all, it is then hypothesised that social contacts and Dutch language proficiency
increase the likelihood of employment and earnings of non-western immigrants in the
Netherlands. (H1)
Immigrants’ labour market performance is closely associated with skill transferability
(Chiswick and Miller, 2012; Duleep and Regets, 1999), since low-skill-transferability
immigrants will be making greater human-capital investment in the Netherlands. Skill
transferability can be proxied empirically by age at migration, linguistic distance be-
tween origin and destination languages, and host-country specific education. High-
4

skill-transferability immigrants are able to quickly adapt to the new environment by
themselves, while social contacts and Dutch language proficiency could be more beneficial
to low-skill-transferability immigrants due to their lack of host-country specific human
capital. It is then hypothesised that social contacts and Dutch language proficiency have
a greater impact on the likelihood of employment and earnings for low-skill-transferability
immigrants than for high-skill-transferability immigrants in the Netherlands. (H2)
The effect of social contacts and Dutch language proficiency varies with migration
motives. Economic migrants are those who move primarily because of their own economic
opportunities, and are mostly described as ambitious and hard-working (Chiswick, 1999).
Compared to non-economic migrants, such as tied movers, refugees and ideological
migrants, they are likely to make greater use of social contacts and Dutch language
skills to enhance their labour market performance. This leads to the hypothesis that
social contacts and Dutch language proficiency have a greater impact on the likelihood of
employment and earnings for economic migrants than for non-economic migrants. (H3)
Last but not the least, occupational attainment is an important but frequently neglected
indicator of labour market performance in immigrant literature. Apart from years of
schooling, training, qualifications, language skills (Chiswick and Miller, 2007; Evans, 1987;
Nickell, 1982), social network have also been found to increase occupational status (Kanas
et al., 2012; Lin et al., 1981; Mullan, 1989). Certain occupations require social skills and
effective communication for success. Blue-collar jobs, such as agricultural workers and
machine operators, require technical skills more than the worker’s social network. For
white-collar jobs, however, such as clerks and service workers, the work performance is
closely related to how well they communicate with people. Therefore we hypothesise that
social contacts and Dutch language proficiency have a greater impact on occupational
status for white-collar jobs than for blue-collar jobs. (H4)
We also analyse the extent to which immigrants in the Netherlands benefit from different
types of social contacts. Upon arrival at the destination country, an immigrant faces
choices of developing social capital with different types of people, among which ethnicity
might be the most important dimension. Contact with the natives yields unambiguously
positive returns because it provides immigrants with information on higher quality job
offers and assistance in assimilation (Iosifides et al., 2007; Kazemipur, 2006; Lancee, 2012).
However, the economic returns of co-ethnic contacts are less clear-cut. Lancee (2010) found
that co-ethnic networks do not affect economic outcomes. On the one hand, socializing
with co-ethnics provides assistance in job information and initial settlement (Chiswick and
5

Miller, 2005; Clark and Drinkwater, 1998). Yet, while embedding into co-ethnic networks
enhances ethnic solidarity, it retards contact with the host society. This may hamper
upward economic mobility.1 Therefore we hypothesise that immigrant’s contact with
Dutch people leads to better economic performance (earnings, employment and occupational
status) (H5), and that co-ethnic contact has an ambiguous effect on immigrant’s economic
performance (earnings, employment and occupational status) (H6).
3 Data and Variables
3.1 Data
The data are from the Dutch survey ‘Social Position and Use of Public Facilities by
Immigrants’ (SPVA), which is a large-scale, cross-sectional survey for the four largest
non-western immigrant groups in the Netherlands: Turks, Moroccans, Surinamese, and
Antilleans. The aim of the survey is to collect information for the analysis of the socio-
economic and socio-cultural position of the four largest immigrant ethnic minorities in
the Netherlands. The data were collected using a stratified random sampling method
to target municipalities with a high percentage of immigrants. The empirical analysis
is restricted to adult foreign-born men, with the age ranging from 25 to 64 years. The
individuals included are those who were reported as the household head. The sample
frame consists of 10 to 13 cities (depending on survey year), where immigrants are
relatively overrepresented. It was conducted in year 1991, 1994, 1998 and 2002, with
1981, 1762, 3228, and 1949 households, respectively.
We follow the approach in Martinovic et al. (2009) to create a sample of panel respondents.
A number of immigrants participated more than once in the survey. There are in total
718 two-waves participants, 118 three-waves participants, and 18 four-waves participants.
Those who participated more than twice (for example a 1991-1994-1998 participant), are
registered both as belonging to the 1991-1994 and 1994-1998 panel groups. As a result,
a pooled data set of 1450 cases is obtained, with responses on two occasions that are
separated by a time distance of 3 to 4 years.2
1This classification of the two types of social contacts is more frequently called bonding and bridging bysociologists, according to the definitions in Putnam (2000) and Woolcock and Narayan (2000).
2A household which has changed its head across waves is excluded from the analysis.
6

3.2 Dependent and independent variables
In the Appendix, Table A1 shows a list of the dependent and independent (explanatory)
variables, with their detailed definitions and coding.
Three different variables jointly measure immigrant labour market performances. Monthly
earnings: respondents report their monthly labour market earnings from all jobs. Em-
ployment : dichotomous variable equals 1 if the respondent is working regularly and 0
if the respondent is without a job, that is unemployed or searching for a job.3 Occupa-
tional status: it is measured in terms of the International Socio-Economic Index (ISEI)
(Ganzeboom et al., 1992). It refers to the primary occupation reported in the survey
year.
There are several explanatory variables:
Only employed respondents were asked about their working hours, occupations, and
sectors. Contract working hours: the respondents were asked how many hours they work
per week according to the employment contract. Occupations: occupations are categorised
into two types. Blue-collar workers perform manual labour (e.g. agricultural workers
and machine operators), and white-collar workers perform professional, managerial, or
administrative work (e.g. service workers, clerks and legislators).4 Sectors: three types
are distinguished. Primary sector involves activities of raw materials extraction (e.g.
agriculture, horticulture, and forestry), secondary sector involves manufacturing activities
(e.g. food processing and construction), and the tertiary sector involves services (e.g.
telecommunication and accountants).
Human capital variables for both the origin-country and host-country are included.
Education is measured by five dichotomous variables: No education, primary education,
lower secondary education, intermediate education, and higher education.5 Education in
3Respondents who are not in the labour force are not included in the sample.4Here we make use of the International Standard Classification of Occupation, ISCO-88, 1-digit level.
ISCO codes (1) legislators, senior officials and managers, (2) professionals, (3) technicians and associateprofessionals, (4) clerks, (5) service workers and shop and market sales workers, are defined as whitecollar. ISCO codes (6) skilled agricultural and fishery workers, (7) craft and related trades workers, (8)plant and machine operators and assemblers, (9) elementary occupations, are defined as blue collar.
5According to Oosterbeek (1992), secondary education in the Netherlands is composed of both vocationaland general branches, with different years of schooling. Within each branch, students can enter lowersecondary education directly after primary education and can only enter intermediate educationupon graduation from the previous one. Higher education refers to higher vocational educationand university. We distinguish education as primary education (LO), lower secondary education
7
OC : the highest degree obtained in the country of origin, among the five levels. Education
in NL: the highest degree obtained in the Netherlands. Work experience in OC : work
experience in the country of origin is measured in years. Work experience in NL: work
experience in the Netherlands is measured in years. Dutch language proficiency : it is a
categorical variable with (1) do not speak Dutch or find it very difficult, (2) Not very
well, sometimes find it difficult, (3) Very well, never find it difficult, where (1) is the
reference category.
Social capital variables are included for both co-ethnic contact and contact with Dutch
people. Contact composition during free time: the respondents were asked about their
frequency of Dutch contact and co-ethnic contact during free time. Three categories are,
(1) more contacts with co-ethnics, (2) equal contacts with Dutch and co-ethnics, (3) more
contacts with the Dutch, where (1) is the reference category. Contact composition at work :
the respondents were asked about their frequency of Dutch contact and co-ethnic contact
at work. Three categories are, (1) more contacts with co-ethnics, (2) equal contacts
with Dutch and co-ethnics, (3) more contacts with the Dutch, where (1) is the reference
category. Organisation membership: the respondents were asked whether they belong
to any organisation and whether the composition of the organisation is predominantly
Dutch or co-ethnic. Two questions are combined and a variable with three categories is
constructed, (1) no membership, (2) member of a predominantly ethnic organisation, (3)
member of a predominantly Dutch organisation, where (1) is the reference category.
Other background characteristics are included as well. Ethnicity : respondents self-report
their ethnicity, including Turks, Moroccans, Surinamese, and Antilleans. The Turks are
treated as the reference group. Municipality : respondent’s place of residence. Amsterdam,
Rotterdam, Den Haag, Utrecht, Eindhoven, Enschede, Almere, Alphen aan den Rijn,
Bergen op Zoom, Hoogezand-Sappemeer, Delft, Dordrecht, and Tiel are identified in the
survey and are included in the analysis. Amsterdam is the reference category. Ethnic
concentration: is measured by the proportion of the respondent’s ethnic group in the
population of the city of residence, for Turks, Moroccans, Surinamese, and Antilleans.6
Nationality : dichotomous variable equals 1 if the respondent reported having Dutch
nationality (citizenship) and 0 otherwise. Married : dichotomous variable equals 1 if
the respondent is married (spouse present) and 0 otherwise. Number of children: the
respondents were asked how many children they have at home in the Netherlands and
also outside home. We create a new variable by summing up the numbers. Years since
(LBO/MAVO), intermediate education (MBO/HAVO/VWO), and higher education (HBO/WO).6The ethnic distribution of population within cities is from Statistics Netherlands.
8
migration: Years of stay in the Netherlands. Migration motives: migration motives are
categorised into four types. Work, study, family (mainly family reunification, marriage
or being brought to the Netherlands by parents) and other reasons (political situation in
the origin-country, health reasons, etc).
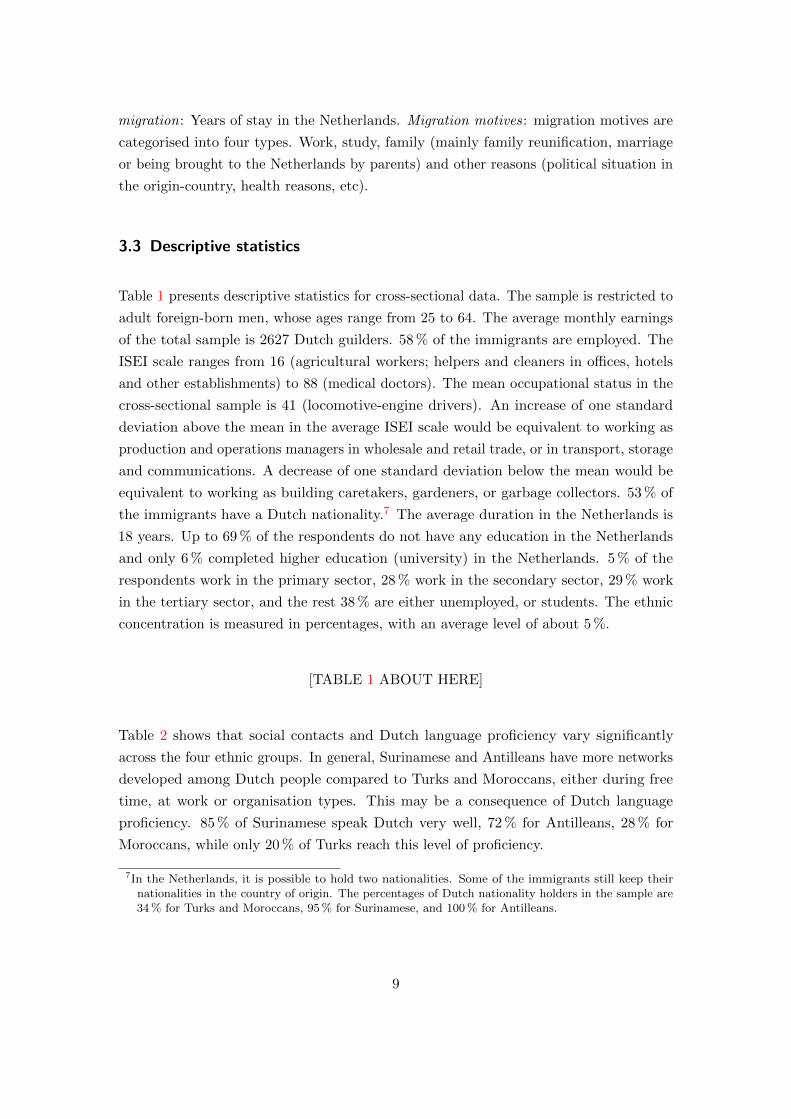
3.3 Descriptive statistics
Table 1 presents descriptive statistics for cross-sectional data. The sample is restricted to
adult foreign-born men, whose ages range from 25 to 64. The average monthly earnings
of the total sample is 2627 Dutch guilders. 58 % of the immigrants are employed. The
ISEI scale ranges from 16 (agricultural workers; helpers and cleaners in offices, hotels
and other establishments) to 88 (medical doctors). The mean occupational status in the
cross-sectional sample is 41 (locomotive-engine drivers). An increase of one standard
deviation above the mean in the average ISEI scale would be equivalent to working as
production and operations managers in wholesale and retail trade, or in transport, storage
and communications. A decrease of one standard deviation below the mean would be
equivalent to working as building caretakers, gardeners, or garbage collectors. 53 % of
the immigrants have a Dutch nationality.7 The average duration in the Netherlands is
18 years. Up to 69 % of the respondents do not have any education in the Netherlands
and only 6 % completed higher education (university) in the Netherlands. 5 % of the
respondents work in the primary sector, 28 % work in the secondary sector, 29 % work
in the tertiary sector, and the rest 38 % are either unemployed, or students. The ethnic
concentration is measured in percentages, with an average level of about 5 %.
[TABLE 1 ABOUT HERE]
Table 2 shows that social contacts and Dutch language proficiency vary significantly
across the four ethnic groups. In general, Surinamese and Antilleans have more networks
developed among Dutch people compared to Turks and Moroccans, either during free
time, at work or organisation types. This may be a consequence of Dutch language
proficiency. 85 % of Surinamese speak Dutch very well, 72 % for Antilleans, 28 % for
Moroccans, while only 20 % of Turks reach this level of proficiency.
7In the Netherlands, it is possible to hold two nationalities. Some of the immigrants still keep theirnationalities in the country of origin. The percentages of Dutch nationality holders in the sample are34 % for Turks and Moroccans, 95 % for Surinamese, and 100 % for Antilleans.
9
[TABLE 2 ABOUT HERE]
Figure 1 shows the average monthly earnings of adult foreign-born men across ethnic
groups. All groups show a steady increase in earnings over the years. Moroccans are
economically worse off than the other three groups. Antilleans reported the highest
earnings in 1991 and 1994, but were later surpassed by Surinamese in 1998 and 2002.
[Figure 1 ABOUT HERE]
4 Empirical Results
4.1 Cross section analyses
The empirics begin with a cross-section regression analysis for adult foreign-born men
in the Netherlands. Table 3 presents the regression estimates for earnings, employment
and occupational status. Column (1) is the OLS earnings regression (Mincer, 1974)
incorporated with YSM variables (Chiswick, 1978). The dependent variable is the natural
logarithm of earnings. The sample includes employed men reporting positive or non-zero
labour market earnings. Column (2) is a logistic regression model and the dependent
variable is a dichotomous variable for being employed or not. The sample includes those
who reported ‘working regularly’ or ‘unemployed/search for jobs’. Column (3) is an OLS
estimation for occupational status, with ISEI being the dependent variable. The sample
includes employed respondents with reported occupations. All the standard errors are
clustered on respondent ID, given the fact that some respondents appear more than once
in the pooled cross-sectional data.
[TABLE 3 ABOUT HERE]
In column (1) of Table 3 on earnings, the coefficients for all social contact variables
are statistically insignificant. Dutch language proficiency turns out to be an important
factor in increasing earnings. Respondents who speak Dutch very well earn around 6 %
more than those who have no mastery of the Dutch language. This effect is smaller
than the effect of language proficiency found elsewhere in other destination countries. In
10

addition, higher earnings are associated with more schooling in the Netherlands. Other
variables the same, there is no significant difference in earnings among the four immigrant
groups.
In column (2) of Table 3 on employment, the effects of social contacts and Dutch language
proficiency on the probability of employment are interpreted using the odds ratio. The
odds ratio is expected to change by exp(biδ) for a change of δ in variable xi, ceteris
paribus.Pr(Employed = 1|X = {xi + δ, x−i})Pr(Employed = 1|X = {xi, x−i})
= exp(biδ), (1)
where bi is the estimated coefficient for variable xi in the logistic regression model. The
odds ratio is 1.31 times greater for a change from ‘more contact with co-ethnics’ to ‘equal
contacts with Dutch and co-ethnics’ in the ethnic composition. The odds ratio is 2.26
times greater for a change from ‘speak no Dutch’ to ‘speak Dutch very well’. Surinamese
and Antilleans have higher employment rates than Turks and Moroccans.8
In column (3) of Table 3, ethnic organisation membership and Dutch organisation
membership are both associated with a higher occupational status. The occupational
status is positively associated with education level. The negative coefficient for YSM
(although not statistically significant) and the significant positive coefficient for YSM
squared suggest that the International Socio-Economic Index rises at an increasing rate
with duration in the Netherlands.9
4.2 Panel data analyses on earnings
This subsection discusses the econometric specifications for testing immigrant economic
assimilation using longitudinal data, and the corresponding regression analysis. The
following notation is used: LnEit is the natural logarithm of earnings for immigrant
i = 1, 2, · · · , N , in time period t; Y SMit is years since migration of i in time t; Xit is the
individual characteristics that may vary over time, for example, social contact variables
and language variables; θi is the individual specific effect for immigrant i, including
observed characteristics (such as ethnicity), and unobserved heterogeneity; εit is the
8This is consistent with the finding in Zorlu and Hartog (2008).9Zorlu (2013) shows that labour market adjustment of immigrants in the Netherlands runs through
inter-occupational job mobility, rather than intra-occupational mobility, while the focus is put moreon the initial disadvantage upon arrival and the rate of adjustment (including interval categories forYSM as the explanatory variable, but not quadratic terms of YSM) in later years.
11

residual error.
We follow convention by assuming that the earnings assimilation curve is quadratic in
years since migration:
LnEit = α+ β · Y SMi + γ · Y SM2i + λ ·Xit + θi + εit. (2)
The intercept α could be interpreted as the logarithm of the benchmark for immigrant
group evaluated at Xi = 0. It is assumed that our interested coefficients β, γ and λ do
not vary over time. For simplicity, it is assumed that the effect on earnings of education
in the Netherlands is captured by the years since migration variable.
Let τ = t+ T where T > 0 is the time interval between two longitudinal observations.
Let ∆T denote the difference operator over T periods. Equation 2 implies that in time
period τ :
LnEiτ = α+ β · (Y SMi + T ) + γ · (Y SMi + T )2 + λ ·Xiτ + θi + εiτ . (3)
Subtracting Equation 3 from Equation 2 differences away the immigrant specific effect:
∆TLnEi = (βT + γT 2) + 2Tγ · Y SMi + λ ·∆TXi + ∆T εi. (4)
β,γ, and λ are exactly identified in Equation 4. Note the sign of γ determines whether
the immigrant earnings increase at an increasing or a decreasing rate with duration in
the destination.
The panel data sample is created with a time interval of T ≈ 4 years between the first
and the second time of the survey, making it possible for us to estimate Equation 4.
The variable Xi include the social capital variables (Contact composition during free
time, contact composition at work, and organisation membership) and Dutch language
proficiency variable discussed in subsection 3.2. The longitudinal regression analysis would
be concerned with the level changes in social contacts and Dutch language proficiency
between two time periods.
Table 4 presents the longitudinal regression analysis of earnings for adult foreign-born
men in the Netherlands. The dependent variable is the difference between the natural
logarithm of earnings adjusted for inflation in time 2 and time 1. Column (1) ‘All’ is the
estimation for the whole sample. In column (1), contrary to the cross-sectional findings,
12
it is found that the coefficients for social contacts are statistically significant. Co-ethnic
contact during free time compared to Dutch contact (16 %), equal contact compared
to co-ethnic contact at work (17 %) and Dutch language proficiency compared to not
speaking Dutch (15 %) all lead to an increase in earnings.10 The effect of network differs
by the context. If an immigrant allocates more time in co-ethnic contact during free
time or some contact at work with Dutch people compared to only co-ethnics, this would
yields returns to earnings. These confirm our hypotheses H1, H5, H6 about earnings.
[TABLE 4 ABOUT HERE]
Column (2) of Table 4 ‘T&M’ is the estimation for the Mediterranean group (Turks and
Moroccans), and column (3) of Table 4 ‘S&A’ is the estimation for the Caribbean group
(Surinamese and Antilleans). The Mediterranean group is predominantly of Muslim origin
and its linguistic distance from the Dutch is great. The Caribbean group, however, is close
to the Dutch society concerning religious and cultural characteristics due to a colonial
history. Column (2) shows that co-ethnic contact compared to equal contact (14 %), some
contact with Dutch people at work (17 %), and Dutch language proficiency (15 %) all lead
to an increase in earnings for the Mediterranean group, while the effect is much lower for
the Caribbean group. As shown in equation 4, solving βT + γT 2 = 0.204, 2Tγ = −0.011yields β = 0.057 and γ = −0.0014 (Table 4,column 2). The earnings of the Mediterranean
group increases at a decreasing rate with duration.
Column (4) of Table 4 ‘No NL Edu.’ is the estimation for immigrants who completed
their education in the country of origin, and column (5) of Table 4 ‘NL Edu.’ is the
estimation for immigrants who completed education in the Netherlands. Comparing
column (4) and column (5), the effects of social contacts (15 % for ‘more contact with
Dutch at work’) and Dutch language proficiency (19 %) on earnings of immigrants who
completed their education in the country of origin are stronger than that for immigrants
10Yao and Van Ours (2015) analyses the effect of Dutch language proficiency on the wages of adultmale immigrants in the Netherlands from all countries of origin. Although the sample is relativelysmall for a microdata analysis of male earnings (407 observations), those who are proficient in Dutch(measured by a dichotomous variable) earn about 14 percent more than those lacking proficiency,which is marginally significant (t=1.91). This magnitude is comparable to what is found in this studyand in studies of other countries. Using an IV approach to identify Dutch proficiency, Yao and VanOurs found the coefficient declines to 9.4 percent, but the standard error increases sharply (t=0.49).Presumably because of the difficulty of finding appropriate identifying instruments, other studies usingthe IV technique to study the relation between earnings and proficiency also found a large increasein the standard error compared to an OLS analysis. For a discussion of this issue, see Chiswick andMiller (1995).
13
who completed their education in the Netherlands.
Column (6) of Table 4 ‘AAM>18’ is the estimation for immigrants whose age at migration
(AAM) is older than 18, and column (7) of Table 4 ‘AAM≤18’ is the estimation for
immigrants whose age at migration (AAM) is younger than 18. Comparing column (6)
and column (7), co-ethnic contact during free time (22 %), Dutch contact at work (23 %),
and Dutch language proficiency (19 %) all increase earnings for immigrants who migrate
at an older age, while only the coefficient for Dutch organisation membership is positively
significant in column (4). The effects of social contacts and Dutch language proficiency
on earnings of immigrants who migrate at an older age are also slightly stronger than
that for immigrants who migrate at a younger age.
Above all, we have done regressions for three pairs of (low-skill-transferability versus
high-skill-transferability) subgroups: the Mediterranean versus the Caribbean; immi-
grants’ education completed in the country of origin versus education completed in the
Netherlands; age at migration older than 18 versus age at migration younger than 18.
We consistently found that low-skill-transferability immigrants benefit more from social
contacts and especially from Dutch language proficiency in earnings than high-skill-
transferability immigrants, thus confirming hypothesis H2 about earnings.
Column (8) of Table 4 ‘Econ’ is the estimation for the economic migrants, and column (9)
of Table 4 ‘Non-Econ’ is the estimation for the non-economic migrants. Column (8) shows
that the statistically significant contact with Dutch people at work (31 %) and Dutch
language proficiency (24 %) both lead to an increase in earnings of economic migrants.
However, among non-economic migrants, only the coefficient for Dutch organisation
membership is statistically significant (16 %). This confirms our hypothesis H3 on the
effects on earnings of motives for migrating.
4.3 Panel data analyses on employment
Appendix Table A2 presents the random effects logistic regression results of employment
for adult foreign-born men in the Netherlands. The random effects logit model is a
maximum likelihood solution where the parameters are estimated through a weighted
combination of within and between individual covariances. The dependent variable is a
dichotomous variable for being employed or not. Column (1) ‘All’ is the estimation for
the whole sample. σ is the estimated random effects’ standard deviation. The significance
14
of σ implies that there is random effect. Similar with cross-sectional findings in Table
3, Dutch contact greatly enhances the probability of being employed. In column (1),
participating in a Dutch organisation is significantly associated with a higher probability
of being employed, and the odds ratio is 4.93 times higher. The odds ratio is 1.76 times
greater for a change from ‘do not speak Dutch’ to ‘Dutch: not very well’, and is 3.06 times
greater for a change from ‘do not speak Dutch’ to ‘Dutch: very well’. Social contacts and
Dutch language proficiency turn out to increase the likelihood of employment, especially
contact with Dutch people. Co-ethnic contact does not seem to have any positive effect
on employment. These confirm the hypotheses H1, H5, H6 about employment.
Column (2) of Table A2 ‘T&M’ is the estimation for the Mediterranean group (Turks and
Moroccans), and column (3) of Table A2 ‘S&A’ is the estimation for the Caribbean group
(Surinamese and Antilleans). Only the Mediterranean group has a higher probability of
being employed with more Dutch contact, and a higher level of Dutch language proficiency.
Social contacts and Dutch language proficiency do not have these positive effects for
the Caribbean group, perhaps because they are highly adjusted to Dutch culture and
language at immigration.
Column (4) of Table A2 ‘No NL Edu.’ is the estimation for immigrants who completed
their education in the country of origin, and column (5) of Table A2 ‘NL Edu.’ is the
estimation for immigrants who completed education in the Netherlands. In column (4),
participating in a Dutch organisation is significantly associated with a higher probability
of being employed for immigrants who completed their education in the country of origin,
and the odds ratio is 9.97 times higher. The odds ratio is 1.74 times greater for a change
from ‘do not speak Dutch’ to ‘Dutch: not very well’, and is 2.24 times greater for a
change from ‘do not speak Dutch’ to ‘Dutch: very well’. However in column (5), none
of the coefficients for social contacts and Dutch language proficiency are significant for
immigrants who completed their education in the Netherlands.
Column (6) of Table A2 ‘AAM>18’ is the estimation for immigrants whose age at
migration (AAM) is older than 18, and column (7) of Table A2 ‘AAM≤18’ is the
estimation for immigrants whose age at migration (AAM) is younger than 18. Comparing
these two columns, the coefficients for Dutch organisation membership and Dutch language
proficiency are positively significant for immigrants who migrated at older age, while only
the coefficient for language variable is positively significant for immigrants who migrated
at younger age.
15
Above all, we have compared the three pairs (low-skill-transferability versus high-skill-
transferability) of subgroups: the Mediterranean versus the Caribbean; education com-
pleted in the country of origin versus education completed in the Netherlands; age at
migration older than 18 versus age at migration younger than 18. We consistently found
that low-skill-transferability immigrants benefit more in terms of employment from social
contacts and Dutch language proficiency than high-skill-transferability immigrants, thus
confirming hypothesis H2 about employment.
Column (8) and (9) of Table A2 report the random effects regression results separately
for economic and non-economic migrants. Participating in a Dutch organisation is
significantly associated with higher probability of employment for economic migrants,
and the odds ratio is 11.99 times higher. The odds ratio is 2.49 times greater for a
change from ‘do not speak Dutch’ to ‘Dutch: not very well’. However, the effect of
language is much less for non-economic migrants. This confirms our hypothesis H3 about
employment.
4.4 Panel data analyses on occupational status
The fixed effects estimation on occupational status for adult foreign-born men in the
Netherlands is reported in Table A3. The dependent variable is the International
Socio-Economic Index (ISEI). The model eliminates unobserved heterogeneity by using
deviations from the means of the variables, and hence the time-invariant variables, such
as ethnicity, are eliminated. Column (1) is the estimation for the whole sample. Column
(2) is the estimation for immigrants who are blue-collar workers, and column (3) is
the estimation for immigrants who are white-collar workers. In column (1), it is found
that both co-ethnic contact and contact with Dutch people are useful for occupational
upward mobility. This confirms the hypotheses H5 and H6 about occupational status.
Comparing column (2) and column (3), we do not find any significant effect of social
contacts on occupational status in blue-collar jobs. In white collar-jobs, however, co-ethnic
contact and some contact with Dutch people compared to only co-ethnics increases the
occupational status. This confirms our hypothesis H4.
16
5 Robustness Checks
In this section, we mainly discuss two issues: selectivity of panel respondents in cross-
sectional data; and the possible reverse causality between earnings and social contact
variables.
It should be noted that this Dutch survey was not originally set up as a longitudinal
study and hence the level of attrition is rather high. Around 80 % agree to take part
in the next wave, but only 20 % actually realise the re-interview. The interviewers did
not trace the respondents who move in the period between the two surveys. We also
checked the descriptive statistics for the pooled panel data, both at the first and the
second time of measurement. They do not differ greatly from Table 1 and Table 2.11 To
further check whether these respondents are selective, we apply Heckman selection model.
In the first step, a probit regression is run to predict the participation of respondents
in the panel sample. Apart from all the control variables, the dummy for living in
a rented house is added. The coefficient is significantly negative, implying that the
respondents who live in a rented house are less likely to participate in the next wave
compared to those who own a house. The intuition is that respondents renting a house
have higher probabilities of changing address by returning to their country of origin or
moving elsewhere in the Netherlands. In the second step, the outcome regression is run
controlling for the selectivity coefficient obtained in the first step.
The Heckman selectivity correction models for earnings, employment and occupational
status are reported in Appendix Table A4. The inverse Mills’ ratio reported in the last
row of each column is not significant in any of the specifications, implying that there is
no selection bias. This result validates the empirical analysis for the panel data.
Apart from utilising the longitudinal approach to tackle the endogeneity problem, we
further study the causal relationship between social contacts and earnings by including in
the model lagged measures of social contacts and Dutch language proficiency, (Appendix
Table A5). In our panel data sample, these lagged variables are 3 to 4 years prior to the
measured earnings.
Although the lagged contact variables during free time and at work are not statistically
significant, lagged variables for ethnic organisation membership, Dutch organisation
membership and the ethnic concentration all have significant positive effects in earnings.
11The descriptive tables for the pooled panel data are available on request.
17

The ethnic organisation membership effect (15 %) is larger and more highly significant
than the effect of Dutch organization membership (11 %). The lagged language variables
are not statistically significant implying that recently acquired language skills have the
bigger impact on earnings, as it is unlikely that higher earnings increases a worker’s
Dutch language skills.
6 Main Conclusions and Discussions
This paper studies the effects of social contacts and Dutch language proficiency on the
adult foreign-born men’s labour market performances in the Netherlands, using four large
cross-section samples from year 1991 to 2002, together with a constructed panel dataset.
It is found that social contacts and Dutch language proficiency have positive impacts
on labour market outcomes (mainly employment and earnings). But the strength of the
effects varies by the degree of the transferability of their pre-migration skills and their
motivation for migration (economic or non-economic).
There are several important findings. First, the Mediterranean group (Turks and Mo-
roccans) benefits much more from social contacts and Dutch language proficiency in
their economic performance than the Caribbean group (Surinamese and Antilleans). For
example, the Mediterranean immigrants who speak Dutch well earn 15 % more than
those who do not speak Dutch at all. For Turks and Moroccans, two economically
disadvantaged groups with lower education levels, contact with Dutch people turns out
to be of great use in job-related activity. Surinamese and Antilleans’ earnings are quite
invariant to changes in social contacts and Dutch language proficiency. Surinamese and
Antilleans, as two immigrant groups that are closer to Dutch culture and language due to
colonial ties, their pre-migration contacts with Dutch were rather frequent. The marginal
effect of contact with Dutch people in the Netherlands is not that important for them.
Second, immigrants who completed their education in the country of origin benefit more
from social contacts and Dutch language proficiency in their economic performances than
immigrants who had some years of schooling in the Netherlands. In the former group,
immigrants who report more contact with Dutch at work earn 15 % more than those
who have more co-ethnic contact at work, ceteris paribus. Certain qualifications in the
Netherlands are useful to get a job or a promotion at work. Immigrants who completed
their education in the country of origin lack the destination-specific exposure, and hence
18
social contacts provide more information for them to familiarize with the local labour
market.
Third, immigrants who migrated at an older age have a larger partial effect from social
contacts and Dutch language proficiency in their economic performances than immigrants
who migrated at a younger age. The older age an immigrant migrates, the less transferable
is his skill to the destination. Younger migrants have accumulated more destination-
specific qualifications and mostly speak fluent Dutch. Therefore they are more competitive
in job market than those who migrated at an older age.
Fourth, social contacts and Dutch language proficiency have larger impacts on the
economic outcomes of economic migrants than non-economic migrants. Economic migrants
make better use of social contacts and Dutch language proficiency to obtain economic
benefits. For example, ceteris paribus, contact with Dutch at work and having a good
mastery of Dutch yield 31 % and 24 % increases in earnings, respectively, while they do
not have any significant effects on non-economic migrants’ earnings.
Fifth, social contacts and Dutch language proficiency also enhance occupational status,
but only for white-collar jobs. Contact with Dutch people is found to be consistently
positive in increasing all labour market outcomes (earnings, employment and occupational
status), but co-ethnic contact does not increase the likelihood of employment among
immigrants.
This study demonstrates the importance of social contacts and the distinction between
contacts among co-ethnics and with the host population, and Dutch language proficiency
on immigrant economic outcomes. As a result, the study provides insights for the Nether-
lands, and the European Union more broadly, on programs to enhance the integration of
immigrants by the government, immigrant ethnic communities and the immigrants them-
selves.12 A greater scope may involve mixed neighbourhood housing, which facilitates
communications between the immigrants and the natives. A greater emphasis on Dutch
language proficiency would enhance their earnings directly and enhance their earnings
indirectly by facilitating contact with Dutch people during their free time, at work and
through participating in Dutch organisations.
12Wang (2016), for example, studies how local labour market conditions affect immigrant’s decision onnetwork formation both in the co-ethnic group and the native group.
19
References
Budria, S. and P. Swedberg (2012). ‘The impact of language proficiency on immigrants’
earnings’. IZA Discussion Paper 6957.
Carliner, G. (1981). ‘Wage differences by language group and the market for language
skills in Canada’. The Journal of Human Resources 16.3, pp. 384–399.
Chiswick, B. R. (1978). ‘The effect of Americanization on the earnings of foreign-born
men’. Journal of Political Economy 86.5, pp. 897–921.
Chiswick, B. R. (1998). ‘Hebrew language usage: determinants and effects on earnings
among immigrants in Israel.’ Journal of Population Economics 11.2, pp. 253–271.
— (1999). ‘Are immigrants favorably self-selected?’ The American Economic Review
89.2, pp. 181–185.
Chiswick, B. R. and P. W. Miller (1995). ‘The endogeneity between language and earnings:
international analyses’. Journal of Labor Economics 13.2, pp. 246–288.
Chiswick, B. R. and P. W. Miller (2002). ‘Immigrant earnings : language skills, linguistic
concentrations and the business cycle’. Journal of Population Economics 15.1, pp. 31–
57.
Chiswick, B. R. and P. W. Miller (2005). ‘Do enclaves matter in immigrant adjustment?’
City & Community 4.March, pp. 5–35.
Chiswick, B. R. and P. W. Miller (2007). ‘Earnings and occupational attainment: immi-
grants and the native born’. IZA Discussion Paper 2676.
— (2012). ‘Negative and positive assimilation, skill transferability, and linguistic dis-
tance’. Journal of Human Capital 6.1, pp. 35–55.
Clark, K. and S. Drinkwater (1998). ‘Ethnicity and self-employment in Britain’. Oxford
Bulletin of Economics and Statistics 60.3, pp. 383–407.
Duleep, H. O. and M. C. Regets (1999). ‘Immigrants and human-capital investment’. The
American Economic Review 89.2, pp. 186–191.
Dustmann, C. and F. Fabbri (2003). ‘Language proficiency and labour market performance
of immigrants in the UK’. Economic Journal 113.489, pp. 695–717.
Dustmann, C. and A. Van Soest (2001). ‘Language fluency and earnings: estimations with
misspecified indicators’. The Review of Economics and Statistics 83.4, pp. 663–674.
Evans, M. (1987). ‘Language skill, language usage and opportunity: immigrants in the
Australian labour market’. Sociology 21.2, pp. 253–274.
Ganzeboom, H. B. G., P. M. D. E. Graaf, and D. J. Treiman (1992). ‘A standard
international socio-economic occupational status index of occupational status’. Social
Science Research 21, pp. 1–56.
20
Granovetter, M. (1974). Getting a job: a study of contacts and careers. first edit. Harvard
University Press,Cambridge, MA.
Ioannides, Y. M. and L. D. Loury (2004). ‘Job information networks , neighborhood effects
, and inequality’. Journal of Economic Literature XLII.December, pp. 1056–1093.
Iosifides, T., M. Lavrentiadou, E. Petracou, and A. Kontis (2007). ‘Forms of social capital
and the incorporation of Albanian Immigrants in Greece’. Journal of Ethnic and
Migration Studies 33.8, pp. 1343–1361.
Kanas, A. and F. Van Tubergen (2006). ‘The impact of human and social capital on
immigrants’ employment and occupational status’. Working paper.
Kanas, A., B. R. Chiswick, T. Van der Lippe, and F. Van Tubergen (2012). ‘Social
contacts and the economic performance of immigrants: a panel study of immigrants
in Germany’. International Migration Review 46.3, pp. 680–709.
Kazemipur, A. (2006). ‘The market value of friendship: social networks of immigrants’.
Canadian Ethnic Studies Journal 38.2, pp. 47–71.
Lancee, B. (2010). ‘The economic returns of immigrants’ bonding and bridging social
capital: the case of the Netherlands’. International Migration Review 44.1, pp. 202–
226.
— (2012). ‘Immigrant performance in the labour market’. PhD thesis. Univeristy of
Amsterdam.
Lin, N. (1999). ‘Social networks and status attainment’. Annual Review of Sociology 25,
pp. 467–487.
Lin, N., J. C. Vaughn, and W. M. Ensel (1981). ‘Social resources and occupational status
attainment’. Social Forces 59.4, pp. 1163–1181.
Martinovic, B., F. Van Tubergen, and I. Maas (2009). ‘Dynamics of interethnic contact:
a panel study of immigrants in the Netherlands’. European Sociological Review 25.3,
pp. 303–318.
McManus, W., W. Gould, and F. Welch (1983). ‘Earnings of Hispanic men: the role of
English language proficiency’. Journal of Labor Economics 1.2, p. 101.
Mincer, J. (1974). Schooling, experience and earnings. New York, NY: National Bureau
of Economic Research.
Montgomery, J. D. (1991). ‘Social networks and labor-market: toward an economic
analysis’. American Economic Review 81.5, pp. 1408–1418.
Mouw, T. (2003). ‘Social capital and finding a job: do contacts matter?’ American
Sociological Review 68.6, p. 868.
Mullan, B. P. (1989). ‘The impact of social networks on the occupational status of
migrants’. International Migration 27.1, pp. 69–86.
21
Nickell, S. (1982). ‘The determinants of occupational success in Britain’. The Review of
Economic Studies 49.1, pp. 43–53.
Oosterbeek, H. (1992). ‘Essays on human capital theory’. PhD thesis. University of
Amsterdam.
Piracha, M., M. Tani, and M. Vaira-Lucero (2014). ‘Social capital and immigrants’ labour
market performance’. Papers in Regional Science.
Putnam, R. D. (2000). Bowling Alone: the Collapse and Revival of American Community.
Simon and Schuster.
Van Ours, J. C. and J. Veenman (1999). ‘The Netherlands : old emigrants-young immigrant
country’. IZA Discussion Paper 80.
Wang, Z. (2016). ‘A paradox of economic prosperity and social integration?’ Available at
SSRN: http://ssrn.com/abstract=2737601.
Woolcock, M. and D. Narayan (2000). ‘Social capital: implications for development theory,
research, and policy’. The World Bank Research Observer 15.2, pp. 225–249.
Xue, L. (2008). ‘Social capital and employment entry of recent immigrants to Canada’.
Working paper March.
Yao, Y. and J. C. Van Ours (2015). ‘Language skills and labor market performance of
immigrants in the Netherlands’. Labour Economics 34, pp. 76–85.
Zorlu, A. (2013). ‘Occupational adjustment of immigrants in the Netherlands’. Journal
of International Migration and Integration 14.4, pp. 711–731.
Zorlu, A. and J. Hartog (2001). ‘Migration and immigrants: the case of the Netherlands’.
Tinbergen Institute Discussion Paper 042/3.
— (2008). ‘Employment assimilation of immigrants in the Netherlands: catching up and
the irrelevance of education’. IZA Discussion Paper 3534.
22

2000
2500
3000
3500
1991 1992 1993 1994 1995 1996 1997 1998 1999 2000 2001 2002Year
Earn
ings
(in
Dutc
h gu
ilder
s)
Ethnicity
Turks
Moroccans
Surinamese
Antilleans
The Average Monthly Earnings at Each Wave
Figure 1: The Average Monthly Earnings of Adult Foreign-Born Men at Each Wave
Source: SPVA 1991, 1994, 1998, 2002.
Note: In 2002, the currency changed from Dutch guilders to Euros. The exchange ratio 2.2:1 is used to
unify the monetary unit across four waves. Earnings shown in this figure is not adjusted for inflation.
23
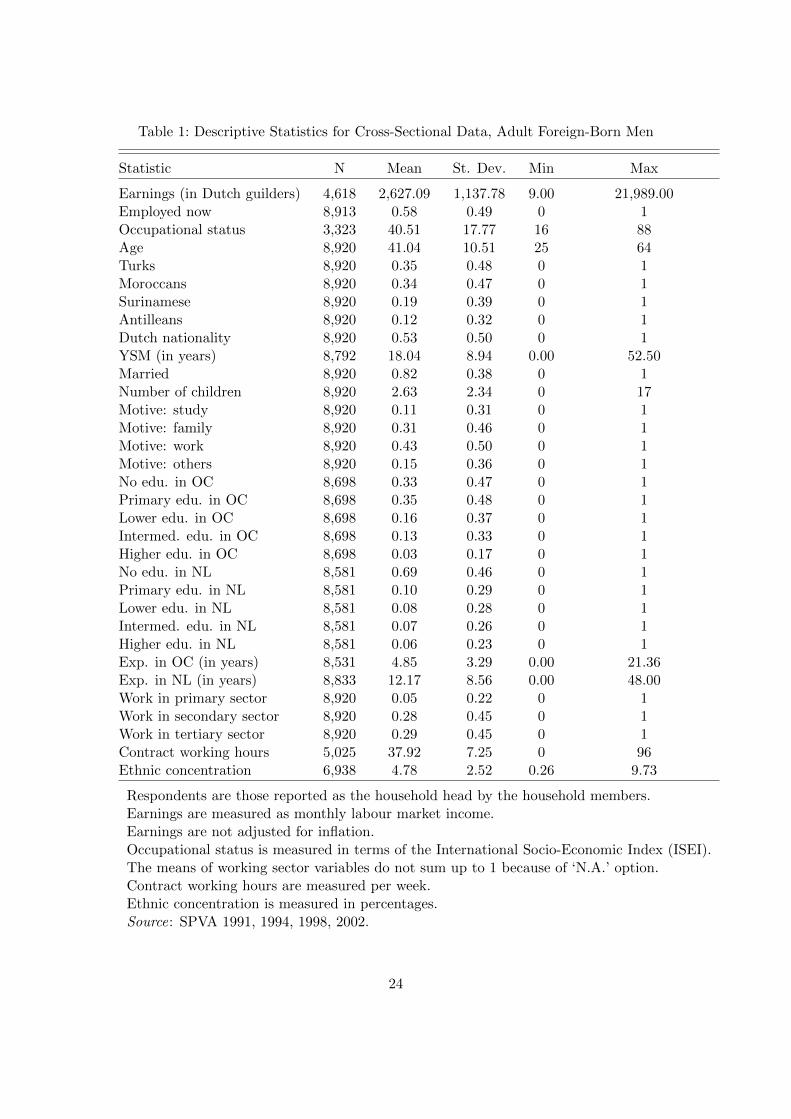
Table 1: Descriptive Statistics for Cross-Sectional Data, Adult Foreign-Born Men
Statistic N Mean St. Dev. Min Max
Earnings (in Dutch guilders) 4,618 2,627.09 1,137.78 9.00 21,989.00Employed now 8,913 0.58 0.49 0 1Occupational status 3,323 40.51 17.77 16 88Age 8,920 41.04 10.51 25 64Turks 8,920 0.35 0.48 0 1Moroccans 8,920 0.34 0.47 0 1Surinamese 8,920 0.19 0.39 0 1Antilleans 8,920 0.12 0.32 0 1Dutch nationality 8,920 0.53 0.50 0 1YSM (in years) 8,792 18.04 8.94 0.00 52.50Married 8,920 0.82 0.38 0 1Number of children 8,920 2.63 2.34 0 17Motive: study 8,920 0.11 0.31 0 1Motive: family 8,920 0.31 0.46 0 1Motive: work 8,920 0.43 0.50 0 1Motive: others 8,920 0.15 0.36 0 1No edu. in OC 8,698 0.33 0.47 0 1Primary edu. in OC 8,698 0.35 0.48 0 1Lower edu. in OC 8,698 0.16 0.37 0 1Intermed. edu. in OC 8,698 0.13 0.33 0 1Higher edu. in OC 8,698 0.03 0.17 0 1No edu. in NL 8,581 0.69 0.46 0 1Primary edu. in NL 8,581 0.10 0.29 0 1Lower edu. in NL 8,581 0.08 0.28 0 1Intermed. edu. in NL 8,581 0.07 0.26 0 1Higher edu. in NL 8,581 0.06 0.23 0 1Exp. in OC (in years) 8,531 4.85 3.29 0.00 21.36Exp. in NL (in years) 8,833 12.17 8.56 0.00 48.00Work in primary sector 8,920 0.05 0.22 0 1Work in secondary sector 8,920 0.28 0.45 0 1Work in tertiary sector 8,920 0.29 0.45 0 1Contract working hours 5,025 37.92 7.25 0 96Ethnic concentration 6,938 4.78 2.52 0.26 9.73
Respondents are those reported as the household head by the household members.Earnings are measured as monthly labour market income.Earnings are not adjusted for inflation.Occupational status is measured in terms of the International Socio-Economic Index (ISEI).The means of working sector variables do not sum up to 1 because of ‘N.A.’ option.Contract working hours are measured per week.Ethnic concentration is measured in percentages.Source: SPVA 1991, 1994, 1998, 2002.
24
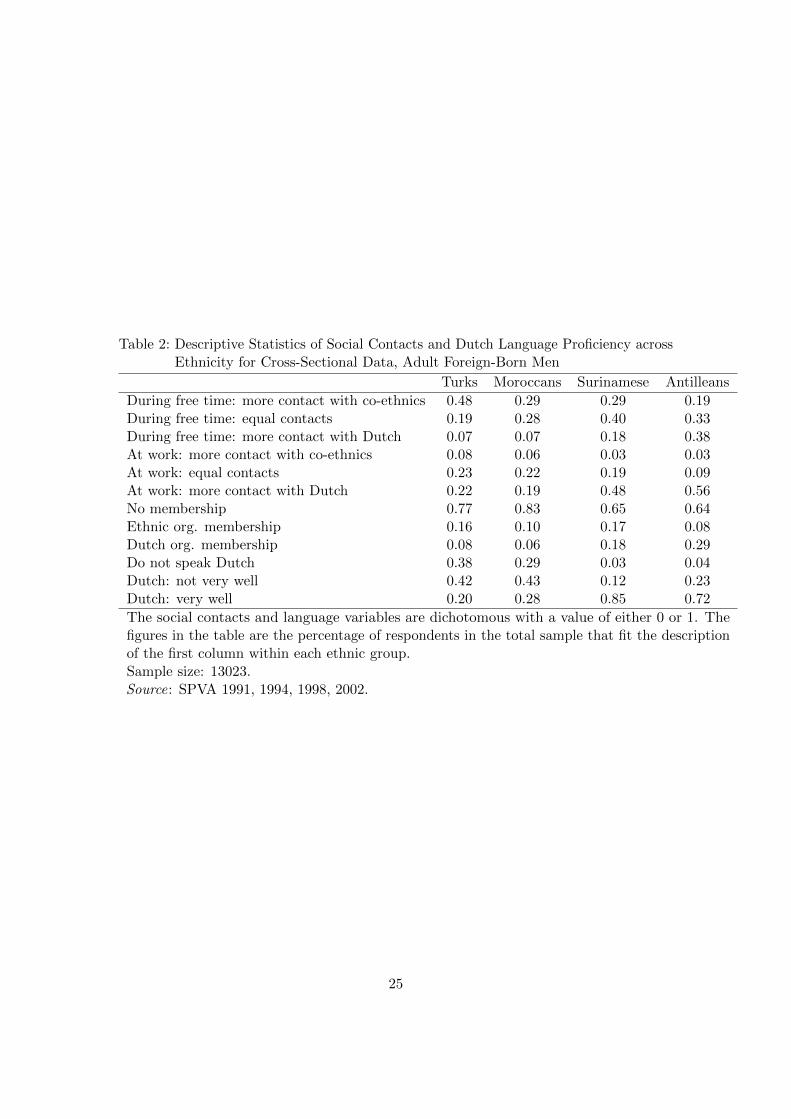
Table 2: Descriptive Statistics of Social Contacts and Dutch Language Proficiency acrossEthnicity for Cross-Sectional Data, Adult Foreign-Born Men
Turks Moroccans Surinamese Antilleans
During free time: more contact with co-ethnics 0.48 0.29 0.29 0.19During free time: equal contacts 0.19 0.28 0.40 0.33During free time: more contact with Dutch 0.07 0.07 0.18 0.38At work: more contact with co-ethnics 0.08 0.06 0.03 0.03At work: equal contacts 0.23 0.22 0.19 0.09At work: more contact with Dutch 0.22 0.19 0.48 0.56No membership 0.77 0.83 0.65 0.64Ethnic org. membership 0.16 0.10 0.17 0.08Dutch org. membership 0.08 0.06 0.18 0.29Do not speak Dutch 0.38 0.29 0.03 0.04Dutch: not very well 0.42 0.43 0.12 0.23Dutch: very well 0.20 0.28 0.85 0.72
The social contacts and language variables are dichotomous with a value of either 0 or 1. Thefigures in the table are the percentage of respondents in the total sample that fit the descriptionof the first column within each ethnic group.Sample size: 13023.Source: SPVA 1991, 1994, 1998, 2002.
25
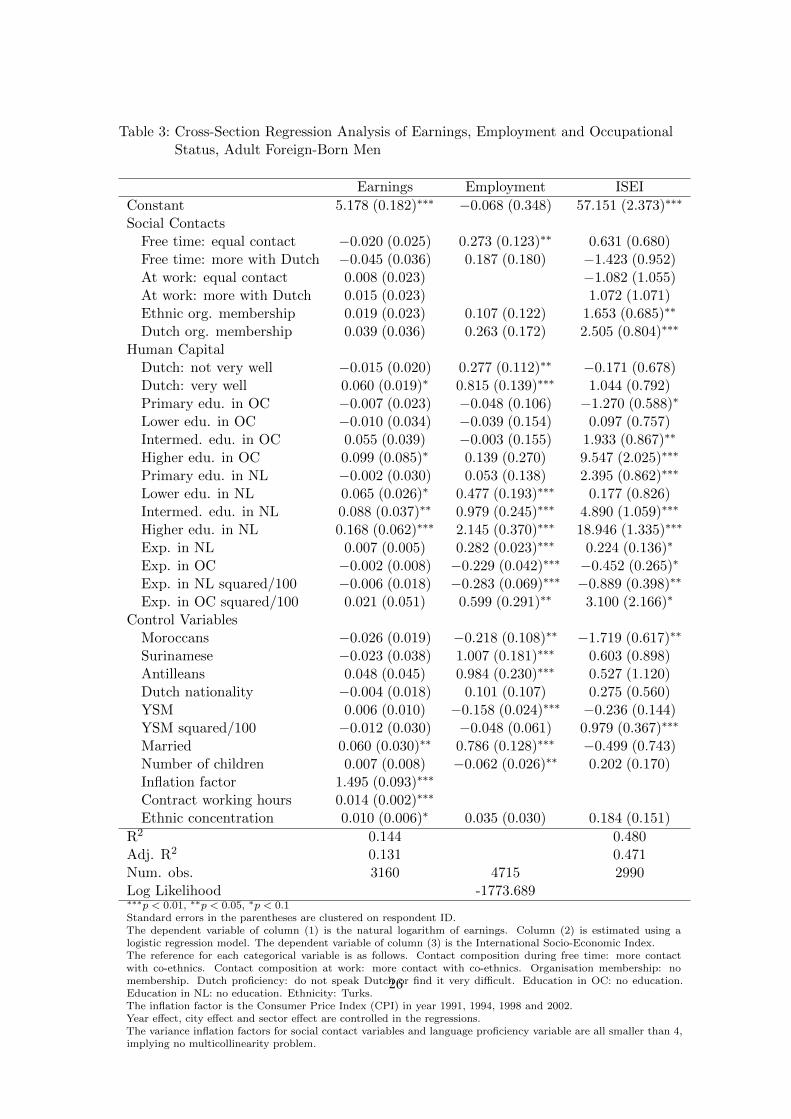
Table 3: Cross-Section Regression Analysis of Earnings, Employment and OccupationalStatus, Adult Foreign-Born Men
Earnings Employment ISEI
Constant 5.178 (0.182)∗∗∗ −0.068 (0.348) 57.151 (2.373)∗∗∗
Social ContactsFree time: equal contact −0.020 (0.025) 0.273 (0.123)∗∗ 0.631 (0.680)Free time: more with Dutch −0.045 (0.036) 0.187 (0.180) −1.423 (0.952)At work: equal contact 0.008 (0.023) −1.082 (1.055)At work: more with Dutch 0.015 (0.023) 1.072 (1.071)Ethnic org. membership 0.019 (0.023) 0.107 (0.122) 1.653 (0.685)∗∗
Dutch org. membership 0.039 (0.036) 0.263 (0.172) 2.505 (0.804)∗∗∗
Human CapitalDutch: not very well −0.015 (0.020) 0.277 (0.112)∗∗ −0.171 (0.678)Dutch: very well 0.060 (0.019)∗ 0.815 (0.139)∗∗∗ 1.044 (0.792)Primary edu. in OC −0.007 (0.023) −0.048 (0.106) −1.270 (0.588)∗
Lower edu. in OC −0.010 (0.034) −0.039 (0.154) 0.097 (0.757)Intermed. edu. in OC 0.055 (0.039) −0.003 (0.155) 1.933 (0.867)∗∗
Higher edu. in OC 0.099 (0.085)∗ 0.139 (0.270) 9.547 (2.025)∗∗∗
Primary edu. in NL −0.002 (0.030) 0.053 (0.138) 2.395 (0.862)∗∗∗
Lower edu. in NL 0.065 (0.026)∗ 0.477 (0.193)∗∗∗ 0.177 (0.826)Intermed. edu. in NL 0.088 (0.037)∗∗ 0.979 (0.245)∗∗∗ 4.890 (1.059)∗∗∗
Higher edu. in NL 0.168 (0.062)∗∗∗ 2.145 (0.370)∗∗∗ 18.946 (1.335)∗∗∗
Exp. in NL 0.007 (0.005) 0.282 (0.023)∗∗∗ 0.224 (0.136)∗
Exp. in OC −0.002 (0.008) −0.229 (0.042)∗∗∗ −0.452 (0.265)∗
Exp. in NL squared/100 −0.006 (0.018) −0.283 (0.069)∗∗∗ −0.889 (0.398)∗∗
Exp. in OC squared/100 0.021 (0.051) 0.599 (0.291)∗∗ 3.100 (2.166)∗
Control VariablesMoroccans −0.026 (0.019) −0.218 (0.108)∗∗ −1.719 (0.617)∗∗
Surinamese −0.023 (0.038) 1.007 (0.181)∗∗∗ 0.603 (0.898)Antilleans 0.048 (0.045) 0.984 (0.230)∗∗∗ 0.527 (1.120)Dutch nationality −0.004 (0.018) 0.101 (0.107) 0.275 (0.560)YSM 0.006 (0.010) −0.158 (0.024)∗∗∗ −0.236 (0.144)YSM squared/100 −0.012 (0.030) −0.048 (0.061) 0.979 (0.367)∗∗∗
Married 0.060 (0.030)∗∗ 0.786 (0.128)∗∗∗ −0.499 (0.743)Number of children 0.007 (0.008) −0.062 (0.026)∗∗ 0.202 (0.170)Inflation factor 1.495 (0.093)∗∗∗
Contract working hours 0.014 (0.002)∗∗∗
Ethnic concentration 0.010 (0.006)∗ 0.035 (0.030) 0.184 (0.151)R2 0.144 0.480Adj. R2 0.131 0.471Num. obs. 3160 4715 2990Log Likelihood -1773.689∗∗∗p < 0.01, ∗∗p < 0.05, ∗p < 0.1Standard errors in the parentheses are clustered on respondent ID.The dependent variable of column (1) is the natural logarithm of earnings. Column (2) is estimated using alogistic regression model. The dependent variable of column (3) is the International Socio-Economic Index.The reference for each categorical variable is as follows. Contact composition during free time: more contactwith co-ethnics. Contact composition at work: more contact with co-ethnics. Organisation membership: nomembership. Dutch proficiency: do not speak Dutch or find it very difficult. Education in OC: no education.Education in NL: no education. Ethnicity: Turks.The inflation factor is the Consumer Price Index (CPI) in year 1991, 1994, 1998 and 2002.Year effect, city effect and sector effect are controlled in the regressions.The variance inflation factors for social contact variables and language proficiency variable are all smaller than 4,implying no multicollinearity problem.
26

Table
4:
Longit
udin
al
Reg
ress
ion
Analy
sis
of
Earn
ings,
Adu
ltF
ore
ign-B
orn
Men
,A
llS
am
ple
Est
imati
on,
and
Gro
ups
by
Eth
nic
ity,
Edu
cati
on,
Age
At
Mig
rati
onan
dM
igra
tion
Mot
ives
All
T&
MS
&A
No
NL
Edu
.N
LE
du.
AA
M>
18A
AM≤
18
Eco
nN
on-E
con
Const
ant
0.09
10.
204∗∗
∗−
0.03
50.
196∗∗
∗−
0.23
80.
152∗
−0.
063
0.21
3−
0.04
5(0.0
76)
(0.0
69)
(0.1
57)
(0.0
58)
(0.1
99)
(0.0
89)
(0.1
62)
(0.1
44)
(0.0
72)
YSM
−0.
001−
0.01
1∗∗∗
0.00
8−
0.00
9∗∗∗
0.01
7∗−
0.00
60.
010
−0.
009
0.00
9∗∗
(0.0
04)
(0.0
04)
(0.0
07)
(0.0
03)
(0.0
09)
(0.0
05)
(0.0
08)
(0.0
07)
(0.0
04)
Fre
eti
me:
equ
al
conta
ct−
0.08
6−
0.13
7∗∗−
0.10
1−
0.07
1−
0.25
5−
0.13
1−
0.00
3−
0.10
9−
0.05
3(0.0
71)
(0.0
63)
(0.1
37)
(0.0
54)
(0.1
69)
(0.0
88)
(0.1
16)
(0.1
30)
(0.0
65)
Fre
eti
me:
more
wit
hD
utc
h−
0.15
9∗0.
107
−0.
376∗∗
0.09
4−
0.41
6∗∗−
0.22
0∗∗−
0.06
1−
0.22
4−
0.05
6(0.0
90)
(0.0
86)
(0.1
66)
(0.0
73)
(0.2
06)
(0.1
10)
(0.1
64)
(0.1
54)
(0.0
91)
At
wor
k:
equ
al
conta
ct0.
167∗∗
0.16
5∗∗0.
091
0.17
1∗∗∗
0.16
40.
228∗∗
−0.
030
0.31
0∗∗0.
008
(0.0
85)
(0.0
68)
(0.1
95)
(0.0
66)
(0.2
10)
(0.1
07)
(0.1
37)
(0.1
44)
(0.0
85)
At
wor
k:
more
wit
hD
utc
h0.
115
0.11
30.
030
0.15
3∗∗0.
011
0.15
5−
0.00
60.
188
0.00
7(0.0
83)
(0.0
73)
(0.1
68)
(0.0
68)
(0.1
83)
(0.1
05)
(0.1
32)
(0.1
43)
(0.0
81)
Eth
nic
org
.m
emb
ersh
ip−
0.03
6−
0.04
90.
038
−0.
035
0.05
6−
0.06
30.
012
−0.
136
0.05
8(0.0
85)
(0.0
68)
(0.1
85)
(0.0
60)
(0.2
70)
(0.0
96)
(0.2
10)
(0.1
59)
(0.0
78)
Dutc
horg
.m
emb
ersh
ip0.
055
−0.
001
0.07
50.
065
0.11
4−
0.06
30.
269∗∗
−0.
091
0.15
9∗∗
(0.0
79)
(0.0
92)
(0.1
24)
(0.0
64)
(0.1
65)
(0.1
03)
(0.1
23)
(0.1
45)
(0.0
73)
Dutc
h:
not
very
wel
l−
0.05
9−
0.01
9−
0.06
3−
0.02
6−
0.01
9−
0.06
4−
0.02
7−
0.09
6−
0.01
0(0.0
41)
(0.0
40)
(0.1
01)
(0.0
31)
(0.1
18)
(0.0
50)
(0.0
73)
(0.0
70)
(0.0
40)
Dutc
h:
very
wel
l0.
155∗∗
0.14
7∗∗0.
116
0.19
0∗∗∗
0.10
00.
194∗∗
0.14
50.
240∗
0.10
0(0.0
72)
(0.0
63)
(0.1
39)
(0.0
56)
(0.1
61)
(0.0
92)
(0.1
11)
(0.1
27)
(0.0
69)
R2
0.03
00.
133
0.04
10.
113
0.06
40.
046
0.0
680.0
57
0.06
4A
dj.
R2
0.00
60.
091
-0.0
090.
078
-0.0
10
0.01
4-0
.017
0.01
10.
017
Num
.ob
s.46
824
422
429
6152
335
133
238
230
∗∗∗p<
0.01
,∗∗p<
0.05
,∗p<
0.1
Sta
nd
ard
erro
rsare
inth
ep
are
nth
eses
.T
he
dep
enden
tvari
ab
leis
the
diff
eren
ceb
etw
een
the
natu
ral
logari
thm
of
earn
ings
ad
just
edfo
rin
flati
on
inti
me
2an
dti
me
1.
Colu
mn
(1)
‘All’
isth
ees
tim
ati
on
for
the
whole
sam
ple
.C
olu
mn
(2)
‘T&
M’
isth
ees
tim
ati
on
for
the
Med
iter
ran
ean
gro
up
(Tu
rks
an
dM
oro
ccan
s),
an
dco
lum
n(3
)‘S
&A
’is
the
esti
mati
on
for
the
Cari
bb
ean
gro
up
(Su
rin
am
ese
and
Anti
llea
ns)
.C
olu
mn
(4)
‘No
NL
Edu
.’is
the
esti
mati
on
for
imm
igra
nts
wh
oco
mple
ted
thei
red
uca
tion
inth
eco
untr
yof
ori
gin
,and
colu
mn
(5)
‘NL
Edu
.’is
the
esti
mati
on
for
imm
igra
nts
wh
oco
mp
lete
ded
uca
tion
inth
eN
eth
erla
nds.
Colu
mn
(6)
‘AA
M>
18’
isth
ees
tim
ati
on
for
imm
igra
nts
wh
ose
age
at
mig
rati
on
(AA
M)
isold
erth
an
18,
an
dco
lum
n(7
)‘A
AM
≤18’
isth
ees
tim
ati
on
for
imm
igra
nts
wh
ose
age
at
mig
rati
on
(AA
M)
isyou
nger
than
18.
Colu
mn
(8)
‘Eco
n’
isth
ees
tim
ati
on
for
the
econ
om
icm
igra
nts
,an
dco
lum
n(9
)‘N
on
-Eco
n’
isth
ees
tim
ati
on
for
the
non-e
conom
icm
igra
nts
.T
he
refe
ren
cefo
rea
chca
tegori
cal
vari
ab
leis
as
follow
s.C
onta
ctco
mp
osi
tion
du
rin
gfr
eeti
me:
more
conta
ctw
ith
co-e
thn
ics.
Conta
ctco
mp
osi
tion
at
work
:m
ore
conta
ctw
ith
co-e
thnic
s.O
rgan
isati
on
mem
ber
ship
:n
om
emb
ersh
ip.
Du
tch
pro
fici
ency
:d
on
ot
spea
kD
utc
hor
fin
dit
ver
yd
ifficu
lt.
Edu
cati
on
inO
C:
no
edu
cati
on
.E
du
cati
on
inN
L:
no
edu
cati
on
.E
thn
icit
y:
Tu
rks.
The
vari
an
cein
flati
on
fact
ors
for
soci
al
conta
ctvari
ab
les
an
dla
ngu
age
pro
fici
ency
vari
able
are
all
smaller
than
4,
imp
lyin
gn
om
ult
icollin
eari
typro
ble
m.
27

Appendix
Table A1: The Definitions and Coding of the Variables in ‘Social Position and Use of
Public Facilities by Immigrants’ (SPVA)
Variables Questions asked in the survey and coding
Earnings ‘What is your net monthly income from employment?’
In year 2002, the currency changed from Dutch guilders
to Euros. The exchange ratio 2.2:1 is used to unify
the monetary unit across four waves.
Employed now ‘Do you have a paid job at the moment?’
0-No;
1-Yes.
Occupations ‘What kind of work are you doing at the moment?’
The answers are coded either as International Standard
Classification of Occupations (ISCO-88) or Standaard
Beroepenclassificatie 1992 (SBC 1992) in Dutch code.
Contract working hours ‘How many hours do you work according to your employment
contract?’
Education in OC ‘What is the highest degree you have completed in your
country of origin?’
0-No degree;
1-Degree in primary education (LO);
2-Degree in secondary education (LBO/MAVO);
3-Degree in intermediate education (MBO/HAVO/VWO);
4-Degree in higher education (HBO/WO).
This question was originally asked in the survey as the
degree completed outside Netherlands. Since pre-migration
human capital is not the main focus of this paper, we
assume most of the schooling is completed in the country
of origin.
Education in NL ‘What is the highest degree you have completed in
the Netherlands?’
0-No degree;
1-Degree in primary education (LO);
2-Degree in secondary education (LBO/MAVO);
Continued on next page
28

Table A1 – continued from previous page
Variables Questions asked in the survey and coding
3-Degree in intermediate education (MBO/HAVO/VWO);
4-Degree in higher education (HBO/WO).
Work experience in OC ‘How long have you been in paid work in total in
country of origin?’
This question was asked only in the 1991
questionnaires. To supplement this variable in
the other three waves, we regress reported 1991
work experience in OC on individual background
characteristics (gender, age, years since migration,
total education, etc) and predict values for the other
three waves.
Work experience in NL ‘How long have you worked in total in the Netherlands?’
Dutch language ‘When you are in a conversation, do you have any
proficiency difficulty in using Dutch language?’
0-Yes, very difficult/ do not speak Dutch at all;
1-Yes, sometimes;
2-No, never.
Contact composition ‘In your spare time, do you have more contact with
during free time Dutch people or do you have more contact with people
from your own ethnic group?’
1-More co-ethnic contact;
2-Both equally;
3-More contact with Dutch people.
Contact composition ‘At work, do you have more contact with
at work Dutch people or do you have more contact with people
from your own ethnic group?’
1-More co-ethnic contact;
2-Both equally;
3-More contact with Dutch people.
This variable is not recorded in 2002. Similar with
what has been done for work experience in OC, we use
the regression technique to predict this variable in 2002.
Organisation membership Q1: ‘Are you a member of an association or club?’
Continued on next page
29

Table A1 – continued from previous page
Variables Questions asked in the survey and coding
0-No;
1-Yes.
Q2: ‘Are there many, few or almost no co-ethnic
members of these associations?’
0-Almost no;
1-Few;
2-Many.
Ethnicity ‘What is your ethnic group?’
1-Turks;
2-Moroccans;
3-Surinamese;
4-Antilleans.
Municipality Registered residence municipality
1-Amsterdam; 2-Rotterdam; 3-Den Haag; 4-Utrecht;
5-Eindhoven; 6-Enschede; 7-Almere; 8-Alphen aan den Rijn;
9-Bergen op Zoom; 10-Hoogezand-Sappemeer; 11-Delft;
12-Dordrecht; 13-Tiel.
Leeuwarden, Spijkenisse, Zwijndrecht and Gornichem are
recoded in SPVA 1991, but not in other waves. And hence
we drop the observations in these municipalities.
Nationality ‘What is your nationality?’
1-Origin country’s nationality;
2-Dutch nationality;
3-Both the origin country’s and Dutch nationalities;
4-Others.
The answers are recoded to a dichotomous variable
which equals 1 if the respondent reported having
Dutch nationality, and 0 otherwise.
Married ‘What is your marital status?’
1-Married; 2-Divorced; 3-Widow/widower;
4-Never been married.
Number of children ‘How many children are there living at home?’
‘How many children are not living at home?’
Continued on next page
30

Table A1 – continued from previous page
Variables Questions asked in the survey and coding
These two answers are summed up.
Years since migration ‘What is your length of stay in the Netherlands?’
Migration motives ‘You are not born in the Netherlands. What was the main
reason for coming to the Netherlands?’
1-Work; 2-Study; 3-Social safety;
4-Political situation in origin country; 5-Family reunion;
6-Marriage, family formation; 7-Come along with parents;
8-Others.
The answers are recoded to four main categories: work,
study, family and other reasons.
31

Table
A2:
Rand
om
Eff
ects
Logis
tic
Est
imati
on
of
Em
plo
ym
ent
Usi
ng
Pan
elD
ata
,A
du
ltF
ore
ign-B
orn
Men
,A
llSam
ple
Est
imat
ion
,an
dG
rou
ps
by
Eth
nic
ity,
Ed
uca
tion
,A
geA
tM
igra
tion
and
Mig
rati
onM
otiv
es
All
T&
MS&
AN
oN
LE
du
.N
LE
du
.A
AM>
18A
AM≤
18
Eco
nN
on-E
con
Const
ant
1.18
71.
694∗
1.89
21.
400
2.73
71.
420
0.83
60.
724
0.91
7(0.7
45)
(0.9
08)
(2.7
54)
(0.8
58)
(2.2
27)
(0.9
03)
(1.7
29)
(1.1
64)
(1.1
00)
Soci
al
Conta
cts
Fre
eti
me:
equ
al
conta
ct0.
126
0.10
7−
0.31
9−
0.01
10.
549
0.00
40.
306
−0.
090
0.39
2(0.3
39)
(0.3
82)
(0.8
02)
(0.3
81)
(0.8
28)
(0.4
05)
(0.7
23)
(0.5
26)
(0.4
91)
Fre
eti
me:
mor
ew
ith
Du
tch
−0.
019
−0.
265
−0.
100
0.20
0−
0.16
20.
176
−1.
019
−0.
053
0.19
3(0.4
80)
(0.5
89)
(0.9
23)
(0.5
77)
(0.9
45)
(0.5
81)
(1.0
36)
(0.6
99)
(0.7
31)
Eth
nic
org.
mem
ber
ship
0.06
30.
226
−0.
410
0.18
00.
439
−0.
203
0.57
10.
319
−0.
043
(0.3
25)
(0.3
61)
(0.8
16)
(0.3
67)
(0.8
24)
(0.3
83)
(0.7
26)
(0.5
12)
(0.4
61)
Dutc
hor
g.m
emb
ersh
ip1.
595∗∗
∗1.
664∗∗
1.24
52.
300∗∗
∗0.
573
2.45
4∗∗∗
0.92
42.
484∗∗
1.22
4∗
(0.5
45)
(0.6
69)
(0.9
33)
(0.7
99)
(0.7
78)
(0.8
93)
(0.8
37)
(0.9
98)
(0.7
15)
Hum
anC
ap
ital
Dutc
h:
not
very
wel
l0.
563∗
0.63
4∗∗−
0.90
60.
553∗
0.27
60.
743∗∗
0.34
50.
911∗∗
0.10
9(0.2
89)
(0.3
02)
(1.9
32)
(0.3
06)
(1.0
36)
(0.3
40)
(0.7
09)
(0.4
51)
(0.4
39)
Dutc
h:
very
wel
l1.
119∗∗
∗1.
024∗∗
−0.
079
0.80
7∗1.
424
0.86
5∗2.
136∗∗
0.95
70.
796
(0.3
75)
(0.4
06)
(1.7
91)
(0.4
19)
(1.0
09)
(0.4
84)
(0.8
76)
(0.6
16)
(0.5
27)
S.D
.of
the
Model
σ−
2.24
1∗∗∗−
2.36
3∗∗∗−
1.32
2−
2.15
9∗∗∗
0.94
7−
2.31
8∗∗∗−
2.01
7∗∗2.
633∗∗
∗−
2.02
9∗∗∗
(0.4
12)
(0.4
58)
(1.3
15)
(0.4
78)
(2.3
38)
(0.5
10)
(1.0
10)
(0.7
18)
(0.7
25)
Log
-lik
elih
ood
-431
.286
-362
.354
-61.
823
-340
.801
-60.
437
-315
.755
-97.
889
-226.
230
-191.
787
Num
.ob
s.13
6889
447
495
1343
997
344
727
641
∗∗∗p<
0.01
,∗∗p<
0.05
,∗p<
0.1
Sta
nd
ard
erro
rsare
inth
ep
are
nth
eses
.T
he
dep
enden
tvari
ab
leis
ad
ich
oto
mou
svari
ab
lefo
rb
ein
gem
plo
yed
or
not.
Colu
mn
(1)
‘All’
isth
ees
tim
ati
on
for
the
whole
sam
ple
.C
olu
mn
(2)
‘T&
M’
isth
ees
tim
ati
on
for
the
Med
iter
ran
ean
gro
up
(Tu
rks
an
dM
oro
ccan
s),
an
dco
lum
n(3
)‘S
&A
’is
the
esti
mati
on
for
the
Cari
bb
ean
gro
up
(Su
rin
am
ese
and
Anti
llea
ns)
.C
olu
mn
(4)
‘No
NL
Edu
.’is
the
esti
mati
on
for
imm
igra
nts
wh
oco
mple
ted
thei
red
uca
tion
inth
eco
untr
yof
ori
gin
,and
colu
mn
(5)
‘NL
Edu
.’is
the
esti
mati
on
for
imm
igra
nts
wh
oco
mp
lete
ded
uca
tion
inth
eN
eth
erla
nds.
Colu
mn
(6)
‘AA
M>
18’
isth
ees
tim
ati
on
for
imm
igra
nts
wh
ose
age
at
mig
rati
on
(AA
M)
isold
erth
an
18,
an
dco
lum
n(7
)‘A
AM
≤18’
isth
ees
tim
ati
on
for
imm
igra
nts
wh
ose
age
at
mig
rati
on
(AA
M)
isyou
nger
than
18.
Colu
mn
(8)
‘Eco
n’
isth
ees
tim
ati
on
for
the
econ
om
icm
igra
nts
,an
dco
lum
n(9
)‘N
on
-Eco
n’
isth
ees
tim
ati
on
for
the
non-e
conom
icm
igra
nts
.T
he
refe
rence
for
each
cate
gori
cal
vari
ab
leis
as
follow
s.C
onta
ctco
mp
osi
tion
du
ring
free
tim
e:m
ore
conta
ctw
ith
co-e
thn
ics.
Org
an
isati
on
mem
ber
ship
:n
om
emb
ersh
ip.
Du
tch
pro
fici
ency
:d
onot
spea
kD
utc
hor
fin
dit
ver
yd
ifficu
lt.
σis
the
esti
mate
dra
nd
om
effec
ts’
stand
ard
dev
iati
on
.T
he
nu
llhyp
oth
esis
isn
ora
nd
om
effec
t(σ
=0)
.O
ther
hum
an
cap
ital
vari
ab
les
not
show
nin
the
tab
lein
clu
de
hig
hes
ted
uca
tion
level
,w
ork
ing
exp
erie
nce
inth
eco
untr
yof
ori
gin
and
work
ing
exp
erie
nce
inth
eN
eth
erla
nd
s.O
ther
contr
olvari
ab
les
not
show
nin
the
table
incl
ud
eet
hn
icit
y,yea
rssi
nce
mig
rati
on
,m
ari
talst
atu
s,num
ber
of
child
ren
,and
the
eth
nic
con
centr
ati
on
level
.T
he
vari
an
cein
flati
on
fact
ors
for
soci
al
conta
ctvari
ab
les
an
dla
ngu
age
pro
fici
ency
vari
able
are
all
smaller
than
4,
imp
lyin
gn
om
ult
icollin
eari
typro
ble
m.
32
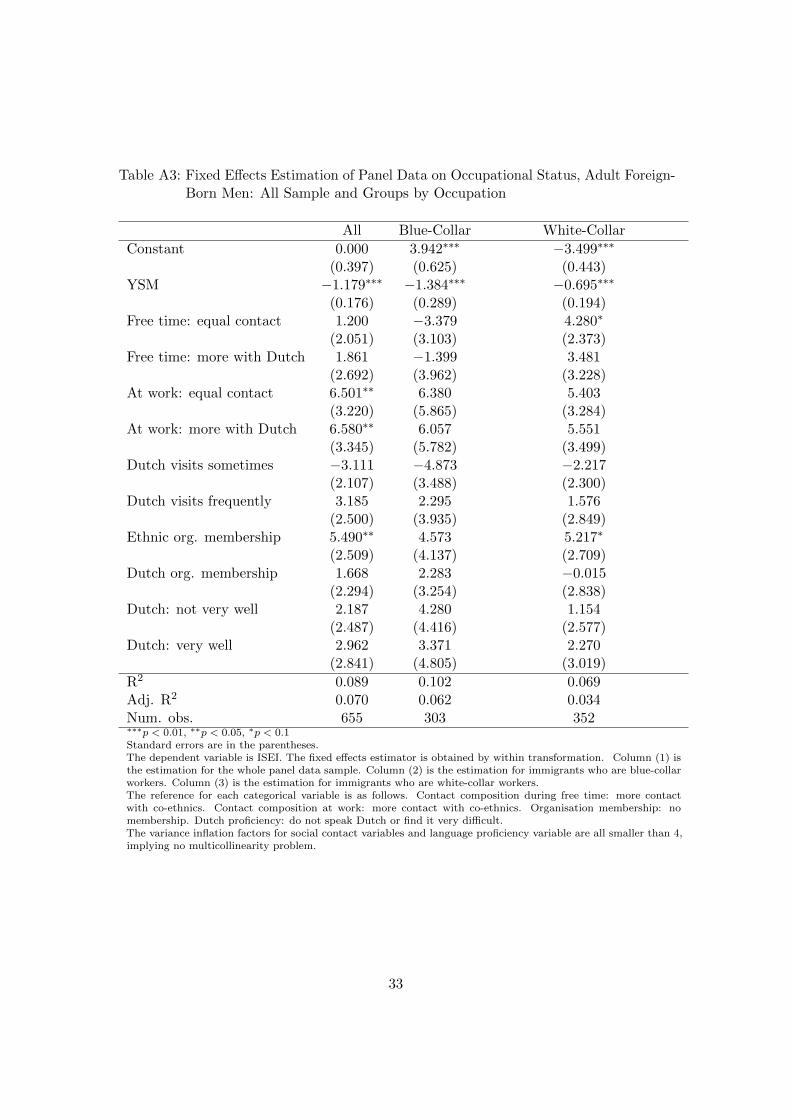
Table A3: Fixed Effects Estimation of Panel Data on Occupational Status, Adult Foreign-Born Men: All Sample and Groups by Occupation
All Blue-Collar White-Collar
Constant 0.000 3.942∗∗∗ −3.499∗∗∗
(0.397) (0.625) (0.443)YSM −1.179∗∗∗ −1.384∗∗∗ −0.695∗∗∗
(0.176) (0.289) (0.194)Free time: equal contact 1.200 −3.379 4.280∗
(2.051) (3.103) (2.373)Free time: more with Dutch 1.861 −1.399 3.481
(2.692) (3.962) (3.228)At work: equal contact 6.501∗∗ 6.380 5.403
(3.220) (5.865) (3.284)At work: more with Dutch 6.580∗∗ 6.057 5.551
(3.345) (5.782) (3.499)Dutch visits sometimes −3.111 −4.873 −2.217
(2.107) (3.488) (2.300)Dutch visits frequently 3.185 2.295 1.576
(2.500) (3.935) (2.849)Ethnic org. membership 5.490∗∗ 4.573 5.217∗
(2.509) (4.137) (2.709)Dutch org. membership 1.668 2.283 −0.015
(2.294) (3.254) (2.838)Dutch: not very well 2.187 4.280 1.154
(2.487) (4.416) (2.577)Dutch: very well 2.962 3.371 2.270
(2.841) (4.805) (3.019)R2 0.089 0.102 0.069Adj. R2 0.070 0.062 0.034Num. obs. 655 303 352∗∗∗p < 0.01, ∗∗p < 0.05, ∗p < 0.1Standard errors are in the parentheses.The dependent variable is ISEI. The fixed effects estimator is obtained by within transformation. Column (1) isthe estimation for the whole panel data sample. Column (2) is the estimation for immigrants who are blue-collarworkers. Column (3) is the estimation for immigrants who are white-collar workers.The reference for each categorical variable is as follows. Contact composition during free time: more contactwith co-ethnics. Contact composition at work: more contact with co-ethnics. Organisation membership: nomembership. Dutch proficiency: do not speak Dutch or find it very difficult.The variance inflation factors for social contact variables and language proficiency variable are all smaller than 4,implying no multicollinearity problem.
33

Table A4: Heckman Selection Model for Earnings, Employment, and Occupational Status,Adult Foreign-Born Men
Earnings Employment ISEI
Constant 4.884 (0.839)∗∗∗ 0.938 (0.152)∗∗∗ 24.227 (5.853)∗∗∗
Social ContactsFree time: equal contact −0.018 (0.066) 0.030 (0.031) 1.722 (1.606)Free time: more with Dutch −0.061 (0.078) −0.024 (0.041) 0.595 (2.091)At work: equal contact 0.030 (0.077) −0.768 (2.754)At work: more with Dutch 0.016 (0.074) 0.427 (2.162)Ethnic org. membership 0.074 (0.063) 0.036 (0.031) 3.613 (1.684)∗∗
Dutch org. membership 0.143 (0.062)∗∗ 0.010 (0.034) 2.561 (1.652)Human Capital
Dutch: not very well 0.037 (0.062) 0.079 (0.029)∗∗∗ −0.760 (1.607)Dutch: very well 0.115 (0.076) 0.162 (0.037)∗∗∗ 2.393 (1.952)Primary edu. in OC −0.024 (0.054) −0.012 (0.026) −2.822 (1.339)∗∗
Lower edu. in OC 0.033 (0.067) 0.033 (0.036) −0.418 (1.692)Intermed. edu. in OC 0.072 (0.075) −0.011 (0.037) −0.512 (1.847)Higher edu. in OC −0.142 (0.120) −0.029 (0.060) 13.468 (2.919)∗∗∗
Primary edu. in NL −0.079 (0.070) 0.006 (0.035) 1.759 (2.003)Lower edu. in NL 0.018 (0.089) 0.080 (0.045)∗ −3.201 (2.903)Intermed. edu. in NL 0.160 (0.113) 0.097 (0.055)∗ 4.164 (3.169)Higher edu. in NL −0.139 (0.097) 0.191 (0.052)∗∗∗ 16.141 (2.962)∗∗∗
Exp. in NL 0.004 (0.012) 0.035 (0.005)∗∗∗ −0.133 (0.288)Exp. in OC −0.014 (0.019) −0.040 (0.009)∗∗∗ −0.737 (0.493)Exp. in NL squared/100 −0.019 (0.037) −0.024 (0.016) −0.398 (0.862)Exp. in OC squared/100 0.129 (0.139) 0.165 (0.068)∗∗ 5.378 (3.592)
Control VariablesMoroccans −0.005 (0.071) −0.014 (0.031) −2.837 (1.639)∗
Surinamese 0.017 (0.096) 0.061 (0.045) 2.433 (2.301)Antilleans −0.010 (0.091) 0.107 (0.048)∗∗ 4.388 (2.346)∗
Dutch nationality 0.000 (0.052) 0.047 (0.025)∗ −1.492 (1.298)YSM −0.005 (0.019) −0.038 (0.008)∗∗∗ 0.264 (0.437)YSM squared/100 0.023 (0.046) 0.024 (0.021) 0.106 (1.193)Married 0.140 (0.063)∗∗ 0.056 (0.033)∗ 0.589 (1.536)Number of children 0.014 (0.014) 0.001 (0.007) 0.481 (0.368)Inflation factor 1.764 (0.825)∗∗
Contract working hours 0.014 (0.003)∗∗∗
Ethnic concentration 0.006 (0.016) 0.011 (0.009) 0.462 (0.459)Selectivity Coefficient
Inverse Mill’s ratio −0.094 (0.361) −0.232 (0.172) −1.212 (9.379)R squared 0.070 0.250 0.400Adj. R squared 0.050 0.240 0.380Num. obs. 3155 4708 3490∗∗∗p < 0.01, ∗∗p < 0.05, ∗p < 0.1Standard errors are in the parentheses.The dependent variable of column (1) is the natural logarithm of earnings. Column (2) is estimated using a linearprobability model. The dependent variable of column (3) is ISEI.The reference for each categorical variable is as follows. Contact composition during free time: more contactwith co-ethnics. Contact composition at work: more contact with co-ethnics. Organisation membership: nomembership. Dutch proficiency: do not speak Dutch or find it very difficult. Education in OC: no education.Education in NL: no education. Ethnicity: Turks.The inflation factor is the Consumer Price Index (CPI) in year 1991, 1994, 1998 and 2002.Year effect, city effect and sector effect are controlled in the regressions.For inverse Mill’s ratio, the null hypothesis is that there is no selection bias.
34
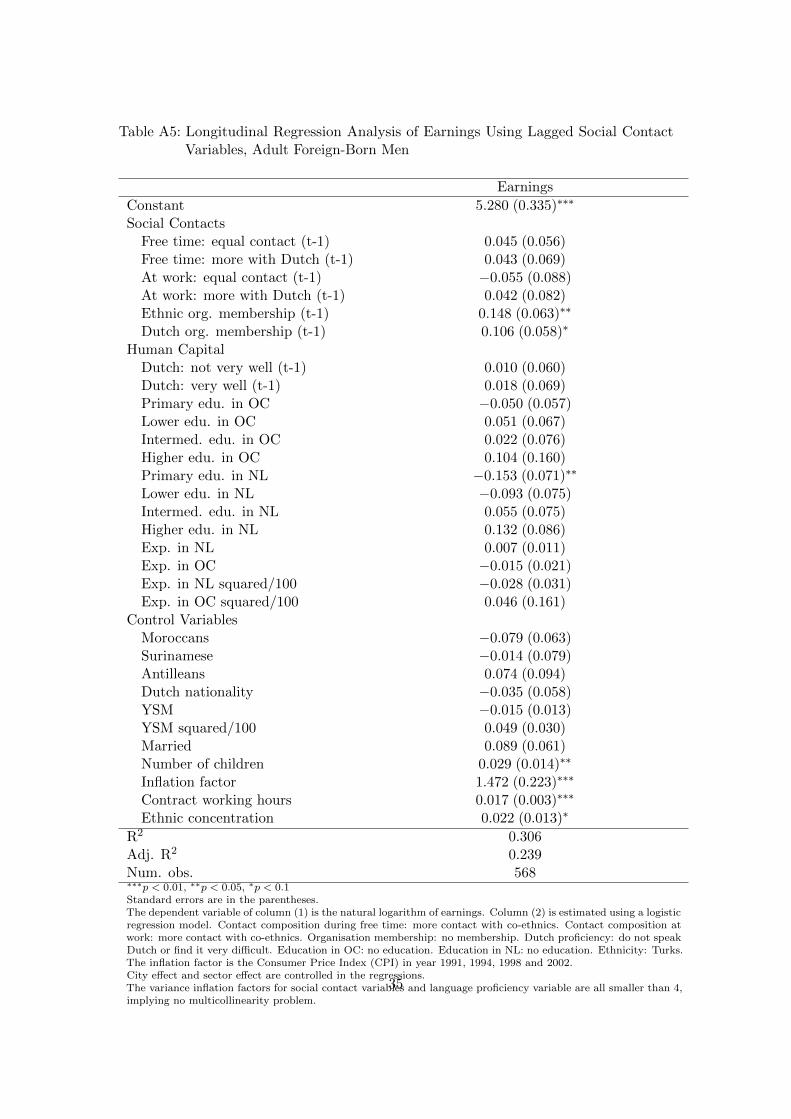
Table A5: Longitudinal Regression Analysis of Earnings Using Lagged Social ContactVariables, Adult Foreign-Born Men
Earnings
Constant 5.280 (0.335)∗∗∗
Social ContactsFree time: equal contact (t-1) 0.045 (0.056)Free time: more with Dutch (t-1) 0.043 (0.069)At work: equal contact (t-1) −0.055 (0.088)At work: more with Dutch (t-1) 0.042 (0.082)Ethnic org. membership (t-1) 0.148 (0.063)∗∗
Dutch org. membership (t-1) 0.106 (0.058)∗
Human CapitalDutch: not very well (t-1) 0.010 (0.060)Dutch: very well (t-1) 0.018 (0.069)Primary edu. in OC −0.050 (0.057)Lower edu. in OC 0.051 (0.067)Intermed. edu. in OC 0.022 (0.076)Higher edu. in OC 0.104 (0.160)Primary edu. in NL −0.153 (0.071)∗∗
Lower edu. in NL −0.093 (0.075)Intermed. edu. in NL 0.055 (0.075)Higher edu. in NL 0.132 (0.086)Exp. in NL 0.007 (0.011)Exp. in OC −0.015 (0.021)Exp. in NL squared/100 −0.028 (0.031)Exp. in OC squared/100 0.046 (0.161)
Control VariablesMoroccans −0.079 (0.063)Surinamese −0.014 (0.079)Antilleans 0.074 (0.094)Dutch nationality −0.035 (0.058)YSM −0.015 (0.013)YSM squared/100 0.049 (0.030)Married 0.089 (0.061)Number of children 0.029 (0.014)∗∗
Inflation factor 1.472 (0.223)∗∗∗
Contract working hours 0.017 (0.003)∗∗∗
Ethnic concentration 0.022 (0.013)∗
R2 0.306Adj. R2 0.239Num. obs. 568∗∗∗p < 0.01, ∗∗p < 0.05, ∗p < 0.1Standard errors are in the parentheses.The dependent variable of column (1) is the natural logarithm of earnings. Column (2) is estimated using a logisticregression model. Contact composition during free time: more contact with co-ethnics. Contact composition atwork: more contact with co-ethnics. Organisation membership: no membership. Dutch proficiency: do not speakDutch or find it very difficult. Education in OC: no education. Education in NL: no education. Ethnicity: Turks.The inflation factor is the Consumer Price Index (CPI) in year 1991, 1994, 1998 and 2002.City effect and sector effect are controlled in the regressions.The variance inflation factors for social contact variables and language proficiency variable are all smaller than 4,implying no multicollinearity problem.
35