social comparisons in peer effects › ~sem012 › pdfs › social_comparisons_m… · social...
TRANSCRIPT
Social Comparisons in Peer Effects∗
Jason Bigenho† Seung-Keun Martinez‡
This Version: November 18, 2018Current Version: Click Here
Abstract
Even without material incentives for coordination or learning, previous studiesdemonstrate the importance of social interactions in individual decision making. How-ever, identifying why conformity arises absent explicit incentives faces the challengethat any rationalizing theory must rely on unobservable preferences or beliefs. There-fore, empirical distinction requires theories that make predictions beyond the basicdynamic of conformity. To that end, we propose and test a theory of self signaling inpeer effects. The model generates (partial) conformity as a response to how others’choices inform one’s own self-image. The mechanism of self-signaling for peer effectsdelivers unique, falsifiable predictions that we test experimentally. The theory predictsthat the anticipation of learning others’ choices and the garbling of information on oth-ers’ choices will both deeply influence behavior. In two real-effort lab experiments wenot only find treatment effects closely in line with the model’s unique predictions, butalso document the importance of self image in social comparisons.
∗We are grateful for the insightful comments of many colleagues and advisors. Special thanks are dueto Jim Andreoni, Brendan Beare, Michael Callen, Yan Chen, Julie Cullen, Uri Gneezy, Seth Hill, ThadKousser, Mark Machina, Joel Sobel, Alexis Toda, and Joel Watson. We are particularly indebted to ouradvisors Charles Sprenger and Gordon Dahl. Funding for the project was provided by the National ScienceFoundation.
†Amazon.com, Inc.‡University of California San Diego, Department of Economics
1 IntroductionThe importance of social information in individual decision making is well documented.
Not only do individuals learn from their peers when making decisions over new and unfamiliaropportunities (Foster and Rosenzweig, 1995; Duflo and Saez, 2002; Bursztyn et al., 2014; Dahlet al., 2014), but they also converge to behavioral conformity in the work place (Mas andMoretti, 2009; Bandiera et al., 2010) and in the classroom (Hoxby, 2000; Sacerdote, 2001;Zimmerman, 2003; Bursztyn et al., 2017). While material incentives for coordination orreliance on social information for uncertainty resolution can explain some instances of socialconformity (Katz and Shapiro, 1986; Banerjee, 1992; Foster and Rosenzweig, 1995), previousresearch demonstrates the importance of social influence that is not predicted by neo-classicaltheories (Frey and Meier, 2004; Falk and Ichino, 2006; Goette et al., 2006; Alpizar et al.,2008; Mas and Moretti, 2009; Shang and Croson, 2009; Chen et al., 2010).
Distinguishing between plausible mechanisms for conformity in the absence of explicitincentives faces a natural challenge. If incentives are unobservable, any rationalizing the-ory will necessarily rely on unobservable preferences or beliefs. For example, a commonexplanation for such peer effects is adherence to social norms. These theories are typicallydriven by the stigma of deviating from a socially prescribed action (Akerlof, 1980; Jones,1984; Akerlof and Kranton, 2000) or by individuals pooling at a common action to signal anoptimal social type (Bernheim, 1994).1 While we may be able to observe individuals makesimilar choices, it is difficult to observe whether they do so specifically because it is expectedof them. Therefore, theories of peer effects are empirically distinguishable only if they differin their predictions beyond the basic dynamic of conformity begetting further conformity.In this project we propose and experimentally test a theory of (partial) social conformity inthe absence of a socially optimal action. Building on Bénabou and Tirole (2006), our theoryproduces novel predictions on how decision makers differentiate between peer behavior thatis relevant or irrelevant to their own decisions. Further, we introduce a theoretical foundationand experimental test for self image as a mechanism underlying peer effects.
Our theory posits that individuals have an intrinsic desire to judge and evaluate them-selves. That is, each person would like to perceive himself positively—for example, as dili-gent, intelligent, and charitable. However, individuals often lack a direct or objective meansof self evaluation. Instead, they rely on their history of actions as a noisy signal of their at-tributes. This theory requires no predetermined socially optimal action. Rather, self-imageis increasing in the performance of a costly action. Under these assumptions an individualfaces intrinsic incentives to manipulate his personal image through his actions. Further,signal extraction is improved when he observes others performing similar tasks—i.e. socialcomparisons allow him to better understand the image implications of his own choices.
In the context of this signal extraction, we prove that if self image is increasing in one’sown performance and decreasing in peer performance, then diminishing marginal utility overself image will produce positive peer effects. Intuitively, concave image utility implies theshame of learning you are the lowest social type is greater than the pleasure of learning youare the highest social type. As such, individuals are content following the majority. Moreconcretely, consider a group of employees working on an unfamiliar task under a fixed-wage
1Bernheim and Exley (2015) explore an alternative explanation for social conformity that establishespreference mechanisms that drive instances of social conformity. Our project explores a belief mechanism.
1
spot contract that offers no incentives for collusion on effort.2 Why would an employeecondition his own output on the observed output of a peer? Suppose that each employeewishes to perceive himself as hard-working but is unsure how to judge his performance. Ifeach employee draws comparisons with peer output to better understand whether his outputsuggests diligence or laziness, then our theory establishes that a group of employees willconform in output when each individual abhors being the laziest group member more thanhe enjoys being the most diligent.
Modeling social comparisons as self signaling offers novel predictions beyond the basicdynamic of conformity. First, our theory predicts that responsiveness to peer behavior ismediated by how much an increase in peer performance depresses one’s own self image.Further, the signal a peer’s choice provides is refined in the similarity of a task’s incentivesand costs. Therefore, dissimilarity in peer environments acts as signal interference anddiminishes behavioral convergence. For example, suppose an individual observes that hiscoworkers are donating some proportion of their holiday bonuses to charity. He will then feelless compelled to donate to charity himself if he suspects that he received a smaller bonusthan most of his colleagues.
Second, our model predicts individuals will make more costly but more image-enhancingchoices in anticipation of social information. In the context of our previous example, supposethat no one observes his coworkers’ donations before he chooses his own donation. In ourmodel, a donor’s potential marginal utility loss from learning all his coworkers gave more thanhim is greater than the potential utility gain of learning he gave more than his coworkers.Therefore, each donor hedges against bad news and gives more if he knows we will eventuallylearn his coworkers’ donations.
The experiments in this project corroborate our theory’s predictions on self-signaling-produced conformity and peer-group formation. The first experiment uses the model’s socialinformation anticipation prediction to test the relevance of self image in peer effects. Specif-ically, we test whether individuals are willing to transcribe more blurry images of text inexchange for charitable donations if they know they will learn the distribution of previousparticipant choices than when they know they will remain uninformed. Importantly, allparticipants commit to how many of these transcriptions they are willing to complete priorto learning any information on how their decisions compare to the decisions of others. Boththose who will and will not be shown the distribution of others’ decisions must predict wheretheir decision lies in the distribution of all previous choices. Subjects are also informed ofexactly what the experimenter observes–the full anonymous distribution of all participantchoices–in both treatment and baseline. Therefore, we ensure that any treatment effect isdriven entirely by each participant’s anticipation of learning how his choice compares to thedecisions of others and not by what anyone else learns.3 In accordance with our theory’spredictions, we find that participants are willing to do more tasks when they anticipatelearning how their decisions compare to the decisions of previous participants
The second experiment tests whether a noisier signal mitigates peer effects by statisticallygarbling the information peer behavior provides. Documenting that decision makers are less
2Previous experiments have documented peer effects under such conditions (Falk and Ichino, 2006).3To that end, subjects did not learn the choices of others in their sessions, and subjects in both treatment
and baseline are informed that the anonymous distribution of previous participant choices may be used infuture experiment sessions.
2
responsive to less precise signals is an important result of this project. Our theory relieson individuals using peer behavior as part of a signal extraction to better understand theimage implications of their own choices. Further, it posits that dissimilarity in the incentivesand costs that decision makers face will cloud what one decision maker can learn froman other’s choices—thereby reducing conformity in behavior. However, for this theory tobe plausible the basic dynamics of signal extraction must hold. Our second experimentdemonstrates that participants are highly sensitive to the receipt of a statistically refinedsignal and unresponsive to an uninformative signal. This presents a natural test for the signalextraction hypothesis, and our results lay the foundation for further investigation of whatenvironmental factors produce signal interference in more natural decision making settings.
The economic scope of peer influence is vast. Previous work has documented that peo-ple’s uptake of retirement savings programs, charitable giving, effort at work, managerialstrategies, decisions to invest in financial instruments, and participation in paternal leaveare causally related to the observed decisions of their peers (Duflo and Saez, 2002; Frey andMeier, 2004; Mas and Moretti, 2009; Bandiera et al., 2010; Shue, 2013; Bursztyn et al., 2014;Dahl et al., 2014), and that students’ academic achievements covary with those whom theyshare a classroom or dormitory (Hoxby, 2000; Sacerdote, 2001; Zimmerman, 2003). A carefulinvestigation of how self-signaling and social comparisons may drive social conformity couldnot only contribute to our understanding of the existing empirical and theoretical literature,but also provide researchers and policy makers with greater predictive power over when peereffects are likely to exist in unexplored environments.
Section 2 presents our model of social comparisons and explains the formal intuitionbehind our results. Section 3 details our experimental design, and section 4 discusses theresults of our experiment. Finally, section 5 concludes and discusses possible future work onthis topic.
2 A Theory of Social ComparisonsBy modeling social comparisons as self signaling, this project delivers three principal the-
oretical contributions. In section 2.2 we show that if an individual experiences positive imagereturns in the performance of a costly action and negative image returns in the observationof higher peer performance, then diminishing marginal utility over self image will produceconvergence in group behavior. Section 2.3 shows that responsiveness to peer behavior ismediated by how informative the behavior of others is to one’s own image. Further, we findthat the signal provided by others’ choices is refined in the similarity of extrinsic costs facedby the decision makers. Finally, section 2.4 shows that self signaling will induce decisionmakers to choose more costly actions in anticipation of learning where their choice lies inthe distribution of others’ choices. This prediction is used to experimentally disentangle selfand social image. We first set up the decision maker’s problem in section 2.1.
2.1 PreliminariesSuppose agent 1 must choose an activity level a1 ∈ R+. Further suppose that a1 incurs
cost C(a1, δ1 − θ1). Here we define θ1 as agent 1’s level of ability, or type, and δ1 as the
3
extrinsic difficulty of the task. Cost is increasing in a1, ∂C∂a1
> 0, and marginal cost isdecreasing in one’s ability and increasing in extrinsic task difficulty, ∂2C
∂a1∂θ1= − ∂2C
∂a1∂δ1< 0.
The interpretation of C(a1, δ1 − θ1) is straightforward; given a1, the agent experiences taskcompletion cost C(a1, δ1 − θ1).4 For example, if a1 is a charitable gift, then the cost ofgiving is increasing in the size of the gift. Further, the perceived marginal cost of giving isincreasing in the financial hardship it imposes on agent 1, δ1, but decreasing in agent 1’spersonal altruism, θ1.
Now suppose agent 1 experiences image utility U(a1). Then, agent 1 trades of task costand image utility to solve:
maxa1U(a1)− C(a1, δ1 − θ1) (1)We now introduce self-image signal extraction into agent 1’s choice. Assume θ1 and δ1 arerandom variables, and that agent 1 does not observe δ1 independently of θ1. Further assumethat C(a1, δ1 − θ1) is invertible in δ1 − θ1 conditional on a1. Define the image utility over a1to be U(a1) = V (E [θ1|a1]). Where V is a strictly increasing known function and E [θ1|a1] isthe image agent 1 obtains from his choice of a1. Now, suppose agent 1 knows V , C and thedistributions of θ1 and δ1. This allows E [θ1|a1] and, therefore, U(a1) to be known functionsto agent 1.
Specifically, E [θ1|a1] is the image function that assumes any observed a1 is the solutionto agent 1’s first order condition:
V ′(E[θ1|a1])∂E[θ1|a1]
∂a1=
∂C
∂a1(a1, δ1 − θ1) (2)
Since this assumption is necessarily true in at the optimum, for all optimal a∗1 =argmaxa1U(a1) − C(a1, δ1 − θ1) the decision maker implicitly observes δ1 − θ1. We thendefine self image to be the expectation of one’s ability parameter given one’s level of ac-tivity, E [θ1|a∗1] = E [θ1|δ1 − θ1].5 Note that when the decision maker is being observed byothers U may serve as both a self and social image function.
In the context of charitable giving, our model states that altruism, θ1, cannot be measureddirectly. Instead agent 1 relies on his choice, a1, as a signal of his altruism. This signal isnoisy because altruism alone does not determine his donation. After all, the decision to givenot only indicates the desire to give, but also the financial ability to give, δ1. Therefore,his donation is a joint signal of his altruism and extrinsic motivations such as wealth, taxincentives, and uncertainty of future income. Having observed this joint signal, agent 1forms self image equal to the expected value of his altruism, E[θ|a1] = E[θ1|δ1 − θ1], andexperiences image utility V (E[θ|a1]).
4For notational simplicity we define the cost function C(a, δ−θ) to be the negative net utility, apart fromimage returns, of taking action a under parameters δ and θ. As such, we can more generally interpret δ1and θ1 as any environmental factor and any personal characteristic that mediate direct utility.
5As per Bénabou and Tirole (2006), in order to close this model of self image we must also assume thatthe decision maker suffers imperfect recall. That is, at the time that agent 1 decides a∗1, he observes his entirecost schedule – C(a1, δ1 − θ1) for all a1. However, agent 1’s future self will only remember the functions V ,C and his choice a1. However, since we assume C is invertible in δ − θ given a1, agent 1’s future self willdeduce δ1 − θ1. Therefore, the current self optimizes equation (1) with respect to the future self’s inferredexpectation of θ1 given the observed a1.
4
Next, we introduce the observation of a second agent’s action – a2 – into agent 1’sdecision.6
maxa1U(a1, a2)− C(a1, δ1 − θ1) (3)Note that this model makes endogenous the desire to condition one’s own decision on thedecisions of others. To see this, consider the first order condition:
∂U
∂a1(a1, a2) =
∂C
∂a1(a1, δ1 − θ1) (4)
Similar to the case of no social information, U is a known function that must be consistentwith the signal extraction of E[θ1|a1, a2]. Therefore, U is endogenously defined to satisfyfirst order condition (4). As such, person 1 will condition a1 on person 2’s decision a2 only ifV , C, and the distributions of (θ1, θ2) and (δ1, δ2) results in a signal extraction of E [θ1|a1, a2]and, thereby, utility function U that predict optimal a∗1 changes with observed a2. Note thatthis utility function does not adhere to an exogenously defined optimal action or social type.Rather, we will derive conditions on the strictly increasing image utility and cost functions,V and C, and the joint distribution of (δ1, δ2) that predict convergent behavior.
2.2 The Coefficient of Peer EffectsWe first establish the basic dynamics of the single decision maker who does not observe
others’ choices. Recall that this agent solves equation (1) with first order equation (2).Rewrite the first order equation as F (X,Y ) = 0 where X = a1 and Y = (θ1, δ1). Further,define G(Y ) such that F (G(Y ), Y ) = 0 for all Y . Then by the implicit function theorem,we know that G′(Y ) = −A−1
x Ay where Ax = FX(X,Y ) and Ay = FY (X,Y ). From equation(2) we get Ax =
[∂F∂a1
]and Ay =
[∂F∂θ1
∂F∂δ1
]. Notice that, by definition, G(Y ) is the optimal
action, a∗1, given a realization of (θ1, δ1).7 This delivers the following lemma.
Lemma 1. If ∂E[θ1|δ1−θ1]∂(δ1−θ1)
< 0, ∂2E[θ1|δ1−θ1]∂(δ1−θ1)2
= 0, ∂2C∂a1∂(δ−θ1)
(a1, δ1−θ1) > 0 and ∂2C∂a21
(a1, δ−θ1) ≥0, then ∂a∗1
∂θ1= −∂a∗1
∂δ1> 0.
Lemma 1 states that if the marginal cost of a1 is non-decreasing in a1 and increasing inthe difference between task difficulty and agent 1’s ability, δ1 − θ1, then the optimal choiceof a1 will be increasing in agent 1’s ability and decreasing in task difficulty. Here we assumethat the conditional expectation of θ1 is linearly decreasing in δ1 − θ1.8 In the context ofour example, this states that charitable giving increases in the decision maker’s altruism andprosperity.
We now move to the case where agent 1 observes the actions of all other agents i ∈{2, . . . , N}. For simplicity we assume that all agents i > 1 have already made their decisions
6For simplicity, we will assume that agent 2 does not observe a1.7This yields ∂a∗
1
∂θ1= −∂a∗
1
∂δ1= −(V ′′ (E[θ1|a1]) ∂E[θ1|a1]
∂a1
2− ∂2C
∂a21(a1, δ1 − θ1))
−1 ∂2C∂a1∂(δ1−θ1)
(a1, δ1 − θ1)8Linearity in the signal extraction is not necessary, but it is assumed in this paper for tractability. This
assumption is satisfied by assuming normal priors.
5
and cannot observe a1. Now there are N equations to solve:9
maxa1U(a1, a2, . . . , aN)− C(a1, δ1 − θ1)
maxa2U(a2)− C(a2, δ2 − θ2)
...
maxaNU(aN)− C(aN , δN − θN)
This results in the first order conditions:
∂U
∂a1(a1, a2, . . . , aN)−
∂C
∂a1(a1, δ1 − θ1) = 0
∂U
∂a2(a2)−
∂C
∂a2(a1, δ1 − θ1) = 0
...
∂U
∂aN(aN)−
∂C
∂aN(aN , δN − θN) = 0
We again apply the implicit function theorem, now to this system of equations, to find thefollowing.10
Proposition 1. Denote a∗1 = argmaxa1U(a1, a−1) − C(a1, δ1 − θ1) where a−1 is agent 1’sobservation of a∗i = argmaxaiU(ai) − C(ai, δi − θi) for all i ∈ {2, . . . , N}. If the conditionsof Lemma 1 are satisfied, then
∂a∗1∂a∗i
=−V ′′ (E[θ1|a∗1, a−1])× ∂E[θ1|a∗1,a−1]
∂a1× ∂E[θ1|a∗1,a−1]
∂a∗i
V ′′ (E[θ1|a∗1, a−1])(
∂E[θ1|a∗1,a−1]
∂a∗1
)2
− ∂2C∂a∗1
2 (a∗1, δ1 − θ1)
Proposition 1 states how individuals condition their action on the observed action of another person.11 That is, if ∂E[θ1|a∗1,a−1]
∂a∗1> 0, ∂E[θ1|a∗1,a−1]
∂a∗i< 0, V ′′ (E[θ1|a∗1, a−1]) < 0, and
∂2C∂a∗1
2 (a∗1, δ − θ1) ≥ 0, then ∂a∗1∂a∗i
> 0. Further, if ∂E[θ1|a∗1,a−1]
∂a∗1≥ −∂E[θ1|a∗1,a−1]
∂a∗i, then ∂a∗1
∂a∗i≤ 1. In
other words, if the expectation of one’s own θ is increasing in one’s own action and decreasingin an other’s action, then we will observe positive peer effects if the image utility function,
9In this case we assume that the first N movers ignore the consequences of their actions on the secondmover’s action since they will not observe the second mover’s action.
10See theoretical appendix section A.2.1.11Interestingly, the expression is invariant across unilateral and bilateral observation. That is, ignoring
reflection effects, proposition 1 describes how a∗1 responds to a∗2 when person 1 observes a∗2 and person 2 doesnot observe a∗1 as well as when person 1 and person 2 both observe each other.
6
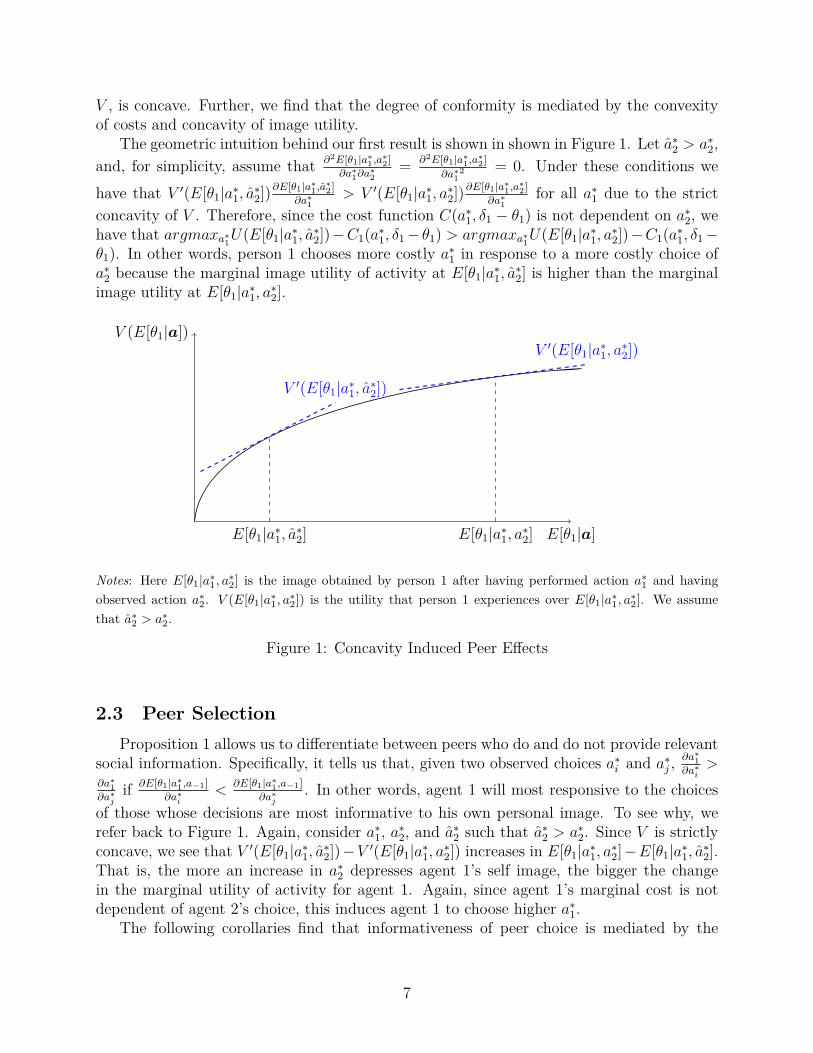
V , is concave. Further, we find that the degree of conformity is mediated by the convexityof costs and concavity of image utility.
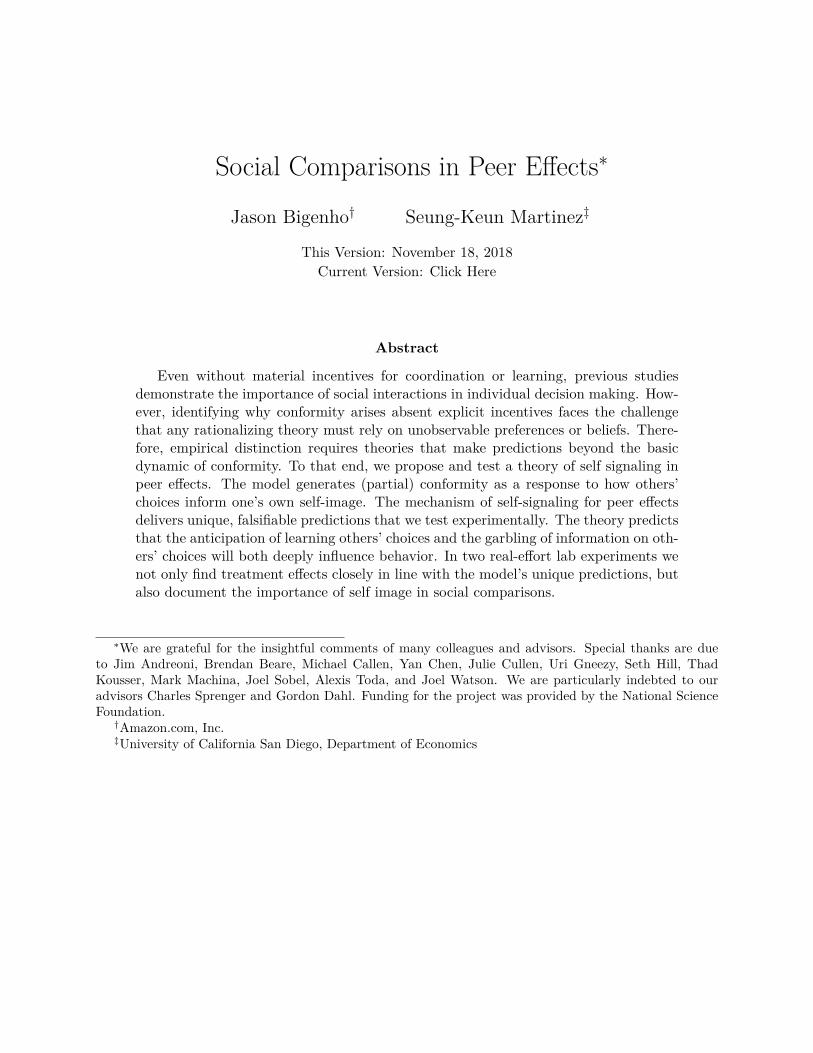
The geometric intuition behind our first result is shown in shown in Figure 1. Let a∗2 > a∗2,and, for simplicity, assume that ∂2E[θ1|a∗1,a∗2]
∂a∗1∂a∗2
=∂2E[θ1|a∗1,a∗2]
∂a∗12 = 0. Under these conditions we
have that V ′(E[θ1|a∗1, a∗2])∂E[θ1|a∗1,a∗2]
∂a∗1> V ′(E[θ1|a∗1, a∗2])
∂E[θ1|a∗1,a∗2]∂a∗1
for all a∗1 due to the strictconcavity of V . Therefore, since the cost function C(a∗1, δ1 − θ1) is not dependent on a∗2, wehave that argmaxa∗1
U(E[θ1|a∗1, a∗2])−C1(a∗1, δ1− θ1) > argmaxa∗1
U(E[θ1|a∗1, a∗2])−C1(a∗1, δ1−
θ1). In other words, person 1 chooses more costly a∗1 in response to a more costly choice ofa∗2 because the marginal image utility of activity at E[θ1|a∗1, a∗2] is higher than the marginalimage utility at E[θ1|a∗1, a∗2].
V ′(E[θ1|a∗1, a∗2])
V ′(E[θ1|a∗1, a∗2])
E[θ1|a∗1, a∗2] E[θ1|a∗1, a∗2] E[θ1|a]
V (E[θ1|a])
Notes: Here E[θ1|a∗1, a∗2] is the image obtained by person 1 after having performed action a∗1 and havingobserved action a∗2. V (E[θ1|a∗1, a∗2]) is the utility that person 1 experiences over E[θ1|a∗1, a∗2]. We assumethat a∗2 > a∗2.
Figure 1: Concavity Induced Peer Effects
2.3 Peer SelectionProposition 1 allows us to differentiate between peers who do and do not provide relevant
social information. Specifically, it tells us that, given two observed choices a∗i and a∗j ,∂a∗1∂a∗i
>∂a∗1∂a∗j
if ∂E[θ1|a∗1,a−1]
∂a∗i<
∂E[θ1|a∗1,a−1]
∂a∗j. In other words, agent 1 will most responsive to the choices
of those whose decisions are most informative to his own personal image. To see why, werefer back to Figure 1. Again, consider a∗1, a∗2, and a∗2 such that a∗2 > a∗2. Since V is strictlyconcave, we see that V ′(E[θ1|a∗1, a∗2])−V ′(E[θ1|a∗1, a∗2]) increases in E[θ1|a∗1, a∗2]−E[θ1|a∗1, a∗2].That is, the more an increase in a∗2 depresses agent 1’s self image, the bigger the changein the marginal utility of activity for agent 1. Again, since agent 1’s marginal cost is notdependent of agent 2’s choice, this induces agent 1 to choose higher a∗1.
The following corollaries find that informativeness of peer choice is mediated by the
7

perceived similarity of explicit costs and incentives.12
Corollary 1. Suppose that for i ∈ {1, 2}, θi ∼ N (µθ, σθ) and that cov(θ1, θ2) = 0. Further,let (δ1, δ2) ∼ N (µδ,Σδ). Then ∂a∗1
∂a∗2is in increasing in cov(δ1, δ2).
Corollary 2. Suppose that for i ∈ {1, 2, 3}, θi ∼ N (µθ, σθ) and that for i = j, cov(θi, θj) = 0.Further, let (δ1, δ2, δ3) ∼ N (µδ,Σδ). Then ∂a∗1
∂a∗2>
∂a∗1∂a∗3
if and only if cov(δ1, δ2) > cov(δ1, δ3).
Corollary 1 states that the signal an other’s action provides is refined in the covariance ofagent 1 and 2’s cost parameters. The intuition behind this result is simple. Suppose agents1 and 2 donate a∗1 and a∗2 to charity. Then the closer their financial abilities to give are toidentical, the more any difference in a∗1 and a∗2 must be attributed to differentiated desiresto give. Similarly, corollary 2 states that agent 1 will be most responsive to choices of thosewho share the most similar extrinsic costs. That is, our model predicts that a charitabledonation campaign should inform prospective donors of the generosity of others in similarfinancial positions. For example, a mail or door-to-door campaign should mention the giftsof others in who live in the same neighborhood.
2.4 Anticipation of Social InformationOur final result establishes the anticipation effect of self signaling. We change notation
for this analysis. Let as be one’s chosen action and let n ≤ N be the rank of one’s actionout of a population of N persons who each choose their own action a. That is, as is of rankn if and only if n− 1 persons chose an action smaller than as and N − n− 1 persons chosean action higher than as. For simplicity, we assume that equality with as is not possible.
Now suppose that the decision maker knows that he will not learn his rank n. Then weassume he will act as a solitary decision maker.
maxasU (E [E [θs|as, E[n|as]] |as])− C(as, δ − θs)
= maxasU (E [θs|as])− C(as, δ − θs)
With first order condition
V ′ (E [θs|as])∂E [θs|as]
∂as=
∂C
∂as(as, δ − θs) (5)
This imposes that the decision maker optimizes over E[E[θs|as,
∑Nn=1 Pn(as) ∗ n
]|as
]=
E [θs|as] since as is the only information he will obtain. However, if he knows that we willlearn his true relative rank, he solves
maxas
N∑n=1
Pn(as) ∗ V (E [θs|as, n])− C(as, δ − θs)
.12Proofs found in appendix section A.2.2
8
With first order condition
N∑n=1
Pn(as) ∗ V ′ (E [θs|as, n])∂E [θs|as, n]
∂as+
N∑n=1
P ′n(as)V (E [θs|as, n]) =
∂C
∂as(as, δ − θs) (6)
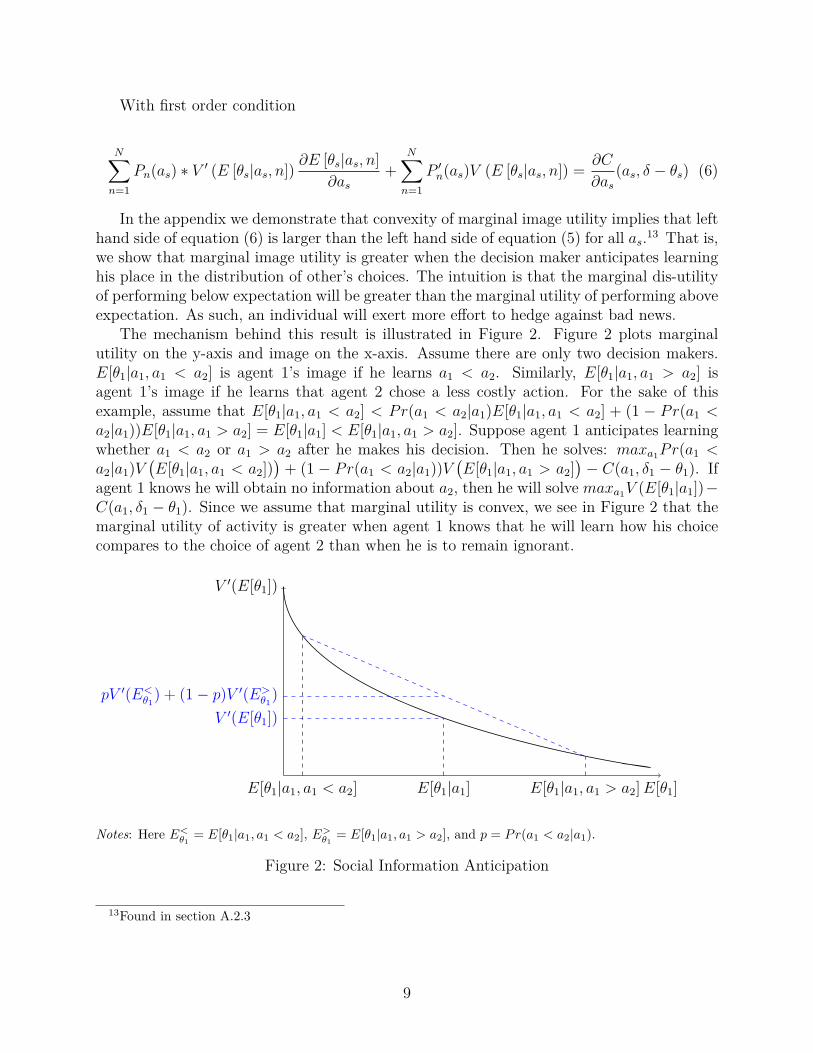
In the appendix we demonstrate that convexity of marginal image utility implies that lefthand side of equation (6) is larger than the left hand side of equation (5) for all as.13 That is,we show that marginal image utility is greater when the decision maker anticipates learninghis place in the distribution of other’s choices. The intuition is that the marginal dis-utilityof performing below expectation will be greater than the marginal utility of performing aboveexpectation. As such, an individual will exert more effort to hedge against bad news.
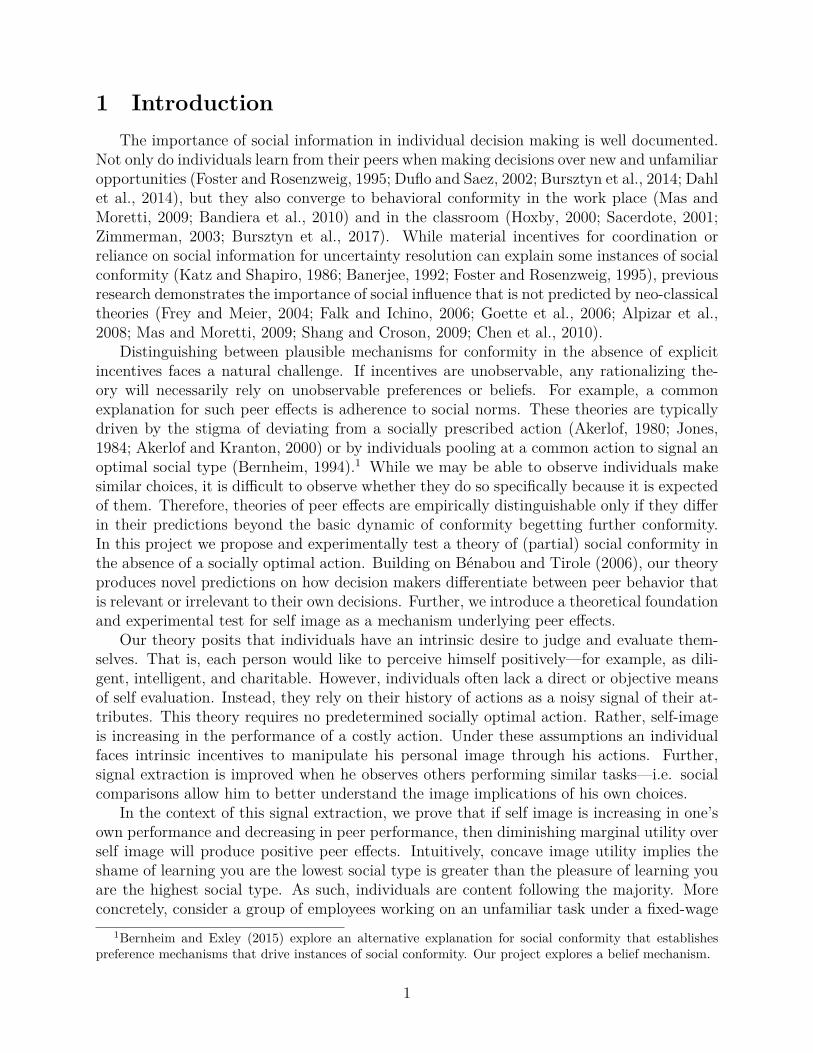
The mechanism behind this result is illustrated in Figure 2. Figure 2 plots marginalutility on the y-axis and image on the x-axis. Assume there are only two decision makers.E[θ1|a1, a1 < a2] is agent 1’s image if he learns a1 < a2. Similarly, E[θ1|a1, a1 > a2] isagent 1’s image if he learns that agent 2 chose a less costly action. For the sake of thisexample, assume that E[θ1|a1, a1 < a2] < Pr(a1 < a2|a1)E[θ1|a1, a1 < a2] + (1 − Pr(a1 <a2|a1))E[θ1|a1, a1 > a2] = E[θ1|a1] < E[θ1|a1, a1 > a2]. Suppose agent 1 anticipates learningwhether a1 < a2 or a1 > a2 after he makes his decision. Then he solves: maxa1Pr(a1 <a2|a1)V
(E[θ1|a1, a1 < a2])
)+ (1 − Pr(a1 < a2|a1))V
(E[θ1|a1, a1 > a2]
)− C(a1, δ1 − θ1). If
agent 1 knows he will obtain no information about a2, then he will solve maxa1V (E[θ1|a1])−C(a1, δ1 − θ1). Since we assume that marginal utility is convex, we see in Figure 2 that themarginal utility of activity is greater when agent 1 knows that he will learn how his choicecompares to the choice of agent 2 than when he is to remain ignorant.
V ′(E[θ1])
pV ′(E<θ1) + (1− p)V ′(E>
θ1)
E[θ1|a1, a1 < a2] E[θ1|a1] E[θ1|a1, a1 > a2]E[θ1]
V ′(E[θ1])
Notes: Here E<θ1
= E[θ1|a1, a1 < a2], E>θ1
= E[θ1|a1, a1 > a2], and p = Pr(a1 < a2|a1).
Figure 2: Social Information Anticipation
13Found in section A.2.3
9
3 Experimental DesignWe conducted two experiments to directly test the predictions of our theory. The first
experiment tested the relevance of self image in social comparisons, and the second experi-ment tested the relevance of signal extraction. In both experiments participants chose themaximum number of real-effort tasks they were willing to complete in exchange for a dona-tion to charity. All experiment sessions were conducted at the University of California, SanDiego Department of Economics. Subjects completed the experiment on individual computerterminals. Privacy screens were installed on each computer and barriers were placed betweenevery subject. All participants were current undergraduates at UC San Diego. Each subjectwas paid 15 dollars for his or her participation, and experiment sessions took approximately50 minutes. Treatments were varied across sessions for a between-subjects design. Recruit-ment for each session was done by emailing a random sample of UCSD undergraduates. Thefirst experiment contained nine to fourteen subjects per session, and the second experimentcontained eight to twelve subjects per session.
Section 3.1 explains the real-effort task choice. Section 3.2 details the self-image experi-ment, and section 3.3 describes the test for signal extraction.
3.1 The Task ChoiceIn both experiments, participants were asked to select the maximum number of real-
effort tasks they were willing to complete in exchange for donations to the Afghan DentalRelief Project.14 The ADRP is a charitable organization that provides free dental servicesand dental health education to the poorest families and individuals in Kabul, Afghanistan.100% of the donations that were generated from the experiment were used to purchasedental supplies for ADRP’s free dental clinic. We collaborated with the ADRP becauseit is a deserving and relatively unknown charity. The founder, Dr. James Rolfe, agreed tomonitor gifts made to the charity during the course of our experiment. Dr. Rolfe reports thatno gifts were made to the ADRP that could have been given by a UCSD undergraduate.15
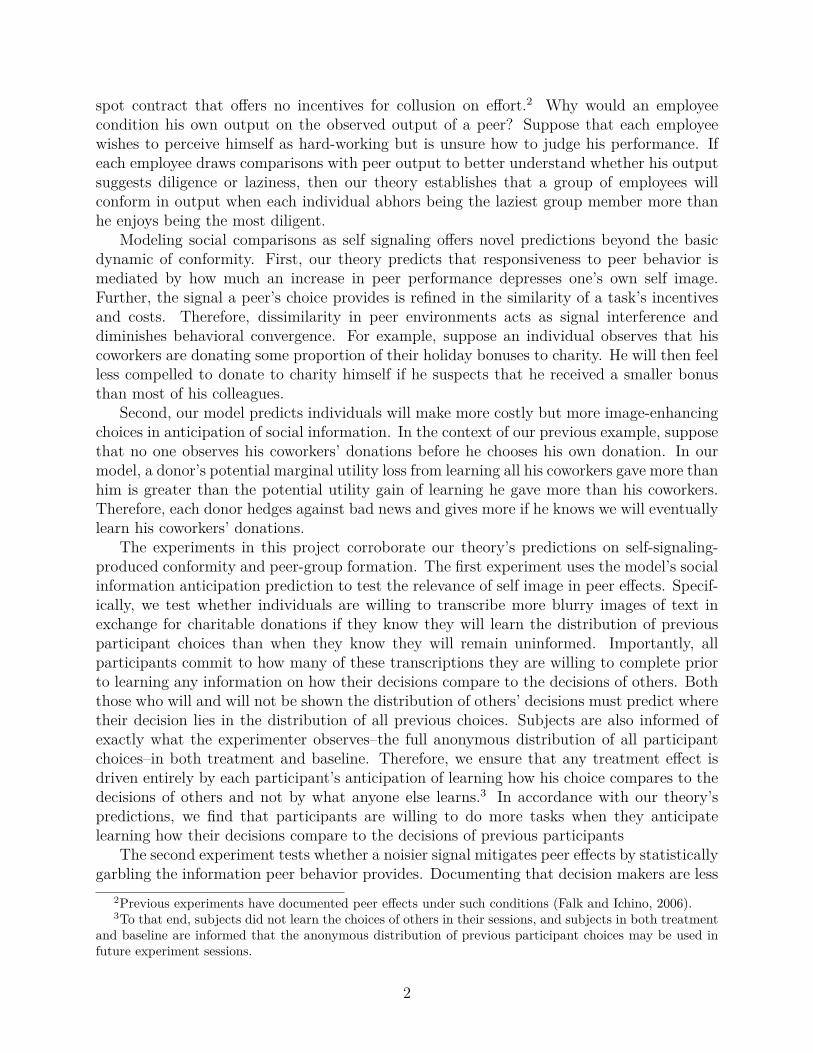
The real-effort task was to transcribe captchas.16 Captchas are distorted images of asequence of letters commonly used by website developers to distinguish between humanusers and bots. The task was deliberately made to be more frustrating and tedious thantypical website captchas. We wanted subjects to experience increasing marginal costs in theirtask performances. Our captchas consisted of capital and lowercase letters, numbers, andspecial characters. Only correctly transcribed captchas were considered completed tasks.Subjects were given three chances per randomly assigned captcha, and they could not skip
14We elicited willingness to do real-effort tasks in exchange for donations to charity, as opposed to elicitingwillingness to give money, so that we could measure how willingness to give one’s time and effort changeswith the size of the donation.
15Specifically, all donations made to the ADRP during the course of our experiment came from us, theexperimenters, or from members of Dr. Rolfe’s local Santa Barbara community.
16Captchas were generated using the Python module Claptcha, available here:https://github.com/kuszaj/claptcha. All use of this module is in accordance with the license out-lined at the previous link. The font used for captchas was “Mom’s Typewriter,” an open-source fontavailable here: https://www.dafont.com/moms-typewriter.font.
10

an assigned captcha except by deliberately entering three incorrect responses.17 The typicalparticipant was able to correctly transcribe 1-out-of-every-5 captchas. An example of thetask is show in Figure 3.18
Figure 3: Example Task
In the self-image experiment subjects selected the maximum number of tasks they werewilling to complete in exchange for donations of $2, $5, $10, $15, and $20. Each subjectchose between 0 and 50 tasks for each possible donation amount. We ensured the incentivecompatibility of this decision by randomly assigning each subject a donation and task amountafter they had completed making their decisions. If the assigned number of tasks was equal toor fewer than the maximum number they were willing to do for their assigned donation, theycompleted their assigned number of tasks and we gave the assigned donation to the ADRP.For example, suppose that for a donation of $15 a participant chose to do at most 30 tasks. Ifhe were randomly assigned $15 and 20 tasks, then he completed 20 tasks and $15 was givento the Afghan Dental Relief Project. On the other hand, if he was randomly assigned $15and 40 tasks, then he did 0 tasks and no donation was given to the ADRP. After completingtheir assigned number of tasks, subjects were all paid the same participation fee as theyexited the lab. Subjects were offered the same choice in the signal-extraction experiment.However, only a donation of $20 was possible. Therefore, subjects in the signal-extractionexperiment only made one decision while subjects in the self-image experiment made five.19
We wanted all participants to make an informed choice on how many tasks they werewilling to complete in exchange for a donation to charity. Therefore, all subjects read anews article about the ADRP and attempted to transcribe five sample captchas prior totheir decisions. Additionally, subjects received instruction and comprehension testing aboutthe incentive compatible task choice. We wanted to prevent contemporaneous peer effectsin our experiment. Therefore, individuals never observed the decisions of others in theirown session, nor did they observe the randomly assigned donations or task amounts of otherparticipants in their session. Lastly, we wanted to measure how many captchas participantswanted to complete, not how many they thought they could complete within a specific timeinterval. Therefore, subjects were given as much time as they needed to complete their tasks.
17All captchas were randomly assigned out of a bank of 1000 captcha images.18The correct transcription of the shown captcha is “4LBMwW?E”19Each subject was assigned a donation amount by drawing a ball out of a jar. Each ball had a dollar
amount and three-digit code written on it. The codes ensured that no subject could choose to work fora donation amount that they were not assigned. A random number generator then assigned each subjecta number of tasks (between 0 and 50). Both randomization devices were fair – every donation and taskcombination had an equal probability of being assigned.
11
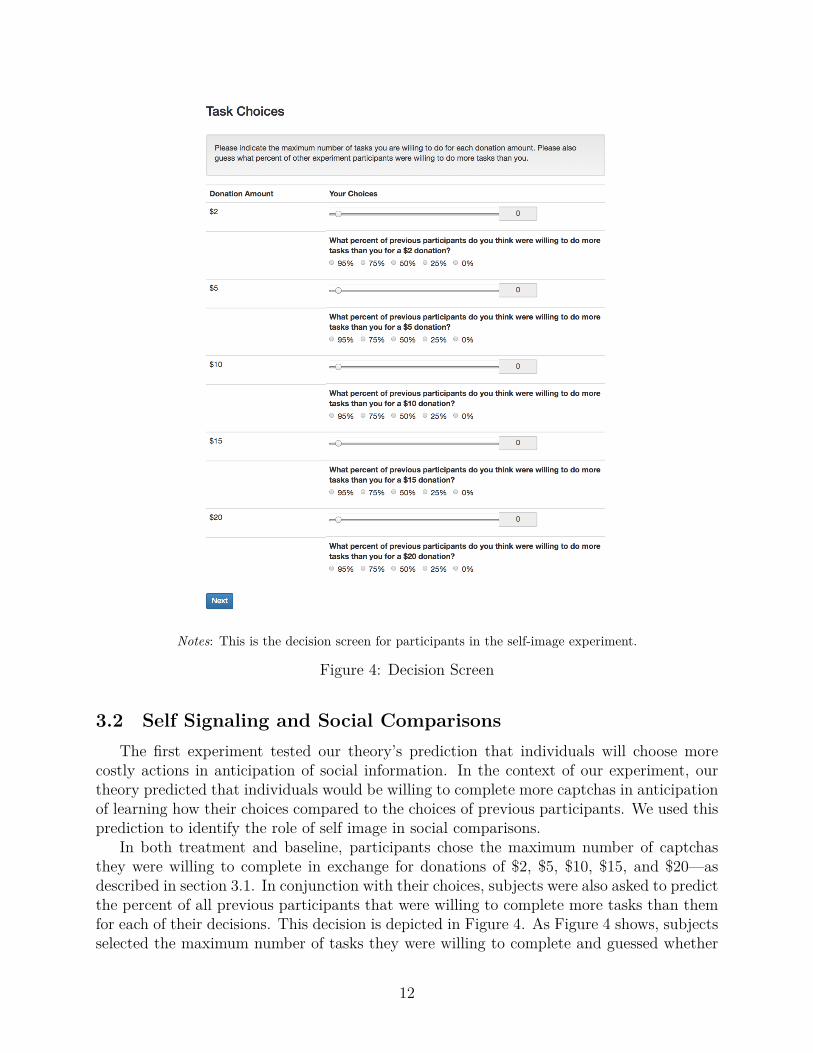
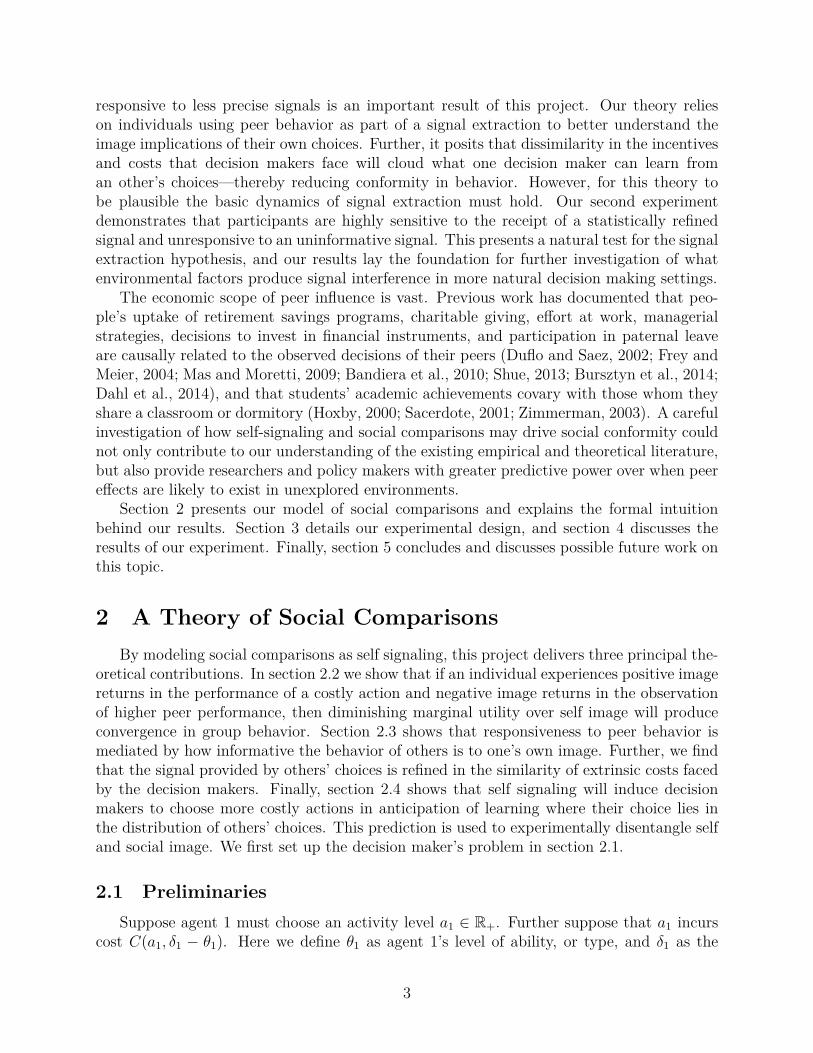
Notes: This is the decision screen for participants in the self-image experiment.
Figure 4: Decision Screen
3.2 Self Signaling and Social ComparisonsThe first experiment tested our theory’s prediction that individuals will choose more
costly actions in anticipation of social information. In the context of our experiment, ourtheory predicted that individuals would be willing to complete more captchas in anticipationof learning how their choices compared to the choices of previous participants. We used thisprediction to identify the role of self image in social comparisons.
In both treatment and baseline, participants chose the maximum number of captchasthey were willing to complete in exchange for donations of $2, $5, $10, $15, and $20—asdescribed in section 3.1. In conjunction with their choices, subjects were also asked to predictthe percent of all previous participants that were willing to complete more tasks than themfor each of their decisions. This decision is depicted in Figure 4. As Figure 4 shows, subjectsselected the maximum number of tasks they were willing to complete and guessed whether
12
95%, 75%, 50%, 25%, or 0% of all previous participants were willing to do more tasks them.For example, suppose that for a donation of $10 dollars an individual chose to do a maximumof 12 tasks. Further suppose that this person thought that at least 50%, but fewer than 75%,of all previous participants were willing to do more than 12 tasks for a $10 donation. Thisperson was then instructed to indicate that he believes that at least 50% of all previousexperiment participants were willing to do more tasks than him for a $10 donation.20
In treatment sessions, participants were given sealed envelopes that they opened aftersubmitting their decisions and distributional guesses. These envelopes contained the true5th, 25th, 50th, 25th, and 100th percentiles for task choice by donation amount. Treatmentparticipants then submitted the correct answers for what percent of previous participantswere willing to do more tasks than them for each possible donation.
All choices were recorded anonymously. No subject choice, assigned donation, or as-signed task amount was revealed to others in their sessions. All subjects were aware thatexactly 50% of all experiments session would learn the distribution of previous participantchoices. Further, while only treatment subjects ultimately learned the percentiles of previ-ous participant choices, we deliberately asked all participants to consider how their choicescompare to the choices of all previous participants. By doing so, we made subjects in bothbaseline and treatment consider how their choices may compare to the choices of others.Further, we ensured all experiment subjects were aware that the experimenter will observethe full anonymous distribution of participant choices. Since the experimenter’s informationset is identical in treatment and baseline, any difference in subject behavior is solely due tosubjects anticipating what they themselves will learn.21
3.3 Signal Extraction and Peer-Group FormationAll of the predicted dynamics of our proposed theory rely on signal extraction. Therefore,
peer effects are predicted to arise only if group behavior provides a sufficiently refined signal.In the context of our experiment, our theory states that decision makers may refer to others’choices to better understand whether their own choices reveal selfishness or task difficulty. Assuch, we use statistically garbled and refined social information to directly test the relevanceof statistical reasoning in social comparisons.
Recall that, participants in this experiment chose the maximum number of captchasthey were willing to complete in exchange for a $20 donation to the ADRP. Prior to theirdecision, each person was shown both of the following statements on the choices of all previousparticipants.
20These guesses were not incentivized to preclude subjects from tailoring their choices to their guesses soas receive higher payment—for example, picking corners on their choices for more accurate guesses.
21We were also concerned that if only treatment subjects were aware that their anonymous choices maybe revealed in future sessions, then social image could still be a confounding factor. Similarly, there is asecond order equilibrium concern that if all subjects in the baseline thought all previous participants werealso in the baseline–and all treatment participants thought all previous participants were in the treatment–then subjects in the treatment may have had higher beliefs about what previous participants chose to do.However, we preclude these possible concerns by explaining to subjects in both treatment and baseline that50% of all experiment sessions receive social information and 50% do not. At no point do we reveal howmany sessions have taken place or how many remain. Therefore, all subjects were uniformly in the darkabout the probability that their choices will inform future revelations of social information.
13
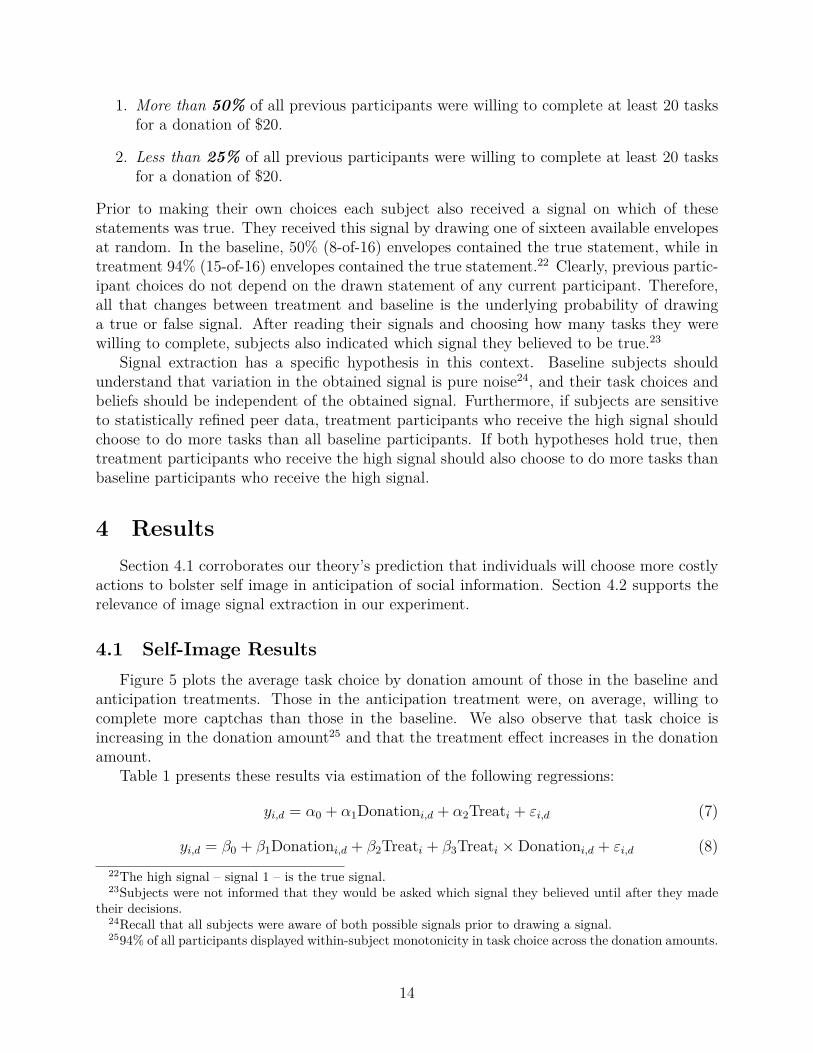
1. More than 50% of all previous participants were willing to complete at least 20 tasksfor a donation of $20.
2. Less than 25% of all previous participants were willing to complete at least 20 tasksfor a donation of $20.
Prior to making their own choices each subject also received a signal on which of thesestatements was true. They received this signal by drawing one of sixteen available envelopesat random. In the baseline, 50% (8-of-16) envelopes contained the true statement, while intreatment 94% (15-of-16) envelopes contained the true statement.22 Clearly, previous partic-ipant choices do not depend on the drawn statement of any current participant. Therefore,all that changes between treatment and baseline is the underlying probability of drawinga true or false signal. After reading their signals and choosing how many tasks they werewilling to complete, subjects also indicated which signal they believed to be true.23
Signal extraction has a specific hypothesis in this context. Baseline subjects shouldunderstand that variation in the obtained signal is pure noise24, and their task choices andbeliefs should be independent of the obtained signal. Furthermore, if subjects are sensitiveto statistically refined peer data, treatment participants who receive the high signal shouldchoose to do more tasks than all baseline participants. If both hypotheses hold true, thentreatment participants who receive the high signal should also choose to do more tasks thanbaseline participants who receive the high signal.
4 ResultsSection 4.1 corroborates our theory’s prediction that individuals will choose more costly
actions to bolster self image in anticipation of social information. Section 4.2 supports therelevance of image signal extraction in our experiment.
4.1 Self-Image ResultsFigure 5 plots the average task choice by donation amount of those in the baseline and
anticipation treatments. Those in the anticipation treatment were, on average, willing tocomplete more captchas than those in the baseline. We also observe that task choice isincreasing in the donation amount25 and that the treatment effect increases in the donationamount.
Table 1 presents these results via estimation of the following regressions:
yi,d = α0 + α1Donationi,d + α2Treati + εi,d (7)
yi,d = β0 + β1Donationi,d + β2Treati + β3Treati ×Donationi,d + εi,d (8)22The high signal – signal 1 – is the true signal.23Subjects were not informed that they would be asked which signal they believed until after they made
their decisions.24Recall that all subjects were aware of both possible signals prior to drawing a signal.2594% of all participants displayed within-subject monotonicity in task choice across the donation amounts.
14

Figure 5: Mean Task Choice by Donation
Notes: This figure plots the average number of tasks subjects were willing to complete for each possibledonation. In concordance with self signaling, subjects choose to do more tasks if they anticipate learninghow their choices compare to the choices of previous participants. This effect is increasing in the value ofthe gift to charity. Standard errors are shown in brackets.
where yi,d is the maximum number of tasks subject i was willing to complete for donation d.Regression (8) is more informative.26 From this regression we can see that for every addi-tional $5 donated to the ADRP, baseline participants were willing to do an additional fourtasks while treatment participants were willing to do an additional five tasks. This result,significant at the 5% level, is useful for two principle reasons. First, strict monotonicity intask performance over donation size demonstrates the costliness of captcha transcription.Secondly, we find no evidence of any fixed treatment effect—the estimation of β2 is indistin-guishable from 0. Rather, the anticipatory image effect is entirely tied to the size of the giftgiven to the ADRP. This result is accommodated by our model. A nominal gift of $2 gives
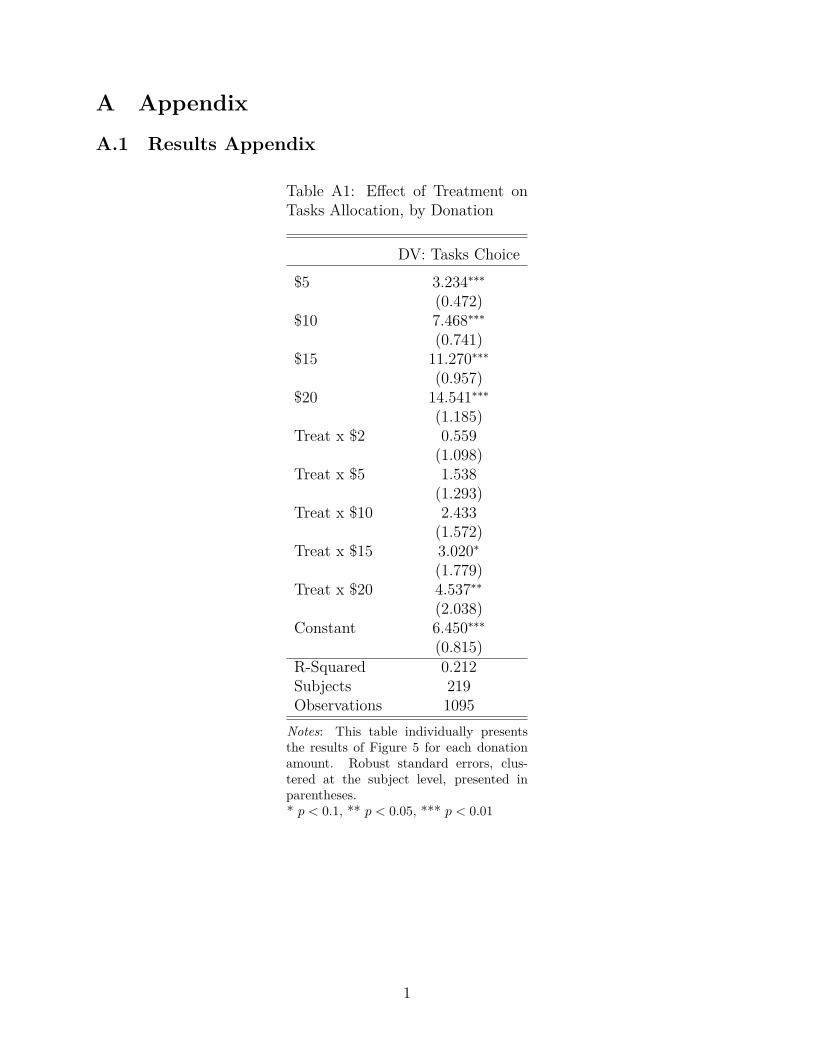
26Appendix Table A1 confirms that the linearly interacted regression is the correct specification. The corre-sponding regression for Table A1 is yi,d = δ0+
∑d∈{2,5,10,15,20} δ1,d1i,donation=d+
∑d∈{2,5,10,15,20} δ2,dTreati×
1i,donation=d + εi,d. From this regression we can not only see that task choices and the treatment effect areincreasing in the donation, but also that a linear approximation of these effects fits well. For example,regression (8) predicts that the total average treatment effect for donations of $15 and $20 will be 3 and 4tasks while the indicator regression finds the effects to be 3 and 4.5 tasks.
15
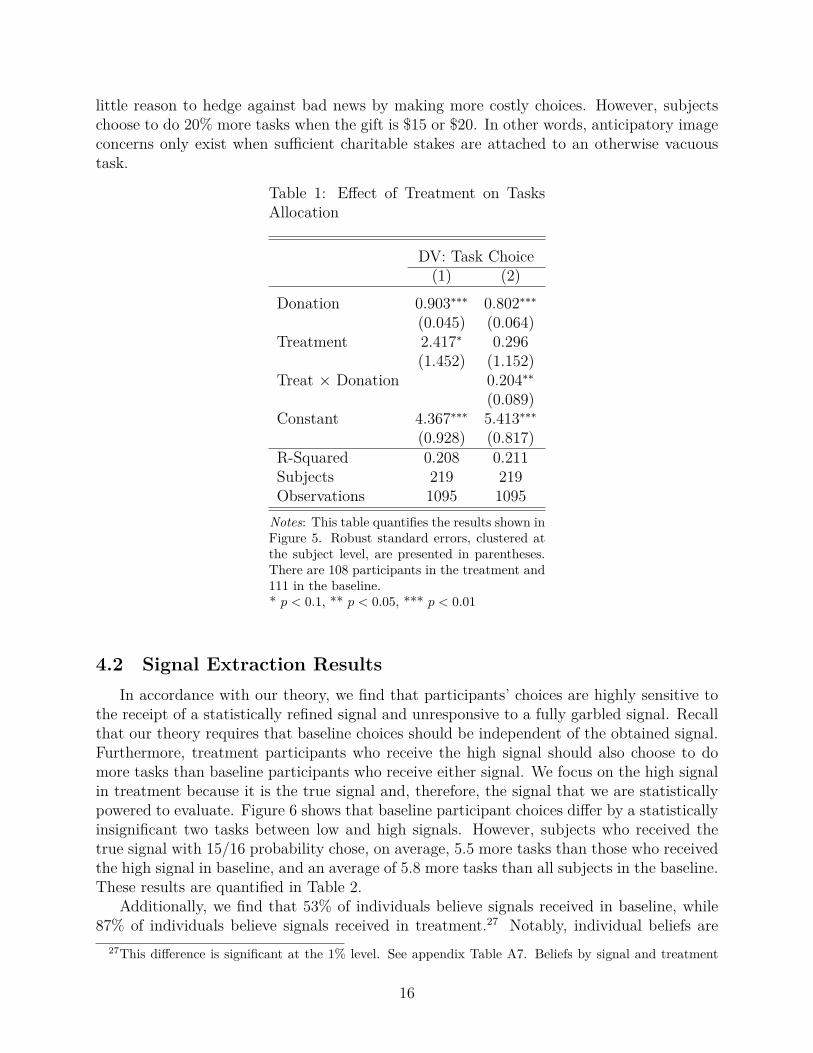
little reason to hedge against bad news by making more costly choices. However, subjectschoose to do 20% more tasks when the gift is $15 or $20. In other words, anticipatory imageconcerns only exist when sufficient charitable stakes are attached to an otherwise vacuoustask.
Table 1: Effect of Treatment on TasksAllocation
DV: Task Choice(1) (2)
Donation 0.903∗∗∗ 0.802∗∗∗(0.045) (0.064)
Treatment 2.417∗ 0.296(1.452) (1.152)
Treat × Donation 0.204∗∗(0.089)
Constant 4.367∗∗∗ 5.413∗∗∗(0.928) (0.817)
R-Squared 0.208 0.211Subjects 219 219Observations 1095 1095
Notes: This table quantifies the results shown inFigure 5. Robust standard errors, clustered atthe subject level, are presented in parentheses.There are 108 participants in the treatment and111 in the baseline.* p < 0.1, ** p < 0.05, *** p < 0.01
4.2 Signal Extraction ResultsIn accordance with our theory, we find that participants’ choices are highly sensitive to
the receipt of a statistically refined signal and unresponsive to a fully garbled signal. Recallthat our theory requires that baseline choices should be independent of the obtained signal.Furthermore, treatment participants who receive the high signal should also choose to domore tasks than baseline participants who receive either signal. We focus on the high signalin treatment because it is the true signal and, therefore, the signal that we are statisticallypowered to evaluate. Figure 6 shows that baseline participant choices differ by a statisticallyinsignificant two tasks between low and high signals. However, subjects who received thetrue signal with 15/16 probability chose, on average, 5.5 more tasks than those who receivedthe high signal in baseline, and an average of 5.8 more tasks than all subjects in the baseline.These results are quantified in Table 2.
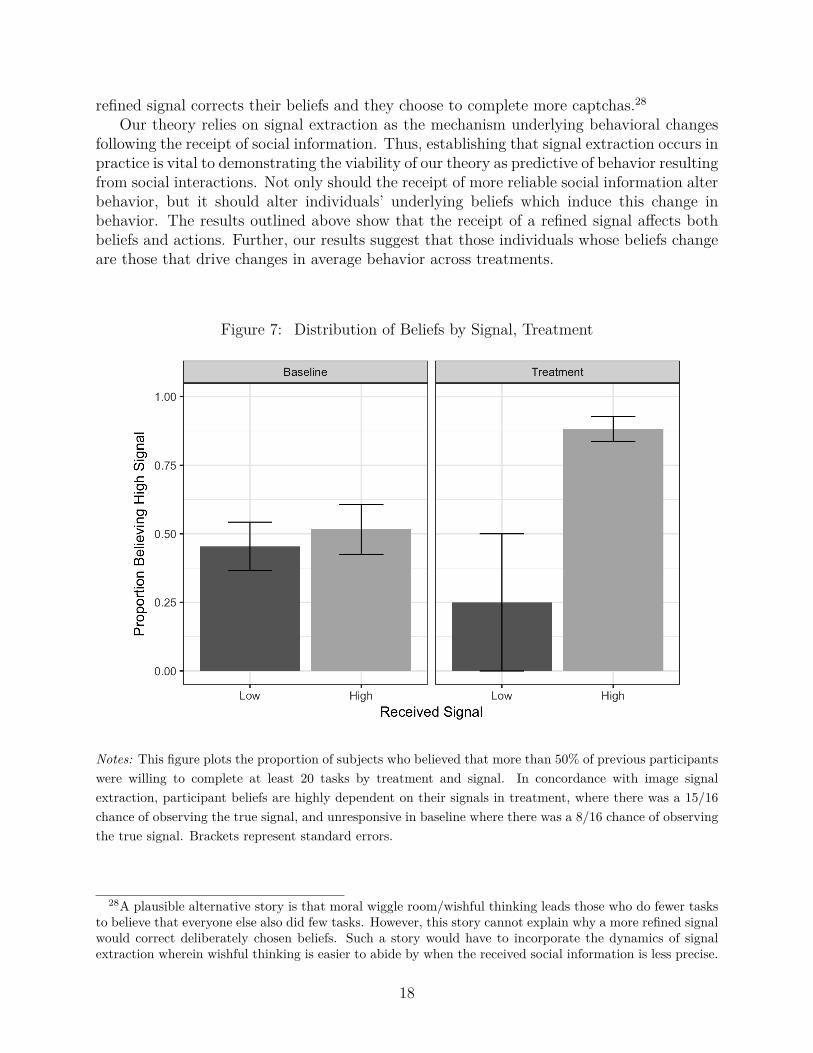
Additionally, we find that 53% of individuals believe signals received in baseline, while87% of individuals believe signals received in treatment.27 Notably, individual beliefs are
27This difference is significant at the 1% level. See appendix Table A7. Beliefs by signal and treatment
16
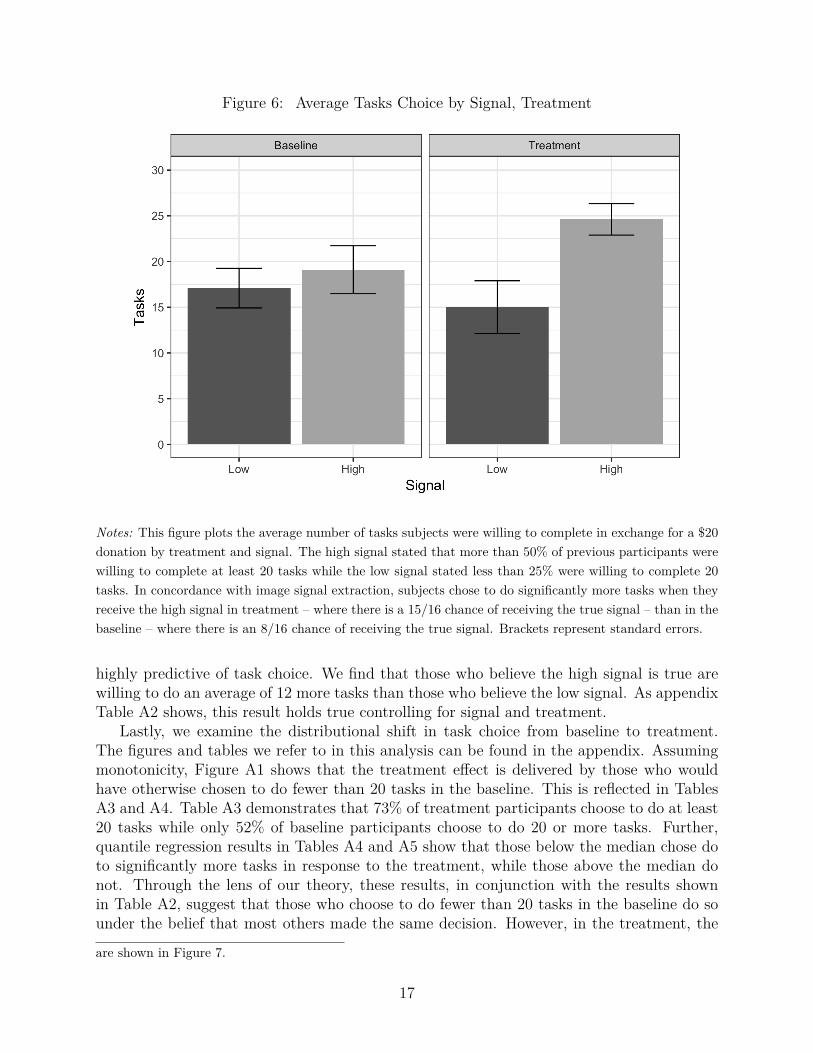
Figure 6: Average Tasks Choice by Signal, Treatment
Notes: This figure plots the average number of tasks subjects were willing to complete in exchange for a $20donation by treatment and signal. The high signal stated that more than 50% of previous participants werewilling to complete at least 20 tasks while the low signal stated less than 25% were willing to complete 20tasks. In concordance with image signal extraction, subjects chose to do significantly more tasks when theyreceive the high signal in treatment – where there is a 15/16 chance of receiving the true signal – than in thebaseline – where there is an 8/16 chance of receiving the true signal. Brackets represent standard errors.
highly predictive of task choice. We find that those who believe the high signal is true arewilling to do an average of 12 more tasks than those who believe the low signal. As appendixTable A2 shows, this result holds true controlling for signal and treatment.
Lastly, we examine the distributional shift in task choice from baseline to treatment.The figures and tables we refer to in this analysis can be found in the appendix. Assumingmonotonicity, Figure A1 shows that the treatment effect is delivered by those who wouldhave otherwise chosen to do fewer than 20 tasks in the baseline. This is reflected in TablesA3 and A4. Table A3 demonstrates that 73% of treatment participants choose to do at least20 tasks while only 52% of baseline participants choose to do 20 or more tasks. Further,quantile regression results in Tables A4 and A5 show that those below the median chose doto significantly more tasks in response to the treatment, while those above the median donot. Through the lens of our theory, these results, in conjunction with the results shownin Table A2, suggest that those who choose to do fewer than 20 tasks in the baseline do sounder the belief that most others made the same decision. However, in the treatment, the
are shown in Figure 7.
17
refined signal corrects their beliefs and they choose to complete more captchas.28
Our theory relies on signal extraction as the mechanism underlying behavioral changesfollowing the receipt of social information. Thus, establishing that signal extraction occurs inpractice is vital to demonstrating the viability of our theory as predictive of behavior resultingfrom social interactions. Not only should the receipt of more reliable social information alterbehavior, but it should alter individuals’ underlying beliefs which induce this change inbehavior. The results outlined above show that the receipt of a refined signal affects bothbeliefs and actions. Further, our results suggest that those individuals whose beliefs changeare those that drive changes in average behavior across treatments.
Figure 7: Distribution of Beliefs by Signal, Treatment
Notes: This figure plots the proportion of subjects who believed that more than 50% of previous participantswere willing to complete at least 20 tasks by treatment and signal. In concordance with image signalextraction, participant beliefs are highly dependent on their signals in treatment, where there was a 15/16chance of observing the true signal, and unresponsive in baseline where there was a 8/16 chance of observingthe true signal. Brackets represent standard errors.
28A plausible alternative story is that moral wiggle room/wishful thinking leads those who do fewer tasksto believe that everyone else also did few tasks. However, this story cannot explain why a more refined signalwould correct deliberately chosen beliefs. Such a story would have to incorporate the dynamics of signalextraction wherein wishful thinking is easier to abide by when the received social information is less precise.
18
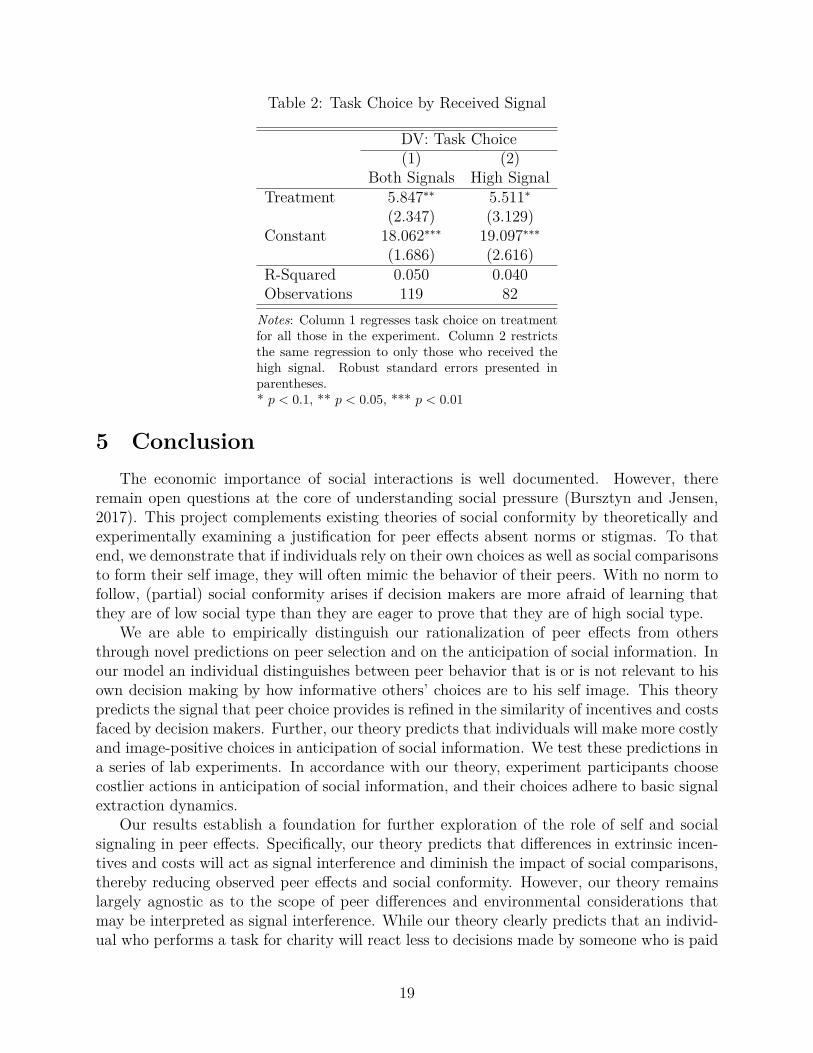
Table 2: Task Choice by Received Signal
DV: Task Choice(1) (2)
Both Signals High SignalTreatment 5.847∗∗ 5.511∗
(2.347) (3.129)Constant 18.062∗∗∗ 19.097∗∗∗
(1.686) (2.616)R-Squared 0.050 0.040Observations 119 82
Notes: Column 1 regresses task choice on treatmentfor all those in the experiment. Column 2 restrictsthe same regression to only those who received thehigh signal. Robust standard errors presented inparentheses.* p < 0.1, ** p < 0.05, *** p < 0.01
5 ConclusionThe economic importance of social interactions is well documented. However, there
remain open questions at the core of understanding social pressure (Bursztyn and Jensen,2017). This project complements existing theories of social conformity by theoretically andexperimentally examining a justification for peer effects absent norms or stigmas. To thatend, we demonstrate that if individuals rely on their own choices as well as social comparisonsto form their self image, they will often mimic the behavior of their peers. With no norm tofollow, (partial) social conformity arises if decision makers are more afraid of learning thatthey are of low social type than they are eager to prove that they are of high social type.
We are able to empirically distinguish our rationalization of peer effects from othersthrough novel predictions on peer selection and on the anticipation of social information. Inour model an individual distinguishes between peer behavior that is or is not relevant to hisown decision making by how informative others’ choices are to his self image. This theorypredicts the signal that peer choice provides is refined in the similarity of incentives and costsfaced by decision makers. Further, our theory predicts that individuals will make more costlyand image-positive choices in anticipation of social information. We test these predictions ina series of lab experiments. In accordance with our theory, experiment participants choosecostlier actions in anticipation of social information, and their choices adhere to basic signalextraction dynamics.
Our results establish a foundation for further exploration of the role of self and socialsignaling in peer effects. Specifically, our theory predicts that differences in extrinsic incen-tives and costs will act as signal interference and diminish the impact of social comparisons,thereby reducing observed peer effects and social conformity. However, our theory remainslargely agnostic as to the scope of peer differences and environmental considerations thatmay be interpreted as signal interference. While our theory clearly predicts that an individ-ual who performs a task for charity will react less to decisions made by someone who is paid
19

a wage for the task, it may also explain differential peer effects between individuals withdifferentiated personal traits. For example, affirmative action is built on the premise thatstudents’ demographics are correlated with varied extrinsic costs to scholastic achievement.That is, differential peer effects between individuals with differentiated observable traits ispotentially explained by perceived signal interference.
A potentially relevant literature documents an important relationship between uncer-tainty and self-serving preferences (Dana et al., 2007; Andreoni and Bernheim, 2009; Exley,2016). Excuse-driven preferences may exacerbate the effect of perceived signal interference inimage signaling. Therefore, exploring this relationship may provide better predictive powerover the environmental conditions and policy interventions that will catalyze or mitigatesocial conformity. Lastly, our theory can be naturally extended to yield predictions on whenindividuals will seek or avoid information. Such predictions could potentially be used tounderstand when social information is deemed harmful, beneficial, or irrelevant to one’s ownimage. Such a research agenda has potentially broad implications for work-place, school, andsocial practices and may provide greater predictive power on how to shape peer influenceacross diverse social contexts.
20
ReferencesAkerlof, George A, “A theory of social custom, of which unemployment may be one
consequence,” The quarterly journal of economics, 1980, 94 (4), 749–775.
and Rachel E Kranton, “Economics and Identity*,” The Quarterly Journal of Eco-nomics, 2000, 115 (3), 715–753.
Alpizar, Francisco, Fredrik Carlsson, and Olof Johansson-Stenman, “Anonymity,reciprocity, and conformity: Evidence from voluntary contributions to a national park inCosta Rica,” Journal of Public Economics, 2008, 92 (5), 1047–1060.
Andreoni, James and Douglas B Bernheim, “Social Image and the 50-50 Norm: ATheoretical and Experimental Analysis of Audience Effects,” Econometrica, 2009, 77 (5),1607–1636.
Bandiera, Oriana, Iwan Barankay, and Imran Rasul, “Social Incentives in the Work-place,” The Review of Economic Studies, 2010, 77 (2), 417–458.
Banerjee, Abhijit V, “A simple model of herd behavior,” The Quarterly Journal of Eco-nomics, 1992, 107 (3), 797–817.
Battaglini, Marco, Roland Bénabou, and Jean Tirole, “Self-Control in Peer Groups,”Journal of Economic Theory, 2005, 123 (2), 105–134.
Bénabou, Roland and Jean Tirole, “Incentives and Prosocial Behavior,” The AmericanEconomic Review, 2006, 96 (5), 1652–1678.
Benabou, Roland and Jean Tirole, “Laws and norms,” Technical Report, NationalBureau of Economic Research 2011.
Bernheim, B. Douglas, “A Theory of Conformity,” Journal of Political Economy, 1994,102 (5), 841–877.
Bernheim, B Douglas and Christine L Exley, “Understanding conformity: an experi-mental investigation,” Working Paper, 2015.
Bursztyn, Leonardo and Robert Jensen, “Social Image and Economic Behavior inthe Field: Identifying, Understanding and Shaping Social Pressure,” Annual Review ofEconomics, 2017, 9.
, Florian Ederer, Bruno Ferman, and Noam Yuchtman, “Understanding Mecha-nisms Underlying Peer Effects: Evidence from a Field Experiment on Financial Decisions,”Econometrica, 2014, 82 (4), 1273–1301.
, Georgy Egorov, and Robert Jensen, “Cool to be Smart or Smart to be Cool?Understanding Peer Pressure in Education,” The Review of Economic Studies, 2017.
21
Chen, Yan, F Maxwell Harper, Joseph Konstan, and Sherry Xin Li, “Social com-parisons and contributions to online communities: A field experiment on movielens,” TheAmerican economic review, 2010, 100 (4), 1358–1398.
Dahl, Gordon B, Katrine V Løken, and Magne Mogstad, “Peer Effects in ProgramParticipation,” American Economic Review, 2014, 104 (7), 2049–2074.
Dana, Jason, Roberto A Weber, and Jason Xi Kuang, “Exploiting Moral WiggleRoom: Experiments Demonstrating an Illusory Preference for Fairness,” Economic The-ory, 2007, 33 (1).
Duflo, Esther and Emmanuel Saez, “Participation and investment decisions in a retire-ment plan: the influence of colleagues’ choices,” Journal of Public Economics, 2002, 85(1), 121–148.
Exley, Christine L, “Excusing Selfishness in Charitable Giving: The Role of Risk,” TheReview of Economic Studies, 2016, 83 (2), 587–628.
Falk, Armin and Andrea Ichino, “Clean evidence on peer effects,” Journal of LaborEconomics, 2006, 24 (1), 39–57.
Festinger, Leon, “A Theory of Social Comparison Processes,” Human relations, 1954, 7(2), 117–140.
Foster, Andrew D and Mark R Rosenzweig, “Learning by Doing and Learning fromOthers: Human Capital and Technical Change in Agriculture,” Journal of Political Econ-omy, 1995, 103 (6), 1176–1209.
Frey, Bruno S and Stephan Meier, “Social comparisons and pro-social behavior: Test-ing” conditional cooperation” in a field experiment,” The American Economic Review,2004, 94 (5), 1717–1722.
Goette, Lorenz, David Huffman, and Stephan Meier, “The Impact of Group Mem-bership on Cooperation and Norm Enforcement: Evidence Using Random Assignment toReal Social Groups,” The American Economic Review, 2006, 96 (2), 212–216.
Hoxby, Caroline, “Peer effects in the classroom: Learning from gender and race variation,”Technical Report, National Bureau of Economic Research 2000.
Jones, Stephen R G, The economics of conformism, Blackwell, 1984.
Katz, Michael L and Carl Shapiro, “Technology adoption in the presence of networkexternalities,” Journal of political economy, 1986, 94 (4), 822–841.
Krupka, Erin and Roberto a Weber, “The focusing and informational effects of normason pro-social behavior,” Journal of Economic Psychology, 2009, 30 (3), 307–320.
Krupka, Erin L and Roberto A Weber, “Identifying social norms using coordinationgames: Why does dictator game sharing vary?,” Journal of the European Economic Asso-ciation, 2013, 11 (3), 495–524.
22

Mas, Alexandre and Enrico Moretti, “Peers at Work,” The American Economic Review,2009, 99 (1), 112–145.
Sacerdote, Bruce I, “Peer Effects with Random Assignment: Results for DartmouthRoommates,” Quarterly Journal of Economics, 2001, 116 (2), 681–704.
Shang, Jen and Rachel Croson, “A field experiment in charitable contribution: Theimpact of social information on the voluntary provision of public goods,” The EconomicJournal, 2009, 119 (540), 1422–1439.
Shue, Kelly, “Executive Networks and Firm Policies: Evidence from the Random Assign-ment of MBA Peers,” The Review of Financial Studies, 2013, (6), 1401–1442.
Zimmerman, David J, “Peer effects in academic outcomes: Evidence from a naturalexperiment,” Review of Economics and Statistics, 2003, 85 (1), 9–23.
23
A AppendixA.1 Results Appendix
Table A1: Effect of Treatment onTasks Allocation, by Donation
DV: Tasks Choice$5 3.234∗∗∗
(0.472)$10 7.468∗∗∗
(0.741)$15 11.270∗∗∗
(0.957)$20 14.541∗∗∗
(1.185)Treat x $2 0.559
(1.098)Treat x $5 1.538
(1.293)Treat x $10 2.433
(1.572)Treat x $15 3.020∗
(1.779)Treat x $20 4.537∗∗
(2.038)Constant 6.450∗∗∗
(0.815)R-Squared 0.212Subjects 219Observations 1095
Notes: This table individually presentsthe results of Figure 5 for each donationamount. Robust standard errors, clus-tered at the subject level, presented inparentheses.* p < 0.1, ** p < 0.05, *** p < 0.01
1
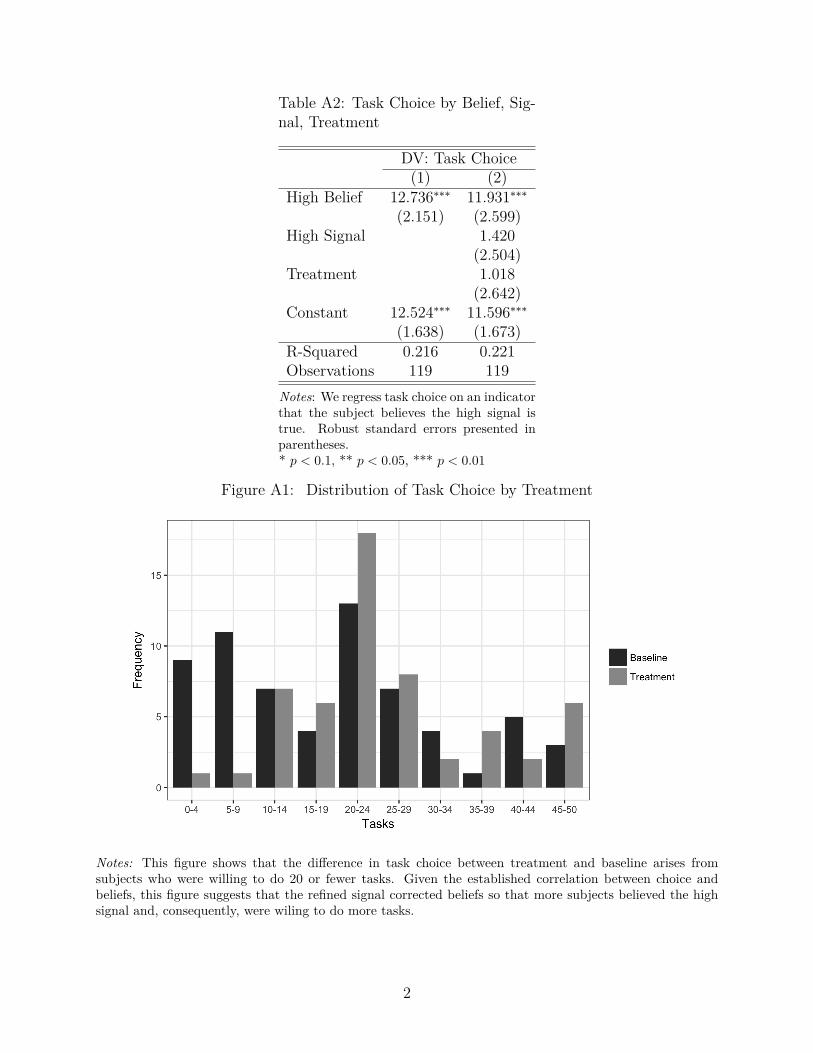
Table A2: Task Choice by Belief, Sig-nal, Treatment
DV: Task Choice(1) (2)
High Belief 12.736∗∗∗ 11.931∗∗∗(2.151) (2.599)
High Signal 1.420(2.504)
Treatment 1.018(2.642)
Constant 12.524∗∗∗ 11.596∗∗∗(1.638) (1.673)
R-Squared 0.216 0.221Observations 119 119
Notes: We regress task choice on an indicatorthat the subject believes the high signal istrue. Robust standard errors presented inparentheses.* p < 0.1, ** p < 0.05, *** p < 0.01
Figure A1: Distribution of Task Choice by Treatment
Notes: This figure shows that the difference in task choice between treatment and baseline arises fromsubjects who were willing to do 20 or fewer tasks. Given the established correlation between choice andbeliefs, this figure suggests that the refined signal corrected beliefs so that more subjects believed the highsignal and, consequently, were wiling to do more tasks.
2
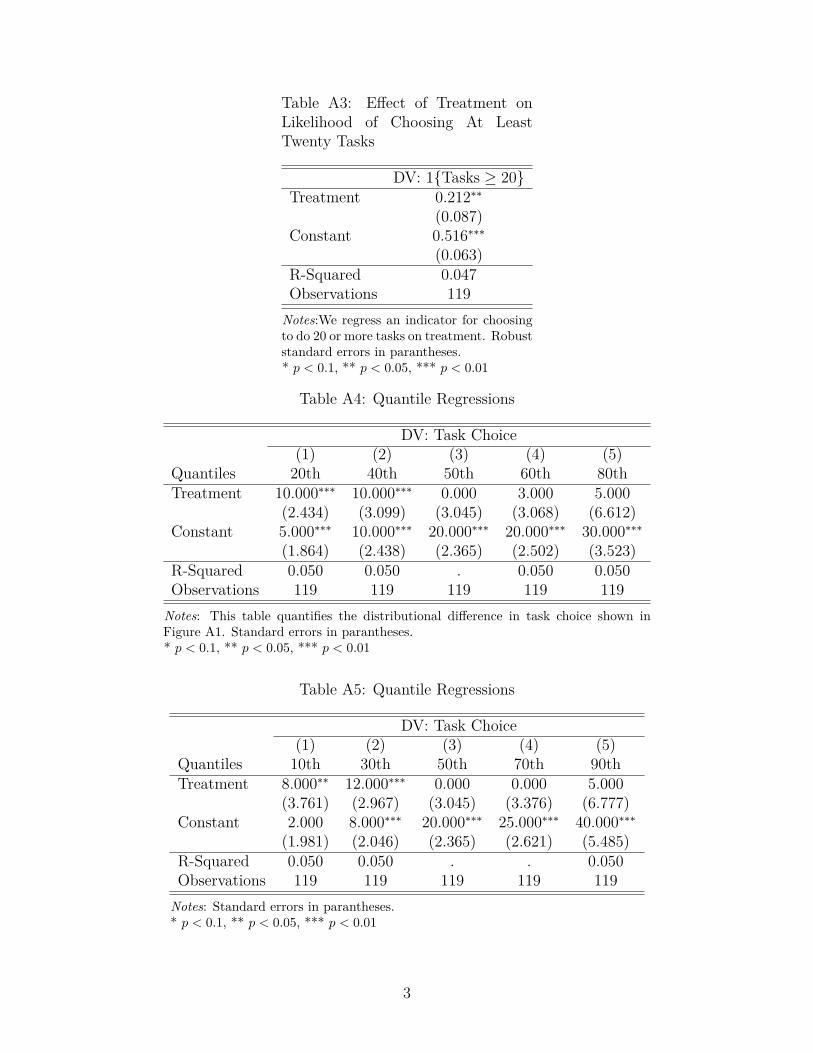
Table A3: Effect of Treatment onLikelihood of Choosing At LeastTwenty Tasks
DV: 1{Tasks ≥ 20}Treatment 0.212∗∗
(0.087)Constant 0.516∗∗∗
(0.063)R-Squared 0.047Observations 119
Notes:We regress an indicator for choosingto do 20 or more tasks on treatment. Robuststandard errors in parantheses.* p < 0.1, ** p < 0.05, *** p < 0.01
Table A4: Quantile Regressions
DV: Task Choice(1) (2) (3) (4) (5)
Quantiles 20th 40th 50th 60th 80thTreatment 10.000∗∗∗ 10.000∗∗∗ 0.000 3.000 5.000
(2.434) (3.099) (3.045) (3.068) (6.612)Constant 5.000∗∗∗ 10.000∗∗∗ 20.000∗∗∗ 20.000∗∗∗ 30.000∗∗∗
(1.864) (2.438) (2.365) (2.502) (3.523)R-Squared 0.050 0.050 . 0.050 0.050Observations 119 119 119 119 119
Notes: This table quantifies the distributional difference in task choice shown inFigure A1. Standard errors in parantheses.* p < 0.1, ** p < 0.05, *** p < 0.01
Table A5: Quantile Regressions
DV: Task Choice(1) (2) (3) (4) (5)
Quantiles 10th 30th 50th 70th 90thTreatment 8.000∗∗ 12.000∗∗∗ 0.000 0.000 5.000
(3.761) (2.967) (3.045) (3.376) (6.777)Constant 2.000 8.000∗∗∗ 20.000∗∗∗ 25.000∗∗∗ 40.000∗∗∗
(1.981) (2.046) (2.365) (2.621) (5.485)R-Squared 0.050 0.050 . . 0.050Observations 119 119 119 119 119
Notes: Standard errors in parantheses.* p < 0.1, ** p < 0.05, *** p < 0.01
3

Table A6: Small Sample t-test: Ef-fect of High Signal on Task Choice
Task DifferenceHigh Signal 9.608∗∗
(3.357)N High Signal 51N Low Signal 4N Overall 55
Notes: Standard errors in parantheses.* p < 0.1, ** p < 0.05, *** p < 0.01
Table A7: Effect of Treatment on Beliefof Received Signal
DV: 1{Believe Signal}Treatment 0.341∗∗∗
(0.078)Constant 0.531∗∗∗
(0.063)R-Squared 0.135Observations 119
Notes: Standard errors in parantheses.* p < 0.1, ** p < 0.05, *** p < 0.01
4
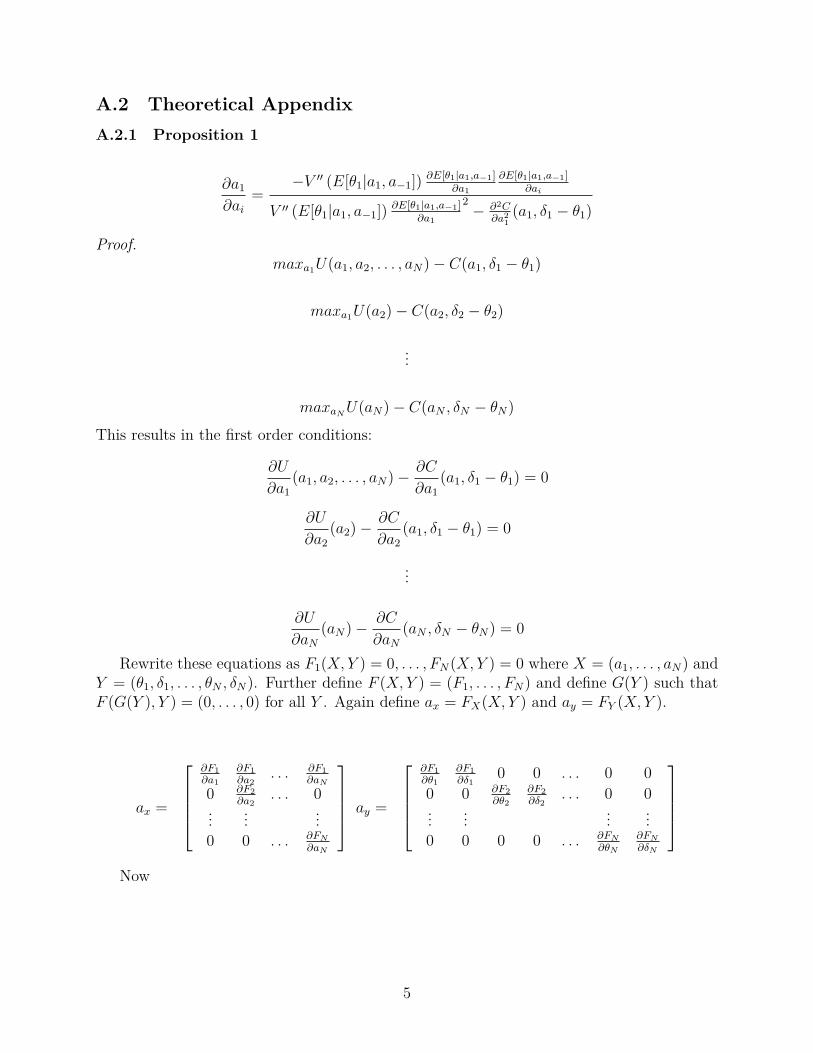
A.2 Theoretical AppendixA.2.1 Proposition 1
∂a1∂ai
=−V ′′ (E[θ1|a1, a−1])
∂E[θ1|a1,a−1]∂a1
∂E[θ1|a1,a−1]∂ai
V ′′ (E[θ1|a1, a−1])∂E[θ1|a1,a−1]
∂a1
2− ∂2C
∂a21(a1, δ1 − θ1)
Proof.maxa1U(a1, a2, . . . , aN)− C(a1, δ1 − θ1)
maxa1U(a2)− C(a2, δ2 − θ2)
...
maxaNU(aN)− C(aN , δN − θN)
This results in the first order conditions:
∂U
∂a1(a1, a2, . . . , aN)−
∂C
∂a1(a1, δ1 − θ1) = 0
∂U
∂a2(a2)−
∂C
∂a2(a1, δ1 − θ1) = 0
...
∂U
∂aN(aN)−
∂C
∂aN(aN , δN − θN) = 0
Rewrite these equations as F1(X,Y ) = 0, . . . , FN(X,Y ) = 0 where X = (a1, . . . , aN) andY = (θ1, δ1, . . . , θN , δN). Further define F (X,Y ) = (F1, . . . , FN) and define G(Y ) such thatF (G(Y ), Y ) = (0, . . . , 0) for all Y . Again define ax = FX(X,Y ) and ay = FY (X,Y ).
ax =
∂F1
∂a1
∂F1
∂a2. . . ∂F1
∂aN
0 ∂F2
∂a2. . . 0
... ... ...0 0 . . . ∂FN
∂aN
ay =
∂F1
∂θ1
∂F1
∂δ10 0 . . . 0 0
0 0 ∂F2
∂θ2
∂F2
∂δ2. . . 0 0
... ... ... ...0 0 0 0 . . . ∂FN
∂θN
∂FN
∂δN
Now
5
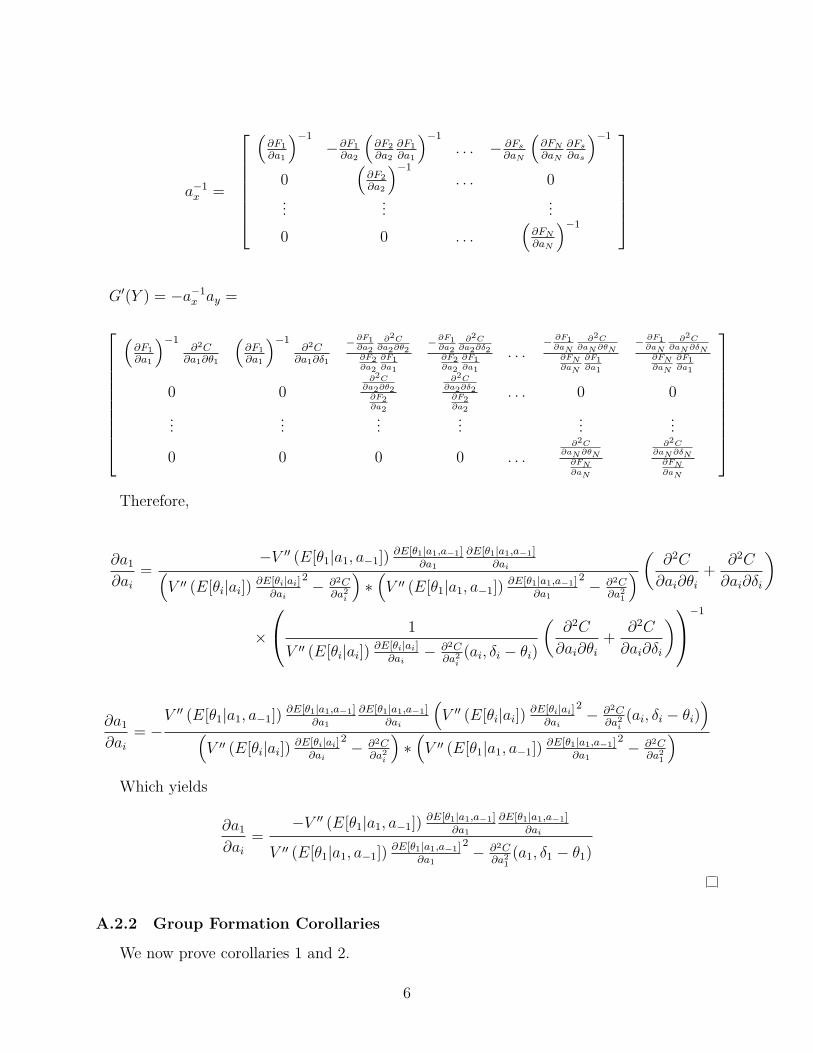
a−1x =
(∂F1
∂a1
)−1
−∂F1
∂a2
(∂F2
∂a2
∂F1
∂a1
)−1
. . . − ∂Fs
∂aN
(∂FN
∂aN
∂Fs
∂as
)−1
0(
∂F2
∂a2
)−1
. . . 0... ... ...0 0 . . .
(∂FN
∂aN
)−1
G′(Y ) = −a−1x ay =
(∂F1
∂a1
)−1∂2C
∂a1∂θ1
(∂F1
∂a1
)−1∂2C
∂a1∂δ1
− ∂F1∂a2
∂2C∂a2∂θ2
∂F2∂a2
∂F1∂a1
− ∂F1∂a2
∂2C∂a2∂δ2
∂F2∂a2
∂F1∂a1
. . .− ∂F1
∂aN
∂2C∂aN∂θN
∂FN∂aN
∂F1∂a1
− ∂F1∂aN
∂2C∂aN∂δN
∂FN∂aN
∂F1∂a1
0 0∂2C
∂a2∂θ2∂F2∂a2
∂2C∂a2∂δ2∂F2∂a2
. . . 0 0
... ... ... ... ... ...
0 0 0 0 . . .∂2C
∂aN∂θN∂FN∂aN
∂2C∂aN∂δN
∂FN∂aN
Therefore,
∂a1∂ai
=−V ′′ (E[θ1|a1, a−1])
∂E[θ1|a1,a−1]∂a1
∂E[θ1|a1,a−1]∂ai(
V ′′ (E[θi|ai]) ∂E[θi|ai]∂ai
2− ∂2C
∂a2i
)∗(V ′′ (E[θ1|a1, a−1])
∂E[θ1|a1,a−1]∂a1
2− ∂2C
∂a21
) (∂2C
∂ai∂θi+
∂2C
∂ai∂δi
)
×
1
V ′′ (E[θi|ai]) ∂E[θi|ai]∂ai
− ∂2C∂a2i
(ai, δi − θi)
(∂2C
∂ai∂θi+
∂2C
∂ai∂δi
)−1
∂a1∂ai
= −V ′′ (E[θ1|a1, a−1])
∂E[θ1|a1,a−1]∂a1
∂E[θ1|a1,a−1]∂ai
(V ′′ (E[θi|ai]) ∂E[θi|ai]
∂ai
2− ∂2C
∂a2i(ai, δi − θi)
)(V ′′ (E[θi|ai]) ∂E[θi|ai]
∂ai
2− ∂2C
∂a2i
)∗(V ′′ (E[θ1|a1, a−1])
∂E[θ1|a1,a−1]∂a1
2− ∂2C
∂a21
)Which yields
∂a1∂ai
=−V ′′ (E[θ1|a1, a−1])
∂E[θ1|a1,a−1]∂a1
∂E[θ1|a1,a−1]∂ai
V ′′ (E[θ1|a1, a−1])∂E[θ1|a1,a−1]
∂a1
2− ∂2C
∂a21(a1, δ1 − θ1)
A.2.2 Group Formation Corollaries
We now prove corollaries 1 and 2.
6

Proof. Recall that
∂a1∂ai
=−V ′′ (E[θ1|a1, a−1])
∂E[θ1|a1,a−1]∂a1
∂E[θ1|a1,a−1]∂ai
V ′′ (E[θ1|a1, a−1])∂E[θ1|a1,a−1]
∂a1
2− ∂2C
∂a21(a1, δ1 − θ1)
Therefore, it is sufficient to show that ∂E[θ1|a1,a2]∂a2
is decreasing in cov(δ1, δ2) for any given(a1, a2) and that ∂E[θ1|a1,a2]
∂a2< ∂E[θ1|a1,a3]
∂a3if and only if cov(δ1, δ2) > cov(δ1, δ3).
Recall that agent i solves ∂U∂ai
(ai) =∂C∂ai
(ai, δi−θi) where U is a known function. Since C isassumed invertible, given (a1, ai), agent 1 knows δ1− θ1 and δi− θi. Therefore, E[θ1|a1, ai] =E[θ1|δ1 − θ1, δi − θi].
Now let Ki = δi − θi. We first establish that K is decreasing in a. For this we willassume that conditions of lemma 1 hold. Then by applying IFT to foc 2 with Y = K we get∂a∗
∂K=
(V ′′ (E[θ|a]) ∂E[θ|a]
∂a
2− ∂2C
∂a2(a, δ − θ)
)−1∂2C∂a∂δ
(a, δ − θ) < 0. By definition we have thatE[θ|a] = E[θ|K(a)] = E[θ|K]. As such,
∂E[θ|a]∂a
=∂E[θ|K]
∂K
∂K
∂a
Similarly, since E[θi|ai, aj] = E[θi|K(ai), K(aj)] = E[θi|Ki, Kj]
∂E[θ1|a1, ai]∂ai
=∂E[θ1|K1, Ki]
∂Ki
∂Ki
∂ai
is decreasing – more negative – in ∂E[θ1|K1,Ki]∂Ki
.Let δ be distributed N(δ0, σδ) and θ be distributed N(θ0, σθ). Suppose that we have N
observations of δi − θi. What is E[θ1|δ1 − θ1, . . . , δN − θN ]?Consider the following vector of random variables:
x =
θ1
δ1 − θ1...
δN − θN
Because θi and δi are normally distributed, x ∼ N(µ,Σ). Where:
µ =
E[θ1]
E[δ1 − θ1]...
E[δN − θN ]
7
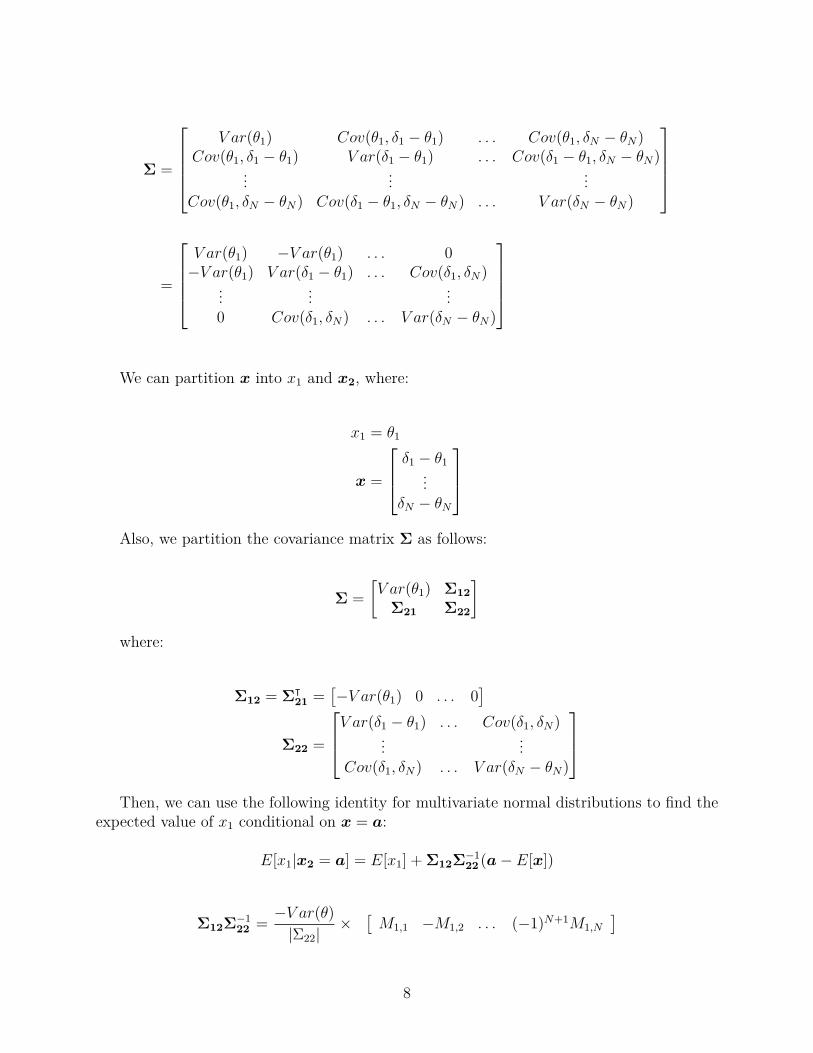
Σ =
V ar(θ1) Cov(θ1, δ1 − θ1) . . . Cov(θ1, δN − θN)
Cov(θ1, δ1 − θ1) V ar(δ1 − θ1) . . . Cov(δ1 − θ1, δN − θN)... ... ...
Cov(θ1, δN − θN) Cov(δ1 − θ1, δN − θN) . . . V ar(δN − θN)
=
V ar(θ1) −V ar(θ1) . . . 0−V ar(θ1) V ar(δ1 − θ1) . . . Cov(δ1, δN)
... ... ...0 Cov(δ1, δN) . . . V ar(δN − θN)
We can partition x into x1 and x2, where:
x1 = θ1
x =
δ1 − θ1...
δN − θN
Also, we partition the covariance matrix Σ as follows:
Σ =
[V ar(θ1) Σ12
Σ21 Σ22
]where:
Σ12 = Σ⊺21 =
[−V ar(θ1) 0 . . . 0
]Σ22 =
V ar(δ1 − θ1) . . . Cov(δ1, δN)... ...
Cov(δ1, δN) . . . V ar(δN − θN)
Then, we can use the following identity for multivariate normal distributions to find the
expected value of x1 conditional on x = a:
E[x1|x2 = a] = E[x1] +Σ12Σ−122 (a− E[x])
Σ12Σ−122 =
−V ar(θ)
|Σ22|×
[M1,1 −M1,2 . . . (−1)N+1M1,N
]
8

Where Mi,j is the determinant of the (N −1)× (N −1) matrix that results from deletingrow i and column j of Σ22. Since Σ22 is a symmetric matrix we have applied the propertythat Σ−1
22 = adjoint of Σ22
|Σ22| .This implies that the coefficient on the term [δi − θi − E[δ − θ]] is −V ar(θ)
|Σ22| (−1)i+1M1,i.Corollaries 1 and 2 follow directly.
A.2.3 Anticipation Effect
We know prove as increases in anticipation of social information.
Proof. Now the left hand side of 6 is larger than 5 by Jensen’s inequality (since V ′′′ > 0) if∂E[θs|as,n+1]
∂as− ∂E[θs|as,n]
∂as≤ 0 (since V ′′ < 0) and
∑Nn=1 P
′n(as)V (E [θs|as, n]) > 0.
We first establish that∑N
n=1 P′n(as)V (E [θs|as, n]) > 0. Note that
∑Nn=1 P
′n(as) =
0. Therefore we can establish∑N
n=1 P′n(as)V (E [θs|as, n]) > 0 by demonstrating that
∂∂as
Pn+1(as)Pn(as)
> 0 and V (E [θs|as, n+ 1]) < V (E [θs|as, n]). For the following let Ks = δs − θs
Pn+1(as)
Pn(as)=
Pn+1(Ks(as))
Pn(Ks(as))
∂
∂as
Pn+1(as)
Pn(as)=
∂
∂Ks
Pn+1(Ks(as))
Pn(Ks(as))
∂Ks
∂as
Now,
Pn+1(Ks|δ)Pn(Ks|δ)
=Fθ(δ −Ks)
n(1− Fθ(δ −Ks))N−n−1
Fθ(δ −Ks)n−1(1− Fθ(δ −Ks))N−n=
Fθ(δ −Ks)
1− Fθ(δ −Ks).
And
∂
∂Ks
Pn+1(Ks|δ)Pn(Ks|δ)
=−1
(1− Fθ(δ −Ks)2< 0
.But if ∂
∂Ks
Pn+1(Ks|δ)Pn(Ks|δ) < 0 for all δ then we know that ∂
∂Ks
Pn+1(Ks)Pn(Ks)
< 0, and ∂∂as
Pn+1(as)Pn(as)
=∂
∂Ks
Pn+1(as)Pn(Ks(as))
∂Ks
∂as> 0 because ∂Ks
∂as< 0.
We next show that E[θs|as, n+ 1] > E[θ|as, n].
E[θs|as, n] = θs − δ+
1∫R fθ(δ −Ks)Πm<nFθ(δ −Ks)Πm>n(1− Fθ(δ −Ks))fδ(δ)dδ∫
Rδfθ(δ −Ks, δ −Ki)Πm<nFθ(δ −Ks)Πm>n(1− Fθ(δ −Ks))fδ(δ)dδ
9

Then
E[θs|as, n+ 1]− E[θs|as, n]
=1∫
R fθ(δ −Ks)Πm<n+1Fθ(δ −Ks)Πm>n+1(1− Fθ(δ −Ks))fδ(δ)dδ∫Rδfθ(δ −Ks, δ −Ki)Πm<n+1Fθ(δ −Ks)Πm>n+1(1− Fθ(δ −Ks))fδ(δ)dδ
− 1∫R fθ(δ −Ks)Πm<nFθ(δ −Ks)Πm>n(1− Fθ(δ −Ks))fδ(δ)dδ∫
Rδfθ(δ −Ks, δ −Ki)Πm<nFθ(δ −Ks)Πm>n(1− Fθ(δ −Ks))fδ(δ)dδ
But
1∫R fθ(δ −Ks)Πm<n+1Fθ(δ −Ks)Πm>n+1(1− Fθ(δ −Ks))fδ(δ)dδ∫
Rfθ(δ −Ks, δ −Ki)Πm<n+1Fθ(δ −Ks)Πm>n+1(1− Fθ(δ −Ks))fδ(δ)dδ
=1∫
R fθ(δ −Ks)Πm<nFθ(δ −Ks)Πm>n(1− Fθ(δ −Ks))fδ(δ)dδ∫Rfθ(δ −Ks, δ −Ki)Πm<nFθ(δ −Ks)Πm>n(1− Fθ(δ −Ks))fδ(δ)dδ
So the sign of E[θs|Ks, n+1]−E[θs|Ks, n] can be judged by which values of δ receive orlose relative probability density.
Abusing notation,
Pr[δs|Ks, n+ 1]− Pr[δs|Ks, n]
=fθ(δ −Ks)Πm<n+1Fθ(δ −Ks)Πm>n+1(1− Fθ(δ −Ks))fδ(δ)∫
R fθ(δ −Ks)Πm<n+1Fθ(δ −Ks)Πm>n+1(1− Fθ(δ −Ks))fδ(δ)dδ
− fθ(δ −Ks)Πm<nFθ(δ −Ks)Πm>n(1− Fθ(δ −Ks))fδ(δ)∫R fθ(δ −Ks)Πm<nFθ(δ −Ks)Πm>n(1− Fθ(δ −Ks))fδ(δ)dδ
Pr[δs|Ks, n+ 1]− Pr[δs|Ks, n]
=fθ(δ −Ks)Fθ(δ −Ks)
n(1− Fθ(δ −Ks))N−n−1fδ(δ)∫
R fθ(δ −Ks)Fθ(δ −Ks)n(1− Fθ(δ −Ks))N−n−1fδ(δ)dδ
− fθ(δ −Ks)Fθ(δ −Ks)n−1(1− Fθ(δ −Ks))
N−nfδ(δ)∫R fθ(δ −Ks)Fθ(δ −Ks)n−1(1− Fθ(δ −Ks))N−nfδ(δ)dδ
10

Pr[δs|Ks, n+ 1]− Pr[δs|Ks, n] > 0
⇐⇒ fθ(δ −Ks)Fθ(δ −Ks)n(1− Fθ(δ −Ks))
N−n−1fδ(δ)
−∫R fθ(δ −Ks)Fθ(δ −Ks)
n(1− Fθ(δ −Ks))N−n−1fδ(δ)dδ∫
R fθ(δ −Ks)Fθ(δ −Ks)n−1(1− Fθ(δ −Ks))N−nfδ(δ)dδ
× fθ(δ −Ks)Fθ(δ −Ks)n−1(1− Fθ(δ −Ks))
N−nfδ(δ) > 0
Pr[δs|Ks, n+ 1]− Pr[δs|Ks, n] > 0
⇐⇒ fδ(δ)fθ(δ −Ks)[Fθ(δ −Ks)
n(1− Fθ(δ −Ks))N−n−1 − C ∗ Fθ(δ −Ks)
n−1(1− Fθ(δ −Ks))N−n
]> 0
Where C =∫R fθ(δ−Ks)Fθ(δ−Ks)n(1−Fθ(δ−Ks))N−n−1fδ(δ)dδ∫R fθ(δ−Ks)Fθ(δ−Ks)n−1(1−Fθ(δ−Ks))N−nfδ(δ)dδ
Pr[δs|Ks, n+ 1]− Pr[δs|Ks, n] > 0
⇐⇒ fδ(δ)fθ(δ −Ks)[Fθ(δ −Ks)
n−1(1− Fθ(δ −Ks))N−n−1(Fθ(δ −Ks)− C + CFθ(δ −Ks))
]> 0
Pr[δs|Ks, n+ 1]− Pr[δs|Ks, n] > 0
⇐⇒ fδ(δ)fθ(δ −Ks)[Fθ(δ −Ks)
n−1(1− Fθ(δ −Ks))N−n−1((1 + C)Fθ(δ −Ks)− C)
]> 0
Therefore, iff δ > F−1θ ( C
1−C) +Ks it receives greater probability weight under rank n+ 1
than under rank n. The opposite is true for δ < F−1θ ( C
1−C)+Ks. Therefore, E[θs|Ks(as), n+
1] > E[θs|Ks(as), n].Lastly, we will demonstrate ∂E[θs|as,n+1]
∂as− ∂E[θs|as,n]
∂as≤ 0. Note: Through all of this we
are assuming Ks(as) is not rank dependent because as is chosen prior to the rank beingrevealed. Further, Ks is observable to the decision maker at the moment he is making hisdecision through the marginal cost of his action.
∂E[θs|Ks, n]
∂Ks
= 1 +∂
∂Ks
∫R δfθ(δ −Ks)Fθ(δ −Ks)
n−1(1− Fθ(δ −Ks))N−nfδ(δ)dδ∫
R fθ(δ −Ks)Fθ(δ −Ks)n−1(1− Fθ(δ −Ks))N−nfδ(δ)dδ
∂E[θs|Ks, n+ 1]
∂Ks
= 1 +∂
∂Ks
∫R δfθ(δ −Ks)Fθ(δ −Ks)
n(1− Fθ(δ −Ks))N−n−1fδ(δ)dδ∫
R fθ(δ −Ks)Fθ(δ −Ks)n(1− Fθ(δ −Ks))N−n−1fδ(δ)dδ
11

∂E[θs|Ks, n+ 1]
∂Ks
− ∂E[θs|Ks, n]
∂Ks
=∂
∂Ks
∫R δfθ(δ −Ks)Fθ(δ −Ks)
n(1− Fθ(δ −Ks))N−n−1fδ(δ)dδ∫
R fθ(δ −Ks)Fθ(δ −Ks)n(1− Fθ(δ −Ks))N−n−1fδ(δ)dδ
− ∂
∂Ks
∫R δfθ(δ −Ks)Fθ(δ −Ks)
n−1(1− Fθ(δ −Ks))N−nfδ(δ)dδ∫
R fθ(δ −Ks)Fθ(δ −Ks)n−1(1− Fθ(δ −Ks))N−nfδ(δ)dδ
But
∂
∂Ks
∫R fθ(δ −Ks)Fθ(δ −Ks)
n(1− Fθ(δ −Ks))N−n−1fδ(δ)dδ∫
R fθ(δ −Ks)Fθ(δ −Ks)n(1− Fθ(δ −Ks))N−n−1fδ(δ)dδ
=∂
∂Ks
∫R fθ(δ −Ks)Fθ(δ −Ks)
n−1(1− Fθ(δ −Ks))N−nfδ(δ)dδ∫
R fθ(δ −Ks)Fθ(δ −Ks)n−1(1− Fθ(δ −Ks))N−nfδ(δ)dδ
So we consider probability weight given an δ:
∂
∂Ks
fθ(δ −Ks)Fθ(δ −Ks)n(1− Fθ(δ −Ks))
N−n−1fδ(δ)dδ∫R fθ(δ −Ks)Fθ(δ −Ks)n(1− Fθ(δ −Ks))N−n−1fδ(δ)dδ
=−1(∫
R fθ(δ −Ks)Fθ(δ −Ks)n(1− Fθ(δ −Ks))N−n−1fδ(δ)dδ)2([
Fθ(δ −Ks)n(1− Fθ(δ −Ks))
N−n−1 [fθ‘(δ −Ks)fδ(δ)]
+ nFθ(δ −Ks)n−1(1− Fθ(δ −Ks))
N−n−1[fθ(δ −Ks)
2fδ(δ)]
− (N − n− 1)Fθ(δ −Ks)n(1− Fθ(δ −Ks))
N−n−2[fθ(δ −Ks)
2fδ(δ)] ]
∫Rfθ(δ −Ks)Fθ(δ −Ks)
n(1− Fθ(δ −Ks))N−n−1fδ(δ)dδ
− fθ(δ −Ks)Fθ(δ −Ks)n(1− Fθ(δ −Ks))
N−n−1fδ(δ)∫R
[Fθ(δ −Ks)
n(1− Fθ(δ −Ks))N−n−1 [f ′
θ(δ −Ks)fδ(δ)]
+ nFθ(δ −Ks)n−1(1− Fθ(δ −Ks))
N−n−1[fθ(δ −Ks)
2fδ(δ)]
− (N − n− 1)Fθ(δ −Ks)n(1− Fθ(δ −Ks))
N−n−2[fθ(δ −Ks)
2fδ(δ)] ])
12

∂
∂Ks
fθ(δ −Ks)Fθ(δ −Ks)n−1(1− Fθ(δ −Ks))
N−nfδ(δ)dδ∫R fθ(δ −Ks)Fθ(δ −Ks)n−1(1− Fθ(δ −Ks))N−nfδ(δ)dδ
=−1(∫
R fθ(δ −Ks)Fθ(δ −Ks)n−1(1− Fθ(δ −Ks))N−nfδ(δ)dδ)2([
Fθ(δ −Ks)n−1(1− Fθ(δ −Ks))
N−n[f ′θ(δi −Ks)fθ(δ −Ks)fδ(δ)
]+ (n− 1)Fθ(δ −Ks)
n−2(1− Fθ(δ −Ks))N−n
[fθ(δ −Ks)
2fδ(δ)]
− (N − n)Fθ(δ −Ks)n−1(1− Fθ(δ −Ks))
N−n−1[fθ(δ −Ks)
2fδ(δ)] ]
∫Rfθ(δ −Ks)Fθ(δ −Ks)
n−1(1− Fθ(δ −Ks))N−nfδ(δ)dδ
− fθ(δ −Ks)Fθ(δ −Ks)n−1(1− Fθ(δ −Ks))
N−nfδ(δ)∫R
[Fθ(δ −Ks)
n−1(1− Fθ(δ −Ks))N−n
[f ′θ(δi −Ks)fθ(δ −Ks)fδ(δ)
]+ (n− 1)Fθ(δ −Ks)
n−2(1− Fθ(δ −Ks))N−n
[fθ(δ −Ks)
2fδ(δ)]
− (N − n)Fθ(δ −Ks)n−1(1− Fθ(δ −Ks))
N−n−1[fθ(δ −Ks)
2fδ(δ)] ]
dδ
)Then
13

∂Prob[θs|Ks, n+ 1]
∂Ks− ∂Prob[θs|Ks, n]
∂Ks> 0
⇐⇒ 1(∫R fθ(δ −Ks)Fθ(δ −Ks)n−1(1− Fθ(δ −Ks))N−nfδ(δ)dδ
)2([Fθ(δ −Ks)
n−1(1− Fθ(δ −Ks))N−n
[f ′θ(δ −Ks)fδ(δ)
]+ (n− 1)Fθ(δ −Ks)
n−2(1− Fθ(δ −Ks))N−n
[fθ(δ −Ks)
2fδ(δ)]
− (N − n)Fθ(δ −Ks)n−1(1− Fθ(δ −Ks))
N−n−1[fθ(δ −Ks)
2fδ(δ)] ]
∫Rfθ(δ −Ks)Fθ(δ −Ks)
n−1(1− Fθ(δ −Ks))N−nfδ(δ)dδ
− fθ(δ −Ks)Fθ(δ −Ks)n−1(1− Fθ(δ −Ks))
N−nfδ(δ)∫R
[Fθ(δ −Ks)
n−1(1− Fθ(δ −Ks))N−n
[f ′θ(δ −Ks)fδ(δ)
]+ (n− 1)Fθ(δ −Ks)
n−2(1− Fθ(δ −Ks))N−n
[fθ(δ −Ks)
2fδ(δ)]
− (N − n)Fθ(δ −Ks)n−1(1− Fθ(δ −Ks))
N−n−1[fθ(δ −Ks)
2fδ(δ)] ]
dδ
)− 1(∫
R fθ(δ −Ks)Fθ(δ −Ks)n(1− Fθ(δ −Ks))N−n−1fδ(δ)dδ)2([
Fθ(δ −Ks)n(1− Fθ(δ −Ks))
N−n−1[f ′θ(δ −Ks)fδ(δ)
]+ nFθ(δ −Ks)
n−1(1− Fθ(δ −Ks))N−n−1
[fθ(δ −Ks)
2fδ(δ)]
− (N − n− 1)Fθ(δ −Ks)n(1− Fθ(δ −Ks))
N−n−2[fθ(δ −Ks)
2fδ(δ)] ]
∫Rfθ(δ −Ks)Fθ(δ −Ks)
n(1− Fθ(δ −Ks))N−n−1fδ(δ)dδ
− fθ(δ −Ks)Fθ(δ −Ks)n(1− Fθ(δ −Ks))
N−n−1fδ(δ)∫R
[Fθ(δ −Ks)
n(1− Fθ(δ −Ks))N−n−1
[f ′θ(δ −Ks)fδ(δ)
]+ nFθ(δ −Ks)
n−1(1− Fθ(δ −Ks))N−n−1
[fθ(δ −Ks)
2fδ(δ)]
− (N − n− 1)Fθ(δ −Ks)n(1− Fθ(δ −Ks))
N−n−2[fθ(δ −Ks)
2fδ(δ)] ]
dδ
)> 0
14

⇐⇒ Fθ(δ −Ks)n−2(1− Fθ(δ −Ks))
N−n−1(∫R fθ(δ −Ks)Fθ(δ −Ks)n−1(1− Fθ(δ −Ks))N−nfδ(δ)dδ
)2([Fθ(δ −Ks)(1− Fθ(δ −Ks))
[f ′θ(δ −Ks)fδ(δ)
]+ (n− 1)(1− Fθ(δ −Ks))
[fθ(δ −Ks)
2fδ(δ)]
− (N − n)Fθ(δ −Ks)[fθ(δ −Ks)
2fδ(δ)] ]
∫Rfθ(δ −Ks)Fθ(δ −Ks)
n−1(1− Fθ(δ −Ks))N−nfδ(δ)dδ
− fθ(δ −Ks)Fθ(δ −Ks)(1− Fθ(δ −Ks))fδ(δ)∫R
[Fθ(δ −Ks)
n−1(1− Fθ(δ −Ks))N−n
[f ′θ(δ −Ks)fδ(δ)
]+ (n− 1)Fθ(δ −Ks)
n−2(1− Fθ(δ −Ks))N−n
[fθ(δ −Ks)
2fδ(δ)]
− (N − n)Fθ(δ −Ks)n−1(1− Fθ(δ −Ks))
N−n−1[fθ(δ −Ks)
2fδ(δ)] ]
dδ
)− Fθ(δ −Ks)
n−1(1− Fθ(δ −Ks))N−n−2(∫
R fθ(δ −Ks)Fθ(δ −Ks)n(1− Fθ(δ −Ks))N−n−1fδ(δ)dδ)2([
Fθ(δ −Ks)(1− Fθ(δ −Ks))[f ′θ(δ −Ks)fδ(δ)
]+ n(1− Fθ(δ −Ks))
[fθ(δ −Ks)
2fδ(δ)]
− (N − n− 1)Fθ(δ −Ks)[fθ(δ −Ks)
2fδ(δ)] ]
∫Rfθ(δ −Ks)Fθ(δ −Ks)
n(1− Fθ(δ −Ks))N−n−1fδ(δ)dδ
− fθ(δ −Ks)Fθ(δ −Ks)(1− Fθ(δ −Ks))fδ(δ)∫Rfθ(δ −Ks)Fθ(δ −Ks)
n(1− Fθ(δ −Ks))N−n−1fδ(δ)dδ
− fθ(δ −Ks)Fθ(δ −Ks)n(1− Fθ(δ −Ks))
N−n−1fδ(δ)∫R
[Fθ(δ −Ks)
n(1− Fθ(δ −Ks))N−n−1
[f ′θ(δ −Ks)fδ(δ)
]+ nFθ(δ −Ks)
n−1(1− Fθ(δ −Ks))N−n−1
[fθ(δ −Ks)
2fδ(δ)]
− (N − n− 1)Fθ(δ −Ks)n(1− Fθ(δ −Ks))
N−n−2[fθ(δ −Ks)
2fδ(δ)] ]
dδ
)> 0
15
⇐⇒ 1 >Fθ(δ −Ks)
1− Fθ(δ −Ks)×
(∫R fθ(δ −Ks)Fθ(δ −Ks)
n−1(1− Fθ(δ −Ks))N−nfδ(δ)dδ
)2(∫R fθ(δ −Ks)Fθ(δ −Ks)n(1− Fθ(δ −Ks))N−n−1fδ(δ)dδ
)2×([
Fθ(δ −Ks)(1− Fθ(δ −Ks))[f ′θ(δ −Ks)fδ(δ)
]+ n(1− Fθ(δ −Ks))
[fθ(δ −Ks)
2fδ(δ)]
− (N − n− 1)Fθ(δ −Ks)[fθ(δ −Ks)
2fδ(δ)] ]
∫Rfθ(δ −Ks)Fθ(δ −Ks)
n(1− Fθ(δ −Ks))N−n−1fδ(δ)dδ
− fθ(δ −Ks)Fθ(δ −Ks)(1− Fθ(δ −Ks))fδ(δ)∫Rfθ(δ −Ks)Fθ(δ −Ks)
n(1− Fθ(δ −Ks))N−n−1fδ(δ)dδ
− fθ(δ −Ks)Fθ(δ −Ks)n(1− Fθ(δ −Ks))
N−n−1fδ(δ)∫R
[Fθ(δ −Ks)
n(1− Fθ(δ −Ks))N−n−1
[f ′θ(δ −Ks)fδ(δ)
]+ nFθ(δ −Ks)
n−1(1− Fθ(δ −Ks))N−n−1
[fθ(δ −Ks)
2fδ(δ)]
− (N − n− 1)Fθ(δ −Ks)n(1− Fθ(δ −Ks))
N−n−2[fθ(δ −Ks)
2fδ(δ)] ]
dδ
)−1
×([
Fθ(δ −Ks)(1− Fθ(δ −Ks))[f ′θ(δ −Ks)fδ(δ)
]+ n(1− Fθ(δ −Ks))
[fθ(δ −Ks)
2fδ(δ)]
− (N − n− 1)Fθ(δ −Ks)[fθ(δ −Ks)
2fδ(δ)] ]
∫Rfθ(δ −Ks)Fθ(δ −Ks)
n(1− Fθ(δ −Ks))N−n−1fδ(δ)dδ
− fθ(δ −Ks)Fθ(δ −Ks)(1− Fθ(δ −Ks))fδ(δ)∫Rfθ(δ −Ks)Fθ(δ −Ks)
n(1− Fθ(δ −Ks))N−n−1fδ(δ)dδ
− fθ(δ −Ks)Fθ(δ −Ks)n(1− Fθ(δ −Ks))
N−n−1fδ(δ)∫R
[Fθ(δ −Ks)
n(1− Fθ(δ −Ks))N−n−1
[f ′θ(δ −Ks)fδ(δ)
]+ nFθ(δ −Ks)
n−1(1− Fθ(δ −Ks))N−n−1
[fθ(δ −Ks)
2fδ(δ)]
− (N − n− 1)Fθ(δ −Ks)n(1− Fθ(δ −Ks))
N−n−2[fθ(δ −Ks)
2fδ(δ)] ]
dδ
)Since Fθ(δ−Ks)
1−Fθ(δ−Ks)is the only term in the expression where δ is neither integrated out or identically
placed in the numerator and denominator, we know that ∂Prob[θs|Ks,n+1]∂Ks
− ∂Prob[θs|Ks,n]∂Ks
> 0 holdsfor smaller values of δ. And as such ∂E[θs|as,n+1]
∂as− ∂E[θs|as,n]
∂as≤ 0.
16
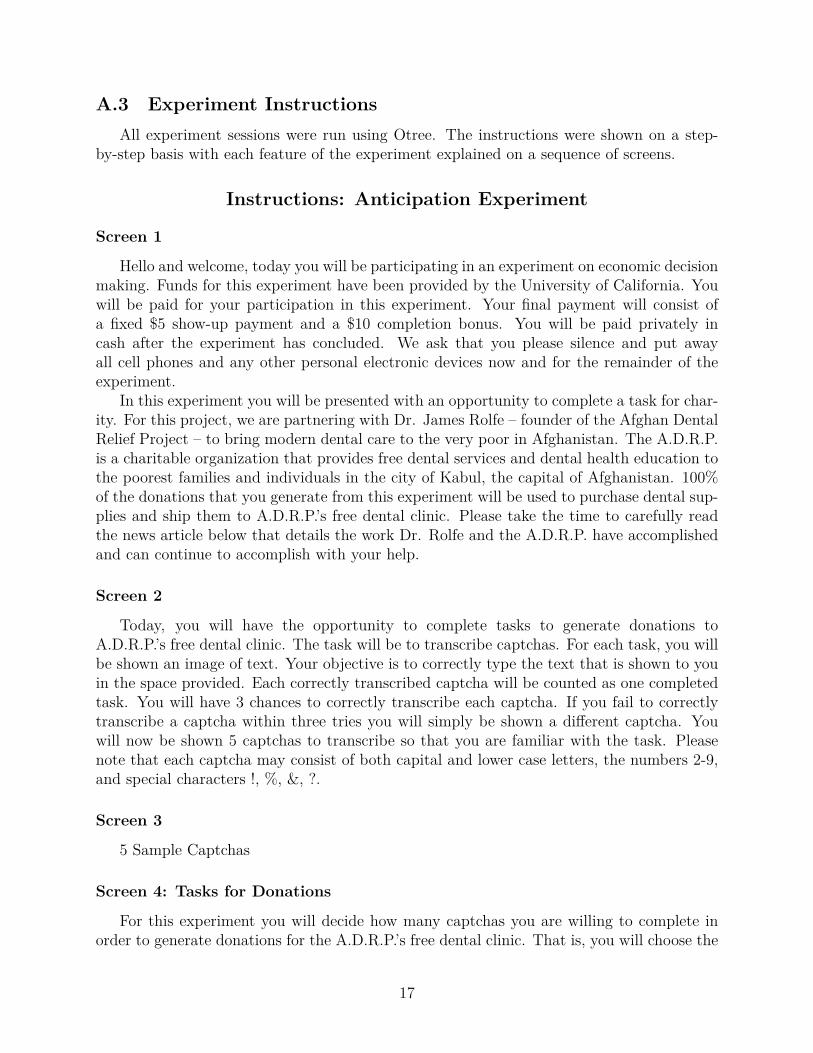
A.3 Experiment InstructionsAll experiment sessions were run using Otree. The instructions were shown on a step-
by-step basis with each feature of the experiment explained on a sequence of screens.
Instructions: Anticipation Experiment
Screen 1
Hello and welcome, today you will be participating in an experiment on economic decisionmaking. Funds for this experiment have been provided by the University of California. Youwill be paid for your participation in this experiment. Your final payment will consist ofa fixed $5 show-up payment and a $10 completion bonus. You will be paid privately incash after the experiment has concluded. We ask that you please silence and put awayall cell phones and any other personal electronic devices now and for the remainder of theexperiment.
In this experiment you will be presented with an opportunity to complete a task for char-ity. For this project, we are partnering with Dr. James Rolfe – founder of the Afghan DentalRelief Project – to bring modern dental care to the very poor in Afghanistan. The A.D.R.P.is a charitable organization that provides free dental services and dental health education tothe poorest families and individuals in the city of Kabul, the capital of Afghanistan. 100%of the donations that you generate from this experiment will be used to purchase dental sup-plies and ship them to A.D.R.P.’s free dental clinic. Please take the time to carefully readthe news article below that details the work Dr. Rolfe and the A.D.R.P. have accomplishedand can continue to accomplish with your help.
Screen 2
Today, you will have the opportunity to complete tasks to generate donations toA.D.R.P.’s free dental clinic. The task will be to transcribe captchas. For each task, you willbe shown an image of text. Your objective is to correctly type the text that is shown to youin the space provided. Each correctly transcribed captcha will be counted as one completedtask. You will have 3 chances to correctly transcribe each captcha. If you fail to correctlytranscribe a captcha within three tries you will simply be shown a different captcha. Youwill now be shown 5 captchas to transcribe so that you are familiar with the task. Pleasenote that each captcha may consist of both capital and lower case letters, the numbers 2-9,and special characters !, %, &, ?.
Screen 3
5 Sample Captchas
Screen 4: Tasks for Donations
For this experiment you will decide how many captchas you are willing to complete inorder to generate donations for the A.D.R.P.’s free dental clinic. That is, you will choose the
17
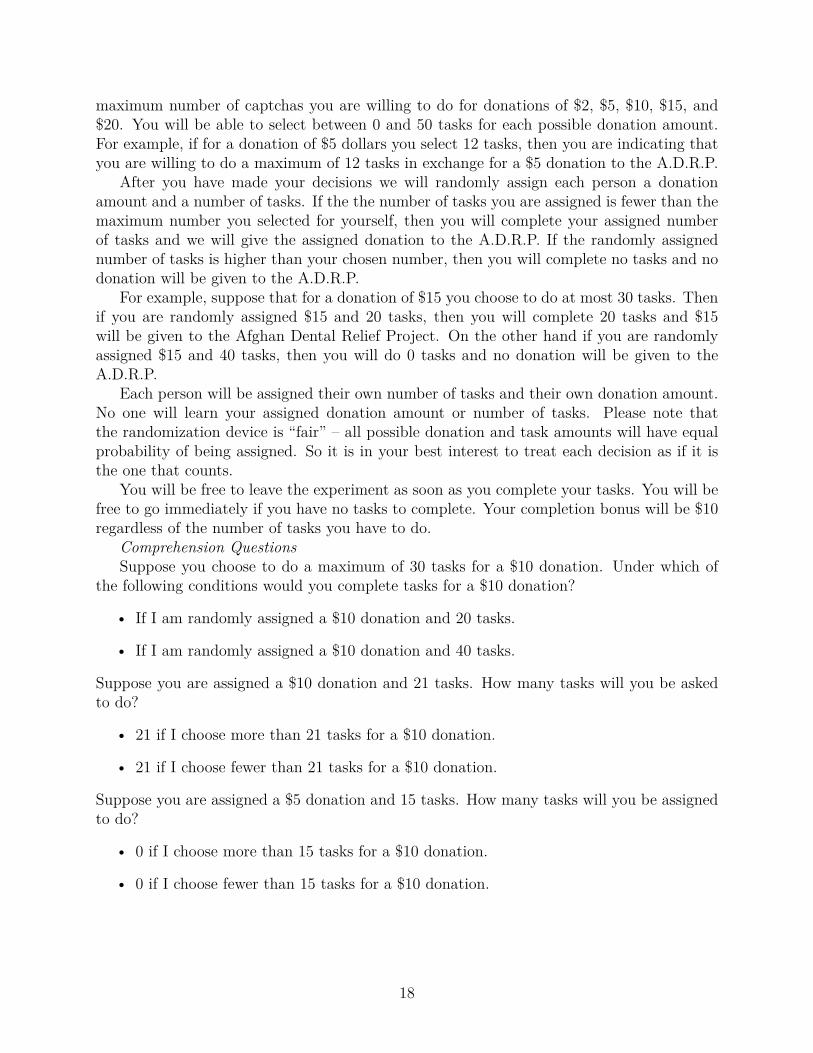
maximum number of captchas you are willing to do for donations of $2, $5, $10, $15, and$20. You will be able to select between 0 and 50 tasks for each possible donation amount.For example, if for a donation of $5 dollars you select 12 tasks, then you are indicating thatyou are willing to do a maximum of 12 tasks in exchange for a $5 donation to the A.D.R.P.
After you have made your decisions we will randomly assign each person a donationamount and a number of tasks. If the the number of tasks you are assigned is fewer than themaximum number you selected for yourself, then you will complete your assigned numberof tasks and we will give the assigned donation to the A.D.R.P. If the randomly assignednumber of tasks is higher than your chosen number, then you will complete no tasks and nodonation will be given to the A.D.R.P.
For example, suppose that for a donation of $15 you choose to do at most 30 tasks. Thenif you are randomly assigned $15 and 20 tasks, then you will complete 20 tasks and $15will be given to the Afghan Dental Relief Project. On the other hand if you are randomlyassigned $15 and 40 tasks, then you will do 0 tasks and no donation will be given to theA.D.R.P.
Each person will be assigned their own number of tasks and their own donation amount.No one will learn your assigned donation amount or number of tasks. Please note thatthe randomization device is “fair” – all possible donation and task amounts will have equalprobability of being assigned. So it is in your best interest to treat each decision as if it isthe one that counts.
You will be free to leave the experiment as soon as you complete your tasks. You will befree to go immediately if you have no tasks to complete. Your completion bonus will be $10regardless of the number of tasks you have to do.
Comprehension QuestionsSuppose you choose to do a maximum of 30 tasks for a $10 donation. Under which of
the following conditions would you complete tasks for a $10 donation?
• If I am randomly assigned a $10 donation and 20 tasks.
• If I am randomly assigned a $10 donation and 40 tasks.
Suppose you are assigned a $10 donation and 21 tasks. How many tasks will you be askedto do?
• 21 if I choose more than 21 tasks for a $10 donation.
• 21 if I choose fewer than 21 tasks for a $10 donation.
Suppose you are assigned a $5 donation and 15 tasks. How many tasks will you be assignedto do?
• 0 if I choose more than 15 tasks for a $10 donation.
• 0 if I choose fewer than 15 tasks for a $10 donation.
18
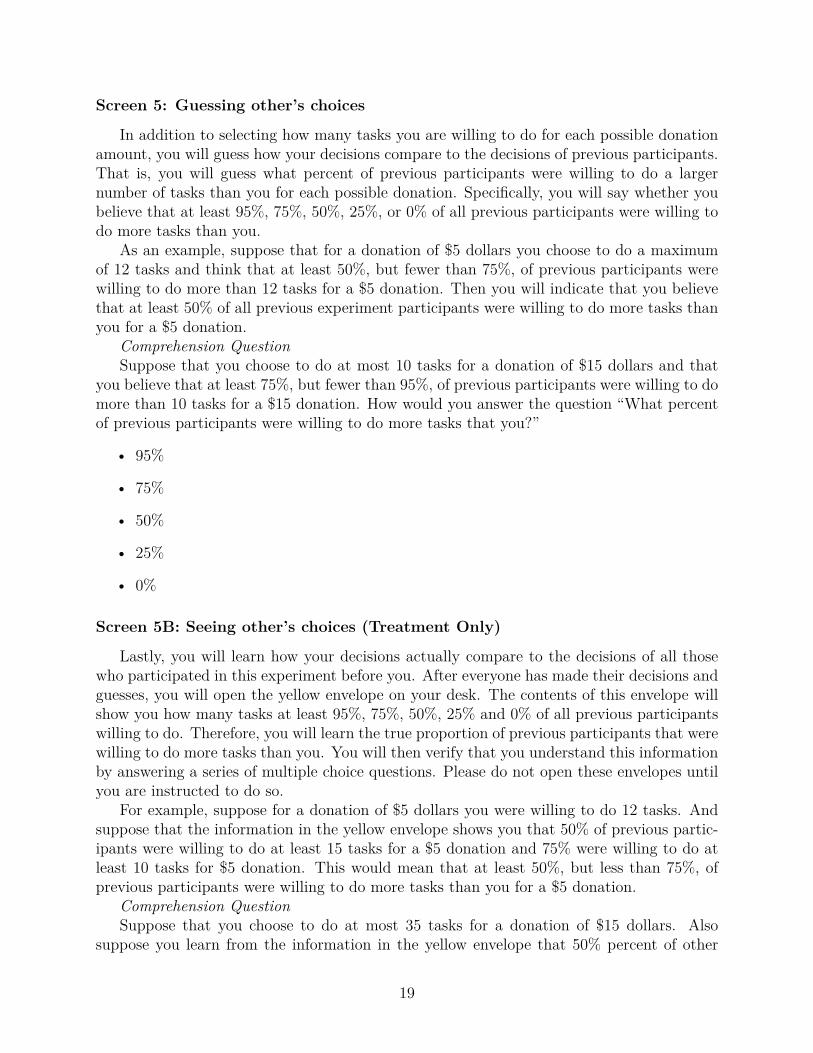
Screen 5: Guessing other’s choices
In addition to selecting how many tasks you are willing to do for each possible donationamount, you will guess how your decisions compare to the decisions of previous participants.That is, you will guess what percent of previous participants were willing to do a largernumber of tasks than you for each possible donation. Specifically, you will say whether youbelieve that at least 95%, 75%, 50%, 25%, or 0% of all previous participants were willing todo more tasks than you.
As an example, suppose that for a donation of $5 dollars you choose to do a maximumof 12 tasks and think that at least 50%, but fewer than 75%, of previous participants werewilling to do more than 12 tasks for a $5 donation. Then you will indicate that you believethat at least 50% of all previous experiment participants were willing to do more tasks thanyou for a $5 donation.
Comprehension QuestionSuppose that you choose to do at most 10 tasks for a donation of $15 dollars and that
you believe that at least 75%, but fewer than 95%, of previous participants were willing to domore than 10 tasks for a $15 donation. How would you answer the question “What percentof previous participants were willing to do more tasks that you?”
• 95%
• 75%
• 50%
• 25%
• 0%
Screen 5B: Seeing other’s choices (Treatment Only)
Lastly, you will learn how your decisions actually compare to the decisions of all thosewho participated in this experiment before you. After everyone has made their decisions andguesses, you will open the yellow envelope on your desk. The contents of this envelope willshow you how many tasks at least 95%, 75%, 50%, 25% and 0% of all previous participantswilling to do. Therefore, you will learn the true proportion of previous participants that werewilling to do more tasks than you. You will then verify that you understand this informationby answering a series of multiple choice questions. Please do not open these envelopes untilyou are instructed to do so.
For example, suppose for a donation of $5 dollars you were willing to do 12 tasks. Andsuppose that the information in the yellow envelope shows you that 50% of previous partic-ipants were willing to do at least 15 tasks for a $5 donation and 75% were willing to do atleast 10 tasks for $5 donation. This would mean that at least 50%, but less than 75%, ofprevious participants were willing to do more tasks than you for a $5 donation.
Comprehension QuestionSuppose that you choose to do at most 35 tasks for a donation of $15 dollars. Also
suppose you learn from the information in the yellow envelope that 50% percent of other
19

participants were willing to at least 30 tasks for a $15 donation and 25% were willing to atleast 40 tasks for $15 donation. Then what percent of previous experiment participants wereactually willing to do more tasks than you?
• 95%
• 75%
• 50%
• 25%
• 0%
Screen 6: Summary
To sum up, the experiment proceeds as follows.
Step 1 You will choose how many tasks you are willing to do for each possible donationamount and you will guess what percent of people were willing to do more tasks than youfor each of your decisions. You will do this with sliders and multiple choice questions asshown below. In Baseline:In this session – as with 50% of all sessions – you will not learnany information on what others actually chose. (In Treatment:In this session – as with 50%of all sessions – you will learn any information on what others actually chose.)
Step 2 Each person will be randomly assigned a donation amount by drawing a ball outof a jar. A random number generator will then assign you a number of tasks. If this numberof tasks is lower than the amount you were willing to do, then you will complete those tasksand we will donate to the A.D.R.P. on your behalf. The experiment will conclude after youfinish your tasks (if any). We will hand you your show-up fee and completion bonus ($15)as you exit the lab.
Instructions: Signal Extraction
Screen 1
Hello and welcome, today you will be participating in an experiment on economic decisionmaking. Funds for this experiment have been provided by the University of California. Youwill be paid for your participation in this experiment. Your final payment will consist ofa fixed $5 show-up payment and a $10 completion bonus. You will be paid privately incash after the experiment has concluded. We ask that you please silence and put awayall cell phones and any other personal electronic devices now and for the remainder of theexperiment.
In this experiment you will be presented with an opportunity to complete a task for char-ity. For this project, we are partnering with Dr. James Rolfe – founder of the Afghan DentalRelief Project – to bring modern dental care to the very poor in Afghanistan. The A.D.R.P.
20
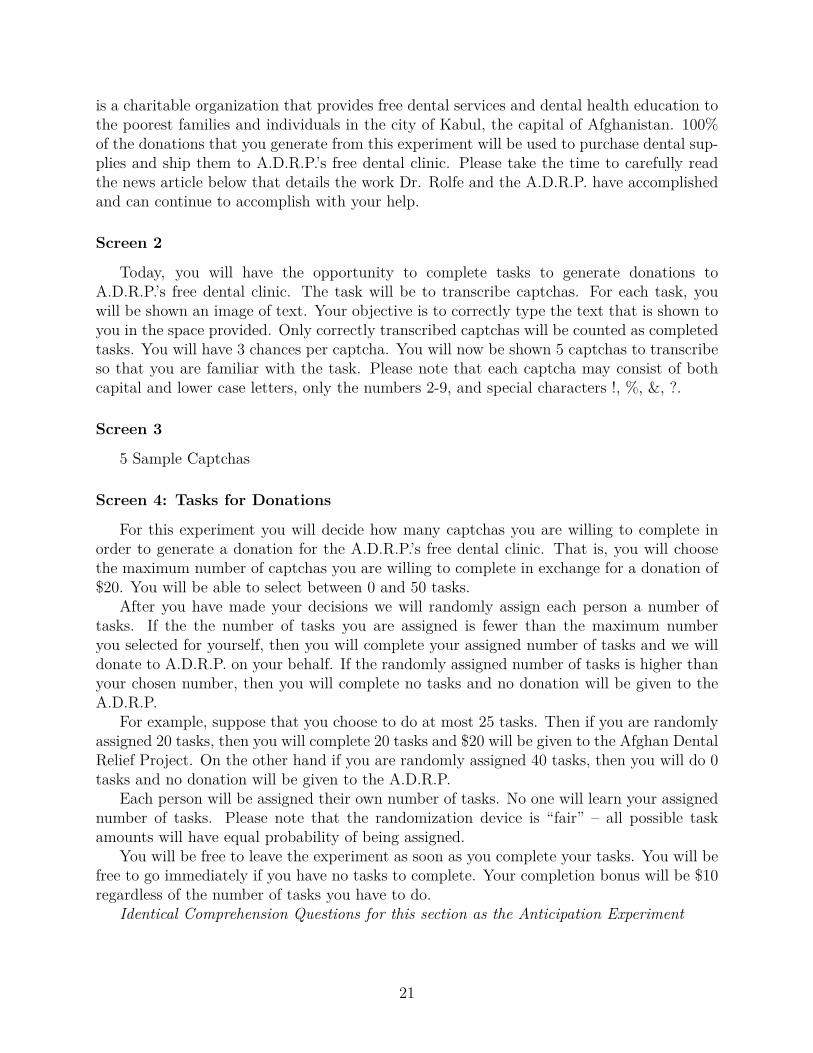
is a charitable organization that provides free dental services and dental health education tothe poorest families and individuals in the city of Kabul, the capital of Afghanistan. 100%of the donations that you generate from this experiment will be used to purchase dental sup-plies and ship them to A.D.R.P.’s free dental clinic. Please take the time to carefully readthe news article below that details the work Dr. Rolfe and the A.D.R.P. have accomplishedand can continue to accomplish with your help.
Screen 2
Today, you will have the opportunity to complete tasks to generate donations toA.D.R.P.’s free dental clinic. The task will be to transcribe captchas. For each task, youwill be shown an image of text. Your objective is to correctly type the text that is shown toyou in the space provided. Only correctly transcribed captchas will be counted as completedtasks. You will have 3 chances per captcha. You will now be shown 5 captchas to transcribeso that you are familiar with the task. Please note that each captcha may consist of bothcapital and lower case letters, only the numbers 2-9, and special characters !, %, &, ?.
Screen 3
5 Sample Captchas
Screen 4: Tasks for Donations
For this experiment you will decide how many captchas you are willing to complete inorder to generate a donation for the A.D.R.P.’s free dental clinic. That is, you will choosethe maximum number of captchas you are willing to complete in exchange for a donation of$20. You will be able to select between 0 and 50 tasks.
After you have made your decisions we will randomly assign each person a number oftasks. If the the number of tasks you are assigned is fewer than the maximum numberyou selected for yourself, then you will complete your assigned number of tasks and we willdonate to A.D.R.P. on your behalf. If the randomly assigned number of tasks is higher thanyour chosen number, then you will complete no tasks and no donation will be given to theA.D.R.P.
For example, suppose that you choose to do at most 25 tasks. Then if you are randomlyassigned 20 tasks, then you will complete 20 tasks and $20 will be given to the Afghan DentalRelief Project. On the other hand if you are randomly assigned 40 tasks, then you will do 0tasks and no donation will be given to the A.D.R.P.
Each person will be assigned their own number of tasks. No one will learn your assignednumber of tasks. Please note that the randomization device is “fair” – all possible taskamounts will have equal probability of being assigned.
You will be free to leave the experiment as soon as you complete your tasks. You will befree to go immediately if you have no tasks to complete. Your completion bonus will be $10regardless of the number of tasks you have to do.
Identical Comprehension Questions for this section as the Anticipation Experiment
21
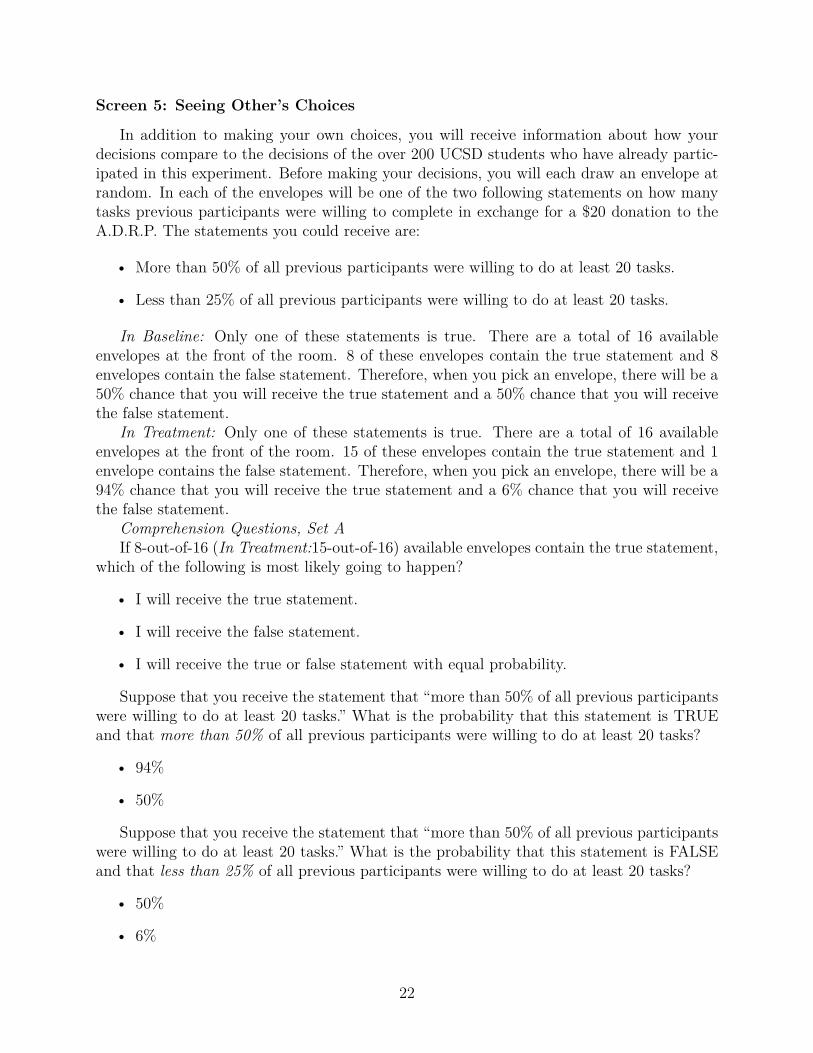
Screen 5: Seeing Other’s Choices
In addition to making your own choices, you will receive information about how yourdecisions compare to the decisions of the over 200 UCSD students who have already partic-ipated in this experiment. Before making your decisions, you will each draw an envelope atrandom. In each of the envelopes will be one of the two following statements on how manytasks previous participants were willing to complete in exchange for a $20 donation to theA.D.R.P. The statements you could receive are:
• More than 50% of all previous participants were willing to do at least 20 tasks.
• Less than 25% of all previous participants were willing to do at least 20 tasks.
In Baseline: Only one of these statements is true. There are a total of 16 availableenvelopes at the front of the room. 8 of these envelopes contain the true statement and 8envelopes contain the false statement. Therefore, when you pick an envelope, there will be a50% chance that you will receive the true statement and a 50% chance that you will receivethe false statement.
In Treatment: Only one of these statements is true. There are a total of 16 availableenvelopes at the front of the room. 15 of these envelopes contain the true statement and 1envelope contains the false statement. Therefore, when you pick an envelope, there will be a94% chance that you will receive the true statement and a 6% chance that you will receivethe false statement.
Comprehension Questions, Set AIf 8-out-of-16 (In Treatment:15-out-of-16) available envelopes contain the true statement,
which of the following is most likely going to happen?
• I will receive the true statement.
• I will receive the false statement.
• I will receive the true or false statement with equal probability.
Suppose that you receive the statement that “more than 50% of all previous participantswere willing to do at least 20 tasks.” What is the probability that this statement is TRUEand that more than 50% of all previous participants were willing to do at least 20 tasks?
• 94%
• 50%
Suppose that you receive the statement that “more than 50% of all previous participantswere willing to do at least 20 tasks.” What is the probability that this statement is FALSEand that less than 25% of all previous participants were willing to do at least 20 tasks?
• 50%
• 6%
22

Comprehension Questions, Set BIf 8-out-of-16 (in treatment:15-out-of-16) available envelopes contain the true statement,
what is the probability you will receive a true statement?
• 94%
• 50%
If 8-out-of-16 (in treatment:15-out-of-16) available envelopes contain the true statement,what is the probability you will receive a false statement?
• 50%
• 6%
If 8-out-of-16 (in treatment:15-out-of-16) available envelopes contain the true statement,what is the maximum number of true statements 12 participants could pick?
• 8
• 12
If 8-out-of-16 (in treatment:15-out-of-16) available envelopes contain the true statement,what is the maximum number of false statements 12 participants could pick?
• 8
• 1
We switched from comprehension question set B to A after the first few sessions ofthe signal extraction experiment. We believed set A would be more revealing of subjectcomprehension. The sessions with question sets A and B are balanced across treatments,and we found no difference in task choice dynamics between comprehension set A and B.
23

A.4 News Article about the A.D.R.P.Afghan Dental Relief Project Ready for Next Level29
By Kelsey Abkin
In 2003, Santa Barbara dentist James Rolfe came across an article about three womengoing to Afghanistan to treat victims of PTSD (post-traumatic stress disorder). Instead ofputting the article down and going on with his day, Dr. Rolfe picked up the phone and askedto go along. The poverty and vulnerability he saw upon arriving in Afghanistan affected himimmediately. Within a country of some 30 million people, Rolfe said he saw “resources inmanpower and [natural] resources but no infrastructure to really use it.” Eleven years later,thanks to Rolfe and his Afghanistan Dental Relief Project, this is changing. The projectstarted the Kabul Dental Clinic and Training Center, which offers basic dental services, andRolfe is on the verge of expanding to a permanent dental clinic, hoping to extend nonbasic,often life-saving dental procedures.
The mission began when Rolfe returned to Afghanistan, this time with a homemade,portable dentist’s office and base camp. Before that, what passed for dental care in the war-torn country often amounted to a barber ripping out sore teeth without anesthetics. With90 percent of Afghans having never seen a real dentist and 70 percent malnourished, dentalproblems were extreme. Abscesses were not uncommon and often led to septicemia, whichcan be lethal without antibiotics. Word that an American dentist had come offering freedental care spread fast among rural communities, and soon Rolfe was helping more than 60people a day. Many of the orphaned boys whom Rolfe treated would become his assistants,thus leading to the Kabul School of Dental Technology.
After a car bomb, two scams, 100,000 patients treated, and 11 years since the birth ofthe Afghanistan Dental Relief Project, Rolfe is on the brink of taking it to a new level.He recently worked with Afghanistan’s Ministry of Public Health to obtain permits to pro-vide more complex, nonbasic dental services to Afghans for a small fee, such as endodontictreatment or prosthetic restorations. For non-Afghans, however, the fee is equivalent towhat they would pay in Dubai, and the treatment of only 16 non-Afghans covers the clinic’sentire monthly operating expenses.
Today, Rolfe can be found in his successful dentistry clinic near the Lobero Theatre. Hisself-built office surrounds his patients with the sounds of nature and artifacts reminiscentof a cultured life. He has managed to live a life — performing dentistry for no cost in aSanta Barbara commune and now helping thousands in Afghanistan — that intertwines hispassion to help with his skills as a dentist. Rolfe, who is 75 years old, continues to work115 hours a week and lives well below the poverty line. Except for his basic needs, he givesall he makes to his Afghanistan project, and he’s nowhere near ready to slow down. In thefuture, he sees a first-rate dental infrastructure providing Afghans with health care, jobs andeducation. “We need to be more active,” Rolfe said. “If we feel something in our heart, weneed to act on that, and that needs to form the basis of our existence.”
29This is an abridged version of an article in the Santa Barbera Independent from 2014.This the the text that was shown to subjects. The full-legnth article can be found here:https://www.independent.com/news/2014/jul/12/afghan-dental-relief-project-ready-next-level/
24