social cohesion, civic culture, and urban development … · 1 social cohesion, civic culture, and...
TRANSCRIPT
1
Social Cohesion, Civic Culture, and Urban
Development in Russia
Rinat Menyashev, Leonid Polishchuk
Center for Institutional Studies at the Higher School of Economics, Moscow
ABSTRACT
Social cohesion and other ingredients of social capital are shown to be conducive for
economic development, institutional performance, and quality of governance. No such analyses
were available for Russia so far, and the present paper fills this gap. We propose a model which
differentiates the impact on economic welfare of open (bridging) and closed (bonding) forms of
social capital. By using 2007 survey data collected in the Geo-Rating project, we establish a
significant positive relationship between open social capital and urban development in Russia.
Closed social capital has a negative impact on development. It is further shown that the
transmission mechanism between social capital and economic outcomes is based on municipal
governance. Closed social capital is deployed to seek isolated protection from bad institutions
and poor public sector governance; as such it reduces the political costs of malfeasance and
facilitates the abuse of power.
Keywords: social cohesion, bridging and bonding social capital, government accountability
1. INTRODUCTION
In the course of the last few decades there have been several major updates of economists’
views of what factors contribute to economic growth and welfare. The conventional growth
theories dominant in 1950s-1970s emphasized the importance of investments in physical and
human capital. From 1980s onwards the emphasis has shifted on institutions, such as markets,
contracts, property rights, rule of law, good governance etc. A large body of evidence was
presented in support of the claim that good institutions are indispensable for economic efficiency
and factor accumulation. The “Institutions Rule” view (Rodrik, Subramanian, Trebbi, 2004) had
straightforward policy implications – key to economic development is in institutional and policy
reform.
Nonetheless in many instances institutional reforms in transition and developing countries
failed to deliver expected outcomes – the allocation of economic roles, power and resources
2
remained unaffected by institutional change (the resilience known as ‘the invariance principle’
(Acemoglu, Robisnon, 2008)). Moreover, on some occasions institutions and policies that were
expected to improve welfare and facilitate growth had the opposite effect, making matters worse
(Putnam, 1993).
Such ‘surprises’ of institutional reform (Roland, 2000; Polterovich, 2007) highlighted a yet
another important development resource – a ‘missing link’ (Guiso, Sapienza, Zingales, 2010)
commonly known as social capital. Numerous definitions of social capital offered in the
literature vary from broad views treating as social capital any shared norms and values (Ostrom)
and social structures (Dasgupta) to much more restrictive interpretation which consider as social
capital only virtuous characteristics of the society that facilitate development and improve
welfare (Fukuyama). The middle ground interpretation that does not render circular the relation
between social capital and development outcome is the view of social capital as the capacity for
self-organization and collective action in pursuit of some common good (Putnam, Woolcock).
The main ingredient of such capacity is cohesion based on trust, social norms, values, and
networks.
Social capital could be instrumental for economic development in two important ways
reflecting two distinct patterns of collective action. First, it cuts transaction costs in the private
sector: trust and social connections facilitate investments and trade (Arrow, 1972), and self-
organization offers private solutions of public problems. Second, social capital is indispensable
in resolving the agency problem between government and society. Government accountability
can only be ensured if there is sufficient civic culture (Almond, Verba, 1963) at the grassroots,
i.e. the appreciation of political rights and freedoms, awareness of public affairs, and the sense of
civic duties and personal responsibility for social well-being. These two mechanisms represent
resp. horizontal and vertical ‘transmission channels’ between social capital and economic
outcomes.
Social capital and formal institutions can be substitutes and/or complements. To the extent
that social capital and institutions substitute for each other, they offer resp. formal and informal
solutions of the same coordination problem, and hence one can expect that returns to social
capital should be particularly high when formal institutions (and government-provided public
goods and services) are in short supply or of poor quality (Durlauf, Fafchamps, 2005; Easterly,
Ritzen, Woolcock, 2006). The flip side of this logic is that institutional reform remedies a lack of
social capital (Knack, Keefer, 1997). On the other hand without sufficient social capital formal
institutions and public policies could be either idled or captured and subverted by narrow
interests (Polishchuk, 2010), in which case institutional and governance reforms do not bring
about desired results. In both cases, whether through substitution or complementarity, social
capital could be highly relevant for economic development and social welfare.
Such relevance has been empirically established in numerous publications at the macro-,
meso-, and micro levels – for nations, regions, cities, local communities, as well as for various
public services and fields of social and economic activities. These studies, while in general
corroborating the view of social capital as a development resource, produce a more nuanced and
complex picture – the impact of particular ingredients, forms and types of social capital is highly
context-specific. Thus, what is known as ‘bonding’ (hereafter - closed) social capital upholds
collective action within narrow confines of smaller groups providing ‘club goods’ for group
members. The impact of such activities for broader social welfare could be detrimental, if
smaller ‘Olson groups’ are engaged in socially wasteful rent-seeking, or if they divert their
3
resources and energy from eliminating root causes of social and economic problems. On the
other hand, ‘bridging’ (hereafter – open) social capital facilitates the creation of broad society-
wide coalitions (‘Putnam groups’) which advance social welfare by producing public goods,
such as efficient public sector governance.
Economic payoff to social capital is measured in the literature by using national or regional
data. In such studies various indicators of economic development, welfare, quality of institutions
and governance are related to panoply of social capital measures. Cross-country studies reveal
tangible relations between economic outcomes and social capital; however, profound differences
between countries, which are only partly captured by control variables, make such estimations
less reliable. More appropriate framework for establishing an association between social capital
and economic performance is provided by regional data within a given country. Such analyses
have been performed for US states, as well as for regions of Germany, the UK, Poland, the
European Union, China, etc. In most of these studies (regional) government efficiency, public
service delivery and other outcomes are shown to be in statistically significant relations to
relevant measures of social capital.
No estimations of this sort have been obtained yet for Russia. While for most other
countries social capital is shown to have significant economic returns, there are conflicting
arguments as to whether such payoff of comparable magnitude could be observed in Russia as
well.
First, there are doubts about the quantity and quality of social capital in Russia. One of the
most commonly used measures of social capital – the index of trust calculated by using data of
the World Values Survey – puts Russia and most other countries of the former Soviet Union
below the median among the nations covered by the survey. Lack of trust and other ingredients
of social capital in Russia is consistent with the conjecture, posited by Robert Putnam (1993) and
later supported by an in-depth econometric analysis for European countries and regions
(Tabellini, 2008), that social capital accumulation is fostered by non-authoritarian political
regimes. Furthermore, economic transition in the former Soviet Union and Central and Eastern
Europe is shown to have significantly eroded social capital (Aghion et al., 2010), and such losses
in Russia were most profound across the post-communist region. Quality-wise, Rose (1998)
maintains that the existing stock of social capital in Russia, low as it may be, is also obsolete and
unsuitable to maintain modern institutions of market democracy. This concern finds support in
the international distribution of the aggregate index of ‘civic capital’ which puts Russia in the
bottom quartile among 70 plus countries (Guiso, Sapienza, Zingales, 2010). Last but not least,
high degree of centralization of economic and political life in contemporary Russia (known as
the ‘vertical power’) leaves little space for grassroots initiative and self-organization.
All of the above makes one to expect that evidences of economic payoff to social capital in
Russia would be hard to find, as social capital in the country is likely insufficient and/or ‘idled’
by the political system and excessive government control. And yet according to the contrarian
view, weakness of official institutions and lack of public goods supplied by the government in
fact raises the returns to social capital which provides informal grassroots fixes of institutional
and governance failures.
An empirical confirmation of the skepticism about economic significance of social capital
in Russia would validate the commonly expressed opinion that the society cannot be a driving
force in the country’s development and modernization. If however those views are refuted,
Russia can be considered ‘a normal country’ (Shleifer, Treisman, 2005) where social capital can

4
improve institutions and governance; in that case a development scenario in which the society
plays an active role becomes possible. Measurement of economic payoff to social capital in
Russia is therefore a matter of not just academic, but also practical significance. It is also
important to find out what kinds of social capital, if any, could affect social and economic
outcomes in Russia.
In this paper we propose a simple economic model that describes outcomes of open and
closed forms of social capital for social welfare and public sector governance. Predictions of the
model lead to hypotheses which are tested by using data from a major survey conducted in
Russia in 2007 as part of the “Geo-Rating” project. Links between social capital and
development are explored at the city level. Factor analysis reveals three forms of social capital –
open, closed, and civic culture, which are latently present in the data. Stocks of social capital
exhibit significant variations from one city or town to the other; it can therefore be concluded
that there are more and less “civic” cities in Russia. The observed variations are found to be
associated with socio-economic conditions in the city (town, village); moreover, open social
capital and civic culture advance local development, whereas closed social capital retards it.
Russia therefore is a ‘normal country’, at least when it comes to the impact of social capital on
economic outcomes: more civic cities are better-off than less civic ones.
It is further demonstrated that the main ‘transmission mechanism’ between social capital
and economic outcomes is the performance of municipal governments, which is significantly
improved by open social capital and civic culture, and adversely affected by closed social capital.
It is noteworthy that such links cannot be established at the regional level; one possible
explanation is the political difference between Russian cities and regions (oblasts, krajs, and
republics) – city mayors are more often than not electable, while regional governors since 2004
are federal appointees.
Causality between social capital and economic outcome is confirmed by using two-stage
least squares regression analysis, where the size of the middle class is shown to be a valid
instrument for open social capital, thus confirming the role of the latter as an (urban)
development factor and resource.
2. SOCIAL CAPITAL IMPACT MEASUREMENT
Earlier social capital studies were mostly qualitative by their nature and did not attempt to
establish an empirically grounded relationship between social capital and development.
Putnam’s famous book (1993) was the first scholarly work where payoff to social capital was
supported by data: it was argued that higher stocks of social capital in the northern part of Italy
allowed northern provinces to make full use of a devolution of power and resources from the
central government to the regions, whereas insufficiency of social capital in the South of Italy
precipitated failure of the same reform.
Since Putnam (1993) measuring payoff to social capital has become a rapidly growing
‘cottage industry’ in social science; the vast literature on the subject is reviewed by Halpern
(2005); Durlauf, Fafchamps (2005); Guiso, Sapienza, Zingales (2010). In the first attempts to
prove (and measure) the economic impact of social capital by means of econometric analysis,
Knack and Keefer (1997) and La Porta et al. (1997) used cross-country data. In these papers rates
of economic growth and measures of social welfare and government performance were

5
dependent variables in regression models, while various social capital indexes served as
independent variables. It was shown that trust had positive statistically significant relations to
economic outcomes (with causality confirmed by appropriately chosen instrumental variables),
whereas no such relation was found for associational activities. This was an indication,
repeatedly confirmed by subsequent studies, that contrary to Putnam’s earlier expectations, social
capital is not a generic “commodity” with all of its components invariably relevant in any
development, organizational etc. context, and that the identification of types of social capital that
are economically valuable under particular circumstances is a non-trivial problem and should be
dealt with on a case-by-case basis.
Putnam’s pioneering work opened a strand of empirical research where social capital’s
impact was measured by using regional data. Knack (2002) established a significant impact of
social capital on state governments’ performance in the US. It was shown that trust in the society,
volunteering, and indexes of civic maturity are good predictors of the quality of state government
services and regulations. Associational membership was not found to be of economic
significance, and an attempt to find such relations by differentiating between ‘Olson-like’ and
‘Putnam-like’ groups was unsuccessful. However, in a different study using US data association
membership was shown to have tangible economic impact at the county level (Rupasingha,
Goetz, Freshwater, 2002).
Similar links have been confirmed for a number of other countries. Thus, in Chinese
regions trust is highly correlated with population income, economic growth, investments and the
number of firms (Zhang, Ke, 2003). Casey (2004) established statistically significant correlation
between trust among individuals and in political institutions, on the one hand, and bureaucratic
efficiency, on the other, for British regions. At the same time some other studies present less
clear-cut pictures. Thus, for German regions the contribution of social capital in its traditional
interpretation is ‘fading’ in the shadow of more significant cultural factors, such as ‘market’ or
‘hierarchical’ values (Blume, Sack, 2008). In Poland social capital, measured by associational
membership, is not found to be making statistically significant contribution to economic growth
and tax collection in various administrative units of the country (Dzialek, 2009).
Measurement of economic payoff to social capital is closely related to the identification of
social capital’s roots and origins – the latter could serve as causality-establishing instruments for
social capital. On a number of occasions religion and social homogeneity were used as such
instruments, but lately more popular choice was political history, based on Putnam’s conjecture
that historic experience of democratic self-rule creates social capital. This view is confirmed by
Guiso, Sapienza, and Zingales (2008), who show that Italian cities and regions that were self-
governed in the past have higher social capital endowments than those that were under colonial
rule, and that such differences are indeed valid instruments for social capital. Tabellini (2008)
reaches the same conclusion by using data for 69 European regions.
Studies of social capital’s outcomes in Russia so far have been more qualitative than
quantitative and not sufficiently comprehensive. Petro (2001) argues that greater success of
economic reforms in Novgorod region was due to higher social capital stock measured by
association membership and civic initiative participation. Marsh (2000) calculates a ‘civic
society index’ for Russian regions, which is shown to be positively correlated with political
engagement of population; however no attempt was made to estimate economic payoff to the so
measured social capital. Kennedy and Kawachi (1998) found a link between the insufficiency
of social capital and steep increase in mortality observed in Russia in the first decade of marker
6
reforms; this is consistent with the robust relationship, observed in other countries, between
social capital and physical and mental health (Halpern, 2005). A more recent study (Eberstadt,
2010) concludes that social capital deficiency could be one of main causes of the present
demographic crisis in Russia, which is a ‘negative’ confirmation of social capital’s significance
for the country’s social and economic outcomes.
The reviewed literature demonstrates that measurement of economic payoff to social
capital and cohesion is a complex but realistic task. Its complexity is in part due to multiplicity of
social capital’s interpretations and meanings (Woolcock, Narayan, 2002, Durlauf, 2002, Guiso,
Sapienza, Zingales, 2010) and well-known difficulties of accurate measurement of trust (see e.g.
Glaeser et al., 2000), values, associational activities etc. Nonetheless more often than not the
impact of cohesion and capacity for self-organization for economic outcomes can be empirically
confirmed, and Russia, as we show below, is no exception to this pattern.
3. THE MODEL
Modeling social capital’s impact on economic outcomes is still in its infancy, and no
sufficiently universal and encompassing approaches have been developed so far. Zak and Knack
(2002) offer a model that captures trust’s beneficial impact for investments; this model therefore
deals with the ‘horizontal’ transmission channel for social capital. Weingast (1997) uses game
theory to demonstrate importance of social capital for sustaining democracy, rule of law, and
limited government. Glaeser et al. (2002) model individual investments in social capital in
conjunction with externalities and network effects. Tabellini (2008) explores bilateral links
between institutions and culture; his analysis demonstrates how trust creates grassroots demand
for good institutions and governance, which in their turn facilitate productive economic activities
and suppress rent-seeking. Polishchuk (2008) uses an economic model to investigate the role of
social capital in the working of corporate social responsibility. Aghion et al. (2010) present a
model where trust and values in the society are related to the scale and scope of government’s
presence in the economy and the quality of government regulations.
The stylized model that follows is concerned with the vertical ‘transmission channel’ of
social capital, whereby the latter’s role is to improve government accountability. The model is
custom-built to capture the impact of different kinds of social capital. It incorporates Weingast’s
(1997) idea that good governance ensues when sufficiently large social coalitions defend their
economic and political rights against possible expropriation by the government when it
‘transgresses’ its constitutional boundaries and otherwise abuses power (see also Kuran, 1991).
Effectiveness of such actions requires open social capital and civic culture. Cohesion-based open
social capital is needed so that coalitions of sufficient size acting in public interest could be
formed and sustained. The role of civic culture is to put government accountability on such
coalitions’ agenda; to this end, good governance should be perceived by coalition members as a
matter of high importance and personal responsibility.
In the model the closed form of social capital is mobilized to mitigate the damage caused
by government’s malfeasance, rather than stopping such malfeasance in the first instance. The
relief is achieved locally and based on cohesion limited to smaller groups, and materializes in the
form of club goods that substitute for insufficient pubic goods supplied by the government, or in
the form of shielding group members from government abuse. Government accountability that
7
precludes transgression cannot be an objective of such groups which are too small, isolated and
dispersed for the task and do not have such matters on their agendas.
One should expect positive economic payoff to open social capital and civic culture
through improved public sector governance. The impact of closed social capital on socio-
economic outcomes is a priory ambiguous: on the one hand it has a positive direct effect by
improving the lot of small groups’ members who obtain relief from government abuse, but on the
other hand it indirectly encourages greater abuse by lowering its economic and hence political
costs.
We follow the tradition in the political economy literature (see e.g. Grossman, Helpman,
2001) to model imperfect government accountability by assuming that the government
maximizes a weighted sum �� + ��� of its own immediate economic welfare �� and the
aggregate welfare �� of the rest of society (private sector); here the multiplier � ∈ [0,1] represents the degree of government accountability. In what follows this multiplier is an
aggregate of open social capital and civic culture, as both of these ingredients are required for
accountable governance.1
Suppose that the government abuses power in order to extract and appropriate income
� ≤ � from the society (private sector); � represents physical, institutional etc. limits to such
expropriation. The private sector comprises a unit continuum of agents, and government’s action
causes each agent a material loss ��(�); however if an agent is a member of an organized group
that seeks collective grassroots protection from government abuse, these losses are reduced to
��(�). The width of this grassroots protection depends on the stock of closed social capital
which is measured by the share � ∈ [0,1] of agents organized in such groups.2 We assume that
� ≤ ��(�) ≤ ��(�), ∀� ≥ 0, (1)
(the first of these inequalities implies that grassroots protection can at best eliminate excess
burden ��(�) − � of government abuse), and that the functions ��(�), ��(�), and ��(�) − ��(�) are all monotonically non-decreasing. If �� is the aggregate welfare of the private sector
before government transgression, then after the transgression private sector welfare is reduced to
�� = �� − ���(�) − (1 − �)��(�), (2)
and assuming �� = �, the expropriated income can be found from the following problem:
1 In a more detailed version of the model open social capital and civic culture are present explicitly and separately
from each other; results of such model’s analysis remain qualitatively the same.
2 One can think of group formation as random events in which case � is the expected share of agents organized in
such groups; alternatively closed social capital could be confined to certain parts of society, in which case � is the
share of such parts.

8
max�
[� − �(���(�) − (1 − �)��(�))]. (3)
Comparative statics analysis of the above problem leads to the following conclusion.
Proposition. The expropriated income � = �(�, �) is (non-strictly) increasing in � and
decreasing in �.
Proof According to the “supermodularity lemma”, the solution of the problem
max �
[�( ) + !"( )]
is monotonically non-decreasing in ! as long as the function "( ) is monotonically increasing.
To establish the required property of � as a function of �, the government’s objective function
should be rearranged as � − ���(�) + ��(��(�) − ��(�)), and of � – as �#
� − (���(�) −(1 − �)��(�)). ∎
The above analysis of the model shows that broad-based social cohesion and civic culture
work through government accountability to restrict possible abuse of power and thus improve the
quality of governance and formal institutions. On the contrary, narrowly-based social cohesion is
detrimental for the quality of governance as it makes the society more resilient and hence
tolerant to abuse of power and thus reduces the political costs of malfeasance.
An immediate corollary of the above proposition is that open social capital and civic
culture also improve private sector welfare �� = �� − ���(�) − (1 − �)��(�), which
monotonically decreases in � and hence increases in �.
The dependence of private sector welfare on the closed social capital measure � is not as
straightforward due to the presences of the direct and indirect effects described earlier in this
section. These effects work in opposite directions, and as a result such dependence could be
“non-linear”. The relative strength of the direct and indirect effects depend inter alia on the level
of government accountability �, which integrates open social capital and civic culture. When
such features of society are absent, the government is completely unaccountable (� = 0), sets its
expropriation at the highest possible level � = �, and the indirect effect thus disappears. In the
meantime the direct effect of private protection from rampant government abuse could be
substantial, and therefore the overall returns to closed social capital in the absence (or near
absence) of open social capital and civic culture should be expected to be (perhaps, mildly)
positive – in this case closed social capital serves as an imperfect substitute for the open one. At
the opposite extreme of full accountability (� = 1) which corresponds to very high stocks of
open social capital and civic culture, the government refrains from expropriation (� = 0), and
therefore there is no need for private protection, and closed social capital is idled. The returns to
closed social capital in this case should be zero.
Various specifications of the above model presented in Appendix I show that for
intermediate levels of the accountability the indirect effect could be stronger than the direct one.
In this case the substitution between various kinds of social capital disappears and the returns to
closed social capital become negative not only for the quality of governance, but for the private

9
sector welfare, too – closed social capital is still helpful “ex post”, for a given level of abuse by
the government, but causes far greater damage “ex ante” by increasing the scale of such abuse.3
The presented analysis summarizes in the following hypotheses.
1. Open social capital and civic culture have positive impact on government performance
and social welfare.
2. Closed social capital adversely affects government performance; its impact on social
welfare could be positive at very low levels of open social capital and civic culture,
becomes (increasingly) negative as open social capital and civic culture grow bigger, and
goes back to zero for very high levels of open social capital ensuring full government
accountability.
We now turn to empirically testing these hypotheses and measuring economic payoff to
various kinds of social capital and cohesion in Russian cities.
4. DATA
Our main source of data was an all-Russia survey conducted in September 2007 by the
Public Opinion Foundation (Fond Obshchestvennoe Mnenie) as part of the ongoing GeoRating
polling program which covers a broad range of economic, social, political and cultural issues.
The survey sample comprised 34,038 adult respondents from 1924 cities, towns and villages
located in 68 Russian regions; in each covered region the sample was representative and included
at least 500 respondents.
The survey questionnaire comprised three clusters of questions: (i) on respondents’ views,
norms and values – answers to such questions are commonly used in social capital measurement;
(ii) on respondents’ satisfaction with economic and social conditions in their places of residence,
and on their assessment of accountability and performance of local governments; and (iii) on
individual characteristics of respondents. The first and second groups of questions were used to
calculate resp. independent (explanatory) and dependent variables, whereas the third group
supplied control variable; the latter also included size and administrative status (national capital,
regional capital etc.) of the city.
The first group of questions resembles (and at times replicates) those used in the World
Values Survey and similar international polls (see Appendix II Table 1)); these questions reveal
respondents’ perception of the cohesion, self-help and propensity for collective action in the
surrounding society. Other questions from the same group characterize respondents’ own norms,
views and practices, such as trust, help to others, willingness to join collective action, and the
sense of responsibility for the situation in respondents’ families, local communities, and cities
(towns, villages).4
3 Such working of closed social capital is somewhat similar to economic consequences of corruption which helps
individuals and businesses to navigate through excessive administrative barriers, but motivates the bureaucracy to
raise such barriers in the first instance (Rose-Ackerman, 1999).
4 We did not use data on philanthropy and associational membership as possible sources of social capital indexes –

10
Respondents’ satisfaction with their lives was used to proxy economic outcomes; no other
reliable data that would serve this purpose were immediately available at the city level.
Government effectiveness and accountability assessed by respondents (answers to the question
“Do you think authorities understand and take into account interests of people like you?”) plays a
dual role in the study – on the one hand accountable governance is of independent value of its
own and thus an important outcome of social capital (Putnam, 1993; Knack, 2002); on the other
hand government performance is a plausible link between social capital and economic outcomes
through a vertical transmission channel.
Individual characteristics of respondents included age, gender and ethnic origin (the latter
were found insignificant in our regression analyses), education, income and self-assessed material
welfare. Control variables also included size and administrative status of the city (settlement) –
predictably, those were strongly correlated with income and welfare of residents (Appendix II
Table 2).
An important decision in choosing our empirical identification strategy was to select an
appropriate territorial entity to establish links between social capital and economic outcomes.
Social capital by definition is a community resource5, and communities are often proxied, for a
lack of better practical options, by some territorial boundaries. In studies of economic payoff to
social capital for other countries the territorial units considered as social capital reservoirs were
usually regions (US states (Knack, 2002), German Länder (Blume, Sack, 2005), provinces etc.
elsewhere in the world (Tabellini, 2008)). In the present study we opted instead for the city (town,
village) level of analysis. This choice was due to profound intra-regional variations of social
values and norms, as revealed by our data (see also Petrov et al., 2010) which override the weaker
sense of regional cultural identity. With such variations, potentially valuable information would
be lost if regional averages were used. Besides, GeoRating data did not include performance
assessment for regional administrations. The downside of studying the economic impact of social
capital at the city level is a dearth of social and economic statistical data that would complement
(and verify) respondents’ subjective assessment of social and economic conditions in their cities –
urban statistical data in Russia are much more scarce than those collected for regions.
Within cities and towns cultural attitudes are more homogeneous, but exhibit significant
inter-city variations across the sample – standard deviations could be as high as 45% of the
sample average. This means that there are, simply put, noticeably more and less civic cities,
towns and localities in Russia. Among large cities (with population 100,000 and more) such
variations are somewhat less pronounced, but still quite perceptible (Appendix II Table 3).
Furthermore, local governments’ performance and residents’ satisfaction with conditions in their
cities fluctuate within broad margins, too. The observed variations present a “natural
experiment” that bodes well for measuring the impact of social capital for social and economic
philanthropy in rudimentary in contemporary Russia, whereas reported association membership is often fictitious or
purely nominal. It is noteworthy that in a number of studies seeking to measure economic payoff to social capital
associational membership did not have a significant impact on economic performance and government efficiency
(see e.g. Knack, Keefer, 1997).
5 Perhaps at the cost of slight abuse of terminology, one could still talk about individual social capital that
characterizes trust and trustworthiness of a person, her internalization of pro-social values, as well as participation in
various social networks (Glaeser, Laibson, Sacerdote, 2002; Halpern, 2005).
11
outcomes at the city level.
Some of the respondents’ values and attitudes are significantly correlated with each other
(Appendix II Table 4) – these correlations could be evidences of more general latent features that
underlie reported norms and behavior. Making such features explicit is important from
substantive and instrumental points of view. Substantively, this could reveal particular types and
patterns of social capital relevant for socio-economic outcomes; instrumentally, it would prevent
multicollinearity in regression analysis.
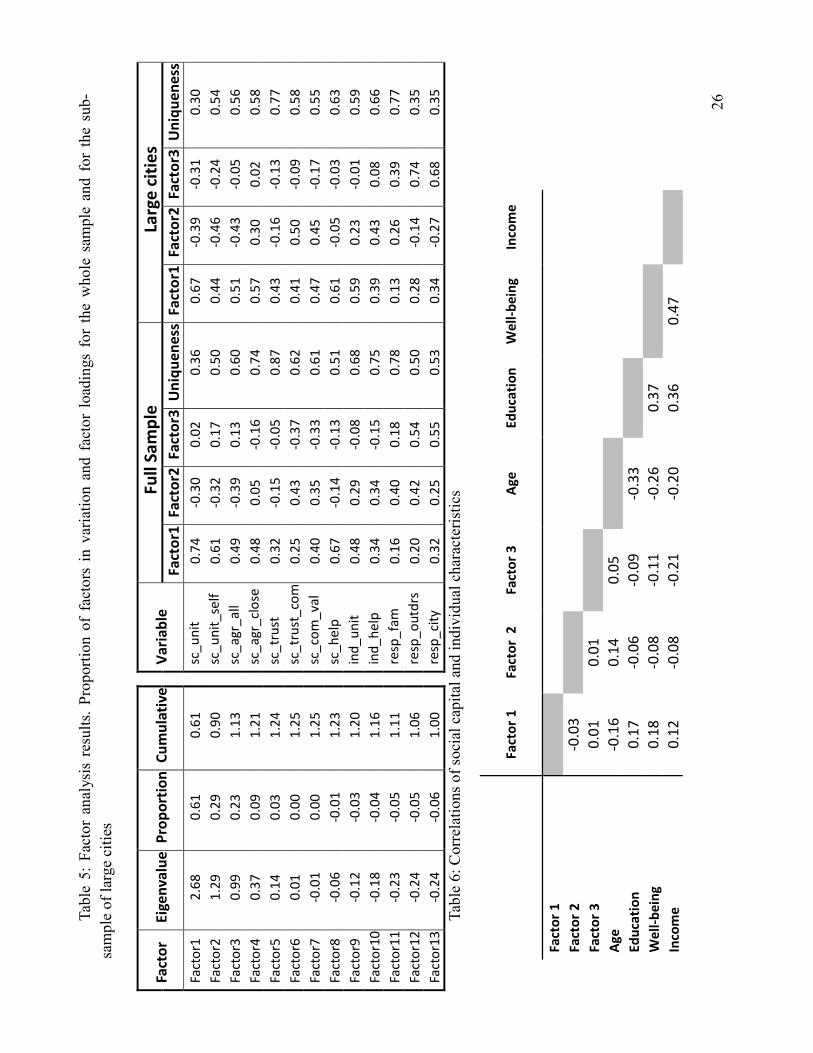
Factor analysis of our data indeed produces three dominant factors (Appendix II Table 5).
The first factor aggregates with high positive weights features of broad social cohesion, accord,
mutual help and propensity for collective action. Trust also enters into this factor, although with
somewhat smaller coefficient. Overall, the first factor characterizes the capacity for collective
action within broad societal coalitions (‘Putnam groups’), and can therefore be interpreted as a
measure of open social capital.
The second factor integrates with highest loads the indexes of restricted and exclusive
social connectedness and limited embeddedness of trust and pro-social norms (trust only in those
who have much in common with a respondent, and preference to dealing with such people).
Indexes measuring broad social cohesion and propensity for collective action enter the second
factor with significant negative coefficients, reflecting cautious and possibly adverse attitude to
‘aliens’. These are the reasons to interpret the second factor as an index of closed social capital,
which by definition facilitates the formation of exclusive ‘Olson groups’ providing club goods
for their members, rather than working for common good at the society at large. Sensing threat to
their well-being or shortage of essential resources and services, ‘Olson groups’ are mobilized to
alleviate such threats or provide necessary resources for their members internally, within the
groups’ confines.
Finally, the third factor is positively linked with the sense of responsibility for what is
happening in the community and in the city. Such perception reflects awareness of citizen’s
rights and duties, and can be interpreted as an index of civic culture.
The proposed interpretation of these three factors is somewhat imprecise and subject to
caveats (common in the social capital literature), but by and large it agrees with the prevailing
understanding and perception of the above concepts. The obtained aggregation is robust:
alternative factor analysis techniques produce similar results.6
The three types of social capital are significantly correlated with individual characteristics
of respondents (Appendix II
Table 6); in particular open social capital is positively correlated with education, income,
and material well-being. Positive contribution of education in accumulation of social capital is a
well-established fact (see e.g. Gaeser et al, 2004), which has also been recently confirmed
empirically for Russia (Natkhov, 2010). Closed social capital, on the contrary, is more prevalent
6 Our procedure is somewhat similar to Bjørnskov’s (2006), where factor analysis also produced three orthogonal
aggregate indexes of social capital reflecting resp. associational activities, social norms and trust. However in
Bjørnskov (op. cit.) the set of original characteristics aggregated by factor analysis was pre-selected “around” the
above triplet, and hence the obtained aggregation was less “endogenous” than in our case where no structure was
assumed a priori and the interpretation of the obtained aggregates is based solely on the loads of primary
characteristics.
12
among less educated and less economically successful groups. It is noteworthy that open social
capital is positively, and closed – negatively associated with respondents’ age; this could be due
to the damage caused to the social capital of older cohorts by the two decades of tumultuous
economic transition (Aghion et al., 2010). Finally, civic culture decreases with income (perhaps
this reflects greater satisfaction with the status quo and higher private costs of civic activism to
wealthier individuals), as well as with the size and status of the city – in large megapolises there
could be stronger sense of alienation from public affairs and feeling of impossibility to influence
public decision-making.
The capital city of Moscow (where the survey sample is representative) is a case in point.
The stock of open social capital in Moscow is close to the national average, whereas closed
social capital is above, and civic culture – well below their average levels. The average level of
open social capital is sustained by education of Moscow residents, lack of civic culture is due to
higher incomes, whereas higher stocks of closed social capital can be explained by abnormal
concentration of wealth and significant social and economic inequality which adversely affects
trust and breeds rivalries and rent-seeking.
In what follows social capital indexes are normalized so that their minimal values are zero,
and standard deviations equal unity.
5. SOCIAL CAPITAL AND DEVELOPMENT: AN EMPIRICAL ANALYSIS
In most of the studies reviewed in Section 2 the payoff to social capital is measured in
terms of quality of governance or various socio-economic outcomes. In our regressions we
follow both of these traditions. In the first case the dependent variable (hereafter Outcome) is
produced by averages of respondents’ assessments of socio-economic conditions in their cities
and other types of settlements. This variable is regressed on the three indexes of social capital –
open, closed, and civic culture (resp. OpenSC, ClosedSC, and CivicCulture), which are also
averaged across the same localities. In the second case the dependent variable is the average of
respondents’ assessment of the performance of their local governments (Performance); however
such variable can also serve as an explanatory one, to assess the contribution of governance to
local development and investigate the role of governance as a transmission mechanism between
social capital and economic outcomes. Control variables are cities’ size, status, regional
dummies, and the averages of various individual characteristics of respondents.
The first regression model estimates the contribution of social capital to local development
and welfare:
%&'()*+, = ()-.' + /� %0+-1�, + /2�3).+41�, + /5 �676(�&3'&8+, +
9,:�)-'8)3: + ;+"6)-�&**<, + =,. (4)
Here i is a settlement index. OLS estimation of this model (Appendix II Table 7, column 1)
provides strong support to the hypothesis that open social capital makes positive contribution to
development: the corresponding coefficient is significant at the 1% level and quite substantial: a
one standard deviation change in the open social capital index is associated with improvement of
social and economic conditions in the city by quarter of a standard deviation. The contribution of
closed social capital is highly significant, too, but negative. Finally, the contribution of civic

13
culture is, similarly to open social capital, positive (and significant at the 0.05 level), but of lesser
magnitude. The obtained estimation is fully consistent with the predictions of the theory
presented in Section 3.
To check robustness, we include in the regression various controls; such modifications
leave estimated coefficients and their significances practically intact (columns 2-4 of Table 7). In
particular, size of the city and material well-being of residents have the expected positive impact
on the dependent variable, but the inclusion of these controls does not affect the magnitude and
significance of social capital contributions. Overall we can conclude that more civic among
Russian cities and towns enjoy ceteris paribus greater prosperity and higher well-being.
In the second regression model the dependent variable is government performance:
>+8�)8*�-(+, = ()-.' + /� %0+-1�, + /2�3).+41�, + /5 �676(�&3'&8+, +
9,:�)-'8)3: + ;+"6)-�&**<, + =,; (5)
Estimations of the above model (Appendix II Table 8) show that social capital’s impact on the
quality of local governance is essentially the same as for social and economic outcomes –
government effectiveness is positively and highly significantly associated with open social
capital and civic culture, and also highly significantly, but negatively – with closed social capital.
Here again the hypotheses generated by the theoretical model find full confirmation in the data.
In the regression model (5) the association of the dependent variable with social capital is even
stronger than in (4): the corresponding coefficients have larger absolute values. These
conclusions are also robust to variations in the composition of control variables (columns 2 and 3
and the table). Moreover, they remain qualitatively unchanged if the full sample is reduced only
to larger cities (100,000 residents and up; columns 4-7), and the impact of social capital on
government performance for such sub-sample becomes even stronger: one standard deviation in
the open social capital corresponds to one standard deviation of the quality of governance index.
Figure 1 in Appendix II illustrates this close association between social capital and the quality of
urban governance. These are evidences that more civic of the Russian cities and towns with
broader social cohesion and stronger civic culture are by and large better governed.
Finally, in the third model social and economic outcomes – the dependent variable – are
regressed on government performance; the set of dependent variables in such model can also
include indexes of social capital (Appendix II Table 9, resp. column 1 and columns 2-4):
%&'()*+ = ()-.' + /� >+8�)8*�-(+, +
/� %0+-1�, + /2�3).+41�, + /5 �676(�&3'&8+, +
9,:�)-'8)3: + ;+"6)-�&**<, + =,.
(6)
The first column of Table 9 shows that the quality of local governance is highly significant
for social and economic outcomes. In combination with OLS estimations of the equation (5)
which demonstrate the significance of social capital for the quality of governance, we can now
conclude that the data point out to the working of a vertical transmission channel between social
capital and development, and local governments are the linchpin of such channel. This channel
carries up to 50% of the contribution of social capital to development: when social capital
indexes are included in the regression alongside the government performance index, the
14
coefficients with such indexes (reflecting the horizontal channel) decrease almost by half in
comparison with the regression model (4). In large cities the vertical channel becomes
predominant and the horizontal one nearly disappears – for such sub-sample social capital
coefficients in the model (6) become insignificant.
The above empirical models also shed light on the interplay between different types of
social capital in affecting local development and governance. In particular the theory presented
in Section 3 suggests that the adverse impact of the closed social capital grows stronger as the
stock of the open social capital increases in a low-to-medium range. We test this conjecture by
dividing the sample in three parts with lower, interim, and higher stocks of the open social
capital, and estimating the regression model (4) separately for each part. The results are reported
in Appendix II Table 10 which shows that the coefficient of the closed social capital is
insignificant (and small) for the lower portion, and then becomes negative, significant at the 1%
level and growing in magnitude as the open social capital increases from the middle to the top
third of the sample. These estimations concur with the theoretical model (and its specifications in
the Appendix 1): the first portion of the sample corresponds to the low range of open social
capital where the returns to closed social capital turns from initially positive to negative; such
returns remain negative and increasing in magnitude thereafter (apparently the stock of open
social capital in our sample does not reach the level when closed social capital starts losing its
significance.) We can therefore conclude that closed social capital becomes increasingly a drag
on local development when civic awareness and capacity for collective action grow stronger.
6. VALIDATION AND CAUSALITY
Validity of the above findings and conclusions could be questioned due to possible omitted
variable bias, measurement errors in data collection, and reverse causality. Control variables
included in the regression models, and various robustness checks deal with the omitted variable
bias. Concerns about the quality of measurement could be raised inter alia due to the fact that
almost all of our data come from a single survey and are thus susceptible to sampling and polling
errors. To address such concerns, we have performed external validation by using similar data
from other sources.
The proxy for social and economic outcomes – respondents’ satisfaction with situations in
their cities – was validated by data from other Geo-Rating surveys conducted before (2005) and
after (2008, 2009) the 2007 poll. In those surveys respondents were asked about satisfaction with
social and economic conditions in their regions, rather than cities, and therefore such surveys’
data are only partially compatible with the 2007 poll, but still allow for meaningful cross-
checking (Appendix II Table 11).
Replacing outcome measures by those similarly derived from other years’ surveys do not
qualitatively change the conclusions about the role of open and closed social capital and civic
culture in urban and municipal development.
Our search for external validation of the quality of governance and accountability measures
is still work in progress. Electoral statistics to which one would normally turn for measures of
political competition and other proxies for government accountability has not been very useful so
far, possibly due to massive irregularities in Russian local elections.
We have similarly performed validation of social capital indexes by using measures of
15
social accord and cohesion derived from a recent 2009 GeoRating survey; the obtained results
were close to those reported in the previous section. We were unable to rely on blood donation
and referenda participation data which are often used in social capital measurement due to
concerns about their accuracy and adequacy of such measures in Russia (e.g. much of blood
donation in the country is motivated by material rewards).
Finally, we turn to the endogeneity problem in the association between social capital and
economic outcomes. One can argue that social capital is not only a factor, but also a product, of
development; one possible explanation of such reverse causality is that development expands and
improves education which is known to be a powerful driver of social capital accumulation.
Similarly good governance could instill greater trust in institutions and broader cooperation that
would also be conducive for social capital buildup.
To be able to argue that social capital affects development, we need valid instruments for
the social capital indexes. Features that were used as instruments for social capital elsewhere in
the literature (see Section 2) in our case either failed the validity test, or no satisfactory data
and/or measures for such potential instruments were found. We had more luck with using the size
of the middle class as a potential instrument.
Middle class is known to be conducive for the cultivation of civic values and cohesion (see
e.g. Moore, 1966; Hooghe, Stolle, 2003; Easterly, Ritzen, Woolcock, 2006), and as such could
indeed serve as a potentially valid instrument for social capital. Among multiple sources of
information on middle class which reflect various measures and interpretations of this broad
concept, we have selected, based on availability and reliability of data, a survey conducted in
1980 by the Institute of Sociological Studies of the Soviet Academy of Science (Levyikin et. al.,
1980) that was comparable in its scale, scope and methodology to the 2007 Geo-Rating survey.
The survey did not specify cities, but available information on regions and city types enabled us
to collect a sub-sample including 52 cities and towns. While such sample falls short of what is
ideally required for instrumental variable analysis, it still produces a satisfactory instrument for
the 2007 index of cohesion and accord. The middle class proxy that was used to obtain the
instrument was respondents’ description of their social status (sluzhashchie – professionals,
white collars, etc., as opposed to workers and peasants). Two-stage least squares estimation
shows that our proxy for the middle class in 1980 is indeed a valid instrument for social capital
in today’s Russia (see also Appendix II Figure 2). The availability of such instrument lends some
support to the causality that runs from social capital to development.
7. CONCLUSION
We have shown that social capital does have substantial economic payoff in Russia, despite
serious reasons to expect otherwise. It means that Russia, being a ‘normal country’, can rely on
its social capital as a development resource.
This conclusion however is subject to an important qualification: while some kinds of
Russian social capital advance development, others obstruct it. Rose (1998, p. 18) pointed out to
a path dependency in Russian social capital and cohesion which ‘encouraged people to create
informal networks as protection against the state’. Such closed forms of social capital are
considered ‘anti-modern’, as opposed to modern ones, which ensure accountable governance and
uphold economic, legal and political institutions (Polishchuk 2010). Our analysis demonstrates
16
that in today’s Russia modern and anti-modern types of social capital co-exist in proportions that
vary from one city and region to the other and likely evolve over time. It means that the agenda
of Russian modernization, apart from its technological and institutional aspects, has an important
social dimension, and that the evolution of the social capital mix could have far-reaching
implications for the nation’s economic and political development.
A sanguine development view holds that economic growth and accumulation of human
capital foster civic culture and pro-social values (Glaeser, Ponzetto, Shleifer, 2007), which in
their turn improve institutions and governance in the economy and society (Glaeser et al., 2004).
On the other hand closed social capital could disrupt this dynamic virtuous circle by perpetuating
ineffective and unaccountable governance and debasing modern institutions. Corruption,
lawlessness and government predation erode trust in institutions and among individuals, and
suppress investments in open social capital and cultural transmission of pro-social norms and
civic virtues (Tabellini, 2008), while entrenching anti-modern social practices of adjustment to
bad institutions.7
The outcome of such “race” between different kinds of social capital is uncertain, and
multiple equilibria are possible. Further research, theoretical and empirical, is required to get a
better insight into the processes of accumulation and amortization of different kinds of social
capital. Such insight would be invaluable in designing policies that would tip the race between
modern and anti-modern social capital and cohesion towards a path where civil society,
economic development, and good governance support and reinforce each other.
7 “If you expect to live in a corrupt society, you would rather learn to pay and demand bribes” (Aghion et al., 2010,,
p. 1027)

17
REFERENCES
Acemoglu, D, and J. Robinson. (2008) Persistence of Power, Elites, and Institutions.
American Economic Review, 98, 267-293.
Aghion, P., Y. Algan, P. Cahuc, and A. Shleifer. (2010) Regulation and Distrust. Quarterly
Journal of Economics, 125, 1015-1049
Almond, G., and S. Verba (1963). The Civic Culture. Political Attitudes and Democracy in
Five Nations. Princeton: Princeton Univ. Press.
Arrow, K. (1972). Gifts and exchanges, Philosophy and Public Affairs, 1, 343-362.
Bjørnskov, Ch. (2006) The multiple facets of social capital. European Journal of Political
Economy, 22, 22– 40
Blume L., and Sack D. (2008). Patterns of Social Capital in West German Regions.
European Urban and Regional Studies, 15, 229-248.
Casey T. (2004) Social capital and regional economies in Britain. Political Studies, 52, 96-
117.
Durlauf S. (2002) On The Empirics Of Social Capital Economic Journal, 112, F459–F479.
Durlauf, S., and M. Fafchamp. Social Capital. (2005). In: Ph. Aghion, S. Durlauf
(ed.), Handbook of Economic Growth, Vol.1, 1639-1699, Amsterdam: Elsevier.
Dzialek, J. (2009) Social Capital and Economic Growth in Polish Regions. MPRA Working
paper 18287.
Easterly, W., J. Ritzen, and M. Woolcock (2006). Social Cohesion, Institutions, and Growth.
Economics and Politics, 18, 103-120.
Eberstadt, N. (2010). Russia's Peacetime Demographic Crisis: Dimensions, Causes,
Implications. NBR Project Report.
Glaeser, E., D. Laibson, J. Scheinkman, and Ch. Soutter. (2000) Measuring Trust. Quarterly
Journal of Economics, 115, 811-846.
Glaeser, E., D. Laibson and B. Sacerdote. (2002) An Economic Approach to Social Capital.
Economic Journal, 112, F437–F458.
Glaeser, E., R. La Porta, F. De Silanes, and A. Shleifer. (2004). Do Institutions Cause
Growth? Journal of Economic Growth, 9, 271-303.
Glaeser, E., Ponzetto, G., and Shleifer, A. (2007) Why Does Democracy Need Education?
Journal of Economic Growth, 12, 77-99.
Grossman, G., and E. Helpman (2001). Special Interests Politics, Cambridge MA and
London UK: The MIT Press.
Guiso, L., P. Sapienza, and L. Zingales. (2010) Civic Capital as the Missing Link.
NBER Working Paper No. w15845.
Halpern, D. (2005). Social Capital. Cambridge: Polity.
18
Hooghe, M., and D. Stolle (eds.) (2003) Generating Social Capital. Civil Society and
Institutions in Comparative Perspective. New York: Palgrave Macmillan.
Knack, S. Social Capital and the Quality of Government: Evidence From the U.S. States.
(2002) American Journal of Political Science 46, 772–785.
Knack, S., and Ph. Keefer. (1997) Does Social Capital Have an Economic Payoff? A Cross-
Country Investigation. Quarterly Journal of Economics, 1251-1288.
Kennedy, B., and Kawachi, I. (1998) The Role of Social Capital in the Russian Mortality
Crisis. World Development, 26), 2029-2043.
Kuran, T. (1991) The East European Revolution of 1989: Is it surprising that we were
surprised?” American Economic Review, 81, 121-125.
La Porta, R., F. Lopez-de-Silanes, A. Shleifer, and R. Vishny. (1997) Trust in Large
Organizations. American Economic Review, 87, 333-338.
Levykin I., T Dridze, E Orlov, Y. Reyzema. (1981) State and Main Trends of the Soviet Way
of Life. (In Russian) Materials of a Public Opinion Poll.
Marsh, Ch. (2000) Social Capital and Democracy in Russia. Communist and Post-Communist
Studies, 33, 183-199.
Moore, B. (1966) Social Origins of Dictatorship and Democracy, Boston; Beacon Press.
Natkhov, T. (2010). Education and Social Cohesion in Russia. An Empirical Evidence.
Mimeo.
Petrov N., and A Titkov A. (2010) Irregular Triangle: State-Business-Society Relations in
Russia’s Regions (in Russian) Moscow: Rosspen.
Polishchuk, L. (2010) Misuse of Institutions. Lessons from Transition. UNU-WIDER
Working Paper No 2010/75.
Polterovich, V (2007). Elements of Reform Theory (in Russian). Moscow: Economics
Publishers.
Putnam, R. (1993) Making Democracy Work: Civic Tradition in Modern Italy. Princeton:
Princeton Univ. Press.
Rodrik, D, Subramanian, A., Trebbi, F. (2004) Institutions Rule: The Primacy of Institutions
Over Geography and Integration in Economic Development, Journal of Economic Growth, 9,
131-165.
Roland, G. (2000) Transition and Economics. Politics, Markets, and Firms. MIT Press.
Rose, R. (1998) Getting Things Done in an Anti-Modern Society: Social Capital Networks in
Russia. Social Capital Initiative Working Paper No. 6. World Bank.
Rose-Ackerman, S. (1999) Corruption and Government: Causes, consequences,and reform.
Cambridge: Cambridge University Press.
Rupasingha A, Goetz S. and Freshwater D. (2002) Social and Institutional Factors as
Determinants of Economic Growth: Evidence from the United States Counties Papers in
Regional Science 81, 139-155.

19
Shleifer, A., and D. Treisman. A Normal Country: Russia After Communism. (2005). Journal
of Economic Perspectives, 19, 151-174.
Tabellini, G. (2008) Institutions and Culture. Journal of the European Economic Association
6, 255–294.
Weingast, B. (1997). The Political Foundations of Democracy and the Rule of Law.
American Political Science Review, 91, 245 – 263.
Woolcock, M. (1998) Social Capital and Economic Development: Toward a Theoretical
Synthesis and Policy Framework. Theory and Society, 27, 151–208.
Woolcock, M., and D. Narayan. (2000). Social Capital: Implications for Development
Theory, Research, and Policy. World Bank Research Observer, 15, 225-249.
Zak, P. and S. Knack. (2001). Trust and Growth. Economic Journal, 111, 295-321.
Zhang Zh., and Ke R. (2003) Trust in China: A Cross-Regional Analysis, William Davidson
Institute Working Paper No. 586.

20
APPENDIX I
We present two specifications of the general model described in Section 3. In both versions
government resorts to distortionary tools of income extraction that impose excess burden on the
private sector. Closed social capital allows members of small groups to eliminate the excess
burden by means of self-organization and reduce losses from ��(�) down to ��(�) = �.
Specification 1: Extortionary taxation
Suppose that the government extracts income from the private sector through an
extortionary tax with flat rate ' ∈ [0,1]. Assuming agents’ quasilinear utilities − 7(3), where
is income and 3 – labor, labor supply 3 = 3(') can be found from the equation 7@(3) = 1 − '
(market wage is normalized to unity), and government revenue is � = ;(') ≡ '3('). Residual
welfare of a taxpayer after taxes is B(') ≡ (1 − ')3(') − 7(3(')), and when there is no
grassroots protection from taxation, the cost of government predation to agents is as follows:
�(�) = B(0) − B(') = ;(') + C('), where C(') is the deadweight loss of a distortionary tax.
Closed social capital enables agents within small groups to accumulate the required tax
payment per member trough direct contributions without sustaining the deadweight losses; 8
the
saved deadweight losses comprise economic returns (which accrue to group members) to closed
social capital. In this case ��(�) = �, and the tax rate ' = '(�, �) selected by the government
from problem (3) satisfies the following first-order condition:
1 − �
�;@(') = (1 − �)C@(').
The social welfare as a function of � and � is as follows:
��(�, �) = �� − ;('(�, �)) − (1 − �)C('(�, �)).
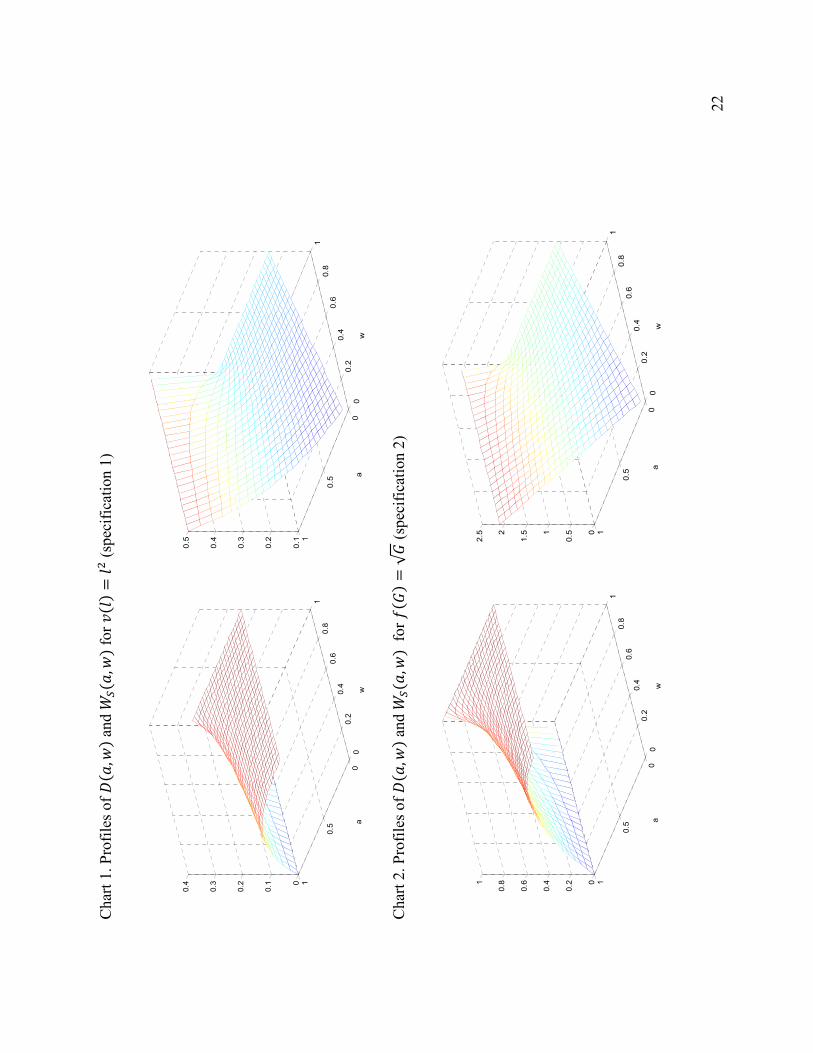
This function is increasing in �, and one can easily check that under the “neoclassical”
assumptions about 7(∙), decreases in � for large enough �. This is illustrated by the profiles of
��(�, �) and �(�, �)for 7(3) = 32 (Chart 1 below).
Specification 2: Diversion of public funds
Assume agents’ preferences of the form + �(E), where is private consumption, and E
– local public good, with a “neoclassical” function �. Local public goods are supposed to be
provided by the government for F identical communities of equal size 1 FG (consumers are still
assumed to form a unit continuum). Optimal provision E = E∗ of the local public good for each
community can be found from the equation
8 Such outcome obtains e.g. as political equilibrium when agents’ groups are lobbies making contributions to
government in order to prevent taxation of group members (Grossman, Helpman, 2001).
21
�@(E∗) = F.
Suppose that the government collects the required revenues FE∗, but can divert portion �
of this amount for its own enrichment, leaving the public goods undersupplied. In this case
(assuming equal (under)funding of each of the local public goods) the cost to the agents of such
diversion is ��(�) = �(E∗) − �(E∗ − � FG ).
Closed social capital could help agents within a given community to resolve the collective
action problem and make up for the shortfall of funding of the local public good by jointly
supplying the missing amount � FG ; in such case each member of the community will have to
make a private contribution �, and the private cost of government malfeasance is reduced from
��(�) to ��(�) = �. The stock of closed social capital is measured by the share � of the
communities where such local effort occurs; in this case problem (3) takes the following form:
max�
I� − �J�� + (1 − �)K �(E∗) − �(E∗ − � FG )LMN,
and the optimal diversion of funds � = �(�, �) satisfies the equation
�@(E∗ − �) = F1 − ��
�(1 − �).
Here too �(�, �) monotonically decreases in � and increases in �, and the social welfare
is as follows:
��(�, �) = �� − ��(�, �) + (1 − �)K �(E∗) − �(E∗ − �(�, �) FG )L.
As it was the case with the previous specification, with the “neoclassical” assumptions this
function can also be shown to decrease in � at least when � is sufficiently large. We illustrate
this by the profile of ��(�, �) and �(�, �) for �(E) = OE (Chart 2).
22
Char
t 1. P
rofi
les
of
�( �
,�)
and �
�(�
,�)
for
7(3)
=32
(sp
ecif
icat
ion 1
)
Char
t 2. P
rofi
les
of
�( �
,�)
and �
�(�
,�)
for
�(E
)=
OE
(sp
ecif
icat
ion 2
)
00.2
0.4
0.6
0.8
1
0
0.5
10
0.1
0.2
0.3
0.4
wa
00.2
0.4
0.6
0.8
1
0
0.5
10.1
0.2
0.3
0.4
0.5
wa
00.2
0.4
0.6
0.8
1
0
0.5
10
0.2
0.4
0.6
0.81
wa
00.2
0.4
0.6
0.8
1
0
0.5
10
0.51
1.52
2.5
wa

23
APPENDIX II
Table 1: Social norms, attitudes, and outcomes.
Variable Question Min Max
sc_unit How often people around you are prepared for collective action to jointly solve
their problems? 0 4
sc_unit_self How often people around you are prepared for collective action to jointly solve
social problems, even if the latter have no immediate bearings for them? 0 4
sc_agr_all In your opinion, what is more common in our country today – social accord and
cohesion, or discord and alienation? 0 3
sc_agr_close In your opinion, what is more common among people around you – social accord
and cohesion, or discord and alienation? 0 3
sc_trust Do you think that people can be trusted, or you cannot be more careful in
dealing with people? 0 1
sc_com_val Do you meet people that have much in common with you? 0 3
sc_trust_com Do you trust those who have much in common with you more, less, or the same
as all others? 0 3
sc_help How often people around you are ready to help each other? 0 3
ind_unit
Some people are ready to join others for joint action only if they have the same
interests and share the same ideas. Others are ready for joint action even if
partners’ interests and ideas are different. To which of these two groups you are
closer?
0 3
ind_help Have you over the last year offered assistance and support to those who are not
your immediate family members? 0 3
resp_fam How strongly you feel responsibility for the situation in your family? 0 3
resp_outdrs How strongly you feel responsibility for the situation in your apartment building
or local residential area? 0 3
resp_city How strongly you feel responsibility for the situation in your city (town,
village)? 0 3
soc_pow Do you think authorities understand and take into account interests of people
like you ? 0 3
soc_outc Overall, are you satisfied or dissatisfied by the situation in your city (town,
village)? 0 3
Answers are usually given in 0 to 3 or 0 to 4 scales; greater value corresponds to higher frequency, stronger
agreement etc.

24
Table 2: Distribution of Individual characteristics of respondents
Size and status of settlement Sample Average
age
Average
years of
education
Average
welfare Average
income
Moscow 1 45 11.68 3.21 9.91
St. Petersburg 1 44.54 11.2 3.22 10.55
Regional capital with more than
1,000,000 residents 11 43.8 10.72 3 5.86
Regional capital with less than
1,000,000 residents 56 44.2 10.82 2.93 5.54
Towns, small urban settlements 909 44.46 10.24 2.74 4.75
Villages 844 46.9 9.44 2.49 3.59
Total 1822 45.58 9.89 2.63 4.25
Respondents were asked to estimate their material welfare in a one (“not enough money even for
food”) to six (“experience no financial difficulties, could buy a house or apartment if need be”) scale.
Income was reported in thousands of rubles.
Table 3: Variations of city averages across the sample and among larger cities
Variable
Full Sample (1822
observations) Large cities (149 observations)
Mean Std.
Dev. Min Max Mean Std. Dev. Min Max
sc_unit 1.67 0.53 0.00 3.40 1.74 0.36 0.41 2.80
sc_unit_self 1.23 0.56 0.00 3.30 1.23 0.43 0.08 2.41
sc_agr_all 0.84 0.38 0.00 2.80 0.82 0.29 0.17 1.60
sc_agr_close 1.64 0.45 0.10 3.00 1.76 0.31 1.00 2.82
sc_trust 0.19 0.16 0.00 1.00 0.18 0.10 0.00 0.50
sc_com_val 2.02 0.34 0.68 3.00 2.03 0.24 1.10 2.63
sc_trust_com 1.92 0.42 0.17 3.00 1.96 0.31 1.20 2.80
sc_help 1.86 0.46 0.30 3.30 1.94 0.31 0.56 2.88
ind_unit 1.84 0.51 0.00 3.00 1.82 0.39 0.44 2.76
ind_help 1.76 0.50 0.00 3.00 1.78 0.37 0.70 2.61
resp_fam 2.71 0.26 1.29 3.00 2.68 0.16 2.00 3.00
resp_outdrs 1.78 0.59 0.00 3.00 1.36 0.37 0.12 2.61
resp_city 1.08 0.52 0.00 3.00 0.91 0.35 0.08 2.35
soc_pow 0.89 0.38 0.00 2.38 0.89 0.30 0.20 1.84
soc_outc 1.11 0.47 0.00 2.63 1.31 0.38 0.20 2.25

25
Tab
le 4
: P
airw
ise
corr
elat
ions
of
soci
al n
orm
s an
d a
ttit
udes
sc_
un
it
sc_u
nit_
self
sc_
ag
r_a
ll
sc_a
gr_c
lose
sc
_tr
ust
sc
_com
_val
sc
_tru
st_c
om
sc_
he
lp
ind
_u
nit
in
d_
he
lp
resp
_fa
m
resp
_out
drs
sc_
un
it
sc_
un
it_
self
0
.68
sc_
ag
r_a
ll
0.4
0
0.4
1
sc_
ag
r_cl
ose
0
.28
0
.16
0
.34
sc_
tru
st
0.1
9
0.1
8
0.3
5
0.1
8
sc_
com
_v
al
0.1
9
0.0
9
-0.0
1
0.2
6
0.1
6
sc
_tr
ust
_co
m
0.0
4
-0.0
5
-0.1
3
0.2
4
0.0
6
0.4
6
sc_
he
lp
0.6
1
0.4
0
0.3
7
0.3
6
0.2
3
0.2
3
0.1
5
in
d_
un
it
0.2
9
0.2
2
0.1
1
0.2
7
0.1
1
0.3
5
0.2
8
0.2
2
ind
_h
elp
0
.14
0
.09
-0
.02
0
.16
-0
.01
0
.30
0
.24
0
.28
0
.31
resp
_fa
m
0.0
3
-0.0
1
-0.0
7
0.0
7
-0.0
5
0.1
1
0.1
5
0.0
5
0.1
6
0.2
2
resp
_o
utd
rs
0.0
1
0.0
7
0.0
1
0.0
5
-0.0
3
0.0
4
0.0
4
0.0
0
0.1
6
0.1
1
0.3
4
resp
_ci
ty
0.1
6
0.2
0
0.1
6
0.0
8
0.0
8
0.0
5
-0.0
2
0.1
0
0.2
0
0.0
9
0.2
3
0.5
7
26
Tab
le 5
: F
acto
r an
alysi
s re
sult
s. P
roport
ion o
f fa
ctors
in v
aria
tion a
nd
fac
tor
load
ings
for
the
whole
sam
ple
and
for
the
sub-
sam
ple
of
larg
e ci
ties
Tab
le 6
: C
orr
elat
ions
of
soci
al c
apit
al a
nd i
ndiv
idu
al c
har
acte
rist
ics
F
act
or
1
Fa
cto
r 2
F
act
or
3
Ag
e
Ed
uca
tio
n
We
ll-b
ein
g
Inco
me
Fa
cto
r 1
Fa
cto
r 2
-0
.03
F
act
or
3
0.0
1
0.0
1
A
ge
-0
.16
0
.14
0
.05
E
du
cati
on
0
.17
-0
.06
-0
.09
-0
.33
We
ll-b
ein
g
0.1
8
-0.0
8
-0.1
1
-0.2
6
0.3
7
Inco
me
0
.12
-0
.08
-0
.21
-0
.20
0
.36
0
.47
Fact
or
Eig
en
va
lue
P
rop
ort
ion
C
um
ula
tiv
e
V
ari
ab
le
Fu
ll S
am
ple
La
rge
cit
ies
F
act
or1
F
act
or2
F
act
or3
U
niq
ue
ne
ss
Fa
cto
r1
Fa
cto
r2
Fa
cto
r3
Un
iqu
en
ess
Fact
or1
2
.68
0
.61
0
.61
sc_
un
it
0.7
4
-0.3
0
0.0
2
0.3
6
0.6
7
-0.3
9
-0.3
1
0.3
0
Fact
or2
1
.29
0
.29
0
.90
sc_
un
it_
self
0
.61
-0
.32
0
.17
0
.50
0
.44
-0
.46
-0
.24
0
.54
Fact
or3
0
.99
0
.23
1
.13
sc_
ag
r_a
ll
0.4
9
-0.3
9
0.1
3
0.6
0
0.5
1
-0.4
3
-0.0
5
0.5
6
Fact
or4
0
.37
0
.09
1
.21
sc_
ag
r_cl
ose
0
.48
0
.05
-0
.16
0
.74
0
.57
0
.30
0
.02
0
.58
Fact
or5
0
.14
0
.03
1
.24
sc_
tru
st
0.3
2
-0.1
5
-0.0
5
0.8
7
0.4
3
-0.1
6
-0.1
3
0.7
7
Fact
or6
0
.01
0
.00
1
.25
sc_
tru
st_
com
0
.25
0
.43
-0
.37
0
.62
0
.41
0
.50
-0
.09
0
.58
Fact
or7
-0
.01
0
.00
1
.25
sc_
com
_v
al
0.4
0
0.3
5
-0.3
3
0.6
1
0.4
7
0.4
5
-0.1
7
0.5
5
Fact
or8
-0
.06
-0
.01
1
.23
sc_
he
lp
0.6
7
-0.1
4
-0.1
3
0.5
1
0.6
1
-0.0
5
-0.0
3
0.6
3
Fact
or9
-0
.12
-0
.03
1
.20
ind
_u
nit
0
.48
0
.29
-0
.08
0
.68
0
.59
0
.23
-0
.01
0
.59
Fact
or1
0
-0.1
8
-0.0
4
1.1
6
in
d_
he
lp
0.3
4
0.3
4
-0.1
5
0.7
5
0.3
9
0.4
3
0.0
8
0.6
6
Fact
or1
1
-0.2
3
-0.0
5
1.1
1
re
sp_
fam
0
.16
0
.40
0
.18
0
.78
0
.13
0
.26
0
.39
0
.77
Fact
or1
2
-0.2
4
-0.0
5
1.0
6
re
sp_
ou
tdrs
0
.20
0
.42
0
.54
0
.50
0
.28
-0
.14
0
.74
0
.35
Fact
or1
3
-0.2
4
-0.0
6
1.0
0
re
sp_
city
0
.32
0
.25
0
.55
0
.53
0
.34
-0
.27
0
.68
0
.35

27
Table 7: Regression of social and economic outcomes on social capital
VARIABLES (1) (2) (3) (4)
Open SC 0.122*** 0.114*** 0.122*** 0.114***
(0.010) (0.012) (0.010) (0.014) Closed SC -0.091*** -0.088*** -0.091*** -0.088***
(0.003) (0.002) (0.003) (0.015) Civic culture 0.019** 0.025** 0.021*** 0.025*
(0.006) (0.009) (0.005) (0.014) Population 0.0013*** 0.0010**
(0.0002) (0.0003)
Age
-0.003
-0.003
(0.005)
(0.003)
Education
0.002
0.003
(0.009)
(0.012)
Wellbeing
0.115***
0.116***
(0.016)
(0.029)
City size dummy NO NO YES YES
Regional effects YES YES YES YES Observations 1822 1822 1822 1822
R-squared 0.267 0.282 0.266 0.280
Robust standard errors clustered at settlement type are in parenthesis. ***:1%, **: 5%, *: 10
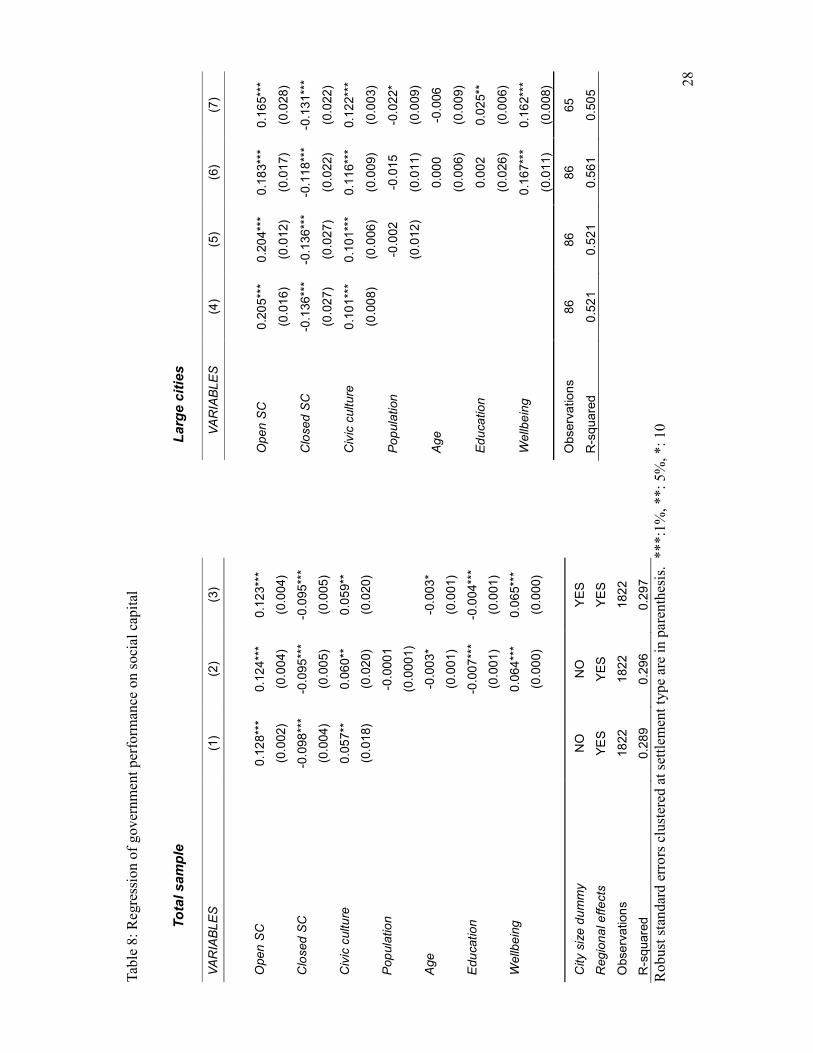
28
Tab
le 8
: R
egre
ssio
n o
f gover
nm
ent
per
form
ance
on s
oci
al c
apit
al
Total sample
Large cities
VARIABLES
(1)
(2)
(3)
Open SC
0.128***
0.124***
0.123***
(0.002)
(0.004)
(0.004)
Closed SC
-0.098***
-0.095***
-0.095***
(0.004)
(0.005)
(0.005)
Civic culture
0.057**
0.060**
0.059**
(0.018)
(0.020)
(0.020)
Population
-0.0001
(0.0001)
Age
-0.003*
-0.003*
(0.001)
(0.001)
Education
-0.007***
-0.004***
(0.001)
(0.001)
Wellbeing
0.064***
0.065***
(0.000)
(0.000)
City size dummy
NO
NO
YES
Regional effects
YES
YES
YES
Observations
1822
1822
1822
R-squared
0.289
0.296
0.297
VARIABLES
(4)
(5)
(6)
(7)
Open SC
0.205***
0.204***
0.183***
0.165***
(0.016)
(0.012)
(0.017)
(0.028)
Closed SC
-0.136***
-0.136***
-0.118***
-0.131***
(0.027)
(0.027)
(0.022)
(0.022)
Civic culture
0.101***
0.101***
0.116***
0.122***
(0.008)
(0.006)
(0.009)
(0.003)
Population
-0.002
-0.015
-0.022*
(0.012)
(0.011)
(0.009)
Age
0.000
-0.006
(0.006)
(0.009)
Education
0.002
0.025**
(0.026)
(0.006)
Wellbeing
0.167***
0.162***
(0.011)
(0.008)
Observations
86
86
86
65
R-squared
0.521
0.521
0.561
0.505
Robust
sta
ndar
d e
rro
rs c
lust
ered
at
sett
lem
ent
type
are
in p
are
nth
esis
. *
**:1
%, **:
5%
, *:
10

29
Figure 1: Social capital and quality of governance in large cities. Partial regression plot
between the performance and open social capital measures (controlling for average income,
education and city type)
-.4
-.2
0.2
.4e(Perform
ance | X )
-1 -.5 0 .5 1 1.5e( Open Sc| X )
coef = .228, se = .045, t = 5.08

30
Tab
le 9
: Im
pac
t of
gover
nan
ce a
nd s
oci
al c
apit
al f
or
soci
al a
nd e
conom
ic o
utc
om
es.
Total sample
Large cities
VARIABLES
(1)
(2)
(3)
(4)
Quality of
governance
0.450***
0.352***
0.338***
0.338***
(0.022)
(0.014)
(0.015)
(0.016)
Open SC
0.078***
0.072***
0.072***
(0.008)
(0.009)
(0.009)
Closed SC
-0.060***
-0.056***
-0.056***
(0.006)
(0.002)
(0.003)
Civic culture
-0.007
0.005
0.005
(0.005)
(0.004)
(0.002)
Population
0.0011***
(0.0003)
Age
-0.002
-0.001
(0.005)
(0.005)
Education
0.005
0.004
(0.010)
(0.008)
Wellbeing
0.094***
0.093***
(0.014)
(0.014)
City size dummy
NO
NO
NO
YES
Regional effects
NO
YES
YES
YES
Observations
1822
1822
1822
1822
R-squared
0.137
0.319
0.336
0.335
VARIABLES
(1)
(2)
(3)
(4)
Quality of
governance
0.813***
0.813***
0.855***
0.972***
(0.059)
(0.058)
(0.176)
(0.075)
Open SC
-0.038
-0.036
-0.027
-0.054
(0.034)
(0.045)
(0.041)
(0.052)
Closed SC
0.058**
0.059*
0.048*
0.040
(0.021)
(0.026)
(0.017)
(0.024)
Civic culture
-0.096
-0.096
-0.116
-0.207***
(0.082)
(0.084)
(0.089)
(0.020)
Population
0.003
0.027
0.024
(0.036)
(0.036)
(0.071)
Age
-0.041***
-0.030
(0.008)
(0.014)
Education
-0.123*
-0.159**
(0.046)
(0.041)
Wellbeing
-0.079
-0.244**
(0.192)
(0.065)
Observations
86
86
86
65
R-squared
0.197
0.197
0.267
0.292
Robust
sta
ndar
d e
rro
rs c
lust
ered
at
sett
lem
ent
type
are
in p
are
nth
esis
. *
**:1
%, **:
5%
, *:
10

31
Tab
le 1
0:
Reg
ress
ion o
f outc
om
es o
n c
lose
d s
oci
al c
apit
al b
y q
uan
tile
s of
open
soci
al c
apit
al d
istr
ibuti
on
the first
third of the
open SC
distribution
the second
third of the
open Sc
distribution
the last third
of the the
open sc
distribution
the first third
of the open
SC
distribution
the second
third of the
open Sc
distribution
the last third
of the the
open sc
distribution
VARIABLES
(1)
(2)
(3)
(4)
(5)
(6)
Open SC
0.118***
0.00993
0.0987***
0.122***
0.0125
0.0993***
(0.0319)
(0.0720)
(0.0316)
(0.0320)
(0.0721)
(0.0318)
Closed SC
-0.0207
-0.0553***
-0.133***
-0.0221
-0.0512***
-0.134***
(0.0193)
(0.0181)
(0.0170)
(0.0194)
(0.0181)
(0.0171)
Education
0.0281
0.00626
0.0116
0.0181
0.00666
0.0160
(0.0337)
(0.0330)
(0.0338)
(0.0349)
(0.0344)
(0.0351)
Wellbeing
0.160***
0.129***
0.0929**
0.156***
0.128***
0.0937**
(0.0383)
(0.0357)
(0.0377)
(0.0385)
(0.0358)
(0.0380)
Age
-6.04e-05
0.00134
-0.000108
0.00112
-0.000218
-0.000570
(0.00444)
(0.00449)
(0.00442)
(0.00456)
(0.00453)
(0.00447)
Population
0.0007
0.0009**
0.0005
-0.0004
0.0008
0.0008
(0.0009)
(0.0004)
(0.0007)
(0.002)
(0.001)
(0.002)
City size dummy
NO
NO
NO
YES
YES
YES
Observations
610
614
608
610
614
608
R-squared
0.077
0.059
0.136
0.084
0.074
0.140
Robust
sta
ndar
d e
rro
rs c
lust
ered
at
sett
lem
ent
type
are
in p
aren
thes
is. *
**:1
%, **:
5%
, *:
10

32
Table 11: Correlations between respondents’ assessments of socio-economic conditions in
their cities in 2007 and similar regional assessments for other years
Total sample
(1816)
Larger cities
(85)
Regional
capitals (66)
2005 regional survey 0,22 0,60 0,65
2008 regional survey 0,34 0,73 0,79
2009 regional surveys 0,21 0,62 0,70
Figure 2: Partial regression plot between the size of middle class in 1980 and social cohesion
in 2007 (controlling for average income, education in 1980 and 2007 and city type)
-.4
-.2
0.2
.4e( Social cohesion'07 | X )
-.4 -.2 0 .2 .4e(size of middle class'80 | X )
coef = .63, se = .15, t = 4.14