social capital, trust, and firm performance during the ... · social capital, trust, and firm...
TRANSCRIPT
Social Capital, Trust, and Firm Performance during the Financial Crisis*
Karl V. Lins
University of Utah
Henri Servaes
London Business School, CEPR, and ECGI
Ane Tamayo
London School of Economics
January 2015
We study the extent to which a firm’s social capital, as measured by the intensity of a firm’s corporate
social responsibility (CSR) activities, affects firm performance during the 2008-2009 financial crisis.
We find that high-CSR firms have crisis-period stock returns that are four to five percentage points
higher than low-CSR firms, all else equal. In contrast, we find no difference in returns between high-
and low-CSR firms either before or after the crisis. During the crisis, high-CSR firms also experience
higher profitability, sales growth, and sales per employee and a decline in their accounts receivable
relative to low-CSR firms. This evidence is consistent with the view that the trust between the firm and
its stakeholders and investors, built through investments in social capital, pays off when the overall
level of trust in corporations and markets suffers a negative shock.
_____________ * We would like to thank Taylor Begley, Joao Cocco, Mike Cooper, James Dow, Alex Edmans, Christopher Hennessy,
Ralph Koijen, Jean-Marie Meier, Yuval Millo, Rui Silva, Hannes Wagner, and seminar participants at Erasmus University,
HEC Paris, INSEAD, King’s College, London Business School, London School of Economics, Tilburg University,
University of Leicester, WHU Otto Beisheim, and the International Corporate Governance Conference at Hong Kong
Baptist University for helpful comments and discussions.

1
“The present financial crisis springs from a catastrophic collapse in confidence … Financial markets
hinge on trust, and that trust has eroded.” (Professor Joseph Stiglitz, 2008)
“The fundamental problem isn’t lack of capital. It’s lack of trust. And without trust, Wall Street might
as well fold up its fancy tents.” (Former U.S. Labor Secretary Robert Reich, 2008)
“The global financial and economic crisis has done a lot of harm to the public trust in the institutions,
the principles and the concept itself of the market economy.” (OECD Secretary General Angel Gurria,
2009).
“Something important was destroyed in the last few months of 2008. It is an asset crucial to
production, even if it is not made of bricks and mortar… This asset is trust.” (Paolo Sapienza and
Luigi Zingales, 2012)
1. Introduction
The financial crisis highlighted the importance of trust for well-functioning markets and
financial stability,1 but discussion on the role of trust and, more generally, social capital in economic
life is not new.2 Arrow (1972) argues forcefully that virtually every economic transaction has within
itself an element of trust, and that much of the economic backwardness in the world can be explained
by the lack of mutual confidence.3 Likewise, a stream of literature in economics and sociology
articulates the role of trust and social capital in economic life. For example, Putnam (1993) analyses
social capital from a macroeconomic perspective and shows that societies with higher social capital
display higher economic development (see also, Fukuyama (1995), La Porta, Lopez-de-Silanes,
Shleifer, and Vishny (1997), and Knack and Keefer (1997)); focusing on capital markets, Guiso,
Sapienza, and Zingales (2004, 2008)) show that social capital and trust allow for greater stock market
1 The notion that the crisis led to a decline in public trust on corporations has also been corroborated by surveys, such as the
Edelman Trust Barometer 2009. Edelman is the world’s largest public relations firm. Among other things, it conducts
worldwide surveys on trust. Its Trust Barometer of 2009 shows that 62% of respondents from a twenty-country survey had
lower trust in corporations in the aftermath of the financial crisis. The Financial Trust Index (financialtrustindex.org)
developed by Paolo Sapienza and Luigi Zingales also measures this aspect of public trust, but because this index started
after the onset of the crisis we cannot employ it to corroborate the extent to which trust changed as a result of the crisis. 2 Trust is generally viewed as the tendency of people in a society to cooperate, while social capital refers to networks with
shared norms, values and understandings that facilitate cooperation (OECD (2007)). 3 For recent theoretical work on the origins of trust, see Carlin, Dorobantu, and Viswanathan (2009).

2
participation. The unanswered question in this literature is whether, and to what extent, social capital
affects individual firm valuation.
To identify whether social capital impacts firm valuation, it is useful to find a period in which
there is a shock to the importance of social capital and trust. As the introductory quotes make clear,
public trust in institutions, capital markets, and corporations suffered a negative shock during the
financial crisis. If the social capital and trust built by a firm are important for valuation, we would
expect such trust to pay off during an extreme crisis of confidence, and for shareholders to assign
higher relative valuations to high-social-capital firms during such periods. Our paper tests this
hypothesis.
We base this hypothesis on two set of arguments. First, much of the interaction between a
firm’s stakeholders and the firm occurs through implicit or incomplete contracts, which might not be
honored by either party during a crisis. To the extent that social capital builds trust and vice versa
(Putnam (1993)), high-social-capital firms are more likely to have earned the confidence of their
stakeholders. This could matter for valuation because the reciprocity concept (i.e., the idea that “I will
be good to you because I believe you will be good to me at some point in the future”) often discussed
in studies of social capital (see, for example, Gouldner (1960)) becomes more relevant in times of
crisis: stakeholders such as employees, customers, suppliers, and the community at large are more
likely to “do whatever it takes” to help high-social-capital firms weather periods of crisis, given that
those firms displayed greater attention to, and cooperation with, stakeholders prior to the crisis.
Reciprocity examples include business contacts continuing solid buying or selling relationships,
employees working harder (or more cheaply) and more creatively to ensure success, customers paying
their invoices faster, or outside regulators/agencies being more sympathetic to these firms’ needs for
direct relief or for flexibility regarding regulations.

3
Second, during a negative shock to confidence outside shareholders are likely to be more
concerned that the financial information they previously relied upon to guide investment decisions may
not be credible. As such, they will seek metrics such as social capital ratings that speak to a firm’s
values and integrity, placing a valuation premium on firms that appear more trustworthy.4 If either of
these mechanisms is at play, we would expect high-social-capital firms to outperform during the crisis
of confidence that occurred in the great recession of 2008-2009.
To measure social capital, we use the strength of an individual firm’s corporate social
responsibility (CSR) activities. We motivate such a metric by relying on the definitions of both social
capital and CSR. There are two general approaches to defining social capital (Sacconi and Degli
Antoni, (2011), p. 161). One defines it in terms of generalized trust, civic norms, beliefs and
dispositions which affect agents’ propensity to cooperate (for example, Putnam (1993) and Knack and
Keefer (1997)), while a second approach defines it in terms of cooperative networks among agents (for
example, Coleman (1988, 1990), and Lin (2001)). Thus, social capital need not apply to all agents
equally; i.e., some firms or individuals can invest more in developing social capital than others (see
Coleman (1990), Leana and van Buren (1999), and Glaeser, Laibson, and Sacerdote (2002)).
Similarly, there is no singular definition of CSR, but definitions generally involve aspects of
trust, beliefs, and dispositions toward cooperation between the firm and its stakeholders (for example,
Freeman (1984, 2000), Freeman and Evan (1990), and Sacconi and Degli Antoni (2011)). One widely
cited definition is provided by the World Business Council for Sustainable Development, which states
that “CSR is the commitment of a business to contribute to sustainable economic development, working
with employees, their families, the local community and society at large to improve the quality of life.”
This definition captures aspects such as cooperation, cooperative networks, and social values and
4 As pointed out by Guiso, Sapienza and Zingales (2008), “the decision to invest in stocks requires not only an assessment
of the risk–return trade-off given the existing data, but also an act of faith (trust) that the data in our possession are reliable
and that the overall system is fair (p. 2557)”. This concern can also manifest itself at the firm level.

4
norms, which are the basis of social capital definitions. For example, Putnam (1993) views social
capital as “The propensity of people in a society to cooperate to produce socially efficient outcomes.”
Focusing on the trust aspect of social capital, Fukuyama (1995) and La Porta, Lopez-de-Silanes,
Shleifer, and Vishny (1997) argue that trust is the expectation that other contracting parties will
cooperate, rather than purely act in their own self-interest.5
Given the common concepts underlying the definitions of social capital and CSR, we argue
that a firm’s CSR strength constitutes an appropriate proxy for firm-level social capital,6 although we
acknowledge the limitations of any metric trying to capture all aspects of social capital (see Sapienza,
Toldra-Simats, and Zingales (2013) for a full discussion of this issue).
Several recent studies support our claim that stakeholders are more likely to trust and cooperate
with high-CSR firms. For example, Eccles, Ioannou, and Serafeim (2014) show that high-CSR firms
implement processes that consistently engage with stakeholders over the long term.7 Bénabou and
Tirole (2010) also argue that stronger stakeholder engagement via CSR could lessen the likelihood of
short-term opportunistic behavior by managers. Two other studies indicate that shareholders as well as
stakeholders are likely to view high-CSR firms as being more trustworthy. Gao, Lisic, and Zhang
(2014) show that executives of high-CSR firms are less likely to trade prior to future news and profit
less from insider trading in general than executives from low-CSR firms, while Kim, Park, and Wier
(2012) show that socially responsible firms are less likely to engage in earnings management.8
5 The concept of social capital is also related to the concept of integrity put forward in recent work by Erhard, Jensen, and
Saffron (2013) and Erhard and Jensen (2014), who argue that trust follows from a proactive stance to establish integrity –
the process of honoring one’s word on commitments made to a variety of constituents consistently. 6 A recent book edited by Sacconi and Degli Antoni (2011) compiles a series of studies that echo the view that firms can
build social capital and trust through CSR investments. 7 The idea of CSR as a competitive advantage is proposed and discussed in detail in Porter and Kramer (2006, 2011).
8 The notion that CSR activities build social capital and trust is also supported by recent CEO surveys conducted by
PricewaterhouseCoopers (2013, 2014). In both surveys, CEOs indicate that they plan to increase their engagement in
activities within the CSR remit to restore stakeholder trust after the crisis.

5
Related work on trust from an employee perspective is conducted in Guiso, Sapienza, and
Zingales (2015) who employ survey data from the Great Place to Work Institute. They find evidence
of higher firm performance when employees perceive top managers as being trustworthy and ethical.
The authors carefully note in their conclusion that, given their research design, it is difficult to infer
causality, and that some type of field experiment would be crucial to infer that trustworthiness has a
causal effect on firm performance. As discussed, our paper proposes a natural experiment that can
address this question.9
To test the extent to which shareholders place an incremental valuation premium on firm social
capital during a crisis of confidence, we use a sample of 1,841 non-financial firms with CSR data
available on the MSCI ESG Stats database (formerly known as KLD) over the August 2008-March
2009 financial crisis period. We find that firms that entered the crisis period with high CSR ratings
have significantly higher crisis-period stock returns than those that entered it with low CSR ratings.
Depending on the specification, buy-and-hold crisis period returns for high-CSR firms are about four to
five percentage points higher than for low-CSR firms, after controlling for various risk measures and
other measures of financial health that could affect performance in a crisis situation. The economic
importance of social capital in explaining stock returns is at least half as large as the effect of cash
holdings and leverage, financial variables that have been shown to affect crisis period returns (see
Duchin, Ozbas, and Sensoy (2010) and Almeida, Campello, Laranjeira, and Weisbenner (2012)). This
result stresses the importance of expanding the focus beyond financial capital when attempting to
understand the drivers of firm-level performance during financial shocks.
9 Also from an employee perspective, Edmans (2011) shows that firms that feature on the “100 Best Companies to Work
For in America” earn subsequent annual abnormal returns of 3.5%, suggesting that the market does not fully value the
benefits associated with employee satisfaction.

6
We also verify that our findings hold after controlling for various measures of governance and
accounting transparency, and during the Enron/Worldcom crisis of the early 2000s, which also
constituted a shock to trust and confidence in financial reporting.
Collectively, the results showing that investors assign a premium to high-CSR firms during a
crisis of trust provides causal evidence that greater social capital maps into higher returns at the
microeconomic level. From a firm’s perspective, our results indicate that the benefits which accrue
when a firm builds its social capital through CSR activities outweigh the costs of these activities during
times of severe economic and financial stress. As such, the building of social capital can be thought of
as an insurance policy which pays off when investors and the economy at large face a severe crisis of
confidence and when the reward for being identifiably trustworthy markedly increases.10
While we document that firms with high social capital outperform firms with low social capital
during the financial crisis, it is, of course, possible that this outperformance is not specific to the crisis.
That is, high CSR firms may always outperform low CSR firms (see also Edmans (2011)). To assess
this possibility, we examine whether the superior performance of high-CSR firms extends to periods of
economic growth or economic recovery by exploring the relation between CSR and firm performance
both before and after the crisis. We find no evidence that a hedge portfolio long in high-CSR firms and
short in low-CSR firms earns excess returns in the period of high economic growth before the crisis or
since the post-crisis recovery started. This indicates that, during normal times, any benefits or costs
associated with CSR activities are already priced in and/or that social capital does not deliver excess
returns when firms are performing well in aggregate.
We next investigate the potential mechanisms behind the outperformance of high-CSR firms
during the crisis, and examine the profitability and productivity of firms during this period. We find
10
For evidence on the benefits of CSR investments during firm-specific adverse events see Godfrey, Merrill, and Hansen
(2009), Minor (2013), and Hong and Liskovich (2014).

7
that during the last quarter of 2008 and the first quarter of 2009, high-CSR firms have higher
profitability and gross margins, and they experience higher sales growth than other firms. They also
have higher sales per employee. Moreover, these firms experience a substantial reduction in accounts
receivable to sales relative to other firms, a sign that when faced with a choice, customers are paying
the invoices of high-CSR firms faster. These results are consistent with a stakeholder commitment to
help out firms deemed to be more trustworthy during a major crisis, and with the reciprocity concept
discussed previously.
While our research focus is on the impact of social capital on firm valuation during a financial
shock, our study allows us to sidestep typical endogeneity concerns that make it difficult to identify
whether CSR activity impacts firm value, despite much research on this issue.11
In our natural
experiment, the exogenous financial shock disrupts the equilibrium, while levels of corporate social
responsibility remain fixed, at least in the short term. This allows us to directly observe how investors
adjust their valuations of firms with differing attitudes toward corporate social responsibility. Thus, this
paper also makes a contribution to the literature investigating whether CSR is value-enhancing for
shareholders.
The remainder of the paper is structured as follows. Section 2 discusses our data and summary
statistics. In section 3, we analyze whether CSR ratings impact stock returns during the crisis and
conduct robustness tests. In section 4, we explore whether CSR ratings impact stock returns during the
strong period of economic and stock market activity that preceded the crisis and the recovery period
after the crisis. Section 5 investigates whether there is effect of CSR ratings on stock returns during the
period surrounding the Enron and Worldcom fraud scandals. In section 6, we study several
11
While much of the literature described thus far suggests that shareholders can derive value from CSR investments,
another strand of the literature argues that CSR investments could stem from agency conflicts between managers and
shareholders (for example, see Cheng, Hong and Shue (2014) for evidence that supports the agency view and Ferrell, Liang,
and Renneboog (2014) for evidence that does not). Margolis, Elfenbein, and Walsh (2009) and Kitzmueller and Shimshack
(2012) provide surveys of the CSR literature.
8
mechanisms that may explain the excess performance of high-CSR firms. Section 7 concludes the
paper.
2. Sample and Summary Statistics
2.1. Sample Construction
To construct our sample, we gather information on firms’ CSR ratings from the MSCI ESG
Stats Database, which contains environmental, social, and governance ratings of large, publicly traded
companies. 12
This database has been used in a number of studies examining the effect of CSR on firm
performance (see, for example, Hong and Kostovetsky (2012), Deng, Kang, and Low (2013) and
Servaes and Tamayo (2013)). We obtain information over a time period that not only includes the
2008-2009 financial crisis, but also includes several years of pre- and post-crisis data so that we can
make time-period-specific assessments of the value of CSR activities. Since 2003, the database
contains yearly ratings on roughly the 3000 largest U.S. companies.
ESG Stats classifies environmental, social, and governance performance in 13 different
categories: community, diversity, employment, environment, human rights, product, alcohol, gaming,
firearms, military, nuclear, tobacco, and corporate governance. As in Servaes and Tamayo (2013), we
focus on the first five of these categories. We do not examine the product category because it contains
a number of elements that we consider to be outside the scope of CSR, such as product quality and
innovation.13
Similarly, we do not consider in our tests the ESG Stats categories that penalize firms’
participation in the six industries that are considered controversial, as there is nothing incremental that
firms can do to change a ranking score, except change industries. In addition, we control for industry
in all our tests. Finally, we do not examine the ESG Stats corporate governance category in our main
12
The MSCI ESG Stats Database was previously known as the KLD Stats database constructed by Boston-based KLD
Research and Analytics, Inc. (KLD). 13
Our findings are unchanged if we include the product category in the construction of our measure of CSR.

9
tests as our analysis is explicitly concerned with measuring trust between a firm and both its
stakeholders and the wider community, while governance is focused mainly on the investors in the
firm. However, it is possible that the governance category in aggregate, or some of the individual
governance category components are seen by investors as measures correlated with the trustworthiness
of a firm, so we examine this category in robustness tests.
For each of the five categories we consider, ESG Stats compiles statistics on both strengths and
concerns. We are interested in capturing both elements; accordingly, we construct a net CSR measure
that adds strengths and subtracts concerns. For each category, however, the maximum number of
strengths and concerns varies across time (for example, the total maximum of strengths for community
is seven in 2005, but only two in 2012). To obtain numerically consistent measures over time, we scale
the strengths (or concerns) for each category by dividing the number of strengths (or concerns) for each
firm-year by the maximum number of strengths (or concerns) that were possible for that category for
that year. From this exercise, we obtain strength and concern indices that range from 0 to 1 for each
category-year. Our measure of net CSR involvement in each category-year is then obtained by
subtracting the concerns index from the strengths index; thus, the net CSR index per category ranges
from -1 to +1. Finally, to obtain our primary explanatory variable, a firm’s total net CSR index (CSR
hereafter), we combine the net CSR indices for the categories of community, diversity, employment,
environment, and human rights. This is a net measure across our set of stakeholder-oriented categories,
and ranges from -5 to +5.
We obtain stock return data from CRSP and accounting data needed to compute control
variables for our regression models from Compustat. We remove financial firms from our sample
because of the extensive amount of government support given to financial firms during the crisis. We
also remove microcap stocks (those with a market capitalization below $250 million). These stocks
tend to suffer from low liquidity, have high bid-ask spreads, and are subject to more price pressure
10
effects of trading (see, for example, Fama and French (2008)), all of which would likely be more severe
during the financial crisis. Non-financial firms with sufficient data coverage on the CRSP and
Compustat databases are merged with firms on the ESG Stats database to obtain the sample employed
in this paper.
As in Lins, Volpin, and Wagner (2013) we define the financial crisis as the period from August
2008 to March 2009. August of 2008 preceded the September 2008 Lehman Brothers bankruptcy,
while March of 2009 is the month in which the S&P 500 hit its lowest point of the crisis.14
Thus, the
main performance measure for each firm, Crisis Period Return, is the firm’s raw buy-and-hold return
from August 2008 through March 2009, which we relate to our CSR measure for the year 2007. To
avoid problems with outliers, we winsorize these returns at the 1% level. For this period, we have a
sample of 1,841 firms for which all explanatory variables are available.
2.2. Descriptive statistics
Table 1 provides descriptive statistics for our main variables. Consistent with Deng et al.
(2013) and Servaes and Tamayo (2013), the first row of Panel A of Table 1 shows that our primary
variable of interest, CSR, is slightly negative with a mean value of -0.176 and a median value of -0.200.
Thus, the average and median firm has more CSR concerns than strengths. The next row shows that
our primary financial performance metric, Crisis Period Return, is substantially negative, with a mean
value of -39.7%, a median value of -41.1%, and a 25th
percentile value of -61.2%, indicating that
investors and stakeholders were likely quite concerned about the survival prospects of many firms that
they held in their portfolios, worked for, or interacted with in business transactions. Table 1 also
provides definitions and descriptive statistics for firm characteristics and factor loadings that we use as
14
We discuss robustness checks to show that our findings hold for alternative crisis period windows.

11
control variables in our models. These will be discussed in more detail subsequently. We present a
correlation matrix of all variables employed in our main analyses in Panel B of Table 1.
3. Crisis Period Returns
3.1. Baseline results
We estimate various regression models of stock returns during the crisis period as a function of
firms’ pre-crisis CSR ratings and a number of control variables. Panel A of Table 2 contains our
baseline regression models. The dependent variable is Crisis Period Return and the key explanatory
variable is the firm’s CSR score measured at year-end 2007. In model (i), the only control variable is
the firm’s beta, computed using the market model over the 60-month period prior to August 2008.15
The model shows that firms with higher CSR ratings performed significantly better during the crisis.
The effect is also large economically; increasing CSR by one standard deviation (0.392) leads to 2.86
percentage points higher raw returns during the crisis. As expected, higher beta stocks performed
worse during the crisis period.
In the remaining models of Panel A, we include further risk controls. In model (ii), we control
for the firm’s factor loadings based on the Fama-French 3-factor models. As in model (i), we estimate
the factor loadings over the 60 months prior to the onset of the crisis, using factor returns obtained from
Kenneth French’s website. Including these additional risk controls attenuates the impact of CSR on
crisis period returns, but the coefficient remains large and statistically significant. In model (iii), we
also control for a firm’s momentum loading (computed similarly to the other factor loadings), which
has only limited impact on the magnitude of the CSR coefficient. Finally, in model (iv), we include
industry dummies (defined at the two-digit SIC level) because some industries may be more prone to
15
Firms are excluded from the analysis if fewer than 12 months of data are available to estimate betas and factor loadings.

12
CSR investments than others and they may have been differentially affected by the financial crisis.16
If
high-CSR industries happened to perform better during the crisis, our results would be spurious. Our
findings, reported in column (iv), show that industry dummies do not subsume the effect of CSR on
crisis period returns, even though the explanatory power of the model increases substantially.
In Panel B, we repeat the previous exercise, but instead of including our linear measure of CSR
as an explanatory variable, we divide firms into CSR quartiles and include dummies for each quartile,
where CSR1 is set equal to one for firms in the lowest quartile of CSR ratings, etc. This approach will
allow us to assess whether the effect of a firm’s social capital on returns is more pronounced at very
high or very low levels of social capital. For ease of interpretation, we also report the difference
between the coefficients on the CSR1 and CSR4 dummies, and its statistical significance (p-values in
parentheses). As in Panel A, we report four regression specifications, each with different controls for
risk.
The models presented in Panel B of Table 2 again illustrate that firms with better CSR ratings
had the largest crisis-period returns. The difference in raw returns between firms in the best and worst
CSR quartiles, reported in the bottom of the panel, is particularly pronounced, totalling 7.6 percentage
points when controlling for beta, 6.7 percentage points when controlling for the three Fama-French
factors, 6 percentage points when also controlling for momentum, and 5.3 percentage points when
adding industry dummies to all risk factors. The top rows of Panel B show that the impact of CSR on
returns is not entirely linear. Based on model (iv), which features the full set of control variables,
returns improve about 2.8 percentage points when moving from the lowest to the 2nd
lowest quartile of
CSR. Further improvements in returns are modest when moving to the 3rd
quartile, while the jump in
returns when moving from the 3rd
to the 4th
quartile is the highest at 3.1 percentage points. These
16
A regression of our CSR score for 2007 only on industry dummies specified at the two-digit SIC code level has an
adjusted r-squared of 7%.
13
results indicate that investors were most concerned when a firm had a low level of social capital and
were most reassured when they observed firms with a high level of social capital.
In terms of the control variables, firms with high betas and momentum loadings performed
particularly poorly during the crisis.
Overall, the findings reported in Table 2 show that more socially responsible firms suffered less
during the crisis, particularly when compared to firms in the lowest quartile of social responsibility.
These results support the view that firms’ investments in social capital provided investors and
stakeholders with a greater sense that they could trust the firm as the crisis was unfolding, leading to
relative stock price outperformance.
3.2. Additional control variables
One worry with the specifications reported in Table 2 is that the strong performance of high-
CSR firms during the crisis may be due to omitted variables that happen to be correlated with CSR, and
not due to CSR itself. To address this problem, we re-estimate our previous regression models with the
inclusion of controls for a number of firm characteristics. These specifications are reported in Table 3.
In this table, we control for the firm’s financial health in the year before the crisis and for other
firm characteristics that have been found to affect stock returns, as well as for industry effects. A
firm’s financial health before the crisis will likely affect its ability to survive the shock and, therefore,
its stock market performance. We employ several proxies to measure the firm’s ability to withstand a
severe downturn in the economy: Cash holdings (computed as cash and marketable securities divided
by assets), Short-term debt (computed as debt in current liabilities divided by assets), Long-term debt
(computed as long-term debt divided by assets), and Profitability (computed as operating income
divided by assets). We expect profitable, cash rich firms with little debt to manage better in a crisis
situation. Such firms can maintain their necessary investments while other firms will be forced to cut
14
investment, especially if they have short-term debt maturing during the crisis (see Duchin, Ozbus, and
Sensoy (2010), Almeida, Campello, Laranjeira, and Weisbenner (2012), and Harford, Klasa, and
Maxwell (2014) for empirical evidence consistent with these expectations).
Finally, a number of articles in the asset pricing literature have documented that not only factor
loadings matter in predicting stock returns, but that firm characteristics themselves may also be
important (see, for example, Daniel and Titman (1997)). In particular, size (measured as the log of a
firm’s equity market capitalization), Book-to-market (computed as book value of equity divided by
market value of equity), and Momentum (computed as the raw return over the period August 2007 to
July 2008) may be related to future returns. Similarly, we include a control for a firm’s Idiosyncratic
risk (computed as the residual variance from the market model estimated over the five-year period
starting in August 2003, using monthly data) under the premise that stock price volatility affects returns
(see Goyal and Santa-Clara (2003)). We measure financial health and firm characteristics at the end of
December of 2007 or as close as possible to it for firms that do not have a December fiscal year end,
except for momentum and idiosyncratic volatility, which are computed over one and five years,
respectively, before the crisis period.
The results presented in models (i) through (iv) of Panel A, Table 3 confirm the findings from
the more parsimonious models reported in Table 2. In model (i), we control only for firm
characteristics and the firm’s market model beta. In model (ii) we control for the firm’s financial
health and its loadings in the three-factor model, while in model (iii) we also add the momentum factor.
Finally, in model (iv), we include financial health, factor loadings, and firm characteristics. All models
show that firms with high CSR ratings outperform those with low CSR ratings during the crisis. The
magnitude of the high-CSR outperformance is somewhat lower, however, once we include these
additional control variables. Nonetheless, the effect is still important economically. In model (iv), an
increase in CSR of one standard deviation (0.392) is associated with crisis-period returns that are 1.53

15
percentage points higher. Also note that while the explanatory power of the model improves as we
include more controls, the magnitude of the CSR effect is similar across specifications.
Turning to the control variables, as expected, firms that entered the crisis in better financial
health (higher cash holdings and profitability and lower debt) have higher crisis-period stock returns.
In terms of economic significance, the effects of cash holdings and idiosyncratic risk on performance
during the crisis are the largest. Based on model (iv), a one standard deviation increase in cash
holdings (0.21) leads to an increase in market-adjusted crisis-period returns of 3.46 percentage points,
while a one standard deviation reduction in idiosyncratic risk (0.011) increases crisis period returns by
2.71 percentage points. Thus, the economic impact of CSR ratings on returns during the crisis is about
half of the impact of cash holdings and more than half the impact of volatility, indicating that social
capital is indeed a relatively important firm characteristic.
Panel B of Table 3 repeats the above analysis, but employs CSR quartile dummies as in Panel B
of Table 2. As in Table 2, the differences between the coefficients on the CSR1 and CSR4 dummies are
always significant in all models, indicating that high-CSR firms achieve relatively higher returns during
the crisis period. Consistent with the results of Panel A in Table 3, the difference in crisis-period
returns between firms in the best and worst CSR quartiles is attenuated with the additional control
variables now present in the models, but remains economically large. The difference in returns
between a CSR1 and CSR4 firm ranges from 4.2 to 4.8 percentage points. Again, the impact of CSR on
returns is not entirely linear across the quartiles of CSR. We see the greatest improvement in returns
associated with a move from the lowest to the 2nd
quartile of CSR and with a move from the 3rd
to the
4th
quartile. Overall, the results presented in Panel B of Table 3 are consistent with those contained in
Table 2, albeit slightly smaller in economic magnitude.
Taken together, the results from these expanded models of Table 3, which feature a full set of
factors expected to affect both steady-state and crisis-period stock returns, continue to show that having

16
a strong commitment to CSR activities is beneficial to a firm’s shareholders during a major financial
crisis. This evidence indicates that the social capital generated by CSR activities positively influences
the way that investors view a given firm during a shock to investor confidence.
3.3. Robustness tests
In this section, we report the results of various tests conducted to determine whether our main
findings are robust.
We first focus on measuring CSR performance at different points in time. In our base-line
models reported in prior tables, we measure CSR performance at the end of 2007, before the onset of
the financial crisis. One could argue that some events in 2007 already served as a precursor to the
crisis. In particular, the stock market peaked in October 2007 and U.S. house prices started to decline
in the second half of 2007. Thus, it is possible that firms altered their CSR policies by the end of 2007
in anticipation of the upcoming crisis. We therefore re-estimate all our models using CSR measured at
the end of 2006 as the key explanatory variable. As illustrated in column (i) of Table 4, where we
display the model with inclusion of all control variables, our results remain statistically and
economically significant in this specification and are actually slightly stronger in magnitude than those
presented in Table 3.
It is also possible that high-CSR firms performed well during the crisis because prior CSR
activities were actually negative NPV projects, and firms were forced to cut these activities during the
crisis. Put another way, if it is efficient for a firm to break its implicit contracts to its stakeholders
when a crisis strikes (rather than keep them and obtain the stakeholder benefits as has been discussed
earlier) then CSR measured pre-crisis captures the firm’s ability to reduce inefficiencies. Further, if
CSR is just one element of excess investment, then the level of CSR could also proxy for the extent of
overinvestment in the firm as whole. Thus, it could be that firms which engaged more in non-value
17
maximizing behavior pre-crisis performed better during the crisis simply because they had more
excesses that could be trimmed. A straightforward way of checking this is to see whether our results
still hold when CSR is measured at year-end 2008 when these excesses would arguably have already
been cut. This is what we do in model (ii) of Table 4. Our findings persist: high CSR levels measured
in the depth of the crisis are still associated with higher crisis period returns and the coefficient is
virtually identical in significance and magnitude to the coefficients reported in Table 3. These results
indicate that high pre-crisis CSR levels do not proxy for the ability to cut CSR and (over)investment in
general.17
As a second robustness test, we assess whether our decision to remove from our sample the 145
micro-cap firms (those with an equity market capitalization below $250 million) affects our results.
We excluded these micro-cap firms because they typically display very low stock market liquidity, and
this factor could outweigh most or all other factors during the crisis. In Model (iii) we re-estimate our
full model including these firms. The adjusted r-squared declines slightly, indicating that these firms
are likely adding some noise to our estimates. Importantly, the coefficient on CSR remains positive and
significant, showing that our results obtain even with these low-liquidity micro-cap firms added back to
our sample.
Third, we verify that our findings are not due to the inclusion of March 2009 as part of the crisis
period. Stock markets started recovering globally during the middle of that month and we want to
make sure that our results are not just due to this recovery. In untabulated models, we find that the
coefficient on CSR as measured in our base case year of 2007, or in 2006 or 2008, remains positive in
specifications that exclude March 2009 as part of the crisis return window, although the economic
significance of the result is lower in some specifications.
17
Our results also continue to hold using CSR measured at year-end 2009 after the crisis had ended (untabulated).

18
Fourth, we ensure that our findings persist after we control for measures of corporate
governance. As discussed previously, we did not include the ESG Stats governance category in the
construction of our measure of CSR because our aim was to focus on the relationship between the firm
and its stakeholders and the wider community as a measure of social capital, while governance mainly
deals with the relationship between a firm and its investors. Recent evidence shows, however, that
better-governed firms performed relatively well in the financial crisis (see, for example, Lins, Volpin,
and Wagner (2013) and Nguyen, Nguyen, and Yin (2015)). If governance is correlated with our CSR
measure, then it is possible that CSR is simply proxying for governance and that we are suffering from
an omitted variable bias. To address this concern, we gather data on a variety of governance measures.
As a starting point, we construct a governance measure from the ESG Stats database. Our procedure is
the same as the one we used for the other components of CSR: for each firm, the number of concerns is
divided by its possible maximum and subtracted from the number of strengths divided by its possible
maximum. This yields a governance index that ranges from -1 to +1. As for the CSR measure, we use
the governance measure computed as of year-end 2007.
In models (i) and (ii) of Table 5, we repeat our prior analyses described in Tables 2 and 3 but
now include the ESG Stats governance index in our models. Model (i) controls for industry and factor
loadings, while model (ii) includes these variables as well as all firm characteristics. The ESG Stats
governance index is not significantly related to crisis-period returns in either specification and the
impact of CSR on crisis period returns is virtually identical to that reported previously, providing
evidence that the CSR effect is not picking up a governance component.
Next, we expand the set of governance metrics to further assess whether our CSR findings can
be explained by differences in governance. To do so, we follow the recent governance literature that
computes an entrenchment index (E-Index) based on the six governance provisions found by Bebchuk,
Cohen, and Ferrell (2009) to significantly map into stock returns and valuation levels for U.S. firms.

19
Specifically, we obtain from MSCI Governance Metrics data on whether a firm has any of the
following six governance provisions that indicate entrenchment: a staggered board, limits to amend its
charter, limits to amend bylaws, supermajority voting requirements, golden parachutes for executives,
or the ability to adopt a poison pill. For each firm, we sum the total number of these provisions to form
the firm’s E-index and we include this entrenchment measure in models (iii) and (iv) of Table 5. We
also include in these models the following additional governance characteristics: Board independence,
Board size, a dummy if the CEO is not the Chairman, and Board ownership, obtained from the MSCI
Directors database. Board independence is measured as the fraction of the board consisting of outside
directors and board ownership is fraction of outstanding shares owned by the board members. Some of
the data items needed to compute the E-index or the four supplemental governance characteristics are
missing for some firms in our sample. When this happens, we set the governance characteristic equal
to zero, and code a missing variable dummy which we set equal to one if that governance item is
missing. All of these “missing” dummy variables are included in models (iii) and (iv) as well
(coefficients not reported). This procedure allows us to estimate these expanded models for the same
set of firms as the prior models.
The results of these comprehensive tests for potential governance effects confirm that a firm’s
CSR activities have a positive and significant impact on crisis period stock returns. The coefficients on
the CSR variable are virtually identical to those reported in Tables 2 and 3, which featured no
governance controls, and to the coefficients reported in models (i) and (ii) of Table 5, which indicates
that our measure of CSR is not capturing governance quality. The only marginally significant
governance variable in these models is the E-index, which indicates that firms with more entrenched
managers performed worse during the crisis.
As a fifth robustness test, we examine whether CSR is proxying for reporting transparency or
the lack of accounting concerns. To this effect, we include in the regression models various

20
subcomponents of the ESG Stats corporate governance score that specifically address these factors.
We measure transparency as the difference between the transparency strength and transparency
concern subcategory dummies. These dummies reflect the firm’s effectiveness, or lack thereof, in
reporting on a wide range of social and environmental performance measures. Thus, transparency can
take on three values: 1, 0 and -1. One worry is that this measure of transparency is really about CSR
reporting and not accounting transparency. However, Dhaliwal, Li, Tsang, and Yang (2011) report that
accounting quality is positively correlated with CSR reporting, suggesting that our transparency proxy
captures various elements of reporting quality. We also include the variable accounting concern from
ESG Stats, which is a dummy set equal to one if the firm is involved in significant accounting-related
controversies. Both transparency and accounting concerns are measured as of year-end 2007. In
models (v) and (vi) of Table 5, we repeat our analyses after controlling for transparency, while in
models (vii) and (viii) we include the accounting concerns dummy. In all specifications, the impact of
CSR on crisis period returns persists. The transparency and accounting concerns variables are never
statistically significant.18
4. Returns Outside of the Crisis Period
In this section, we investigate whether outside investors view firms’ investments in CSR
activities differently outside the crisis period, when there was no shock to trust. Specifically, we study
whether a firm’s CSR ratings are a significant determinant of its stock returns over the 10-year period
starting in January 2004 and ending in December 2013, and whether these effects are different in the
pre-crisis period (January 2004 – July 2008), the crisis period (August 2008 – March 2009) and the
18
In unreported models, we also include an indicator variable set equal to one if the firm is included in the 100 Best
Companies to Work For list as published by Fortune Magazine in February 2008. As mentioned previously, Edmans (2011)
finds that firms included in this list earn excess returns over the subsequent five-year period. This dummy is not significant
in explaining crisis-period returns and its inclusion does not have any impact on the coefficient of our measure of CSR.

21
post-crisis period (April 2009 – December 2013). It could be that the return pattern we uncover during
the crisis is a pattern that persists in some magnitude during other time periods as well. Alternatively,
the perceived benefit to investors of firms’ CSR activities could be influential for returns only when
there is a serious shock to the external environment that increases the need for trust.
We conduct this analysis using a calendar-time portfolio approach and study the returns of a
hedge portfolio that goes long into high-CSR firms and short into low-CSR firms. This approach is
commonly used in long-run event studies (see, for example, Barber, Lyon, and Tsai (1999)).
The specifics of our procedure are as follows. First, we employ the ESG Stats database to
construct our CSR measure for each year from 2002 to 2012. The measure of CSR is the same as the
one employed for crisis period returns: for each firm/year total strengths and concerns in five areas of
CSR are divided by the possible maximum; the net CSR score is the sum of all strengths minus the sum
of all concerns and ranges from -5 to +5. Second, we merge these firms with the CRSP monthly
returns dataset and remove financial firms and firms with market values below $250 million in 2007
dollars (as in our prior tests). Third, starting in January 2004, we divide the firms into four portfolios
according to their CSR score. Because CSR data for a particular year are not released until March of
the following year, we employ CSR data released in March 2003 for this classification. Firms remain
in this portfolio until April of 2004 when the new ratings data are released and firms are reassigned.
Thus, firms remain in the same portfolio from April until the following March. We repeat this
procedure annually. Then, we compute the equally weighted return of the portfolio of high-CSR firms
(top quartile) and subtract the equally weighted return of the portfolio of low CSR firms (bottom
quartile). Finally, we regress the returns on this hedge portfolio on the four factors found in Carhart
(1997) and investigate whether the alpha associated with this portfolio is different from zero. In
addition, to determine whether returns before and after the crisis are different from crisis period returns,
22
we include a Crisis indicator variable if the return falls in the August 2008 to March 2009 window, and
a Post-Crisis indicator variable if the return falls in the April 2009 to December 2013 window.
Table 6 reports the results of the hedge portfolio return regression. The alpha of this portfolio,
which measures pre-crisis returns, is -22 basis points per month, which is not significantly different
from zero. Thus, there is no evidence of excess performance of high-CSR firms before the onset of the
financial crisis, consistent with our argument that firm-specific social capital and trust matter more
when there is a crisis of confidence. The Crisis dummy is 96 basis points and highly significant. Thus,
during the crisis, the excess performance of the hedge portfolio increased by almost 1 percentage point
per month. Adding the alpha and the crisis dummy yields excess performance of 74 basis points per
month, or almost 6 percentage points over the 8 months from August 2008 to March 2009. These
findings are similar to the ones reported in previous tables. Finally, the change in returns from pre- to
post-crisis is insignificant, which indicates that the excess performance of high-CSR firms is crisis-
specific.19
5. Excess returns and CSR during the Enron/Worldcom fraud scandals
The above findings indicate that the effect of CSR on excess returns is concentrated in the
recent crisis period when the overall level of trust in corporations suffered from a severe shock. As this
crisis was arguably the most severe crisis in generations, there are few other economy wide shocks that
could have the same effect. Perhaps one ‘shock’ that comes close to a crisis of confidence is caused by
the ripple effects associated with the frauds and subsequent bankruptcies of Enron and Worldcom.
Enron filed for bankruptcy in December of 2001, after admitting to accounting violations in October
19
The Financial Trust Index (financialtrustindex.org) suggests that trust in large corporations in general has not improved
much since the end of the crisis. This would indicate that firm-level social capital should still be important for stock returns.
However, we believe there are at least two reasons why this may not be the case. First, if the low level of trust in
corporations is now a persistent, long-term phenomenon, then any benefits of building social capital are built into firm
valuations already and should not affect subsequent returns. Second, while trust in corporations may be low, overall
economic performance is relatively strong, such that social capital has less of an impact on firm performance.

23
2001. Of course, fraud committed by one company alone does not necessarily dent investors’ trust in
all firms. However, soon after Enron’s bankruptcy, Worldcom’s accounting violations became public,
eventually leading to Worldcom’s bankruptcy filing in July of 2002. During the same period, a large
number of other accounting violations were revealed by companies like Adelphia Communications,
AOL, Global Crossing, Bristol-Myers, and others.
These bankruptcies and scandals are likely to have caused a more general decline in trust in
corporations, which allows us to verify whether our findings also hold during another crisis period. We
follow a procedure similar to the one employed in section 3, where we relate stock market returns to
measures of CSR and a number of control variables. We cumulate returns over the period October
2001, when the Enron accounting violations were first revealed, to March 2003, the month prior to the
start of the stock market rally that persisted until the start of the recent crisis. We relate these returns to
our measure of CSR computed as of year-end 2000, and the same control variables as employed
previously. Financial firms and small firms (market values below $250 million in 2007 dollars) are
again excluded. Factor loadings are computed over the five-year period ending in September 2001.
Unfortunately, ESG Stats coverage for this period is much smaller, yielding a sample of only 391
companies.
Table 7 contains the results. We report four specifications. Control variables are included in all
models, but the industry dummies are excluded from models (i) and (ii) and then included in models
(iii) and (iv). Models (i) and (iii) use our primary measure of CSR (the difference between scaled CSR
strengths and weaknesses) as the key explanatory variable, while models (ii) and (iv) contain a coarser
CSR measure, namely a dummy variable, set equal to one if our measure of CSR is positive and zero
otherwise. Given the small sample size, such a specification may be better suited in this case,
especially because the findings reported in Tables 2 and 3 suggest some non-linearities in the CSR–
return relationship.

24
As illustrated in both columns (i) and (iii) of Table 7, the coefficient on our linear measure of
CSR, while positive, is not significantly different from zero. The indicator variable for high-CSR
firms, which is employed as an explanatory variable in models (ii) and (iv), is significant at 8.1
percentage points without industry controls and 7.5 percentage points with industry controls,
suggesting that during the crisis of confidence surrounding the accounting scandals revealed in
2001/2002, high-CSR firms again earned excess returns relative to low CSR companies. These results
support our prior findings that social capital created through CSR investments matters more when
investor confidence in corporations has been damaged.
6. The effect of CSR investments on operating performance during the crisis
In this section, we study the operating performance of companies during the recent crisis to
explore in more detail the possible sources of the excess returns earned by high CSR firms documented
previously. In particular, we estimate the following regression model for different performance
metrics:
Performancei,t = 1 CSRi + 2 (CSRi * Q4 2008) + 3 (CSRi * Q1 2009) + i + t + i,t,
where CSRi is our measure of CSR for firm i, i are firm fixed effects, and t are quarter fixed effects.
We are interested in the differential impact of CSR on performance during the financial crisis. Thus,
we interact our CSR measure with time dummies for the last quarter of 2008 and the first quarter of
2009.20
We estimate the above model using quarterly data from Compustat over the period 2008-2013,
controlling for both time trends and time-invariant firm fixed effects. Because performance may be
correlated across firms in the same quarter as they are all subject to the same economic shocks, we
estimate these models with standard errors clustered quarterly. As in our base case models reported in
20
Inclusion of a separate interaction term for the third quarter of 2008 does not materially affect these findings. We do not
report such a specification because the Lehman bankruptcy occurred in September 2008 and therefore we expect little
impact of CSR on 3rd
quarter results.

25
Tables 2 and 3, we compute CSR as of year-end 2007, and hold it constant throughout the sample
period. The effect of CSR itself (1) is therefore subsumed by the firm fixed effects. All performance
measures are winsorized at the 1st and 99
th percentiles.
Our findings are reported in Table 8. Our first performance measure is operating return on
sales, computed as operating income divided by sales. The interactions between CSR and Q4 of 2008
and Q1 of 2009 are both positive and highly significant, indicating that high-CSR firms were more
profitable than other companies at the end of 2008 and the beginning of 2009. In terms of economic
significance, increasing CSR by one standard deviation (0.392) increases profitability by 16 basis
points in the Q4 of 2008 and another 13 basis points in Q1 of 2009, which is substantial compared to
average quarterly profitability of 2.72% over the estimation period and 1.82% during the crisis.
Next, we analyze changes in the gross margin, defined as (sales – cost of goods sold) / sales, to
see whether high-CSR firms were able to sell their products at a higher mark-up during the crisis. This
appears to indeed be the case as both time/CSR interactions are significant. Over the two quarters
combined, a one standard deviation increase in CSR is associated with gross margins that are 65 basis
points higher. This effect appears small relative to average gross margins during the sample period of
40.17%, but the results on profitability just discussed suggest that much of this increase flows through
to the bottom line. These results suggest that customers were willing to tolerate higher mark-ups from
socially responsible firms during the crisis. Of course, it is possible that these increased mark-ups are
associated with lower sales growth. This is the performance metric that we study in the next column.
In column (iii) of Table 8, we report that high-CSR firms experienced higher sales growth
during the crisis compared to other firms. A one standard deviation increase in CSR is associated with
sales growth of 3.58% when we combine both crisis quarters. This is a considerable effect, given
median quarterly sales growth of 2.59% over the sample period, and a median decline in sales of 7.20%
26
during the two crisis quarters. The findings of columns (ii) and (iii) combined indicate that during the
crisis high-CSR firms experienced lower declines in sales than other firms, despite charging higher
mark-ups. This suggests that the customers of these firms were more willing to ‘stick’ with the
company during this period.
To examine this channel in greater depth, we study accounts receivable around the crisis. The
results reported in column (iv) show that accounts receivable of high-CSR firms declined relative to
other firms in the first quarter of 2009, indicating that customers were paying the invoices of high-CSR
firms faster. However, it should be noted that the effect is not significant during Q4 of 2008 or when
both quarters are added up.
In sum, the operating performance results described up to this point suggest that one of the
channels through which high-CSR firms earn excess returns during the crisis period is the willingness
of customers to continue supporting these firms, as reflected in higher sales growth, an acceptance of
higher mark-ups, and faster payments of invoices.
We now turn to the employee channel and study whether high-CSR firms achieved higher sales
per employee in the crisis period. As illustrated in column (v), there is a positive association between
CSR and employee productivity. The sum of the coefficients of 24.745 suggests that increasing CSR by
one standard deviation is associated with quarterly sales per employee that are $9,700 higher during the
crisis. The mean (median) firm over the sample period has sales per employee of $133,186 ($73,640),
with a standard deviation of $323,309, indicating that the impact of CSR on employee productivity is
not negligible. This result suggests an additional channel through which CSR affects performance.
One shortcoming of this analysis is that the number of employees is only available on Compustat at an
annual level. Thus, sales per employee for the first quarter of 2009 are computed using the number of
employees reported for year-end 2009. In unreported models we verify that our findings remain
27
unchanged when we lag the number of employees by one year or divide sales in both the fourth quarter
of 2008 and the first quarter of 2009 by year-end 2008 employees.
Finally, to verify that higher sales per employee are not due to employee layoffs, we compute
growth in the number of employees on an annual basis and estimate models of employee growth as a
function of CSR, time trends and firm fixed effects, and the interaction between CSR and both a 2008
and 2009 dummy. This regression is similar to the ones estimated for the performance measures,
except that it is estimated using annual instead of quarterly data. As illustrated in column (vi) of Table
8, there is no evidence of higher employee layoffs for high-CSR firms in 2008 or 2009. In fact, if we
remove firms that double their employees or lose half their employees in a year, we find evidence that
high-CSR firms experience more employee growth in 2009, as illustrated in column (vii).
Overall, the evidence reported in this section suggests that increased returns to high-CSR firms
accrue through both the customer and employee channels.
7. Conclusion
This paper provides evidence that firm-specific social capital, built up through investments in
CSR, pays off in a time period when the importance of trust unexpectedly increases – the 2008-2009
financial crisis. In particular, we find that firms with high CSR ratings outperform firms with low CSR
ratings during the crisis by at least four percentage points, after controlling for a variety of firm
characteristics and risk factors. Before the crisis, however, when the economy was growing, we find
no evidence of such an effect. Similarly, we find no difference in performance between high- and low-
CSR firms during the recovery period after the crisis. These results suggest that increased social
capital created through CSR efforts matters predominantly in periods when trust in corporations at
large has eroded and/or that during normal times any benefits of social capital are already imbedded in
a firm’s share price.

28
We also examine the mechanisms through which higher CSR levels might generate excess
returns during the crisis period and find that high-CSR firms benefit through higher profitability, sales
growth, and employee productivity, and a reduction in accounts receivable, relative to low-CSR firms.
Overall, our results suggest that the building of firm-specific social capital can be thought of as
an insurance policy which pays off when investors and the overall economy face a severe crisis of
confidence. Our work also indicates that social capital, in addition to financial capital, can be an
important determinant of firm performance and highlights the circumstances under which CSR can be
beneficial for firm value.
Two caveats are in order. First, as with most empirical work, unobserved firm heterogeneity
could explain our findings, but the fact that our results survive the inclusion of a large battery of control
variables mitigates this concern. Second, in constructing our proxy for social capital at the firm level,
we rely on the prior literature suggesting a link between CSR and the formation of social capital.
However, there may be other channels through which firms can build social capital and increase trust.
Examining these channels and studying the relative efficacy of the CSR channel compared to other
channels would be a fruitful avenue for further work.

29
References
Almeida, H., M. Campello, B. Laranjeira, and S. Weisbenner, 2012, Corporate debt maturity and the
real effects of the 2007 credit crisis, Critical Finance Review 1.1, 3-58.
Arrow, K., 1972, Gifts and Exchanges, 1972, Philosophy and Public Affairs 1, 343–362.
Barber, B., J. Lyon, and C-L Tsai, 1999, Improved methods for tests of long-run abnormal stock
returns, Journal of Finance 54, 165-201.
Bebchuk, L., A. Cohen, and A. Ferrell, 2009, What matters in corporate governance, Review of
Financial Studies 22, 783-827.
Bénabou, R. and J. Tirole, 2010, Individual and corporate social responsibility, Economica 77, 1-19.
Carhart, M.M., 1997, On persistence in mutual fund performance, Journal of Finance 52, 57-82.
Carlin, B.I., F. Dorobantu, and S.Viswanathan, 2009, Public trust, the law, and financial investment,
Journal of Financial Economics 92, 321-341.
Cheng, I., H.G. Hong, and K. Shue, 2014, Do managers do good with other peoples’ money? Working
paper, Dartmouth College, Princeton University, and University of Chicago.
Coleman, J., 1988, Social Capital in the Creation of Human Capital, American Journal of Sociology 94
(Supplement), S95–S120.
Coleman, J., 1990, Foundations of Social Theory, Cambridge, Mass, Harvard University Press.
Daniel, K. and S. Titman, 1997, Evidence on the characteristics of cross-sectional variation in stock
returns, Journal of Finance 52, 1-33.
Deng, X., J. Kang and B. Low, 2013, Corporate social responsibility and stakeholder value
maximization: Evidence from mergers, Journal of Financial Economics 110, 87-109.
Dhaliwal, D.S., O.Z. Li, A. Tsang, and Y.G. Yang, 2011, Voluntary nonfinancial disclosure and the
cost of equity capital: The initiation of corporate social responsibility reporting, The Accounting
Review 86, 59-100.
Duchin, R., O. Ozbas, and B. Sensoy, 2010, Costly external finance, corporate investment, and the
subprime mortgage credit crisis, Journal of Financial Economics 97, 418-435.

30
Eccles, R., I. Ioannou, and G. Serafeim, 2014, The impact of a corporate sustainability on
organizational processes and performance, Management Science 60, 2835-2857.
Edmans, A., 2011, Does the stock market fully value intangibles? Employee satisfaction and equity
prices, Journal of Financial Economics 101, 621-640.
Erhard, W. and M. Jensen, 2014, Putting integrity into finance: a purely positive approach, Harvard
Business School Working Paper.
Erhard, W., M. Jensen and S. Zaffron, 2013, Integrity: a positive model that incorporates the normative
phenomena of morality, ethics, and legality, Harvard Business School Working Paper.
Fama, E., and K. French, 2008, Dissecting anomalies, Journal of Finance 63, 1653-1678.
Ferrell, A., H Liang, and L. Renneboog, 2014, Socially responsible firms, Working paper, Harvard
University and Tilburg University.
Fukuyama, F., 1995, Trust, New York, NY: Free Press.
Gao, F., L.L. Lisic, and I. Zhang, 2014, Commitment to social good and insider trading, Journal of
Accounting and Economics 57, 149-175.
Glaeser, E.L., D. Laibson, and B. Sacerdote, 2002, An economic approach to social capital, The
Economic Journal 112, F437-F458.
Godfrey, P.C., C.B. Merrill, and J.M. Hansen, 2009, The relationship between corporate social
responsibility and shareholder value: An empirical test of the risk management hypothesis, Strategic
Management Journal 30, 425-445.
Gouldner, A.W., 1960, The norm or reciprocity: A preliminary statement, American Sociological
Review 25, 161-178.
Goyal, A. and P. Santa-Clara, 2003, Idiosyncratic risk matters!, Journal of Finance 58, 975-1008.
Guiso, L., P. Sapienza and L. Zingales, 2004, The role of social capital in financial development,
American Economic Review 94, 526-556.
Guiso, L., P. Sapienza and L. Zingales, 2008, Trusting the stock market, Journal of Finance 63, 2557-
2600.
31
Guiso, L., P. Sapienza and L. Zingales, 2015, The value of corporate culture, Journal of Financial
Economics, forthcoming.
Gurria, A., 2009, Keynote Remarks by OECD Secretary-General Gurria delivered at 2009 BIAC
Business Roundtable, May 21, Lisbon, Portugal.
Harford, J., S. Klasa, and W. Maxwell, 2014, Refinancing risk and cash holdings, Journal of Finance
69, 975-1012.
Hong, H.G. and L. Kostovetsky, 2012, Red and blue investing: Values and finance, Journal of
Financial Economics 103, 1-19.
Hong, H.G. and I. Liskovich, 2014, Crime, punishment and the halo effect of corporate social
responsibility, Working paper, Princeton University.
Kim, Y., M.S. Park, and B. Wier, 2012, Is earnings quality associated with corporate social
responsibility?, The Accounting Review 87, 761-796.
Kitzmueller, M and J. Shimshack, 2012, Economic perspectives on corporate social responsibility,
Journal of Economics Literature 50, 51-84.
Knack, S and P. Keefer, 1997, Does social capital have an economic payoff? A cross-country
investigation, The Quarterly Journal of Economics 112, 1251-1288.
La Porta, R., F. Lopez-de-Silanes, A. Shleifer, and R.W. Vishny, 1997, Trust in large organizations,
American Economic Review Papers and Proceedings 87, 333-338.
Leana, C.R. and H.J. van Buren, III, 1999, Organizational social capital and employment practices, The
Academy of Management Review 24, 538-555.
Lin, 2001, Social Capital, Cambridge: Cambridge University Press.
Lins, K., P. Volpin and H. Wagner, 2013, Does family control matter? International evidence from the
2088-2009 financial crisis, Review of Financial Studies 26, 2583-2619.
Margolis, J.D., H.A. Elfenbein, and J.P. Walsh, 2009, Does it pay to be good … and does it matter? A
meta-analysis of the relationship between corporate social and financial performance, Working paper,
Harvard University, Washington University in St Louis, and University of Michigan.
Nguyen, T., H.G. Nguyen, and X. Yin, 2015, Corporate governance and corporate financing and
investment during the 2007 – 2008 financial crisis, Financial Management, forthcoming.
32
Minor, D.B., 2013, The value of corporate citizenship: Protection, Working paper, Northwestern
University.
OECD, 2007, Human capital: How what you know shapes your life.
Porter, M. and M. Kramer, 2006, Strategy and society: The link between competitive advantage and
corporate social responsibility, Harvard Business Review, December, 78-93.
Porter, M. and M. Kramer, 2011, Creating shared value, Harvard Business Review, January, 1-17.
PricewaterhouseCoopers, 2013, 16th
CEO Survey, http://www.pwc.com/gx/en/ceo-survey/2013/.
PricewaterhouseCoopers, 2014, 17th
CEO Survey, http://www.pwc.com/gx/en/ceo-survey/2014/.
Putnam, R., 1993, Making democracy work: Civic traditions in modern Italy, Princeton, New Jersey:
Princeton University Press.
Sacconi L. and G. DegliAntoni, 2011, Social capital, corporate responsibility, economic behaviour and
performance, New York, NY: Palgrave MacMillan.
Sapienza, P., A. Toldra-Simats, and L. Zingales, 2013, Understanding trust, The Economic Journal
123, 1313-1332.
Servaes, H. and A. Tamayo, 2013, The impact of corporate social responsibility on the value of the
firm: the role of customer awareness, Management Science 59, 1045-1061.

33
Table 1
Descriptive Statistics
The sample consists of 1841 firms with CSR data available from the MSCI ESG STATS database. CSR is the
total net (strengths minus concerns) CSR score computed using five stakeholder-oriented categories
(environment, employees, human rights, community and diversity). To compute the total net CSR measure, we
first compute the net CSR index within each of the categories. The net CSR index for each category is computed
by taking the number of strengths identified for a given firm and dividing this by the maximum possible
strengths in that category, and then subtracting the number of concerns identified for the firm divided by the
maximum possible concerns; the net CSR score for each category ranges from -1 to +1. The total net CSR
measure, CSR, is then computed as the sum of the net CSR indices for the five categories; it ranges from -5 to
+5. CSR ratings are measured at the end of 2007. Crisis period return is the raw return computed over the
period August 2008 – March 2009. Accounting data are based on the last quarter ending at or before the end of
2007. Long-term debt is computed as long-term debt divided by assets. Short-term debt is computed as debt in
current liabilities divided by assets. Cash holdings is computed as cash and marketable securities divided by
assets. Profitability is computed as operating income divided by assets. Book-to-market is computed as book
value of equity divided by market value of equity. Momentum is the raw return over the period August 2007 to
July 2008. Beta is the market model beta estimated over the five-year period starting in August 2003 using
monthly data. FF Beta, SMB loading, HML loading, and Momentum loading are factor loadings obtained from
estimating the four-factor model over the five-year period starting in August 2003, using monthly data and factor
returns obtained from Kenneth French’s website. Idiosyncratic risk is computed as the residual variance from
the market model estimated over the five-year period starting in August 2003, using monthly data. Financial
firms and micro-cap firms, which we define as firms with market capitalization below $250 million, are removed
from the sample. The control variables are winsorized at the 1st and 99
th percentiles, as are the returns.
Panel A: Summary Statistics
Mean
Standard
deviation
25th
perc.
Median
75th
perc.
CSR -0.176 0.392 -0.376 -0.200 0.020
Crisis period return -0.397 0.290 -0.612 -0.411 -0.215
Market capitalization 6922 23941 598 1327 4010
Long-term debt 0.199 0.200 0.009 0.167 0.308
Short-term debt 0.028 0.054 0 0.005 0.031
Cash holdings 0.181 0.210 0.028 0.094 0.256
Profitability 0.033 0.037 0.020 0.033 0.049
Book-to-market 0.422 0.298 0.222 0.363 0.569
Momentum -0.087 0.377 -0.335 -0.116 0.112
Beta 1.34 0.69 0.85 1.26 1.72
FF beta 1.11 0.70 0.70 1.11 1.56
SMB loading 0.74 1.06 0.02 0.61 1.37
HML loading 0.06 1.13 -0.48 0.10 0.69
Momentum loading 0.03 0.71 -0.39 -0.01 0.39
Idiosyncratic risk 0.012 0.011 0.005 0.009 0.015

34
Table 1 (continued)
Panel B: Correlation Matrix
CSR
Crisis
return
Ln(mkt
cap)
L/T
debt
S/T
debt
Cash
hold.
Profit. B/M Mom. Beta FF beta SMB
load.
HML
load.
Mom
load.
Crisis return 0.11
Ln(mkt cap) 0.18 0.08
Long-term debt -0.07 -0.11 0.05
Short-term debt 0.06 -0.01 0.11 0.01
Cash holdings 0.05 0.11 -0.22 -0.35 -0.13
Profitability 0.06 0.04 0.24 0.00 -0.01 -0.35
Book-to-market -0.09 -0.08 -0.19 -0.11 0.02 -0.23 -0.14
Momentum -0.07 -0.04 0.14 -0.07 -0.01 -0.04 0.13 -0.20
Beta -0.06 -0.13 -0.20 -0.08 -0.09 0.27 -0.12 -0.05 -0.31
FF beta -0.07 -0.15 -0.08 -0.02 -0.07 0.15 -0.07 -0.08 -0.27 0.91
SMB loading -0.03 0.03 -0.37 -0.11 -0.06 0.27 -0.17 0.09 -0.11 0.21 -0.12
HML loading -0.11 -0.11 -0.07 0.12 0.01 -0.27 -0.04 0.25 0.01 -0.14 0.02 -0.18
Momentum load. -0.09 -0.20 0.08 -0.04 -0.09 -0.08 0.13 -0.10 0.36 0.08 0.26 -0.34 0.27
Idiosyncratic risk -0.12 -0.11 -0.39 -0.06 -0.10 0.41 -0.31 -0.14 -0.08 0.40 0.30 0.32 -0.07 0.02

35
Table 2
Crisis Period Returns and CSR
This table presents the regression estimates of crisis period returns, measured as a firm’s raw buy and hold return
over the August 2008 to March 2009 period, on the CSR variable of interest and controls. In Panel A, we use a
linear measure of CSR, CSR, which is the net (strengths minus concerns) CSR score computed using five
stakeholder-oriented categories. In Panel B, we use 0/1 dummy variables for CSR quartiles such that: CSR1
takes the value of 1 if the firm is in the lowest CSR quartile and 0 otherwise; CSR2 takes the value of 1 if the
firm is in the second lowest CSR quartile and 0 otherwise; etc. For each firm, CSR ratings are measured as of
year-end 2007. Beta is computed using the market model over the 60-month period prior to August 2008. FF
beta, SMB factor loading, HML factor loading and Momentum factor loading are computed by regressing excess
returns on the market, SMB, HML and momentum factors over the 60 months prior to August 2008. See Table
1 for a further description of these variables. Industry dummies are defined at the two-digit SIC code. Financial
firms and micro-cap firms with market capitalization below $250 million are removed from the sample. The
control variables and returns are winsorized at the 1st and 99
th percentiles. Heteroscedasticity consistent standard
errors are presented in parentheses. ***
, **
, * indicate that the parameter estimate is significantly different from
zero at the 1%, 5%, or 10% level, respectively.
Panel A: Net CSR score
(i) (ii) (iii) (iv)
Constant -0.317***
-0.317***
-0.325***
-0.359***
(0.014) (0.015) (0.015) (0.075)
CSR 0.073***
0.063***
0.055***
0.053***
(0.016) (0.016) (0.016) (0.015)
Beta -0.050***
(0.010)
FF beta -0.057***
-0.042***
-0.023*
(0.011) (0.010) (0.010)
SMB factor loading -0.000 -0.013* -0.009
(0.007) (0.007) (0.008)
HML factor loading -0.024***
-0.015**
-0.008
(0.007) (0.006) (0.007)
Momentum factor loading -0.068***
-0.042***
(0.011) (0.014)
Industry dummies No No No Yes
N 1841 1841 1841 1841
Adj. r-squared 0.02 0.04 0.06 0.15

36
Table 2 (continued)
Panel B: Dummies for quartiles of net CSR score
(i) (ii) (iii) (iv)
CSR 1 (low) -0.366***
-0.360***
-0.363***
-0.345***
(0.020) (0.020) (0.019) (0.057)
CSR 2 -0.337***
-0.333***
-0.338***
-0.317***
(0.020) (0.020) (0.020) (0.055)
CSR 3 -0.327***
-0.325***
-0.335***
-0.323***
(0.019) (0.018) (0.018) (0.055)
CSR 4 -0.290***
-0.293***
-0.303***
-0.292***
(0.018) (0.018) (0.017) (0.055)
Beta -0.050***
(0.011)
FF beta -0.057***
-0.042***
-0.023**
(0.011) (0.011) (0.011)
SMB factor loading 0.000 -0.013* -0.010
(0.007) (0.007) (0.008)
HML factor loading -0.024***
-0.016**
-0.008
(0.007) (0.007) (0.007)
Momentum factor loading -0.068***
-0.043***
(0.011) (0.014)
Industry dummies No No No Yes
CSR4−CSR1 0.076***
0.067***
0.060***
0.053***
p-value (0.00) (0.00) (0.00) (0.00)
N 1841 1841 1841 1841
Adj. r-squared 0.02 0.04 0.06 0.15

37
Table 3
Crisis Period Returns and CSR: Controlling for Firm Characteristics
This table presents the regression estimates of crisis period returns, measured as a firm’s raw buy and hold
return over the August 2008 to March 2009 period, on the CSR variable of interest and control variables. In
Panel A, we use a linear measure of CSR, CSR, which is the net (strengths minus concerns) CSR score
computed using five stakeholder-oriented categories. In Panel B, we use 0/1 dummy variables for CSR
quartiles such that: CSR1 takes the value of 1 if the firm is in the lowest CSR quartile and 0 otherwise; CSR2
takes the value of 1 if the firm is in the second lowest CSR quartile and 0 otherwise; etc. For each firm, CSR
ratings are measured as of year-end 2007. All control variables are as defined in Table 1. Industry dummies
are defined at the two-digit SIC code level. Financial firms and micro-cap firms with market capitalization
below $250 million are removed from the sample. The control variables and returns are winsorized at the 1st
and 99th percentiles. Heteroscedasticity consistent standard errors are presented in parentheses.
***,
**,
*
indicate that the parameter estimate is significantly different from zero at the 1%, 5%, or 10% level,
respectively.

38
Table 3 (continued)
Panel A: Net CSR score
(i) (ii) (iii) (iv)
CSR 0.039**
0.044***
0.044***
0.039***
(0.017) (0.016) (0.017) (0.016)
Ln(Market cap) 0.004 0.014**
0.013**
0.006
(0.005) (0.005) (0.005) (0.005)
Long-term debt -0.109***
-0.075* -0.085
** -0.119
***
(0.038) (0.044) (0.044) (0.044)
Short-term debt -0.335***
-0.313***
-0.238***
-0.355***
(0.123) (0.112) (0.114) (0.113)
Cash holdings 0.182***
0.182***
0.182***
0.165***
(0.042) (0.043) (0.043) (0.045)
Profitability 0.510***
0.687***
0.758***
0.533**
(0.203) (0.222) (0.221) (0.233)
Book-to-market -0.085***
-0.094***
(0.026) (0.030)
Momentum -0.056***
-0.032
(0.020) (0.023)
Beta -0.033***
(0.011)
Idiosyncratic risk -2.283***
-2.466***
(0.708) (0.864)
FF beta -0.033***
-0.023**
-0.020
(0.011) (0.012) (0.013)
SMB factor loading -0.000 -0.007 0.000
(0.008) (0.009) (0.009)
HML factor loading 0.005 0.001 0.004
(0.007) (0.007) (0.007)
Momentum factor loading -0.049***
-0.047***
(0.013) (0.014)
Industry dummies Yes Yes Yes Yes
N 1841 1841 1841 1841
Adj. r-squared 0.18 0.17 0.18 0.18
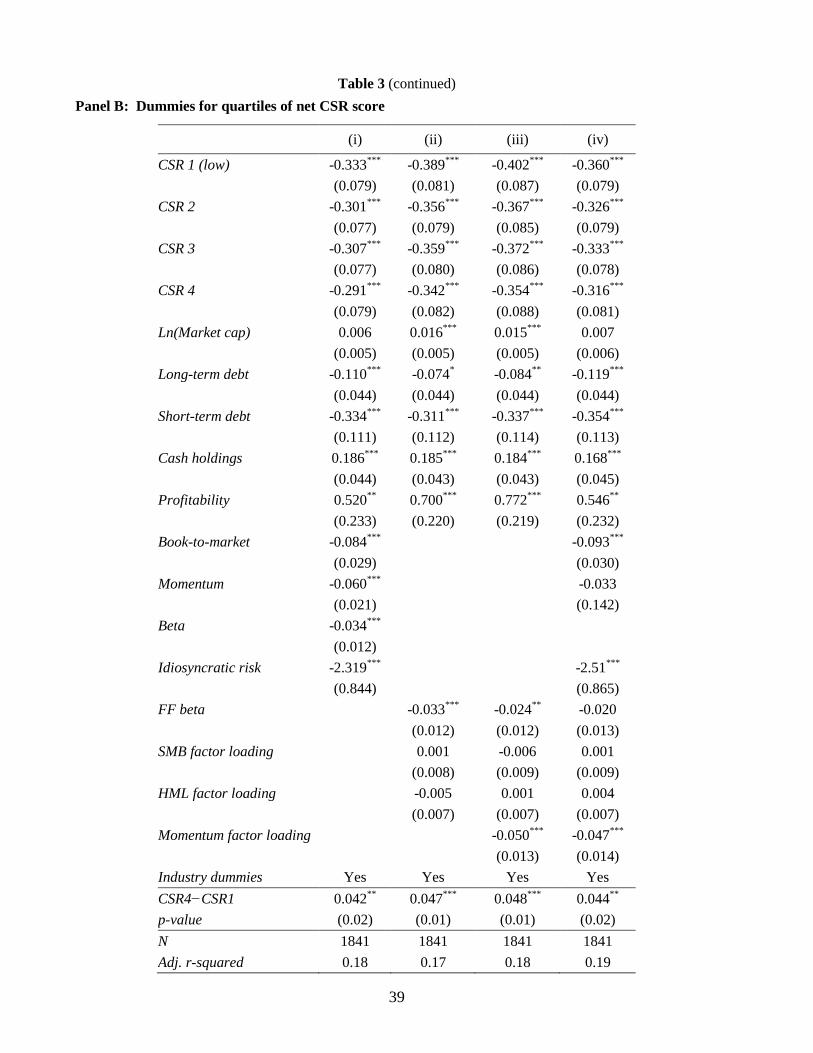
39
Table 3 (continued)
Panel B: Dummies for quartiles of net CSR score
(i) (ii) (iii) (iv)
CSR 1 (low) -0.333***
-0.389***
-0.402***
-0.360***
(0.079) (0.081) (0.087) (0.079)
CSR 2 -0.301***
-0.356***
-0.367***
-0.326***
(0.077) (0.079) (0.085) (0.079)
CSR 3 -0.307***
-0.359***
-0.372***
-0.333***
(0.077) (0.080) (0.086) (0.078)
CSR 4 -0.291***
-0.342***
-0.354***
-0.316***
(0.079) (0.082) (0.088) (0.081)
Ln(Market cap) 0.006 0.016***
0.015***
0.007
(0.005) (0.005) (0.005) (0.006)
Long-term debt -0.110***
-0.074* -0.084
** -0.119
***
(0.044) (0.044) (0.044) (0.044)
Short-term debt -0.334***
-0.311***
-0.337***
-0.354***
(0.111) (0.112) (0.114) (0.113)
Cash holdings 0.186***
0.185***
0.184***
0.168***
(0.044) (0.043) (0.043) (0.045)
Profitability 0.520**
0.700***
0.772***
0.546**
(0.233) (0.220) (0.219) (0.232)
Book-to-market -0.084***
-0.093***
(0.029) (0.030)
Momentum -0.060***
-0.033
(0.021) (0.142)
Beta -0.034***
(0.012)
Idiosyncratic risk -2.319***
-2.51***
(0.844) (0.865)
FF beta -0.033***
-0.024**
-0.020
(0.012) (0.012) (0.013)
SMB factor loading 0.001 -0.006 0.001
(0.008) (0.009) (0.009)
HML factor loading -0.005 0.001 0.004
(0.007) (0.007) (0.007)
Momentum factor loading -0.050***
-0.047***
(0.013) (0.014)
Industry dummies Yes Yes Yes Yes
CSR4−CSR1 0.042**
0.047***
0.048***
0.044**
p-value (0.02) (0.01) (0.01) (0.02)
N 1841 1841 1841 1841
Adj. r-squared 0.18 0.17 0.18 0.19

40
Table 4
Crisis Period Returns and CSR: Robustness Tests
This table presents regression estimates of crisis period returns on the CSR variable and controls. In model
(i), CSR is measured as of year-end 2006 while in model (ii) it is measured as of year-end 2008. Crisis
period returns are measured as a firm’s raw buy and hold return over the August 2008 to March 2009 period.
Financial firms and micro-cap firms with market capitalization below $250 million are removed from the
sample in models (i) and (ii). Model (iii) includes firms smaller than $250 million. CSR and all control
variables are defined in Table 1. Industry dummies are defined at the two-digit SIC code level. The control
variables and returns are winsorized at the 1st and 99
th percentiles. Heteroscedasticity consistent standard
errors are presented in parentheses. ***
, **
, * indicate that the parameter estimate is significantly different
from zero at the 1%, 5%, or 10% level, respectively.
(i) (ii) (iii)
CSR 2006 CSR 2008
With micro-
cap firms
CSR 0.048***
0.039***
0.030**
(0.017) (0.015) (0.016)
Ln(Market cap) 0.001 0.006 0.009
(0.006) (0.005) (0.005)
Long-term debt -0.117***
-0.145***
-0.132***
(0.045) (0.043) (0.042) ***
Short-term debt -0.320***
-0.323***
-0.344***
(0.113) (0.114) (0.107)
Cash holdings 0.175***
0.116***
0.177***
(0.047) (0.045) (0.043)
Profitability 0.532**
0.399* 0.684
***
(0.260) (0.21) (0.211)
Book-to-market -0.115***
-0.119***
-0.0923***
(0.030) (0.029) (0.026)
Momentum -0.030 -0.045**
-0.027
(0.024) (0.021) (0.021)
Idiosyncratic risk -3.160***
-2.340***
-2.778***
(0.873) (0.776) (0.786)
FF beta -0.022 -0.023* -0.012
(0.014) (0.013) (0.013)
SMB factor loading -0.003 0.003 0.000
(0.078) (0.008) (0.008)
HML factor loading 0.003 0.002 0.003
(0.008) (0.007) (0.007)
Momentum factor loading -0.044***
-0.038***
-0.044***
(0.015) (0.013) (0.013)
Industry dummies Yes Yes Yes
N 1671 1812 1986
Adj. r-squared 0.20 0.20 0.19
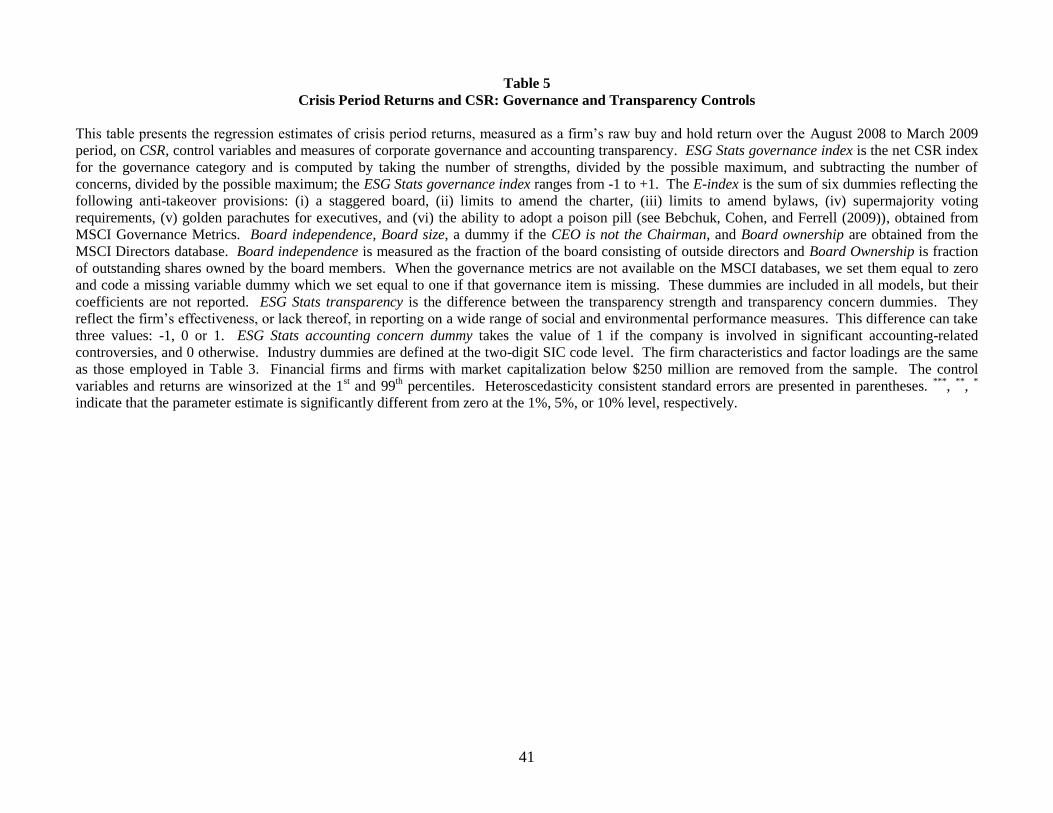
41
Table 5
Crisis Period Returns and CSR: Governance and Transparency Controls
This table presents the regression estimates of crisis period returns, measured as a firm’s raw buy and hold return over the August 2008 to March 2009
period, on CSR, control variables and measures of corporate governance and accounting transparency. ESG Stats governance index is the net CSR index
for the governance category and is computed by taking the number of strengths, divided by the possible maximum, and subtracting the number of
concerns, divided by the possible maximum; the ESG Stats governance index ranges from -1 to +1. The E-index is the sum of six dummies reflecting the
following anti-takeover provisions: (i) a staggered board, (ii) limits to amend the charter, (iii) limits to amend bylaws, (iv) supermajority voting
requirements, (v) golden parachutes for executives, and (vi) the ability to adopt a poison pill (see Bebchuk, Cohen, and Ferrell (2009)), obtained from
MSCI Governance Metrics. Board independence, Board size, a dummy if the CEO is not the Chairman, and Board ownership are obtained from the
MSCI Directors database. Board independence is measured as the fraction of the board consisting of outside directors and Board Ownership is fraction
of outstanding shares owned by the board members. When the governance metrics are not available on the MSCI databases, we set them equal to zero
and code a missing variable dummy which we set equal to one if that governance item is missing. These dummies are included in all models, but their
coefficients are not reported. ESG Stats transparency is the difference between the transparency strength and transparency concern dummies. They
reflect the firm’s effectiveness, or lack thereof, in reporting on a wide range of social and environmental performance measures. This difference can take
three values: -1, 0 or 1. ESG Stats accounting concern dummy takes the value of 1 if the company is involved in significant accounting-related
controversies, and 0 otherwise. Industry dummies are defined at the two-digit SIC code level. The firm characteristics and factor loadings are the same
as those employed in Table 3. Financial firms and firms with market capitalization below $250 million are removed from the sample. The control
variables and returns are winsorized at the 1st and 99
th percentiles. Heteroscedasticity consistent standard errors are presented in parentheses.
***,
**,
*
indicate that the parameter estimate is significantly different from zero at the 1%, 5%, or 10% level, respectively.

42
Table 5 (continued)
(i) (ii) (iii) (iv) (v) (vi) (vii) (viii)
CSR 0.054***
0.040***
0.050***
0.039***
0.054***
0.039***
0.054***
0.039**
(0.015) (0.016) (0.016) (0.016) (0.016) (0.016) (0.016) (0.016)
ESG Stats governance index -0.011 -0.012
(0.054) (0.055)
E-index -0.012**
-0.009*
(0.005) (0.005)
Board independence -0.081 -0.077
(0.073) (0.072)
Board size -0.001 0.001
(0.003) (0.004)
CEO is not Chair -0.013 -0.012
(0.016) (0.015)
Board ownership -0.027 -0.026
(0.075) (0.075)
ESG Stats transparency 0.042 -0.001
(0.138) (0.134)
ESG Stats accounting concern -0.022 -0.031
(0.027) (0.027)
Four-factor loadings Yes Yes Yes Yes Yes Yes Yes Yes
Firm characteristics No Yes No Yes No Yes No Yes
Industry dummies Yes Yes Yes Yes Yes Yes Yes Yes
N 1841 1841 1841 1841 1841 1841 1841 1841
Adj. r-squared 0.15 0.19 0.16 0.19 0.15 0.19 0.15 0.19
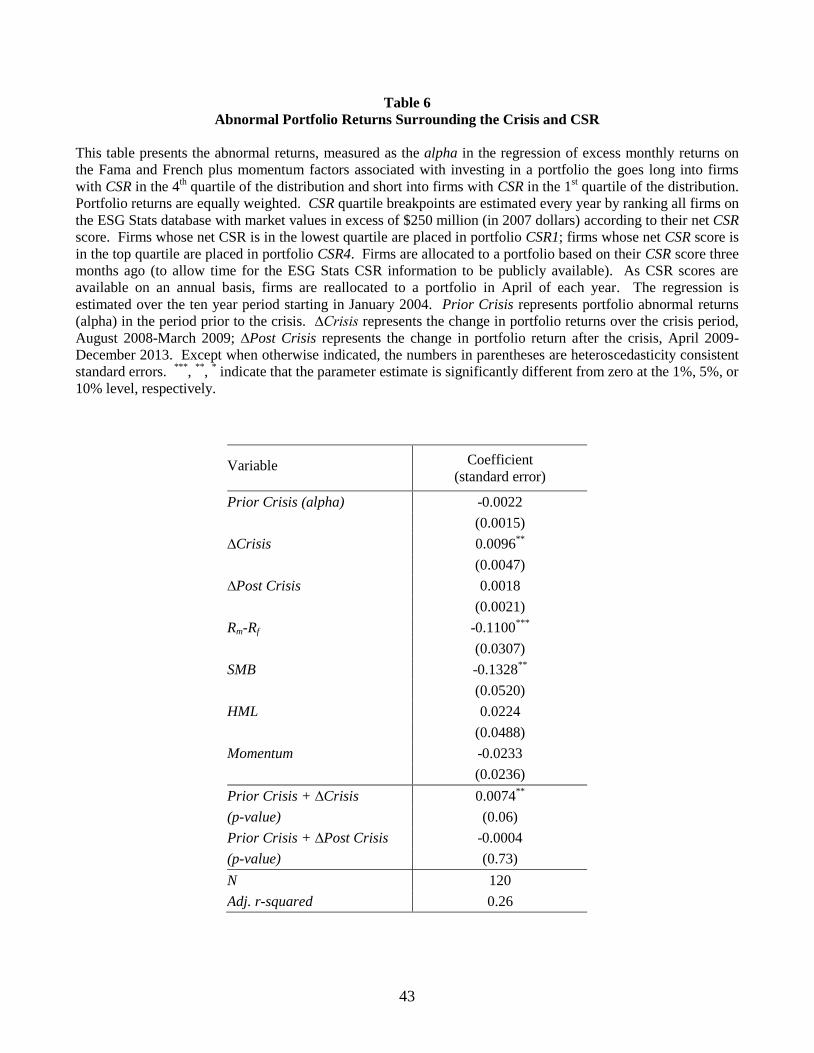
43
Table 6
Abnormal Portfolio Returns Surrounding the Crisis and CSR
This table presents the abnormal returns, measured as the alpha in the regression of excess monthly returns on
the Fama and French plus momentum factors associated with investing in a portfolio the goes long into firms
with CSR in the 4th quartile of the distribution and short into firms with CSR in the 1
st quartile of the distribution.
Portfolio returns are equally weighted. CSR quartile breakpoints are estimated every year by ranking all firms on
the ESG Stats database with market values in excess of $250 million (in 2007 dollars) according to their net CSR
score. Firms whose net CSR is in the lowest quartile are placed in portfolio CSR1; firms whose net CSR score is
in the top quartile are placed in portfolio CSR4. Firms are allocated to a portfolio based on their CSR score three
months ago (to allow time for the ESG Stats CSR information to be publicly available). As CSR scores are
available on an annual basis, firms are reallocated to a portfolio in April of each year. The regression is
estimated over the ten year period starting in January 2004. Prior Crisis represents portfolio abnormal returns
(alpha) in the period prior to the crisis. ∆Crisis represents the change in portfolio returns over the crisis period,
August 2008-March 2009; ∆Post Crisis represents the change in portfolio return after the crisis, April 2009-
December 2013. Except when otherwise indicated, the numbers in parentheses are heteroscedasticity consistent
standard errors. ***
, **
, * indicate that the parameter estimate is significantly different from zero at the 1%, 5%, or
10% level, respectively.
Variable
Coefficient
(standard error)
Prior Crisis (alpha) -0.0022
(0.0015)
∆Crisis 0.0096**
(0.0047)
∆Post Crisis 0.0018
(0.0021)
Rm-Rf -0.1100***
(0.0307)
SMB -0.1328**
(0.0520)
HML 0.0224
(0.0488)
Momentum -0.0233
(0.0236)
Prior Crisis + ∆Crisis 0.0074**
(p-value) (0.06)
Prior Crisis + ∆Post Crisis -0.0004
(p-value) (0.73)
N 120
Adj. r-squared 0.26
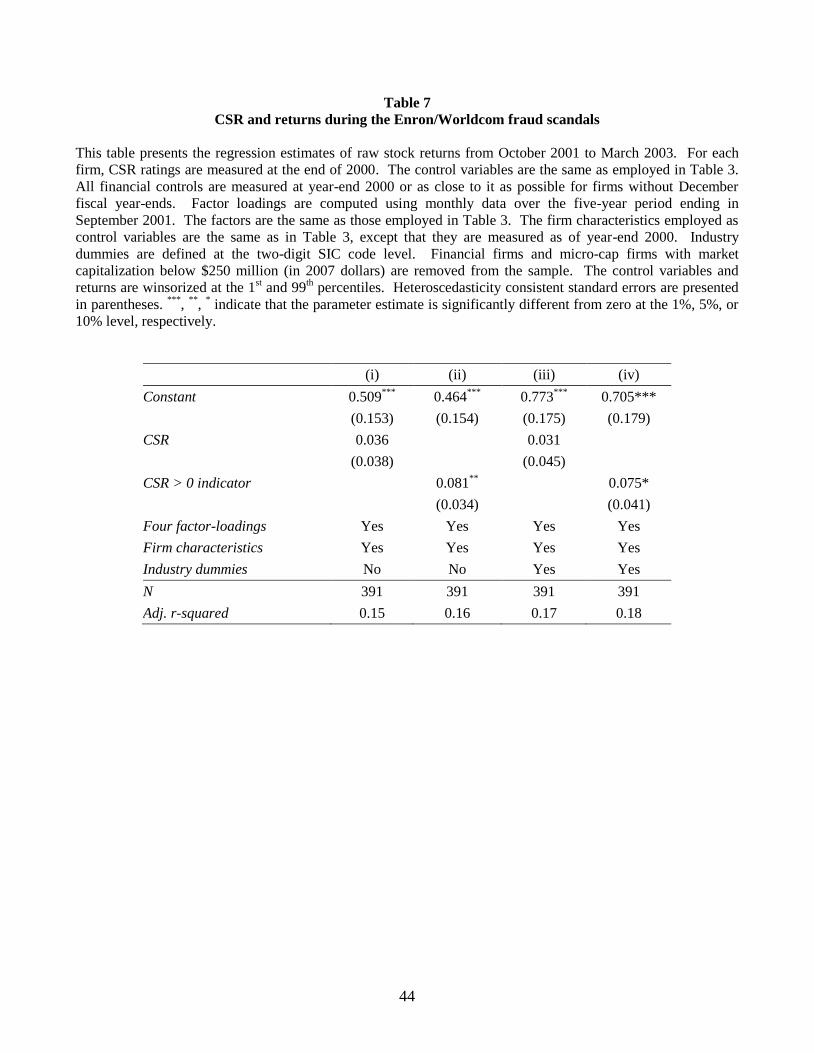
44
Table 7
CSR and returns during the Enron/Worldcom fraud scandals
This table presents the regression estimates of raw stock returns from October 2001 to March 2003. For each
firm, CSR ratings are measured at the end of 2000. The control variables are the same as employed in Table 3.
All financial controls are measured at year-end 2000 or as close to it as possible for firms without December
fiscal year-ends. Factor loadings are computed using monthly data over the five-year period ending in
September 2001. The factors are the same as those employed in Table 3. The firm characteristics employed as
control variables are the same as in Table 3, except that they are measured as of year-end 2000. Industry
dummies are defined at the two-digit SIC code level. Financial firms and micro-cap firms with market
capitalization below $250 million (in 2007 dollars) are removed from the sample. The control variables and
returns are winsorized at the 1st and 99
th percentiles. Heteroscedasticity consistent standard errors are presented
in parentheses. ***
, **
, * indicate that the parameter estimate is significantly different from zero at the 1%, 5%, or
10% level, respectively.
(i) (ii) (iii) (iv)
Constant 0.509***
0.464***
0.773***
0.705***
(0.153) (0.154) (0.175) (0.179)
CSR 0.036 0.031
(0.038) (0.045)
CSR > 0 indicator 0.081**
0.075*
(0.034) (0.041)
Four factor-loadings Yes Yes Yes Yes
Firm characteristics Yes Yes Yes Yes
Industry dummies No No Yes Yes
N 391 391 391 391
Adj. r-squared 0.15 0.16 0.17 0.18
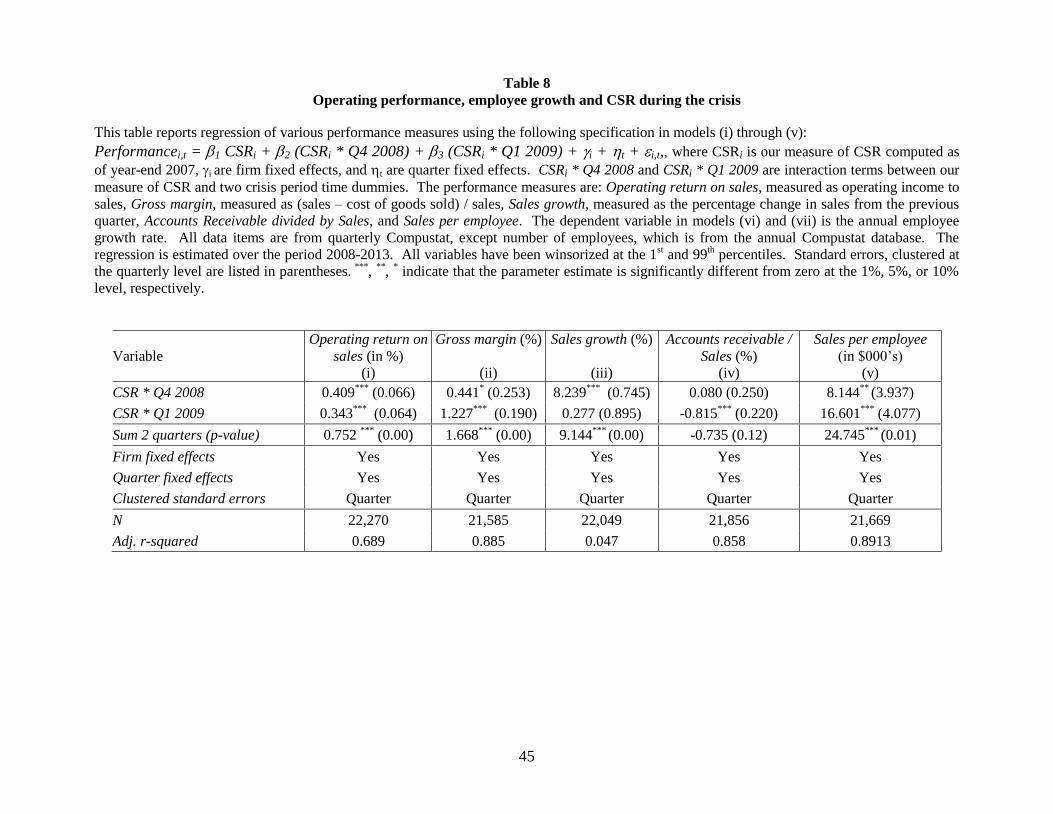
45
Table 8
Operating performance, employee growth and CSR during the crisis
This table reports regression of various performance measures using the following specification in models (i) through (v):
Performancei,t = 1 CSRi + 2 (CSRi * Q4 2008) + 3 (CSRi * Q1 2009) + i + t + i,t,, where CSRi is our measure of CSR computed as
of year-end 2007, i are firm fixed effects, and t are quarter fixed effects. CSRi * Q4 2008 and CSRi * Q1 2009 are interaction terms between our
measure of CSR and two crisis period time dummies. The performance measures are: Operating return on sales, measured as operating income to
sales, Gross margin, measured as (sales – cost of goods sold) / sales, Sales growth, measured as the percentage change in sales from the previous
quarter, Accounts Receivable divided by Sales, and Sales per employee. The dependent variable in models (vi) and (vii) is the annual employee
growth rate. All data items are from quarterly Compustat, except number of employees, which is from the annual Compustat database. The
regression is estimated over the period 2008-2013. All variables have been winsorized at the 1st and 99
th percentiles. Standard errors, clustered at
the quarterly level are listed in parentheses. ***
, **
, * indicate that the parameter estimate is significantly different from zero at the 1%, 5%, or 10%
level, respectively.
Variable
Operating return on
sales (in %)
(i)
Gross margin (%)
(ii)
Sales growth (%)
(iii)
Accounts receivable /
Sales (%)
(iv)
Sales per employee
(in $000’s)
(v)
CSR * Q4 2008 0.409***
(0.066) 0.441* (0.253) 8.239
*** (0.745) 0.080 (0.250) 8.144
** (3.937)
CSR * Q1 2009 0.343***
(0.064) 1.227***
(0.190) 0.277 (0.895) -0.815***
(0.220) 16.601***
(4.077)
Sum 2 quarters (p-value) 0.752 ***
(0.00) 1.668***
(0.00) 9.144***
(0.00) -0.735 (0.12) 24.745***
(0.01)
Firm fixed effects Yes Yes Yes Yes Yes
Quarter fixed effects Yes Yes Yes Yes Yes
Clustered standard errors Quarter Quarter Quarter Quarter Quarter
N 22,270 21,585 22,049 21,856 21,669
Adj. r-squared 0.689 0.885 0.047 0.858 0.8913

46
Table 8 (continued)
Variable
Employee growth
(vi)
Employee growth ( -50%
to +100% range)
(vii)
CSR * 2008 -1.306 (1.630) -0.578 (0.323)
CSR * 2009 2.920 (1.645) 2.411***
(0.371)
Sum 2 years (p-value) 1.614 (0.64) 1.833**
(0.03)
Firm fixed effects Yes Yes
Year fixed effects Yes Yes
Clustered standard errors Year Year
N 5,343 5,250
Adj. r-squared 0.126 0.172