social capital in greater cincinnati - home, home · social trust, the core of social capital,...
TRANSCRIPT

Building on Trust, Reciprocity, and Cooperation
Social Capital in Greater Cincinnati


Social Capital in Greater Cincinnati
Building on Trust, Reciprocity, and Cooperation
Report prepared for:
Report prepared by:
Alfred J. Tuchfarber, PhD Mark A. Carrozza, MA Thomas C. Shaw, PhD


Table of Contents
Introduction .....................................................................6 Executive Summary..........................................................8 The Social Capital Survey .................................................10 Forms of Social Capital.....................................................11 Defining Social Capital......................................................13 Defining Dimensions of Social Capital ...............................14
Social Trust ..............................................................16 Inter-Racial Trust ......................................................18 Diversity of Friendships ............................................20 Conventional Politics ................................................22 Protest Politics..........................................................24 Civic Leadership.......................................................26 Associational Involvement ........................................28 Informal Socializing ..................................................30 Giving and Volunteering ...........................................32 Faith-Based Engagement...........................................34
Strategies for Building Social Capital .................................36 Methodology ....................................................................40
5

Introduction In 2000, Harvard University Professor Robert D. Putnam published a book called Bowling Alone: The Collapse and Revival of American Community. His work has resonated deeply with civic leaders all across the country who share Dr. Putnam’s concern about the loss of social capital in communities just like Greater Cincinnati. A fundamental cornerstone of democracy – the right to participate, the urge to associ-ate, and the trust and reciprocity that fuel these basic civic instincts – has deteriorated significantly during the last half of the 20th century. (We encourage you to learn more about Dr. Putnam’s work by contacting www.bowlingalone.com.) Even before Bowling Alone was released, however, the urgency revealed in Putnam’s research prompted him to assemble a group of leaders to help develop solutions. The diverse membership of the “Saguaro Seminar: Civic Engagement in American” at Harvard’s JFK School of Government spent nearly two years seeking out various ways in which arts, religious, business, government and youth serving institutions could leverage their assets to fortify social capital in American. (We encourage you to learn more about the recommendations developed by the Saguaro Seminar in a report called “Better Together” by contacting www.bettertogether.com.) One of the group’s most significant ideas was to conduct a national study devoted to measuring social capital, and thus to provide a 21st cen-tury baseline of information from which the fate of civic engagement could be measured in the future. The Greater Cincinnati Foundation (GCF) joined 35 other community foundations as local sponsors of a study that included 30,000 respondents nation-wide. One thousand (1,000) people were surveyed in the tri-state Greater Cincinnati Region. GCF chose the University of Cincinnati’s Institute for Policy Re-search as its academic partner to analyze local results and to prepare this report for the community. Preliminary results of the “Social Capital Community Benchmark Survey” were released nationally on March 1, 2001. Study results were grouped into ten indexes measuring the connections, trust and reciprocity that define social capital. The raw survey data are available in the public domain at the University of Connecticut’s Roper Center (www.ropercenter.uconn.edu) and summary information about the project is hosted by the Community Foundation Silicon Valley (www.cfsv.org).
6

Introduction As is typically the case in the many surveys conducted by the UC’s Institute for Policy Research, Greater Cincinnati’s survey results reveal a portrait of an “average” community. In simplest terms, our community’s social capital is not better, but no worse, than the “norm” for com-munities across America. This more detailed analysis of the survey data examines the ten social capital indexes for Greater Cincinnati, seek-ing to highlight differences in social capital according to dimensions of age, gender, race, place of residence, educational attainment, and/or income level. What is important to remember as you read this report is that these study results do not measure the past, predict the future or reveal solu-tions. Thy only provide a portrait, or benchmark, of today’s situation. The benchmark begins at a point in time where social capital – civic engagement – has declined everywhere in America, including Greater Cincinnati. We should take no comfort from being “average” or “the norm.” We should neither rest on the laurels of our civic traditions nor be alarmed by the study findings. Rather, the information in this re-port can help us illuminate our strengths and flag the weaknesses we need to address. Our charge for the future is to be “better together.” We are eager to share these study results and to work with our community toward the ambitious goal of strengthening social capital in Greater Cincinnati. A task force of leading nonprofit institutions is aligned toward this pur-pose. In the coming months and years, we hope to add our efforts to the many other good works that are already under way in this commu-nity. On behalf of the Greater Cincinnati Foundation, we thank Al Tuchfarber and his staff for this report and hope that you will find it useful in your own work.
Kathryn E. Merchant President/CEO The Greater Cincinnati Foundation
7

Executive Summary The Greater Cincinnati Social Capital study is part of a national study to measure and enhance social capital in our nation and community. Social capital is the network of social ties or associations an individual acquires and the levels of trustworthiness and reciprocity that exist across those connections. The reason the Greater Cincinnati Foundation funded participation in this study was to help our community to become “better together,” armed with more information about our strengths and weaknesses in the area of social capital. The Greater Cincinnati Social Capital study consisted of a telephone survey of the seven “core” counties that abut Hamilton County, Ohio as well as Hamilton County. One thousand and one (1001) randomly selected Greater Cincinnatians were interviewed. The major findings of the study include:
• Social Trust, the most general measure of social capital is highest among:
o Suburban residents of the region o Women o Senior citizens o Highly educated individuals o Higher income individuals o Whites
8

Executive Summary
By contrast, it is lowest among:
o Residents of the City of Cincinnati o Men o Young adults o African Americans o Those with less than a high school education o Low income individuals
• Inter-Racial Trust is lower among African-Americans than among whites. • Those with college educations are much more likely to have diverse friends than those with low education levels.
• Males, higher income and higher education individuals are more likely to engage in Protest Politics. African-Americans and whites do not differ widely in political protest activities.
• White and African-Americans have similar levels of Faith-Based Engagement. Older people and higher educated people are more likely to be involved in Faith-Based activities.
• Social capital in Greater Cincinnati appears to be more broadly spread among various racial, ethnic and social groups than is true in many American communities.
• There are thousands of ways that individuals and groups can increase the amount of social capital our community possesses.
9

The Social Capital Survey Social Capital Community Benchmark Survey
• Largest scientific investigation of civic engagement ever conducted in America.
o Conducted in forty communities plus a national sample.
o Nearly 30,000 completed surveys.
• Sponsored nationally by Professor Robert D Putnam and The Saguaro Seminar: Civic Engagement in America of the John F Ken-nedy School of Government at Harvard University.
Cincinnati�s Social Capital Survey
• Sponsored locally by The Greater Cincinnati Foundation, in partnership with the Institute for Policy Research at the University of Cincinnati.
• 1001 completed interviews with a representative sample of the region.
• Eight-county area in Ohio (Butler, Clermont, Hamilton, and Warren counties), Kentucky (Boone, Campbell, and Kenton counties),
and Indiana (Dearborn County).
10

Forms of Capital Capital comes in many forms including economic, physical, human, and social. Accrual of capital makes it possible for actors to achieve cer-tain ends. The most direct form of capital is economic, with direct exchange of monies for goods and services.
Economic Capital Economic capital is accumulated wealth in the form of cash, stocks, etc.
Physical Capital Physical capital is material assets such as buildings, equipment, tools, and vehicles.
Human Capital Human capital is the knowledge, skills, competence, and experience acquired through formal and informal education and training.
Social Capital Social Capital is the network of social ties or associations an individual acquires and the levels of trustworthiness and reciprocity that exists across those connections.
11

12

Defining Social Capital Social Capital is the ability of individuals to secure benefits by virtue of membership in social networks.1 Social Capital refers to connections among individuals – social networks and the norms of reciprocity and trustworthiness that arise from them.2
Two broad dimensions of Social Capital, the network ties characterized by trust and norms of reciprocity, are bridging and bonding.
Bonding • Characterized by dense intra-group network ties. • Network ties reinforce homogeneous groups. • Connections sustain particularized (in-group) reciprocity and
mobilize solidarity. • Examples include fraternal organizations and church-based men’s
groups. • In this report, bonding social capital is best described by the
measures of Informal Socializing and Faith-Based Engagement.3
Bridging • Inter-group network ties. • Bridging network ties reinforce generalized reciprocity across di-
verse groups and provide linkages for external assets and informa-tion sharing and communication.
• Examples include social movement organizations and civil rights groups.
• Bridging social capital is best measured in this study by four
measures: Social Trust, Inter-Racial Trust, Diversity of Friend-ships, and Protest Politics.3
1 Portes, Alejandro. 1998. “Social Capital: Its origins and applications in modern sociology”. Annual Review of Sociology. 24:1-24.
13
3 The other measures of social capital have components of both bonding and bridging social capital.
2 Putnam, Robert. 2000. Bowling Alone. Simon & Schuster: New York

Defining the Dimensions of Social Capital Social Trust Social Trust, the core of social capital, measures the degree to which you trust other people. Generalized trust, not trust of specific people because of common participation in established groups, is the core of social capital. This index combines trust of neighbors, coworkers, shop clerks, co-religionists, local police and “most people.” Inter-Racial Trust The Inter-Racial Trust index is a measure of how various racial and ethnic groups trust each other. It specifically looks at the extent to which white, blacks, Asians, Hispanic/Latinos and other groups trust one another. Diversity of Friendships Individuals with diverse network ties or social networks, by definition, accumulate greater levels of social capital. The index of Diversity of Friendships is a cumulative measure based on the whether individuals have friends in each of 11 categories (business owner, on welfare, owns a vacation home, gay, a manual worker, is white, is black, is Asian, a community leader, and of a different faith). Conventional Politics Political participation is also a key indicator of engagement in the community. The index of Conventional Politics looks at whether an indi-vidual is registered to vote, actually votes, is interested in and knowledgeable about politics, and reads the newspaper regularly. Protest Politics Individuals also participate in the political process through unconventional, non-electoral ways. Protest Politics includes taking part in marches, demonstrations, boycotts, rallies, participating in groups that took action for local reform, and participating in labor and ethnically related groups. Civic Leadership Civic Leadership is measured by the extent to which individuals are engaged in groups, clubs, and local discussion of town or school affairs, and whether the individual look a leadership role with in the groups.
14

Defining the Dimensions of Social Capital Associational Involvement Associational Involvement in civic activities is measured by asking if the respondent participated in 18 broad group types: organizations af-filiated with religion; sports clubs, leagues, or outdoor activities; veterans groups; neighborhood associations; seniors groups; charity or social welfare organizations; labor unions; professional, trade, farm, or business associations; service or fraternal associations; ethnic, nationality, or civil rights organizations; political groups; literary, art, or musical groups; hobby, investment, or garden clubs; self-help programs; groups that meet only over the Internet; and any other type of groups or associations. Informal Socializing Social capital is also accumulated by the establishment and nurturing of informal friendships. The Informal Socializing index measures the degree to which individuals had friends over to their home, hung out with friends in a public place, socialized with co-workers outside of work, played cards or board games with others, and visited relatives. Giving and Volunteering Concern for the community is evidenced by charitable contributions and volunteering time. The Giving and Volunteering dimension meas-ures how often respondents volunteer at various venues and how generous they are in giving. Faith-Based Engagement Religion and religious participation is a major component of community connectedness (social capital). This dimension of social capital looks at religious attendance and membership, participation in church activities other than services, participation in organizations affiliated with religion, giving to religious causes, and volunteering at a place of worship. Social Capital Equity An additional but different type of social capital measure was included in the Cincinnati Social Capital study. All the other measures were at the individual level – i.e., what individual people do day-to-day. The Social Capital Index measures how social capital is spread among various groups. Cincinnati scores somewhat better than average on this measure of social capital. In other words, social capital in Greater Cincinnati is spread more widely among various racial, ethnic and social groups than in most other cities.
15

Social Trust Social Trust, the core of social capital, measures the degree to which you trust other people. Generalized trust, not trust of specific people because of common participation in established groups, is the core of social capital. This index combines trust of neighbors, coworkers, shop clerks, co-religionists, local police, and “most people.” [Component of Bridging Social Capital] Social Trust
21%
40%38%
35%
0%
10%
20%
30%
40%
50%
60%
70%
80%
90%
100%
City of Cincinnati Hamilton County Suburbs Butler, Warren, and ClermontCounties
Boone, Campbell, Kenton, andDearborn Counties
Perc
ent o
f Tho
se R
epor
ting
Hig
h So
cial
Tru
st b
y R
egio
n . .
.
• Respondents from Hamilton County Suburbs are almost twice as likely as respondents from the City of Cincin-nati to score high levels of social trust, due mainly to the low levels of social trust among Cincinnati’s many Afri-can-American residents.
• Respondents from other counties in-
cluding Ohio, Kentucky and Indiana are more likely to have higher levels osocial trust than respondents from theCity of Cincinnati.
f
16

Social Trust
Low Medium High Sample Size
Greater Cincinnati Region 29.5% 35.6% 34.9% 999
City of Cincinnati 45.0% 33.7% 21.3% 184Hamilton County Suburbs 25.9% 33.7% 40.4% 303
Butler, Warren, and Clermont counties 22.5% 40.0% 37.5% 319Boone, Campbell, Kenton, and Dear-
born counties31.3% 33.3% 35.4% 175
Gender of respondent Male 34.1% 36.7% 29.2% 462Female 25.6% 34.6% 39.8% 536
Respondent�s age category 18-34 39.3% 37.4% 23.2% 30335-49 28.0% 36.2% 35.8% 30350-64 27.4% 36.9% 35.6% 197
65+ 16.6% 30.4% 53.0% 167.
Race White 23.4% 37.3% 39.3% 825African-American 68.5% 23.3% 8.3% 115
Other 41.0% 35.7% 23.3% 36.
Education Less than High School Degree 49.3% 33.5% 17.2% 89High School Degree or GED 31.2% 38.4% 30.4% 354
Some College 28.8% 35.9% 35.3% 335Bachelors Degree 19.7% 35.2% 45.1% 104
Some Graduate or Graduate Degree 19.5% 28.5% 52.0% 100.
Income $20,000 or less 49.3% 27.2% 23.5% 110Over $20,000 but less than $30,000 30.1% 40.8% 29.1% 120
$30,000 but less than $50,000 33.2% 33.8% 32.9% 218$50,000 but less than $75,000 26.4% 36.0% 37.6% 194
$75,000 but less than $100,000 19.8% 38.9% 41.3% 92$100,000 or more 23.2% 30.2% 46.6% 98
• Overall women tend to display more social trust than men.
• Social trust also tends to vary by age.
Younger respondents were less likely than their counterparts to display high social trust. Conversely, respondents 65 and older were considerably more likely to exhibit high social trust.
• Overall, African-Americans respon-
dents displayed very low levels of gen-eral social trust.
• Social trust showed a direct relation-
ship with education. The more educa-tion a respondent possessed the more likely that respondent was to report high levels of social trust.
• Social trust also varied directly with
income such that respondents with higher incomes possessed higher levels of social trust.
17

Inter-Racial Trust The Inter-Racial Trust index is a measure of how various racial and ethnic groups trust each other. It specifically looks at the extent to which white, blacks, Asians, Hispanic/Latinos and other groups trust one another. [Component of Bridging Social Capital]
Inter-Racial Trust
27% 28% 28% 29%
0%
10%
20%
30%
40%
50%
60%
70%
80%
90%
100%
City of Cincinnati Hamilton County Suburbs Butler, Warren, and ClermontCounties
Boone, Campbell, Kenton, andDearborn Counties
Perc
ent o
f Tho
se R
epor
ting
Hig
h In
ter-
Rac
ial T
rust
by
Reg
ion
. . .
• Inter-racial trust does not vary much by region in the Greater Cincinnati area.
• Inter-racial trust is low to medium in the City of Cin-
cinnati among African-Americans and medium to high among Whites.
18

Inter-Racial Trust
Low Medium High Sample Size
Greater Cincinnati Region 18.0% 54.1% 27.9% 838
City of Cincinnati 24.9% 47.9% 27.2% 157Hamilton County Suburbs 14.2% 57.4% 28.4% 257
Butler, Warren, and Clermont counties 13.9% 58.1% 28.0% 261Boone, Campbell, Kenton, and Dear-
born counties23.2% 48.2% 28.6% 148
Gender of respondent Male 22.9% 54.3% 22.7% 391Female 13.6% 53.9% 32.4% 447
Respondent�s age category 18-34 21.7% 54.7% 23.6% 27635-49 16.5% 55.1% 28.4% 26350-64 15.1% 64.1% 20.8% 159
65+ 15.2% 39.6% 45.2% 132.
Race White 15.7% 54.4% 29.9% 718African-American 29.4% 53.7% 16.9% 104
Other 45.8% 44.2% 10.1% 17.
Education Less than High School Degree 43.0% 38.7% 18.3% 77High School Degree or GED 18.8% 56.1% 25.1% 317
Some College 15.2% 55.1% 29.7% 268Bachelors Degree 11.1% 60.0% 28.9% 89
Some Graduate or Graduate Degree 7.7% 53.3% 39.0% 85.
Income $20,000 or less 35.5% 41.0% 23.5% 90Over $20,000 but less than $30,000 16.1% 61.4% 22.5% 94
$30,000 but less than $50,000 17.1% 55.5% 27.4% 198$50,000 but less than $75,000 14.1% 56.6% 29.3% 173
$75,000 but less than $100,000 17.0% 57.8% 25.2% 76$100,000 or more 19.2% 54.0% 26.9% 83
• Women are much more likely than men to report high inter-racial trust.
• Older respondents are considerably
more likely to display high levels of in-ter-racial trust than all younger age groups.
• African-Americans are not as likely as
whites to display high levels of inter-racial trust.
• Inter-racial trust increases with educa-
tion. Although inter-racial trust in-creases from less than high school to having a high school degree, the big-gest increase and highest trust levels are exhibited by those with graduate degrees.
• Inter-racial trust does not appear to
vary much by income level.
19

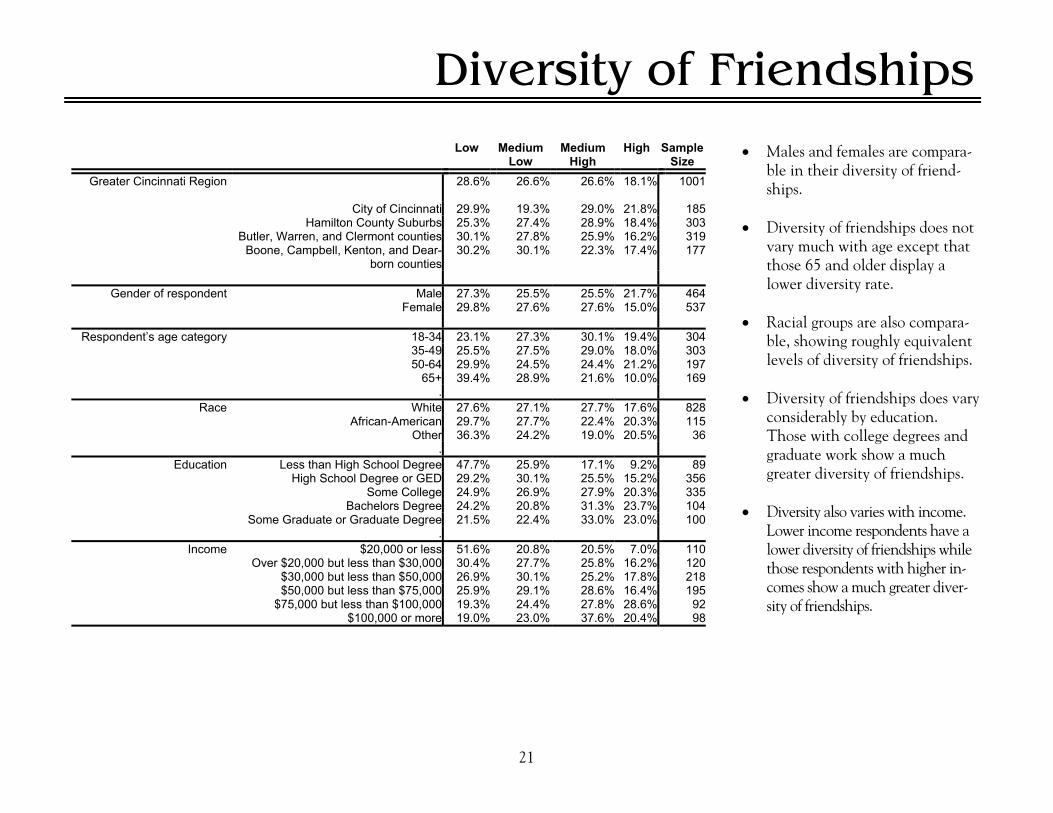
Diversity of Friendships Individuals with diverse network ties or social networks, by definition, accumulate greater levels of social capital. The index of Diversity of Friendships is a cumulative measure based on the whether individuals have friends in each of 11 categories (business owner, on welfare, owns a vacation home, gay, a manual worker, white, black, Asian, a community leader, and of a different faith). [Component of Bridging Social Capital]
20
Diversity of Friendships
51%
47%
42%40%
0%
10%
20%
30%
40%
50%
60%
70%
80%
90%
100%
City of Cincinnati Hamilton County Suburbs Butler, Warren, and ClermontCounties
Boone, Campbell, Kenton, andDearborn Counties
Perc
ent o
f Tho
se R
epor
ting
Med
ium
Hig
h an
d H
igh
on th
e D
iver
sity
of F
riend
ship
s In
dex
by R
egio
n . .
.
• Diversity of friendship shows an interesting varia-tion within Greater Cincinnati sub-areas. The greatest diversity of friendships can be found in the City of Cincinnati. As one looks at respon-dents further from the city, the diversity of frienships declines. This pattern is, in part, due to thelarger members of diverse people in the city and central county (Hamilton) who are available tmeet and befriend.
d-
o
Diversity of Friendships
• Males and females are compara-ble in their diversity of friend-ships.
• Diversity of friendships does not
vary much with age except that those 65 and older display a lower diversity rate.
• Racial groups are also compara-
ble, showing roughly equivalent levels of diversity of friendships.
• Diversity of friendships does vary
considerably by education. Those with college degrees and graduate work show a much greater diversity of friendships.
• Diversity also varies with income.
Lower income respondents have a lower diversity of friendships while those respondents with higher in-comes show a much greater diver-sity of friendships.
Low Medium Medium High
SampleLow High Size
Greater Cincinnati Region 28.6% 26.6% 26.6% 18.1% 1001
City of Cincinnati 29.9% 19.3% 29.0% 21.8% 185Hamilton County Suburbs 25.3% 27.4% 28.9% 18.4% 303
Butler, Warren, and Clermont counties 30.1% 27.8% 25.9% 16.2% 319Boone, Campbell, Kenton, and Dear-
born counties30.2% 30.1% 22.3% 17.4% 177
Gender of respondent Male 27.3% 25.5% 25.5% 21.7% 464Female 29.8% 27.6% 27.6% 15.0% 537
Respondent�s age category 18-34 23.1% 27.3% 30.1% 19.4% 30435-49 25.5% 27.5% 29.0% 18.0% 30350-64 29.9% 24.5% 24.4% 21.2% 197
65+ 39.4% 28.9% 21.6% 10.0% 169.
Race White 27.6% 27.1% 27.7% 17.6% 828African-American 29.7% 27.7% 22.4% 20.3% 115
Other 36.3% 24.2% 19.0% 20.5% 36.
Education Less than High School Degree 47.7% 25.9% 17.1% 9.2% 89High School Degree or GED 29.2% 30.1% 25.5% 15.2% 356
Some College 24.9% 26.9% 27.9% 20.3% 335Bachelors Degree 24.2% 20.8% 31.3% 23.7% 104
Some Graduate or Graduate Degree 21.5% 22.4% 33.0% 23.0% 100.
Income $20,000 or less 51.6% 20.8% 20.5% 7.0% 110Over $20,000 but less than $30,000 30.4% 27.7% 25.8% 16.2% 120
$30,000 but less than $50,000 26.9% 30.1% 25.2% 17.8% 218$50,000 but less than $75,000 25.9% 29.1% 28.6% 16.4% 195
$75,000 but less than $100,000 19.3% 24.4% 27.8% 28.6% 92$100,000 or more 19.0% 23.0% 37.6% 20.4% 98
21

Conventional Politics Political participation is also a key indicator of engagement in the community. The index of Conventional Politics looks at whether an indi-vidual is registered to vote, actually votes, is interested in and knowledgeable about politics, and reads the newspaper regularly. [Mix of Bridging and Bonding Social Capital]
Conventional Politics
18%
30%
20%17%
0%
10%
20%
30%
40%
50%
60%
70%
80%
90%
100%
City of Cincinnati Hamilton County Suburbs Butler, Warren, and ClermontCounties
Boone, Campbell, Kenton, andDearborn Counties
Perc
ent o
f Tho
se R
epor
ting
Hig
h on
the
Con
vent
iona
l Pol
itics
Inde
x by
Reg
ion
. . .
• Most areas of Greater Cincinnati do not show high levels of participation in Conventional Politics.4
• Hamilton County Suburbs respondents however
are ten to thirteen percent more likely than re-spondents in the other regions to display high levels of conventional political participation.
22
4 This is mostly due to low knowledge in Greater Cincinnati of who their two US Senators are.

Conventional Politics
Low Medium High Sample Size
Greater Cincinnati Region 34.2% 43.8% 22.0% 1001
City of Cincinnati 36.5% 45.4% 18.1% 185Hamilton County Suburbs 28.5% 41.8% 29.7% 303
Butler, Warren, and Clermont counties 32.6% 47.3% 20.1% 319Boone, Campbell, Kenton, and Dear-
born counties42.2% 41.2% 16.6% 177
Gender of respondent Male 34.5% 38.8% 26.6% 464Female 33.9% 48.2% 17.9% 537
Respondent�s age category 18-34 57.4% 36.5% 6.1% 30435-49 33.2% 50.4% 16.4% 30350-64 18.4% 48.4% 33.2% 197
65+ 14.9% 39.8% 45.3% 169.
Race White 32.2% 44.6% 23.2% 828African-American 43.1% 41.3% 15.7% 115
Other 50.5% 35.1% 14.4% 36.
Education Less than High School Degree 62.4% 27.7% 10.0% 89High School Degree or GED 41.3% 45.1% 13.6% 356
Some College 30.0% 47.2% 22.8% 335Bachelors Degree 16.7% 53.2% 30.1% 104
Some Graduate or Graduate Degree 17.6% 34.4% 48.0% 100.
Income $20,000 or less 52.7% 38.3% 9.0% 110Over $20,000 but less than $30,000 39.3% 42.5% 18.2% 120
$30,000 but less than $50,000 35.0% 44.1% 20.9% 218$50,000 but less than $75,000 32.3% 42.1% 25.6% 195
$75,000 but less than $100,000 24.4% 47.6% 28.1% 92$100,000 or more 29.8% 43.4% 26.9% 98
• Men are more likely than women to have high levels of participation in conventional politics.
• Conventional political participation
varies directly with age with young re-spondents displaying much lower lev-els of participation and older respon-dents higher levels.
• Whites are slightly more likely than
African-Americans to have higher levels of conventional political par-ticipation.
• Respondents with more education are
more likely to exhibit higher levels of participation in conventional politics.
• Respondents with low income possess
lower levels of participation; respon-dents over $50,000 have relatively higher levels of political participation.
23

Protest Politics
Individuals also participate in the political process through unconventional, non-electoral ways. Protest Politics includes taking part in marches, demonstrations, boycotts, rallies, participating in groups that took action for local reform, and participating in labor and ethnically related groups. [Component of Bridging Social Capital]
Protest Politics
27% 27%
21% 21%
0%
10%
20%
30%
40%
50%
60%
70%
80%
90%
100%
City of Cincinnati Hamilton County Suburbs Butler, Warren, and ClermontCounties
Boone, Campbell, Kenton, andDearborn Counties
Perc
ent o
f Tho
se R
epor
ting
Hig
h on
the
Prot
est P
rolit
ics
Inde
x by
Reg
ion
. . .
• Respondents in the City of Cincinnati and Hamilton County Suburbs are essentially equivalent in terms of their participation in political protest activities.
• Respondents in both the City of Cincinnati
and Hamilton County Suburbs show higher levels of participation in political protest ac-tivities than respondents in either Butler, Warren, and Clermont counties and Boone, Campbell, Kenton and Dearborn counties.
24

Protest Politics
• Male respondents are much more likely than female to take part in po-litical protest activities.
• Respondents between the ages of 18
and 64 are roughly equivalent in terms of their likelihood to participate in po-litical protest activities; however, those 65 and over are considerably less likely to take part in such activities.
• African-Americans are slightly more
likely than whites to display high scores for protest politics; however, these score are not dramatically higher than those found in other demo-graphic sub-groups.
• Political protest activities vary directly
with both education and income. Re-spondents on the lower ends of both scales are less likely to participate in such activities while those respondents with very high incomes or education levels are considerably more likely to be involved in these types of activities.
Low Medium High Sample Size
Greater Cincinnati Region 49.5% 26.9% 23.6% 1001
City of Cincinnati 48.5% 24.9% 26.6% 185Hamilton County Suburbs 49.4% 23.7% 26.8% 303
Butler, Warren, and Clermont counties 48.0% 31.4% 20.5% 319Boone, Campbell, Kenton, and Dear-
born counties53.8% 25.6% 20.6% 177
Gender of respondent Male 44.7% 26.3% 29.0% 464Female 53.7% 27.5% 18.9% 537
Respondent�s age category 18-34 47.2% 27.5% 25.3% 30435-49 48.5% 27.3% 24.2% 30350-64 45.8% 28.3% 25.9% 197
65+ 62.0% 21.6% 16.5% 169.
Race White 49.2% 28.2% 22.5% 828African-American 47.1% 24.6% 28.3% 115
Other 58.2% 8.5% 33.3% 36.
Education Less than High School Degree 70.2% 20.9% 8.9% 89High School Degree or GED 54.4% 25.7% 19.9% 356
Some College 46.3% 26.6% 27.1% 335Bachelors Degree 35.0% 36.1% 28.9% 104
Some Graduate or Graduate Degree 36.6% 29.2% 34.2% 100.
Income $20,000 or less 64.0% 26.7% 9.2% 110Over $20,000 but less than $30,000 50.0% 22.1% 27.8% 120
$30,000 but less than $50,000 49.3% 26.7% 24.0% 218$50,000 but less than $75,000 47.9% 25.8% 26.4% 195
$75,000 but less than $100,000 49.1% 26.6% 24.3% 92$100,000 or more 33.7% 30.8% 35.5% 98
25

Civic Leadership
Civic Leadership is measured by the extent to which individuals are engaged in groups, clubs, and local discussion of town or school affairs, and whether the individual look a leadership role with in the groups. [Mix of Bridging and Bonding Social Capital]
Civic Leadership
48%
53%
45%41%
0%
10%
20%
30%
40%
50%
60%
70%
80%
90%
100%
City of Cincinnati Hamilton County Suburbs Butler, Warren, and ClermontCounties
Boone, Campbell, Kenton, andDearborn Counties
Perc
ent o
f Tho
se R
epor
ting
Med
um H
igh
and
Hig
h C
ivic
Lea
ders
hip
by R
egio
n . .
.
• Civic leadership is highest among respondents in Hamilton County Suburbs.
• Respondents from the City of Cincinnati fol-
lowed closely by respondents in Butler, War-ren, and Clermont counties have slightly lower levels of civic leadership.
• Boone, Campbell, Kenton, and Dearborn
counties have the lowest level of civic leader-ship.
26

Civic Leadership
• When looking at both Medium
High and High levels of civic leadership both men and women are roughly equivalent in terms of civic leadership.
• There is some variation by age
with the youngest and oldest re-spondents less likely to take part in civic leadership.
• White respondents by just a nar-
row margin are more likely to be involved in civic leadership than African-Americans.
• While the data do not necessar-
ily follow a completely linear pattern, leadership essentially co-varies with both education and income with increases in ei-ther leading to higher levels of involvement in civic leadership.
Low Medium Medium High
SampleLow High Size
Greater Cincinnati Region 16.0% 37.0% 27.8% 19.1% 1001
City of Cincinnati 14.6% 37.8% 27.9% 19.8% 185Hamilton County Suburbs 11.2% 36.0% 29.7% 23.0% 303
Butler, Warren, and Clermont counties 19.1% 35.5% 27.7% 17.7% 319Boone, Campbell, Kenton, and Dear-
born counties18.1% 40.7% 26.7% 14.5% 177
Gender of respondent Male 18.8% 34.6% 25.6% 21.0% 464Female 13.6% 39.1% 29.7% 17.6% 537
Respondent�s age category 18-34 24.4% 32.4% 27.4% 15.8% 30435-49 15.6% 34.5% 28.3% 21.7% 30350-64 11.4% 36.1% 32.0% 20.6% 197
65+ 9.4% 49.2% 23.6% 17.8% 169.
Race White 14.5% 37.4% 29.5% 18.6% 828African-American 23.1% 35.6% 24.1% 17.2% 115
Other 36.0% 26.0% 10.5% 27.5% 36.
Education Less than High School Degree 38.4% 45.3% 11.8% 4.5% 89High School Degree or GED 21.6% 36.3% 28.0% 14.1% 356
Some College 10.0% 38.4% 29.6% 22.0% 335Bachelors Degree 7.6% 26.7% 34.8% 30.9% 104
Some Graduate or Graduate Degree 7.9% 34.9% 29.9% 27.2% 100.
Income $20,000 or less 32.0% 41.9% 17.6% 8.6% 110Over $20,000 but less than $30,000 18.7% 34.5% 28.9% 17.9% 120
$30,000 but less than $50,000 15.6% 41.4% 24.8% 18.2% 218$50,000 but less than $75,000 15.0% 31.6% 29.2% 24.2% 195
$75,000 but less than $100,000 11.4% 40.2% 26.7% 21.7% 92$100,000 or more 9.5% 31.6% 29.9% 29.0% 98
27

Associational Involvement
Associational Involvement in civic activities is measured by asking if the respondent participated in 18 broad group types: organizations af-filiated with religion; sports clubs, leagues, or outdoor activities; veterans groups; neighborhood associations; seniors groups; charity or social welfare organizations; labor unions; professional, trade, farm, or business associations; service or fraternal associations; ethnic, nationality, or civil rights organizations; political groups; literary, art, or musical groups; hobby, investment, or garden clubs; self-help programs; groups that meet only over the Internet; and any other type of groups or associations. [Mix of Bridging and Bonding Social Capital]
Associational Involvement
51%55%
50% 51%
0%
10%
20%
30%
40%
50%
60%
70%
80%
90%
100%
City of Cincinnati Hamilton County Suburbs Butler, Warren, and ClermontCounties
Boone, Campbell, Kenton, andDearborn Counties
Perc
ent o
f Tho
se R
epor
ting
Med
ium
Hig
h an
d H
igh
Ass
ocia
tiona
l Inv
olve
men
ts b
y R
egio
n . .
.
• The power of associational involvement is ex-traordinary. For example, scientific research has shown that becoming a member of one volun-tary organization increases a person’s health status as much as quitting smoking.
• The four regional areas are essentially equal in
terms of respondents’ levels of associational in-volvement.
28

Associational Involvement
• There is little variation in asso-
ciational involvement across ei-ther gender or age. Both males and females and respondents of all ages possess relatively equiva-lent levels of high associational involvement.
• White respondents have similar
levels of associational involve-ment compared to African-Americans.
• Those with less than a high
school degree have lower asso-ciational involvements than their counterparts.
Low Medium Medium High
SampleLow High Size
Greater Cincinnati Region 19.6% 28.5% 26.6% 25.3% 1001
City of Cincinnati 22.9% 25.7% 23.3% 28.1% 185Hamilton County Suburbs 19.9% 25.2% 25.5% 29.5% 303
Butler, Warren, and Clermont counties 19.2% 30.5% 28.6% 21.7% 319Boone, Campbell, Kenton, and Dear-
born counties16.1% 33.4% 28.3% 22.3% 177
Gender of respondent Male 17.8% 27.3% 28.0% 26.8% 464Female 21.0% 29.6% 25.4% 24.0% 537
Respondent's age category 18-34 19.2% 30.5% 27.0% 23.4% 30435-49 15.6% 28.1% 30.7% 25.6% 30350-64 20.6% 30.4% 22.0% 27.0% 197
65+ 27.4% 23.8% 23.3% 25.5% 169.
Race White 18.8% 28.5% 28.7% 24.0% 828African-American 24.2% 24.6% 17.6% 33.6% 115
Other 31.5% 26.0% 7.5% 35.0% 36.
Education Less than High School Degree 46.4% 26.4% 14.2% 13.0% 89High School Degree or GED 24.9% 27.4% 27.4% 20.3% 356
Some College 12.3% 31.9% 26.8% 29.1% 335Bachelors Degree 15.8% 21.8% 30.9% 31.5% 104
Some Graduate or Graduate Degree 6.3% 26.2% 29.9% 37.6% 100.
Income $20,000 or less 33.7% 32.6% 18.0% 15.6% 110Over $20,000 but less than $30,000 23.8% 26.8% 23.0% 26.3% 120
$30,000 but less than $50,000 20.2% 31.8% 26.5% 21.5% 218$50,000 but less than $75,000 17.3% 28.2% 32.7% 21.8% 195
$75,000 but less than $100,000 8.2% 30.1% 28.9% 32.8% 92$100,000 or more 7.4% 22.3% 30.3% 40.0% 98
• Those respondents making less than $20,000 a year have lower associational involvements than respondents with higher in-comes. The higher the income the higher the associational in-volvement.
29

Informal Socializing
Social capital is also accumulated by the establishment and nurturing of informal friendships. The Informal Socializing index measures the degree to which individuals had friends over to their home, hung out with friends in a public place, socialized with co-workers outside of work, played cards or board games with others, and visited relatives. [Component of Bonding Social Capital]
Organized Interaction
32%35% 35%
30%
0%
10%
20%
30%
40%
50%
60%
70%
80%
90%
100%
City of Cincinnati Hamilton County Suburbs Butler, Warren, and ClermontCounties
Boone, Campbell, Kenton, andDearborn Counties
Perc
ent o
f Tho
se R
epor
ting
Hig
h O
rgan
ized
Inte
ract
ion
by R
egio
n . .
.
• There are only slight variations in levels of infor-mal socializing across the four regional areas.
30

Informal Socializing
Low Medium High Sample Size
Greater Cincinnati Region 32.4% 32.5% 35.1% 1001
City of Cincinnati 31.2% 34.5% 34.3% 185Hamilton County Suburbs 34.0% 28.5% 37.5% 303
Butler, Warren, and Clermont counties 35.6% 32.0% 32.4% 319Boone, Campbell, Kenton, and Dear-
born counties24.7% 38.2% 37.1% 177
Gender of respondent Male 37.8% 27.7% 34.5%Female 27.7% 36.7% 35.6% 537
Respondent's age category 18-34 17.4% 26.5% 56.2% 30435-49 29.4% 38.6% 32.0% 30350-64 48.7% 33.3% 18.0% 197
65+ 43.9% 33.7% 22.3% 169.
Race White 30.7% 33.1% 36.2% 828African-American 39.0% 34.7% 26.3% 115
Other 48.7% 15.5% 35.8% 36.
Education Less than High School Degree 54.6% 19.4% 25.9% 89High School Degree or GED 29.8% 31.4% 38.8% 356
Some College 28.0% 33.2% 38.8% 335Bachelors Degree 33.6% 34.1% 32.4% 104
Some Graduate or Graduate Degree 32.0% 46.7% 21.3% 100.
Income $20,000 or less 46.1% 26.3% 27.6% 110Over $20,000 but less than $30,000 19.6% 37.0% 43.4% 120
$30,000 but less than $50,000 28.5% 30.8% 40.7% 218$50,000 but less than $75,000 34.5% 28.0% 37.5% 195
$75,000 but less than $100,000 36.1% 35.6% 28.3% 92$100,000 or more 26.5% 38.7% 34.8% 98
• Male and female respondents do com-parable amounts of informal socializ-ing.
464
• Younger respondents between the ages of 18 and 34 exhibit considerably higher levels of informal socializing than do older respondents. Indeed there is a continued drop off as age in-creases until one reaches the age of 65 when informal socializing picks up slightly.
• White respondents tend to have
higher levels of informal socializing than do African-Americans.
31

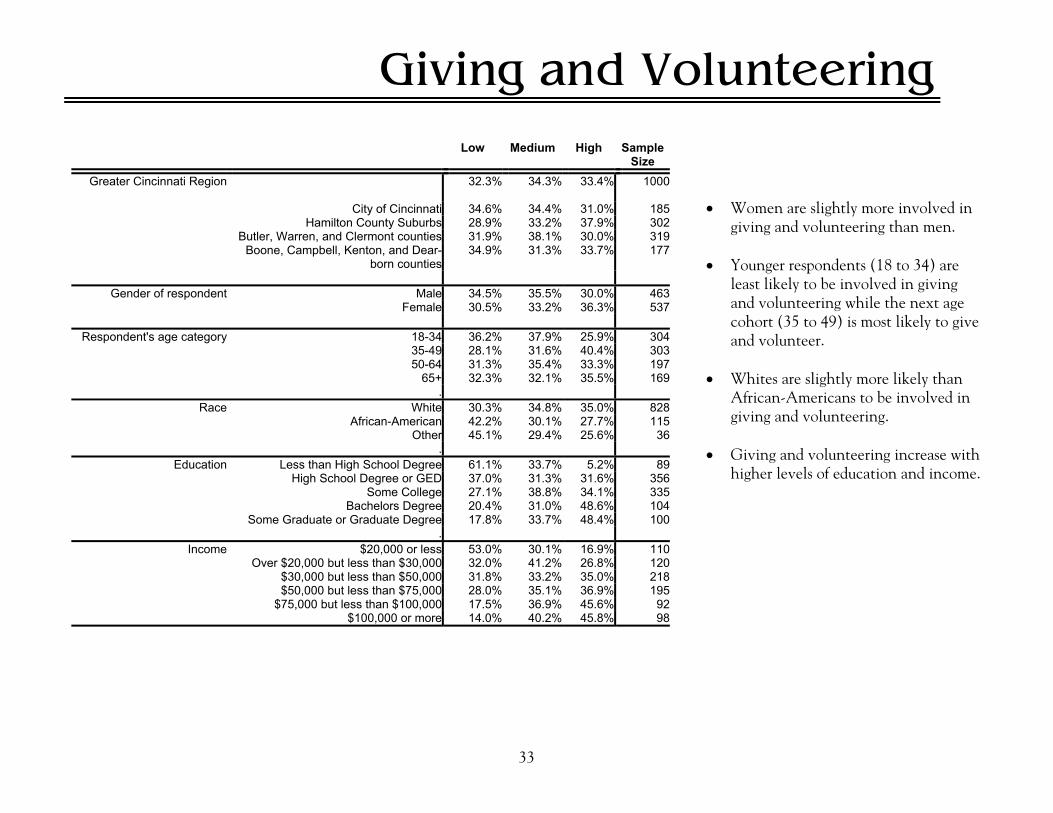
Giving and Volunteering
Concern for the community is evidenced by charitable contributions and volunteering time. The Giving and Volunteering dimension meas-ures how often respondents volunteer at various venues and how generous they are in giving. [Mix of Bridging and Bonding Social Capital]
Giving and Volunteering
31%
38%
30%
34%
0%
10%
20%
30%
40%
50%
60%
70%
80%
90%
100%
City of Cincinnati Hamilton County Suburbs Butler, Warren, and ClermontCounties
Boone, Campbell, Kenton, andDearborn Counties
Perc
ent o
f Tho
se R
epor
ting
Hig
h on
the
Giv
ing
and
Volu
ntee
ring
Inde
x by
Reg
ion
. . .
• Approximately one-third of respondents in the Greater Cincinnati region possess high levels of giving and volunteering.
• Giving and volunteering is highest among re-
spondents from Hamilton County Suburbs.
32
Giving and Volunteering
Low Medium High Sample Size
Greater Cincinnati Region 32.3% 34.3% 33.4% 1000
City of Cincinnati 34.6% 34.4% 31.0% 185Hamilton County Suburbs 28.9% 33.2% 37.9% 302
Butler, Warren, and Clermont counties 31.9% 38.1% 30.0% 319Boone, Campbell, Kenton, and Dear-
born counties34.9% 31.3% 33.7% 177
Gender of respondent Male 34.5% 35.5% 30.0% 463Female 30.5% 33.2% 36.3% 537
Respondent's age category 18-34 36.2% 37.9% 25.9% 30435-49 28.1% 31.6% 40.4% 30350-64 31.3% 35.4% 33.3% 197
65+ 32.3% 32.1% 35.5% 169.
Race White 30.3% 34.8% 35.0% 828African-American 42.2% 30.1% 27.7% 115
Other 45.1% 29.4% 25.6% 36.
Education Less than High School Degree 61.1% 33.7% 5.2% 89High School Degree or GED 37.0% 31.3% 31.6% 356
Some College 27.1% 38.8% 34.1% 335Bachelors Degree 20.4% 31.0% 48.6% 104
Some Graduate or Graduate Degree 17.8% 33.7% 48.4% 100.
Income $20,000 or less 53.0% 30.1% 16.9% 110Over $20,000 but less than $30,000 32.0% 41.2% 26.8% 120
$30,000 but less than $50,000 31.8% 33.2% 35.0% 218$50,000 but less than $75,000 28.0% 35.1% 36.9% 195
$75,000 but less than $100,000 17.5% 36.9% 45.6% 92$100,000 or more 14.0% 40.2% 45.8% 98
• Women are slightly more involved in giving and volunteering than men.
• Younger respondents (18 to 34) are
least likely to be involved in giving and volunteering while the next age cohort (35 to 49) is most likely to give and volunteer.
• Whites are slightly more likely than
African-Americans to be involved in giving and volunteering.
• Giving and volunteering increase with
higher levels of education and income.
33

Faith-Based Engagement
Religion and religious participation is a major component of community connectedness (social capital). The Faith-Based Engagement di-mension of social capital looks at religious attendance and membership, participation in church activities other than services, participation in organizations affiliated with religion, giving to religious causes, and volunteering at a place of worship. [Component of Bonding Social Capital]
Faith-Based Engagement
33%
38%
30% 31%
0%
10%
20%
30%
40%
50%
60%
70%
80%
90%
100%
City of Cincinnati Hamilton County Suburbs Butler, Warren, and ClermontCounties
Boone, Campbell, Kenton, andDearborn Counties
Perc
ent o
f Tho
se R
epor
ting
Hig
h Fa
ith-B
ased
Eng
agem
ent b
y R
egio
n . .
.
• Levels of religious participation or faith-based engagement are similar across the four regions with approximately one-third of respondents in the Greater Cincinnati Region exhibiting high levels of faith-based engagement.
34

Faith-Based Engagement
Low Medium High Sample Size
Greater Cincinnati Region 34.5% 32.7% 32.7% 997
City of Cincinnati 39.2% 28.1% 32.7% 185Hamilton County Suburbs 28.4% 34.0% 37.6% 302
Butler, Warren, and Clermont counties 36.1% 34.4% 29.5% 316Boone, Campbell, Kenton, and Dear-
born counties35.3% 33.5% 31.1% 177
Gender of respondent Male 42.2% 30.5% 27.3% 462Female 27.9% 34.7% 37.4% 534
Respondent's age category 18-34 44.4% 35.7% 19.9% 30335-49 33.4% 31.4% 35.1% 30150-64 28.7% 32.5% 38.8% 196
65+ 27.8% 29.1% 43.2% 169.
Race White 34.1% 32.3% 33.6% 823African-American 38.1% 27.7% 34.2% 115
Other 37.5% 46.0% 16.5% 36.
Education Less than High School Degree 49.2% 27.8% 23.0% 89High School Degree or GED 38.7% 28.9% 32.4% 354
Some College 29.1% 38.2% 32.7% 334Bachelors Degree 34.8% 27.2% 38.0% 102
Some Graduate or Graduate Degree 27.0% 33.0% 40.0% 99.
Income $20,000 or less 48.5% 26.3% 25.2% 110Over $20,000 but less than $30,000 31.8% 32.0% 36.2% 120
$30,000 but less than $50,000 38.9% 29.9% 31.2% 218$50,000 but less than $75,000 37.1% 33.4% 29.5% 194
$75,000 but less than $100,000 24.5% 33.4% 42.0% 91$100,000 or more 34.2% 38.6% 27.2% 97
• Women are more likely than men to have a high level of faith-based en-gagement.
• Faith-based engagement varies directly
with age. The older the respondent, the more likely they are to have a high level of faith-based engagement.
• Whites and African-Americans have
similar levels of faith-based engage-ment.
• Education varies directly with faith-
based engagement; as a respondent’s education level increases so does the likelihood that they will have a high level of faith-based engagement.
• Income does not appear to vary sys-
tematically with faith-based engage-ment.
35

Strategies for Building Social Capital
What Can Individuals Do to Build Social Capital?
Dimension of Social Capital (Primary Characteristic)
To Strengthen Common Ties (Bonding Social Capital)
To Build Connections with Others (Bridging Social Capital)
Social Trust (Bridging)
Organize a social gathering to welcome a new neighbor. Join a carpool to ride to work
Use public transportation and start talking with those you regularly see. Go out of your way to interact with people who are different from you.
Inter-Racial Trust (Bridging)
By its nature, inter-racial trust is a bridging social capital activity; no bonding examples.
Join a Study Circles group, or participate in a “watch party,” to discuss race relations. Fill out a questionnaire on police/community relations for the ARIA Group project. (www.ariagroup.com)
Diversity of Friendships (Bridging)
Host a block party or holiday open house. Start a discussion group with co-workers.
Ask a new person whose background is dif-ferent from yours to attend an event.
Conventional Politics (Bonding and Bridging)
Register to vote and go to the polls each Election Day.
Run for public office. Participate in political campaigns.
Protest Politics (Bridging)
Write a letter to your Congressman stating your views about an issue.
Attend town meetings and other political events. When somebody says “government stinks,” suggest they help fix it.
Recommendations from Saguaro Seminar on Civic Engagement in America, John F. Kennedy School of Government, Harvard University
36

Strategies for Building Social Capital
Dimension of Social Capital (Primary Characteristic)
To Strengthen Common Ties (Bonding Social Capital)
To Build Connections with Others (Bridging Social Capital)
Civic Leadership (Bonding and Bridging)
Work on your town or neighborhood news-letter. Organize a neighborhood garage sale and do-nate a portion of the proceeds to charity.
Join a nonprofit organization advocating for an issue or cause that you care about.
Associational Involvement (Bonding and Bridging)
Join the Elks, Kiwanis, Knights of Columbus or another type of social/civic association. Organize or participate in a sports league. Attend PTA meetings.
Encourage your civic/social organization to include youth representatives.
Informal Socializing (Bonding)
Play cards with friends or neighbors. Turn off the TV to talk with friends or family. Have family dinners and read to your children.
Persuade a local restaurant to have a desig-nated “meet people” table. Invite a new friend, neighbor or co-worker to join your family’s special holiday dinner.
Giving and Volunteering (Bonding and Bridging)
Volunteer in your child’s classroom or chap-erone a field trip. Give money to your church or make a con-tribution to a group where you are a member.
Help coach Little League or other youth sports – even if you don’t have a kid playing. Give money to a charitable organization that promotes inter-cultural awareness. Foster inter-generational mentoring.
Faith-Based Engagement (Bonding)
Go to church or temple. Talk to your children about spirituality.
Mentor someone of a different ethnic or reli-gious group. Attend a religious service or cultural celebra-tion of a different denomination or culture.
37

Strategies for Building Social Capital
What Can Companies, Civic Organizations and Schools Do to Build Social Capital?
Dimension of Social Capital (Primary Characteristic)
To Strengthen Common Ties (Bonding Social Capital)
To Build Connections with Others (Bridging Social Capital)
Social Trust (Bridging)
Organize a potluck lunch or dinner. Bake cookies and provide a special welcome for new employees or organization members. Restore extra-curricular activities in schools.
Reconfigure work spaces to encourage social and work-related interaction. Support public art projects and programs that transcend cultural and demographic bounda-ries.
Inter-Racial Trust (Bridging)
Show a movie, host a performance or invite a speaker who deals with race relations or helps build understanding of a different race or culture.
Create and promote team projects that pro-vide opportunities for individuals from differ-ent departments and levels in the organiza-tion to work together.
Diversity of Friendships (Bridging)
Host holiday social gatherings or a family picnic. Use arts organizations as community spaces.
Help “transplanted” professionals create a circle of friends that builds community, at-tracts young people and helps retain them. Provide time during the workday for diverse employees to “connect” across social divides.
Conventional Politics (Bonding and Bridging)
Invite local government officials to speak at your workplace.
Broaden the role of citizens in restructuring government, i.e., serving on charter review commissions.
Protest Politics (Bridging)
Participate in community planning initia-tives. Circulate a petition for signatures for a can-didate or issue you care about.
Participate in public/private/civic partner-ships to address complex community issues. Address the separation issues that are part of urban sprawl. Strengthen organizations connecting indi-viduals and government.
38

Strategies for Building Social Capital
Dimension of Social Capital (Primary Characteristic)
To Strengthen Common Ties (Bonding Social Capital)
To Build Connections with Others (Bridging Social Capital)
Civic Leadership (Bonding and Bridging)
Institute “work-life” programs to help em-ployees meet family and community obliga-tions, i.e., flexible leave time, on-site child-care, elderly assistance. Create a “civic switchboard” to connect neighborhood groups to each other. Make civics education relevant in schools.
Use workplaces as a civic forum, and provide civic skills education. Develop incentive programs to encourage deeper civic involvement for all levels of employees, not just executives. Put your people on boards and committees.
Associational Involvement (Bonding and Bridging)
Provide time off for parents to attend PTA meetings, athletic contests, plays and recitals. Encourage volunteer/community groups to hold meetings at your site. Create opportunities for collaboration among like-minded organizations.
Create work-based civic associations, e.g. of-fice-based chapters of national organizations. Allow civic groups and nonprofits to hold meetings in your facility.
Informal Socializing (Bonding)
Organize and participate in an employee sports league or bowling team.
Start a brown bag lunch series or discussion series.
Giving and Volunteering (Bonding and Bridging)
Encourage employees, members, and students to volunteer for local nonprofit organiza-tions. Encourage employees to become art partici-pants as well as art spectators.
Give time off for community service and to work on civic projects. Require community service for all students. Contribute to groups that increase community participation and strengthen social networks.
Faith-Based Engagement (Bonding)
Support faith-based community development initiatives (church- and neighborhood- spe-cific).
Include churches in public/private/civic partnerships to address community issues. Support interfaith organizations.
39
40
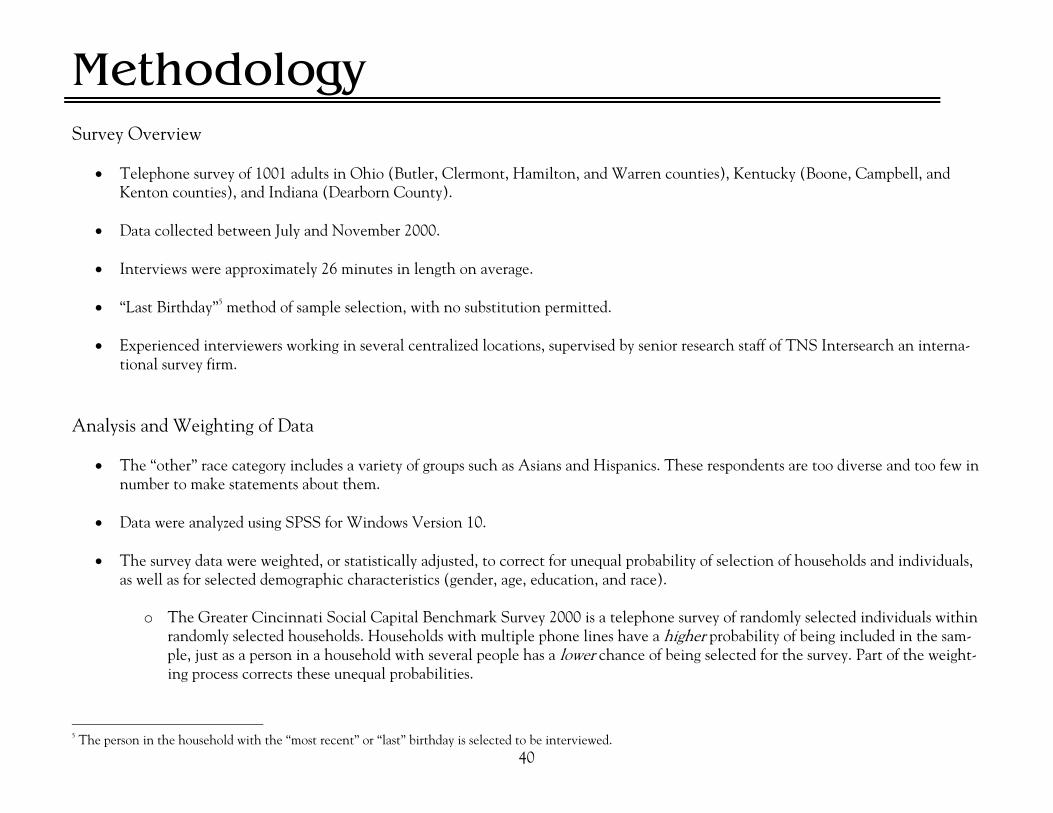
Methodology Survey Overview
• Telephone survey of 1001 adults in Ohio (Butler, Clermont, Hamilton, and Warren counties), Kentucky (Boone, Campbell, and Kenton counties), and Indiana (Dearborn County).
• Data collected between July and November 2000.
• Interviews were approximately 26 minutes in length on average.
• “Last Birthday”5 method of sample selection, with no substitution permitted.
• Experienced interviewers working in several centralized locations, supervised by senior research staff of TNS Intersearch an interna-
tional survey firm. Analysis and Weighting of Data
• The “other” race category includes a variety of groups such as Asians and Hispanics. These respondents are too diverse and too few in number to make statements about them.
• Data were analyzed using SPSS for Windows Version 10.
• The survey data were weighted, or statistically adjusted, to correct for unequal probability of selection of households and individuals,
as well as for selected demographic characteristics (gender, age, education, and race).
o The Greater Cincinnati Social Capital Benchmark Survey 2000 is a telephone survey of randomly selected individuals within randomly selected households. Households with multiple phone lines have a higher probability of being included in the sam-ple, just as a person in a household with several people has a lower chance of being selected for the survey. Part of the weight-ing process corrects these unequal probabilities.
5 The person in the household with the “most recent” or “last” birthday is selected to be interviewed.

Methodology
o Due to simple sampling error, the unweighted survey data usually does not exactly match the demographic characteristics of
the region. The weighting process statistically corrects for variation in the gender, age, education, and racial distribution of the sample, to more accurately reflect the Greater Cincinnati population.
o The demographic characteristics of the final weighted sample are comparable to the demographics of adults in Greater Cin-
cinnati.
41

The Greater Cincinnati Foundation Elizabeth Bower Reiter, Communications Director 200 West Fourth Street The Robert and Ruth Westheimer Center for Philanthropy Cincinnati, Ohio 45202-2602 Phone (513) 241-2880 Fax (513) 852-6886 [email protected] www.greatercincinnatifdn.org Institute for Policy Research P.O. Box 210132 University of Cincinnati Cincinnati, Ohio 45221-0132
.www.ipr.uc edu Bowling Alone www.bowlingalone.com Better Together www.bettertogether.org