social capital and national environmental performance: a
TRANSCRIPT

10.1177/1070496504271417JOURNALOF ENVIRONMENT & DEVELOPMENTGrafton, Knowles / SOCIALCAPITAL
Social Capital and National EnvironmentalPerformance: A Cross-Sectional Analysis
R. QUENTIN GRAFTON
STEPHEN KNOWLES
Using cross-country data from a sample of low-, middle-, and high-incomecountries, this article provides the first empirical test of the empirical relation-ships between national measures of social capital (civic and public), socialdivergence, and social capacity on various indicators of national environmen-tal performance. Overall, the results provide little empirical support for thehypothesis that social determinants have a statistically beneficial effect onnational indicators of environmental quality but do show that higher popula-tion density is associated with increases in environmental degradation. Thefindings suggest that the presumption that social capital is always good for theenvironment may be as flawed as the previously widely held view that higherincomes are always associated with increased environmental degradation. Thepolicy implication is that improved national environmental performance maybe best achieved by limiting future increases in population density andlowering emission and input intensities.
Keywords: social capital; national environmental performance
Social capital is a catchall term for the social institutions and networksat a household, local, and national level that influence how people inter-act and how these interactions influence social and economic outcomes.Increasingly, policy makers view social capital as an asset that can beenlarged and used to address a wide variety of social ills, including pooreducational achievements (Putnam, 2000), crime (Rosenfeld, Messner, &Baumer, 2001), morbidity (Putnam, 2000; Rose, 1999), and environmen-tal degradation, and also improve economic outcomes (Knack & Keefer,1997). In terms of the environment, the common presumption is thatsocial capital, by fostering collective action at the local and nationallevel, is unambiguously good for the environment. Evidence for thiswidely held view comes from case studies of collective action to addressa wide range of local resource and environmental problems in variouscountries (Berkes, 1989; Bowles & Gintis, 2002; Bromley et al., 1992;Ostrom, 1990; Ostrom, Gardner, & Walker, 1994).
In this article we empirically investigate the effects of social capital,variously defined, on broad national measures of environmental quality.The goal of the analysis is modest: to test if there exists a statistically sig-
336
Journal of Environment & Development, Vol. 13, No. 4, December 2004 336-370DOI: 10.1177/1070496504271417© 2004 Sage Publications

Grafton, Knowles / SOCIAL CAPITAL 337
nificant causal relationship between social determinants and sixbroad, national environmental indicators using data from a cross-section of rich, middle-income, and poor countries. The study takesthe first step toward answering three important questions regarding therelationship between social determinants and national environmentalperformance.
1. To what extent do broad-based and national measures of civic socialcapital (measured by trust, civic engagement, and active membership involuntary organizations) and public social capital (measured by demo-cratic accountability and corruption) affect national environmentalperformance?
2. Are social barriers to communication across social groups (measured byethnolinguistic fractionalization (ELF), land inequality, and religioushomogeneity), defined as social divergence, significant factors in determin-ing environmental performance across countries?
3. Are measures of the ability of individuals to achieve their human poten-tial (calorie intake as percentage of total requirements and average yearsof schooling), defined as social capacity, important in influencing overallenvironmental outcomes at a national level?
To answer these questions we provide a discussion of the literatureand empirical findings of the effects of social determinants on the envi-ronment. We also define and explain the dependent and explanatoryvariables used in the study, describe the underlying model and estima-tion used, summarize the principal results of our work, and concludewith policy implications.
Social Determinants andEnvironmental Outcomes
Our study follows in the tradition of a number of authors who haveanalyzed the effects of social determinants on environmental degrada-tion. A key article by Torras and Boyce (1998) examined whetherunequal power distributions, as measured by income inequality, liter-acy, and civil and political liberties, affect environmental degradation ina modified environmental Kuznets curve (EKC) model. They concludedthat widening the distribution of power within society can positivelyaffect environmental quality. Scruggs (1998) has also addressed thisissue with income inequality but found it had no significant effect onenvironmental quality, whereas Barrett and Graddy (2000) providedempirical support that civil and political liberties improve environmen-tal quality.

Neumayer (2002) found that democracies place a greater area of theirland under preservation and are more likely to participate and complywith international environmental agreements and commitments. Thelatter result is consistent with an earlier finding of Congleton (1992). Bycontrast, Midlarsky (1998) found that democracies also have higher car-bon emissions and rates of deforestation, although a contrary finding byDidia (1997) indicates that democracies have lower rates of deforesta-tion. In theoretical work, Eriksson and Persson (2003) have shown that ina complete democracy a more equal income distribution favors lesspollution.
Pretty and Ward (2001) provided numerous examples to show howsocial bonds and norms of behavior can manifest themselves in local col-lective action to improve environmental performance but do not testthese relationships at a national level. Most recently, Fredriksson,Neumayer, Damania, and Gates (in press) found that the number ofenvironmental lobby groups and greater political competition betweenpolitical parties (particularly in countries with a high participation ratein elections) raises the stringency of environmental policies as measuredby the lead content in gasoline. Binder and Neumayer (in press) alsofound that the number of environmental nongovernment organizationsper capita appears to have a negative and statistical effect on ambient airmeasures of sulfur dioxide, smoke levels, and heavy particulates for upto 35 countries during the period of 1977 to 1988.
López and Mitra (2000) developed a theoretical model that shows theimportance of government institutions on environmental outcomes.They found that the potential exists for higher than optimal levels of pol-lution because of corruption and rent-seeking behavior. Damania (2002)has also developed a theoretical model to show how corruption maycontribute to environmental degradation. More recently, Damania,Fredriksson, and List (2003) developed a theoretical model and testedfor the relationships between trade liberalization, corruption, and envi-ronmental policy formation. In two of four panel regression models theyfound that a higher level of government honesty has a statistically signif-icant relationship on lowering the lead content in gasoline. Using a dif-ferent theoretical model, Fredriksson, Vollebergh, and Dijkgraaf (2004)also found that higher levels of corruption lower the stringency ofenergy policy as measured by energy intensity in 11 sectors in 12 Organi-sation for Economic Co-operation and Development (OECD) countries.
Despite the rich literature—theoretical and empirical—to explaincross-country differences in environmental performance, our article isthe first to test whether a broad range of social determinants (civic andpublic social capital, social divergence, and social capacity) have a statis-tically significant and beneficial effect on national measures of environ-mental quality. Using a comprehensive data set on environmental per-formance developed at Columbia and Yale Universities we examine the
338 JOURNAL OF ENVIRONMENT & DEVELOPMENT

effects of social determinants on six broad-based measures of environ-mental quality. After controlling for differences in per capita income andpopulation density we test whether differences in civic social capital(trust, civic behavior, and participation in volunteer activities), publicsocial capital (democracy and corruption), social divergence (ELF, landinequality, and religious homogeneity), and social capacity (calorieintake and human capital) explain cross-country differences inenvironmental performance.1
Defining the SocialDeterminant-Environment Relationships
Many definitions and measures exist for social capital, social diver-gence, social capacity, and environmental performance or quality. Wereview these concepts, definitions, and measures for both the explana-tory variables and measures of environmental quality.
SOCIAL CAPITAL, SOCIAL DIVERGENCE,AND SOCIAL CAPACITY
Putnam (1993) broadly defined social capital as “the features of socialorganization . . . that facilitate coordination and cooperation for mutualbenefit” (pp. 35-36) that are embodied in networks and civic engage-ment.2 Using this definition, social capital may be measured by suchvariables as norms of behavior, participation in voluntary associations,and, especially, trust—an explanatory variable that has been used as aproxy for social capital in other contexts (Knack & Keefer, 1997). Thesefeatures of social capital are generally measured at an individual, house-hold, or local level and thus can be termed civic social capital. The con-cept of social capital also encompasses institutional quality at higher lev-els of aggregation and may be broadly measured by democraticaccountability and corruption within the political system. These fea-tures of social capital are closely related to the performance of public
Grafton, Knowles / SOCIAL CAPITAL 339
1. A full data appendix that gives all observations per country is available on request.The 53 nations in the sample include Argentina, Armenia, Australia, Austria, Azerbaijan,Bangladesh, Belarus, Belgium, Brazil, Bulgaria, Canada, Chile, China, Colombia, Croatia,Denmark, Dominican Republic, Estonia, Finland, France, Germany, Ghana, Iceland, India,Ireland, Italy, Japan, Korea, Latvia, Lithuania, Mexico, Moldova, Netherlands, Nigeria,Norway, Pakistan, Peru, Philippines, Poland, Portugal, Russia, Slovenia, South Africa,Spain, Sweden, Switzerland, Taiwan, Turkey, Ukraine, United Kingdom, United States,Uruguay, and Venezuela.
2. Several other similar, but different, definitions of social capital also exist. See theedited volume by Dasgupta and Serageldin (2000) for alternative perspectives.
institutions and their relationship to the public at large and may betermed public social capital.
A related concept is social divergence, which represents the socialbarriers to communication between individuals and groups (Grafton,Knowles, & Owen, 2002). The greater the social divergence the lower isthe opportunity for collective action that may help address environmen-tal concerns. Social divergence may be measured by such variables asreligious and ethnic diversity and wealth inequality, which reflect broadsocial divisions and potential barriers to the exchange of ideas acrosssocial groups.
Social capacity is the potential for individuals to achieve their humanpotential and may be measured by a number of commonly used andavailable development indices. For instance, poor health or nutritionstatus or low levels of education are development indices that proxylower levels of social capacity and may reduce the ability of a society toresolve its environmental problems.
ENVIRONMENTAL INDICATORS
No single set of measures can adequately describe the multifacetednature of the environment or fully capture transboundary effects andpollution consequences that accumulate over time (Ansuategi &Perrings, 2000). Despite these potential difficulties, proxies of primaryenvironmental quality that are routinely collected include measures ofair quality, water quality, use of natural resources, and land-use change.Possible land-use environmental measures include water withdrawalsas a proportion of the total available, changes in land cover, and variousmeasures of soil erosion.
For air and water quality, ambient levels of different pollutants areoften recorded, as are total levels of emissions for some pollutants. Interms of air quality, ambient levels of sulfur dioxides, nitrogen oxides,volatile organic compounds, carbon monoxide, and total suspendedparticulates are commonly recorded in urban locations. Ambient mea-sures of water quality that are collected include faecal coliform, dis-solved oxygen, and phosphorous, among others. These ambient mea-sures of environmental quality are obtained for specific sites and atparticular points in time, thus they are not necessarily representative ofthe state of nature in a country as a whole.
In addition to primary measures of environmental quality, secondaryindicators of environmental performance also exist. For example, thenumber of species at risk is an indirect measure of environmental qualityas it is a function of both the classification and the resources spent in wild-life research as well as environmental factors such as habitat degradation.Other indirect measures may include the performance of governments ornational institutions in committing themselves to achieving defined envi-
340 JOURNAL OF ENVIRONMENT & DEVELOPMENT

ronmental targets or agreements such as the Framework Conventions onClimate Change, The Montreal Protocol (on substances that deplete theozone layer), and the Convention on Biological Diversity.3
Modeling and Estimating the SocialDeterminant-Environment Relationship
Social capital, social divergence, and social capacity may interact toaffect environmental performance in many different ways. The effects ofsocial determinants are a subcomponent of how human activities influ-ence the state of nature. We posit that the main drivers of environmentalperformance are population (or population density), the level of income,and a variety of institutional and social determinants. The simpleststructural model that encompasses this representation is given below,
E D D y pd yit i it i it it it it iti
n
i
n
= + + × + + +==∑α α γ β β ε0 1 2
11
( )∑ (1)
where Eit is a measure of environmental performance of country i inperiod t, Dit denoted i = 1, 2, . . . , n are measures of social determinants incountry i and period t, pdit is population density in country i and period t,yit is per capita GDP in country i and period t, and it is an error termassumed to be independently and normally distributed. Interactionterms (Dit × yit) are also included in Equation 1 because it is hypothe-sized that for a given level of a social determinant, an increase in percapita income will improve environmental performance. In otherwords, we expect that improved social structures complement increasesin per capita income to accentuate any beneficial effects on environmen-tal quality in what may be called a middle-class consensus (Easterly,2001).
Social determinants may affect national environmental outcomes in anumber of different ways. First, through a scale effect whereby higherlevels of social capital and social capacity and lower levels of socialdivergence promote higher levels of income and productivity, which, inturn, can contribute to increased environmental degradation. Both thetheoretical and empirical literature support the notion that higher levelsof social capital (Temple & Johnson, 1998; Zak & Knack, 2001) and lowerlevels of social divergence (Grafton, Knowles, & Owen, 2004) increaseper capita income.
Grafton, Knowles / SOCIAL CAPITAL 341
3. For descriptions of various international environmental agreements consultGrafton, Pendleton, and Nelson (2001).

In some countries and during some periods, the scale effect may over-whelm any beneficial effects that social capital may have on reducingenvironmental degradation. For instance, Hamilton and Turton (2002)found in a decomposition of the factors that explain carbon emissions inOECD countries that income per capita accounted for more than a thirdof the increase during the period of 1982 to 1997. Second, and offsettingthe scale effect, is the potential for social determinants to influence thecomposition effect by shifting overall output away from “dirty” to“clean” industries. For example, this might arise because higher levels ofsocial capital are associated with higher levels of human capital(Gradstein & Justman, 2002) that may contribute to a shift from tradi-tional manufacturing to service industries as a proportion of the totaleconomy, thereby lowering emissions.
Third, social capital may influence the technique effect by decreasingemissions or waste intensities per dollar of output. A desirable tech-nique effect may arise, for example, from more effective monitoring andmore stringent regulations of pollution with low levels of corruption(Fredriksson et al., 2004) and the presence of environmental nongov-ernmental organizations that make pollution standards more stringent(Binder & Neumayer, in press; Fredriksson et al., in press). Preferencesfor improved environmental quality may also be transformed into moreeffective environmental policies because of higher levels of bureaucraticquality and greater democratic accountability.
Given the lack of times-series data on social capital, environmentalpolicies, and the state of technology, a panel estimation of Equation 1with separate equations for the effect of social determinants on the scale,composition, and technique effects is not possible.4 Apart from theissues of data availability and data quality, a time-series analysis, at leastfor an individual country or small group of similar countries, also facesthe problem that many social determinants change very little over time.Thus, such approaches are unlikely to ascertain the contribution of socialcapital and social determinants on overall environmental outcomes. Toovercome both lack of data availability and a lack of variation in socialdeterminants over time we estimate reduced-form equations of Equa-tion 1 using cross-sectional data from poor, middle-income, and richcountries. Estimates of Equation 1 using ordinary least squares (OLS)combined with diagnostics permit us to estimate the overall effects ofsocial capital, social divergence, and social capacity on cross-countryenvironmental performance.
342 JOURNAL OF ENVIRONMENT & DEVELOPMENT
4. Grossman and Krueger (1995) observed that, “the reduced-form approach spares usfrom having to collect data on pollution regulations and the state of technology, data whichare not readily available and are of questionable validity” (p. 360).
Ideally, we would like to include all potential regressors of civic andpublic social capital, social divergence, and social capacity for each ofour six measures of environmental performance. Unfortunately, aninsufficient number of observations exist to include all chosen explana-tory variables. Nevertheless, Equation 1 can be estimated if all interac-tion terms are set equal to zero (i.e., set i = 0 for all i = 1, 2, . . ., n) but onlywith four of the six chosen measures of national environmental perfor-mance.5 To overcome this problem with the degrees of freedom, we canalso separately estimate coefficients for civic social capital, public socialcapital, social divergence, and social capacity with their interactionterms for each of the six measures of national environmental perfor-mance. This separate equation approach has the advantage that itenables us to use, as much as possible, the available information from thesample and allows us to estimate the interaction between social determi-nants and per capita income.
A possibility exists that the errors in the six estimated equations (oneeach for the six chosen measures of national environmental perfor-mance) might be correlated in that the error term in one equation for aparticular observation or country may be correlated in another equationfor the same country. In other words, the influence of omitted factors inone equation for a particular country may be similar to their influence inanother of the six equations for the same country. Seemingly unrelatedregression (SUR) is an alternative estimation procedure to OLS that usesinformation on the correlation across error terms for the same observa-tion or country to obtain more precise estimates. In our study, all theexplanatory variables are identical for every country and in every equa-tion. Consequently, the SUR and OLS procedures will yield identicalestimates of the coefficients, even if errors across equations arecorrelated.
In each of the estimated models we also control for the population persquare kilometer for 1998 and gross domestic product per capita con-verted to international dollars using purchasing parity rates for 1998.Summary statistics of all the data are provided in Table 1.
Grafton, Knowles / SOCIAL CAPITAL 343
5. There are 17 observations to estimate four of the models of national environmentalperformance with all regressors and 13 and 12 observations for two of the remaining mod-els. Thus, there is an insufficient number of observations to estimate Equation 1 with allregressors. By setting i = 0 for all i we are able to estimate a reduced form of Equation 1with no interaction terms for the models with 17 observations each but are unable even todo this for the two models with 13 (urban sulfur dioxide concentrations) and 12 (urbantotal suspended particulate matter concentrations) observations.

Tabl
e 1
Su
mm
ary
Sta
tist
ics
of th
e 53
-Cou
ntr
y S
amp
le D
ata
Max
imum
No.
Var
iabl
eM
SDof
Obs
.So
urce
Per
iod
Impa
ct
Env
iron
men
tal p
erfo
rman
ceE
SI55
.883
11.9
6752
GLT
ET
F (2
001)
2001
+SY
S53
.475
17.5
5452
GLT
ET
F (2
001)
2001
+SY
SA0.
209
0.83
152
GLT
ET
F (2
001)
2001
+SY
SW0.
103
0.76
152
GLT
ET
F (2
001)
2001
+SO
228
.383
27.3
9836
GLT
ET
F (2
001)
1990
-199
6–
TSP
87.2
2079
.333
34G
LTE
TF
(200
1)19
90-1
996
–So
cial
cap
ital
(civ
ic)
TR
UST
26.4
6713
.879
42In
gleh
art e
t al.
(200
0)19
95-1
997
+C
IVIC
38.6
762.
628
38In
gleh
art e
t al.
(200
0)19
95-1
997
+A
SSO
C0.
462
0.33
538
Ingl
ehar
t et a
l. (2
000)
1995
-199
7+
Soci
al c
apit
al (p
ublic
)D
EM
O4.
679
1.34
153
Seal
y (1
999)
June
199
9+
CO
RR
UP
3.49
11.
409
53Se
aly
(199
9)Ju
ne 1
999
+So
cial
div
erge
nce
EL
F30
.526
28.4
7238
Mau
ro (1
995)
1960
+L
AN
D57
.828
16.2
5732
Jaza
iry
et a
l. (1
992)
1980
-198
5+
RE
L0.
769
0.20
638
Bar
rett
(198
2)19
80–
344

345
Soci
al c
apac
ity
CA
L11
9.92
18.1
8139
GLT
ET
F (2
001)
1988
-90
+A
YS
8.05
82.
396
48B
arro
& L
ee (2
001)
2000
+C
ontr
ols
GD
PPC
12,1
058,
827
52W
orld
Ban
k (2
000)
1998
NA
POP
130.
6916
3.38
51W
orld
Ban
k (2
000)
1998
NA
Not
e:Im
pact
=+
(-)i
ndic
ates
apo
siti
ve(n
egat
ive)
rela
tion
ship
betw
een
anin
crea
sein
the
part
icul
arva
riab
lean
dit
sinf
luen
ceon
itsg
roup
cate
gory
prov
ided
und
erth
ehe
adin
gsen
viro
nmen
talp
erfo
rman
ce,s
ocia
lcap
ital
(civ
ic),
soci
alca
pita
l(pu
blic
),so
cial
div
erge
nce,
and
soci
alca
paci
ty;E
SI=
envi
ronm
enta
lsu
stai
nabi
lity
ind
ex;S
YS
=in
dex
ofqu
alit
yof
envi
ronm
enta
lsys
tem
s;SY
SA=
ind
exof
airq
ualit
y;SY
SW=
ind
exof
wat
erqu
alit
y;SO
2=
urba
nsu
lfur
dio
xid
eco
ncen
trat
ion
inth
ousa
ndm
etri
cto
nsfo
r199
0-19
96;T
SP=
urba
nto
tals
uspe
nded
part
icul
ate
conc
entr
atio
nin
thou
sand
met
ric
tons
for1
990-
1996
;TR
UST
=pe
rcen
tage
ofre
spon
den
tsre
plyi
ng“m
ostp
eopl
eca
nbe
trus
ted
”af
terd
elet
ing
“don
’tkn
ow”
resp
onse
s;C
IVIC
=in
dex
from
0to
45th
atsu
mst
here
spon
seas
tow
heth
erfi
ved
iffe
rent
beha
vior
sare
just
ifie
d;A
SSO
C=
sum
ofth
epr
opor
tion
ofpe
ople
who
are
acti
vem
embe
rsin
any
offo
urty
peso
fvol
unta
ryor
gani
za-
tion
s;D
EM
O=
6-po
ints
cale
ofd
emoc
rati
cac
coun
tabi
lity;
CO
RR
UP
=6-
poin
tsca
lem
easu
reof
corr
upti
onw
ithi
nth
epo
litic
alsy
stem
;EL
F=
ethn
olin
guis
tic
frac
tion
aliz
atio
nin
dex
;LA
ND
=la
ndin
equa
lity
Gin
icoe
ffic
ient
;RE
L=
ind
exof
relig
ious
hom
ogen
eity
;CA
L=
dai
lype
rcap
ita
calo
rie
supp
lyas
ape
rcen
tage
ofto
talr
equi
rem
ents
;AY
S=
aver
age
year
sof
scho
olin
gof
the
popu
lati
onag
e25
year
sor
old
er;G
DPP
C=
gros
sd
omes
tic
prod
uctc
onve
rted
toin
tern
atio
nal
dol
lars
usin
gpu
rcha
sing
pow
erpa
rity
rate
sfo
r19
98;P
OP
=po
pula
tion
den
sity
ofpe
ople
per
squa
reki
lom
eter
;CO
NST
AN
T=
inte
rcep
tte
rmin
OL
Sre
gres
sion
;GLT
ET
F=
Glo
balL
ead
ers
ofTo
mor
row
Env
iron
men
tTas
kFo
rce.
ESI
and
SYS
are
com
pone
ntsc
ores
give
nas
ast
and
ard
norm
alpe
rcen
tile
and
rang
efr
oma
theo
reti
call
owof
0to
ahi
ghof
100
and
are
calc
ulat
edfo
r20
01us
ing
dat
afr
omea
rlie
rpe
riod
s.E
SIis
aco
mpo
site
mea
sure
ofen
viro
nmen
tal
sust
aina
bilit
yba
sed
on22
sepa
rate
envi
ronm
enta
lind
icat
ors.
SYS
isa
com
posi
tem
easu
reba
sed
onin
dic
ator
sof
air
qual
ity,
wat
erqu
anti
ty,w
ater
qual
ity,
biod
iver
sity
,and
terr
estr
ials
yste
ms.
SYSA
and
SYSW
are
give
nas
Zsc
ores
wit
ha
zero
ind
icat
ing
the
mea
nfo
rthe
122
coun
trie
sin
the
GLT
ET
Fan
da
valu
eof
+1(
-1)r
epre
sent
ing
one
stan
dar
dd
evia
tion
abov
eor
belo
wth
em
ean.
Val
ues
are
calc
ulat
edfo
r20
01us
ing
dat
afr
omea
rlie
rpe
riod
s.SY
SAis
anin
dic
ator
base
don
mea
sure
sof
urba
nSO
2,N
O2,
and
TSP
conc
entr
atio
ns.S
YSW
isan
ind
icat
orba
sed
onm
easu
res
ofd
isso
lved
oxyg
en,p
hosp
horo
usco
ncen
trat
ion,
susp
end
edso
lids,
and
elec
tric
alco
nduc
tivi
ty.S
O2
isur
ban
conc
entr
atio
nof
sulf
urd
ioxi
de
inth
ousa
ndso
fmet
ric
tons
and
TSP
isur
ban
tota
lsus
pend
edpa
r-ti
cula
teco
ncen
trat
ion
inth
ousa
ndso
fmet
ric
tons
asgi
ven
inA
nnex
6of
the
GLT
ET
F.W
ithi
nea
chco
untr
yth
eva
lues
wer
eno
rmal
ized
byci
typo
pula
tion
for
the
year
1995
and
sum
med
acro
ssci
ties
toob
tain
ato
talc
ount
ryco
ncen
trat
ion.
CA
Lis
dai
lype
rcal
orie
inta
keas
ape
rcen
tage
ofto
talr
equi
rem
ents
asgi
ven
inA
nnex
6 o
f the
GLT
ET
F.

Measuring Social Determinants andEnvironmental Performance
ENVIRONMENTAL PERFORMANCE
The six chosen measures of national environmental performancecome from an important data set compiled by the Global Leaders ofTomorrow Environment Task Force (GLTETF) with the collaboration ofthe Yale Center for Environmental Law and Policy and the Center forInternational Earth Science Information Network at Columbia Univer-sity. Collectively, the measures provide indicators of national environ-mental quality that are comparable across countries.
The national environmental performance variables used in the studyinclude (a) an overall environmental sustainability index (ESI) based on22 core indicators in 2001; (b) a measure of the state of environmentalsystems comprised of air quality, water quality and quantity, biodiver-sity, and terrestrial system variables (SYS); (c) an air quality index(SYSA); (d) a water quality index (SYSW); (e) urban concentrations ofsulfur dioxide for the period of 1990 to 1996 (SO2); and (f) urban concen-trations of total suspended particulate matter for the period of 1990 to1996 (TSP).6
For the measures ESI, SYS, SYSA, and SYSW, higher values representbetter levels of environmental performance, although for SO2 and TSPthe reverse is true (GLTETF, 2001). Simple correlations between the sixmeasures of environmental performance are provided in Table 2. Thecorrelations indicate, as we would expect, collinear relationships amongseveral of the measures of environmental performance. Nevertheless,substantial differences also exist among some of the indicators that sug-gest it is important to include all six regressands in tests of the effects ofsocial capital (civic and social), social divergence, and social capacity onnational environmental performance.
SOCIAL CAPITAL
In cross-country studies, social capital variables are typicallyobtained from the World Values Survey (WVS; Inglehart et al., 2000. Thissurvey asks a sample of individuals in a population a variety of ques-tions to quantify their values and ethics for comparative purposes. TheWVS sample includes 24 countries for 1981, 45 countries for 1990 to 1991,and 55 countries for 1995 to 1997.
346 JOURNAL OF ENVIRONMENT & DEVELOPMENT
6. Further details about the variables are provided in Table 1. Adetailed description ofthe indicators and data sources is given in Global Leaders of Tomorrow Environment TaskForce (2001) and the associated annexes.

Three variables are used from the WVS to test for a relationshipbetween aggregate measures of civic social capital and national environ-mental performance. These regressors are from the 1995 to 1997 surveyand include the percentage of respondents who agree with the statementthat “most people can be trusted” after deleting “don’t know” responses(i.e., TRUST). The second variable, CIVIC, is an index where respon-dents were asked to respond on a scale of 1 to 10, where 1 indicates thebehavior is never justified and 10 indicates the behavior is always justi-fied. The five behaviors include (a) claiming a government benefit towhich you are not entitled, (b) avoiding paying for public transport, (c)cheating on taxes if you have the chance, (d) buying something that youknew was stolen, and (e) accepting a bribe in the course of one’s duties.In our analysis the reported values of CIVIC were transformed such thatthe raw score was subtracted from 50 so that a value of 45 indicates thehighest possible level of social capital and a score of 0 indicates the low-est level. Athird variable, ASSOC, is the sum of the proportion of peoplewho were active members in any of the four types of voluntary organiza-tions (church or religious; sports or recreation; arts, music, or educa-tional organization; or a charitable organization).
Although there is a precedent in the literature (Knack & Keefer, 1997;Zak & Knack, 2001) for using TRUST, CIVIC, and ASSOC as proxies forsocial capital, it is important to acknowledge some potential problemswith these measures. In particular, the coverage of the WVS differs sig-nificantly from country to country, and the sample in some countries isnot representative of the population as a whole.
With respect to TRUST, Glaeser, Laibson, Scheinkman, and Soutter(2000) showed that people’s answers to the trust question from the WVSare not correlated with how trusting they are of others in economic
Grafton, Knowles / SOCIAL CAPITAL 347
Table 2Simple Correlations Between the Measures of Environmental Performance
Variable ESI SYS SYSA SYSW SO2 TSP
ESI 1 0.878 0.710 0.388 –0.631 –0.711SYS 1 0.700 0.671 –0.493 –0.726SYSA 1 0.165 –0.729 –0.812SYSW 1 –0.042 –0.252SO2 1 0.536TSP 1
Note: ESI = environmental sustainability index; SYS = index of quality of environmentalsystems; SYSA = index of air quality; SYSW = index of water quality; SO2 = urban sulfurdioxide concentration in thousand metric tons for 1990-1996; TSP = urban total suspendedparticulate concentration in thousand metric tons for 1990-1996. The simple correlationcoefficients were calculated using 30 observations that represent the total number of coun-tries with observations for all six variables.

experiments. However, there is evidence of a positive correlationbetween TRUST and how trustworthy the individual is. Thus, it may bemore appropriate to interpret TRUST as a measure of trustworthinessrather than how trusting individuals are of others. The validity ofTRUST as a measure of trustworthiness is supported by an experimentconducted by Reader’s Digest. In the test, a number of wallets weredropped in various countries around the world to see how many wouldbe returned. The proportion of wallets returned may be interpreted as ameasure of trustworthiness. The correlation between TRUST (from theWVS) with the Reader’s Digest trustworthiness measure was 0.67 (Knack& Keefer, 1997). Finally, a potential weakness of the ASSOC variable isthat it only takes into account the number of associations an individualbelongs to rather than taking into account the strength of membership.For example, active membership in a volunteer fire brigade is treated asequivalent to occasional church attendance.
In addition to civic measures of social capital, public institutionalmeasures of social capital are also used in the analysis. These variablesare described in detail in the International Country Risk Guide (ICRG) andwere obtained for June 1999 (Sealy, 1999). The two variables used fromthe ICRG include a six-point scale measure of democratic accountability,DEMO, that indicates how responsive a government is to its people anda six-point scale measure of corruption, CORRUP, within the politicalsystem. For the DEMO variable, a higher score indicates more demo-cratic institutions, and for the CORRUP variable, a higher score indicateslower levels of corruption. Although they are related variables, they domeasure different aspects of public social capital. For instance, some coun-tries in our sample, such as Argentina, have high levels of democraticaccountability but also suffer from relatively high levels of corruption.
SOCIAL DIVERGENCE
Social divergence, or the social barriers to communication acrossgroups of individuals, can be measured in a number of different ways.For this analysis we use three variables, the first of which is an ELFindex, which changes very slowly over time (Grafton, Kompas, & Owen,2004) and measures the probability of two randomly selected individu-als in a country belonging to a different ethnic or linguistic group. Thedata are available for 1960 only and are described in Mauro (1995). In therobustness tests we also use alternative and more up-to-date measuresof social divergence with indicators of ethnic and religious tensionsavailable from the ICRG. The second social divergence variable chosen isa measure of wealth inequality proxied by a land inequality Gini coeffi-cient, LAND, scaled from 0 to 100, obtained from the United NationsFood and Agriculture censuses in the early and mid-1980s, and avail-able in Jazairy, Alamgir, and Panuccio (1992).7 The third proxy of social
348 JOURNAL OF ENVIRONMENT & DEVELOPMENT

divergence is a measure of religious homogeneity that represents theprobability that two randomly selected individuals have the same reli-gious affiliation, REL, for 1980 and is obtained from Barrett (1982).8
SOCIAL CAPACITY
Alarge number of variables can be used to measure social capacity, orthe ability of individuals to meet their human potential. The first vari-able chosen is daily per capita calorie supply as a percentage of totalrequirements, CAL, and is obtained from Annex 6 of the GLTETF for theperiod of 1988 to 1990. This measure is a proxy of the ability of individu-als to engage in social action to address environmental challenges. Thesecond variable used in the analysis is the average years of schooling,AYS, of the population age 25 years or older for the year 2000. AYS isobtained from Barro and Lee (2001) and is included as a measure ofhuman capital.9
Empirical Results
The empirical results for the models where all the social determinantscan be included as regressors in one model are presented first. We thenreview the findings for the models where the regressors for civic socialcapital, public social capital, social divergence, and social capacity areestimated separately. For each set of regressors (public and civic socialcapital, social divergence, and social capacity) and for all pairings of thevariables, simple correlations and auxiliary regressions were obtainedthat indicate that multicollinearity or collinear relationships among theexplanatory variables are not a major problem.
For each regression, detailed diagnostics are reported in the notes toTables 3 to 7. The Breusch-Pagan-Godfrey statistic tests whether the vari-ance differs over the sample of countries. A nonconstant variance is fre-quently encountered using cross-sectional data and affects the standarderrors of the estimated coefficients that, in turn, can result in misleadinghypothesis tests about their statistical significance. The model specifica-tion diagnostics are Ramsey (1969) tests to determine whether the model
Grafton, Knowles / SOCIAL CAPITAL 349
7. Measures of income inequality are problematic because of the limited number ofcountries for which data are available that are of high quality, reliable, and comparable. SeeKnowles (2005) for further details.
8. For a detailed discussion on social divergence and the variables used to measure it,consult Grafton, Knowles, and Owen (2002, 2004).
9. We view the average years of schooling (AYS) as a superior measure to a basic liter-acy rate. AYS provides a measure of the degree of human capital that a measure of the pro-portion of the population that are literate does not and also provides a measure with agreater dispersion.

is incorrectly specified, that may arise, for example, from omission ofkey explanatory variables or misspecification of the functional form.The Ramsey tests require us to estimate alternative models with thesame regressand, but included with the explanatory variables theregressand raised to the power of one, two, three, or four. The other diag-nostic we use is a Jarque-Bera test (Jarque & Bera, 1980) to determinewhether the errors are normally distributed and is necessary to ensurethat OLS provides the best linear unbiased estimators.
SOCIAL DETERMINANTS
For the environmental measures ESI, SYSTEM, SYSA, and SYSW,although not for SO2 or TSP, there were sufficient degrees of freedom toestimate regression models with all regressors (civic and public socialcapital, social divergence, and social capacity) but not with the interac-tion terms associated with per capita income. The results of these estima-tions are presented in Table 3 where coefficients with a probability or pvalue less than .10 are statistically significant at the 10% level of signifi-cance for a two-tailed test. Only the coefficient for the variable DEMOwhere the regressand is a national measure of water quality (SYSW) isboth statistically significant at the 10% level of significance and has abeneficial effect on environmental performance.
Table 3 shows that the coefficient for population density has theexpected sign and is statistically significant in all models except where anational air quality index is the regressand (SYSA). The coefficient forper capita income is statistically significant and positive in the modelswhere overall system quality and a water quality index are the depend-ent variables. Overall, the results do not provide support for the hypoth-esis that higher levels of civic social capital or social capacity and lowerlevels of social divergence have a positive effect on national environ-mental performance.
Our initial findings are examined further in models where we sepa-rately regress the six measures of environmental performance against asubset of the four groups of social determinants. This approach enablesus to estimate models with a much larger sample of countries and thususe, as much as possible, the available information from the sample. Italso permits us to test for interaction effects between the social determi-nants and per capita income.
CIVIC SOCIAL CAPITAL
Table 4 gives the OLS results of the regressions of interest. The resultsshow that for the models where SYSA and SO2 are the regressands wefail to reject the null hypothesis that all the coefficients, except the inter-
350 JOURNAL OF ENVIRONMENT & DEVELOPMENT

cept, are zero. This questions the validity of these models to explaincross-national differences in environmental performance.
The hypothesis we test in the models in Table 4 is that higher levels ofcivic social capital are associated with better environmental perfor-mance and that this effect is accentuated at higher levels of per capitaincome. For the three individual measures of civic social capital only thecoefficient for the variable CIVIC in the ESI and SYS models is both sta-tistically significant and has a beneficial effect on national environmen-tal performance. It is surprising that the coefficients of the variablesTRUST and ASSOC are statistically significant but have a detrimentaleffect on measures of overall ESI and the SYS. This contrary result is alsofound for the coefficient for CIVIC where an overall SYSW is theregressand. Overall, the results indicate that, at best, only the CIVICmeasure has a positive effect on national environmental performance,
Grafton, Knowles / SOCIAL CAPITAL 351
Table 3Estimates of Effects of Social Determinants on Environmental Performance
Variable ESI SYS SYSA SYSW
TRUST 0.032 0.212 0.365E-2 0.012(0.855) (0.276) (0.861) (0.154)
CIVIC 0.216 –0.809 0.0126 –0.216(0.881) (0.590) (0.941) (0.081)
ASSOC –16.352 –37.719 –1.502 0.830(0.324) (0.064) (0.435) (0.454)
DEMO –3.736 –0.422 –0.013 0.584(0.388) (0.920) (0.979) (0.093)
CORRUP 5.077 –1.894 0.371 –0.943(0.255) (0.650) (0.456) (0.022)
ELF 0.056 0.113 0.908E-2 0.011(0.413) (0.149) (0.285) (0.069)
LAND –0.0765 0.223 0.023 –0.812E-2(0.612) (0.186) (0.234) (0.445)
REL –15.739 13.792 0.308 0.525(0.169) (0.255) (0.797) (0.463)
CAL 0.187 –1.007 –0.041 –0.151(0.788) (0.205) (0.622) (0.028)
AYS –3.360 –6.506 –0.249 –0.641(0.211) (0.408) (0.407) (0.015)
GDPPC 0.16E-2 0.42E-02 0.173E-03 0.304E-03(0.227) (0.023) (0.270) (0.018)
POP –0.060 –0.128 0.276E-03 –0.911E-02(0.012) (0.001) (0.876) (0.001)
CONSTANT 65.698 210.32 1.592 27.108(0.585) (0.137) (0.910) (0.024)
(continued)

and there is no evidence that either TRUST or ASSOC individuallyimprove environmental quality.
PUBLIC SOCIAL CAPITAL
The two measures of public social capital represent risk ratings thatassess the political stability, responsiveness, and effectiveness of govern-ments developed by the ICRG system. The results for the models withsocial capital (public) as the explanatory variables are given in Table 5.
352 JOURNAL OF ENVIRONMENT & DEVELOPMENT
Adj. R2 .912 .961 .763 .920No. obs. 17 17 17 17F stat. [k-1,n-k df] 14.826* 33.79* 5.284* 16.28*HeteroscedasticityBPG stat. [k-1 df] 11.735 7.909 11.665 5.201
SpecificationRESET(2) [1,n-k-1 df] 2.2924 0.117 0.2058 0.92804RESET(3) [2,n-k-2 df] 0.8787 11.256 6.5643 0.50193RESET(4) [3,n-k-3 df] 1.0568 5.599 8.4815 0.22501
NormalityJarque-Bera stat. [2 df] 2.222 0.422 0.4217 1.6794
Note: TRUST = percentage of respondents replying “most people can be trusted” afterdeleting “don’t know” responses; CIVIC = index from 0 to 45 that sums the response as towhether five different behaviors are justified; ASSOC = sum of the proportion of peoplewho are active members in any of four types of voluntary organizations; DEMO = 6-pointscale of democratic accountability; CORRUP = 6-point scale measure of corruption withinthe political system; ELF = ethnolinguistic fractionalization index; LAND = land inequalityGini coefficient; REL = index of religious homogeneity; CAL = daily per capita calorie sup-ply as a percentage of total requirements; AYS = average years of schooling of the popula-tion age 25 years or older; GDPPC = gross domestic product converted to international dol-lars using purchasing power parity rates for 1998; POP = population density of people persquare kilometer; CONSTANT = intercept term in OLS regression; k = number ofregressors; n = number of observations; df = degrees of freedom. p values are in bracketswhere if it is smaller than the chosen level of significance (.10) then we reject the two-tailedtest that the estimated coefficient is equal to zero. Test statistics that indicate we shouldreject the null hypothesis at the 5% level of significance are denoted by *. The F-test statisticis for a null hypothesis that the coefficients of all the regressors, except the constant term,are equal to zero. The BPG test statistic is for the null hypothesis of homoscedasticity andconverges to a chi-square distribution if the null is true. The RESET tests are for the nullhypothesis that the coefficients of the regressors in alternative model specifications are allzero and have an F distribution if the null is true. The Jarque-Bera test statistic is for the nullhypothesis that the errors are normally distributed and converges to a chi-square distribu-tion if the null is true. E-i denotes that the coefficient is multiplied by 10-i.
Table 3 (continued)
Variable ESI SYS SYSA SYSW
(text continues on p. 357)

353
Tabl
e 4
Est
imat
es o
f th
e E
ffec
ts o
f C
ivic
Soc
ial
Cap
ital
on
En
viro
nm
enta
l Per
form
ance
Var
iabl
eE
SISY
SSY
SASY
SWSO
2T
SP
TR
UST
–0.3
23–1
.288
0.01
20.
012
0.63
73.
181
(0.0
86)
(0.0
03)
(0.4
36/
0.36
0)(0
.154
)(0
.632
/0.
512)
(0.1
96)
CIV
IC2.
234
4.34
40.
109
–0.2
16–6
.406
–3.4
09(0
.005
)(0
.013
)(0
.295
/0.
346)
(0.0
81)
(0.2
72/
0.12
8)(0
.748
)A
SSO
C–1
2.73
9–2
0.27
6–1
.105
0.83
06.
705
154.
03(0
.017
)(0
.078
)(0
.124
/0.
255)
(0.4
54)
(0.8
60/
0.85
5)(0
.104
)T
RU
ST*G
DPP
C0.
242E
-40.
793E
-4–0
.129
E-5
0.58
4–0
.348
E-4
–0.7
44E
-4(0
.038
)(0
.003
)(0
.409
/0.
271)
(0.0
93)
(0.6
41/
0.46
8)(0
.597
)C
IVIC
*GD
PPC
–0.2
16E
-3–0
.318
E-3
–0.8
40E
-5–0
.943
0.33
3E-3
0.60
1E-3
(0.0
09)
(0.0
68)
(0.4
32/
0.30
4)(0
.022
)(0
.500
/0.
197)
(0.5
67)
ASS
OC
*GD
PPC
0.36
9E-3
0.41
2E-3
0.32
2E-4
0.01
1–0
.105
E-3
–0.1
79E
-2(0
.349
)(0
.633
)(0
.394
/0.
526)
(0.0
69)
(0.9
65/
0.94
7)(0
.781
)G
DPP
C0.
877E
-20.
011
0.33
6E-0
30.
304E
-03
–0.0
14–0
.319
(0.0
04)
(0.0
86)
(0.3
94/
0.22
4)(0
.018
)(0
.461
/0.
136)
(0.4
30)
POP
–0.2
34–0
.047
0.18
6E-0
3–0
.911
E-0
2–0
.020
0.26
6(0
.001
)(0
.002
)(0
.833
/0.
756)
(0.0
01)
(0.7
40/
0.64
4)(0
.044
)C
ON
STA
NT
–6.5
86–7
8.12
6–3
.656
27.1
0827
8.50
187.
35(0
.309
)(0
.178
)(0
.313
/0.
321)
(0.0
24)
(0.1
77/
0.06
8)(0
.621
) (con
tinu
ed)

Ad
j.R
2.7
98.5
11.2
13.4
37.0
00.5
68N
o. O
bs.
3535
3535
2121
Fst
at. [
k-1,
n-k
df]
17.7
43*
5.44
2*2.
147
4.29
4*0.
976
4.28
8*H
eter
osce
dast
icit
yB
PG s
tat.
[k-1
df]
3.99
27.
979
10.3
53*
11.3
515
.345
*5.
188
Spec
ifica
tion
RE
SET
(2) [
1,n-
k-1
df]
0.01
381.
4232
0.73
354.
2688
0.17
30.
0564
RE
SET
(3) [
2,n-
k-2
df]
0.73
595.
5550
0.86
052.
1448
1.74
42.
514
RE
SET
(4) [
3,n-
k-3
df]
0.55
584.
0321
0.67
263.
3911
4.34
42.
4909
Nor
mal
ity
Jarq
ue-B
era
stat
. [2
df]
1.17
546.
4509
*35
.252
1*0.
8596
2.29
40.
0483
Not
e:T
RU
ST=
perc
enta
geof
resp
ond
ents
repl
ying
“mos
tpeo
ple
can
betr
uste
d”
afte
rd
elet
ing
“don
’tkn
ow”
resp
onse
s;C
IVIC
=in
dex
from
0to
45th
atsu
mst
here
spon
seas
tow
heth
erfi
ved
iffe
rent
beha
vior
sar
eju
stif
ied
;ASS
OC
=su
mof
the
prop
orti
onof
peop
lew
hoar
eac
tive
mem
bers
inan
yof
four
type
sof
volu
ntar
yor
gani
zati
ons;
GD
PPC
=gr
ossd
omes
ticp
rod
uctc
onve
rted
toin
tern
atio
nald
olla
rsus
ing
purc
hasi
ngpo
wer
pari
tyra
tesf
or19
98;P
OP
=po
pula
-ti
ond
ensi
tyof
peop
lepe
rsq
uare
kilo
met
er;C
ON
STA
NT
=in
terc
eptt
erm
inO
LS
regr
essi
on;k
=nu
mbe
rof
regr
esso
rs;n
=nu
mbe
rof
obse
rvat
ions
;df=
deg
rees
offr
eed
om.p
valu
esar
ein
brac
kets
whe
reif
itis
smal
lert
han
the
chos
enle
velo
fsig
nifi
canc
e(.1
0)th
enw
ere
ject
the
two-
taile
dte
stth
atth
ees
tim
ated
coef
fici
enti
sequ
alto
zero
.Est
imat
edco
effi
cien
tsfo
rthe
SYSA
and
S02
mod
elsh
ave
two
sets
ofp
valu
esw
ith
the
seco
ndse
tcal
cula
ted
usin
gW
hite
’sm
etho
dto
corr
ectf
oran
unkn
own
form
ofhe
tero
sced
asti
city
.Tes
tsta
tist
icst
hati
ndic
ate
we
shou
ldre
ject
the
null
hypo
thes
isat
the
5%le
velo
fsig
nifi
canc
ear
ed
enot
edby
*.T
heF-
test
stat
isti
cis
fora
null
hypo
thes
isth
atth
eco
effi
cien
tsof
allt
here
gres
sors
,exc
eptt
heco
nsta
ntte
rm,a
reeq
ualt
oze
ro.T
heB
PGte
stst
atis
tic
isfo
rth
enu
llhy
poth
esis
ofho
mos
ced
asti
city
and
conv
erge
sto
ach
i-sq
uare
dis
trib
utio
nif
the
null
istr
ue.T
heR
ESE
Tte
stsa
refo
rthe
null
hypo
thes
isth
atth
eco
effi
-ci
ents
ofth
ere
gres
sors
inal
tern
ativ
em
odel
spec
ific
atio
nsar
eal
lzer
oan
dha
vean
Fd
istr
ibut
ion
ifth
enu
llis
true
.The
Jarq
ue-B
era
test
stat
isti
cis
fort
henu
llhy
poth
esis
that
the
erro
rsar
eno
rmal
lyd
istr
ibut
edan
dco
nver
gest
oa
chi-
squa
red
istr
ibut
ion
ifth
enu
llis
true
.E-i
den
otes
that
the
coef
fici
enti
smul
tipl
ied
by10
-i.
354
Tabl
e 4
(con
tinu
ed)
Var
iabl
eE
SISY
SSY
SASY
SWSO
2T
SP

Tabl
e 5
Est
imat
es o
f th
e E
ffec
ts o
f P
ub
lic
Soc
ial C
apit
al o
n E
nvi
ron
men
tal P
erfo
rman
ce
Var
iabl
eE
SISY
SSY
SASY
SWSO
2T
SP
DE
MO
1.66
00.
344
0.13
50.
084
–11.
201
2.31
0(0
.254
)(0
.914
)(0
.409
)(0
.620
)(0
.097
/0.
059)
(0.9
14/
0.04
5)C
OR
RU
P–1
.546
–5.2
73–0
.061
–0.1
67–1
4.38
0–2
3.06
5(0
.400
)(0
.195
)(0
.768
)(0
.435
)(0
.149
/0.
173)
(0.4
70/
0.57
5)D
EM
O*G
DPP
C–0
.126
E-3
0.36
4E-4
–0.3
05E
-5–0
.150
E-4
0.80
1E-3
0.75
3E-3
(0.4
38)
(0.9
19)
(0.8
68)
(0.4
32)
(0.1
69/
0.00
6)(0
.754
/0.
739)
CO
RR
UP*
GD
PPC
0.23
12E
-30.
431E
-40.
112E
-40.
140E
-40.
473E
-40.
100E
-2(0
.038
)(0
.085
)(0
.375
)(0
.284
)(0
.354
/0.
314)
(0.5
92/
0.60
2)G
DPP
C0.
680E
-3–0
.942
E-3
0.78
9E-0
50.
241E
-04
–0.7
16E
-2–0
.014
(0.3
50)
(0.5
55)
(0.9
23)
(0.7
76)
(0.0
12/
0.00
0)(0
.165
/0.
140)
POP
–0.0
249
–0.0
44–0
.232
E-0
3–0
.189
E-0
2–0
.032
0.16
67(0
.000
)(0
.001
)(0
.723
)(0
.007
)(0
.225
/0.
166)
(0.0
86/
0.05
9)C
ON
STA
NT
45.2
2863
.415
–0.6
390.
495
148.
3221
9.84
(0.0
00)
(0.0
00)
(0.3
08)
(0.4
44)
(0.0
00/
0.00
0)(0
.010
/0.
034)
Ad
j.R
2.7
24.3
62.2
65.0
69.5
51.3
54N
o. O
bs.
5151
5151
3533
Fst
at. [
k-1,
n-k
df]
22.8
14*
5.71
7*4.
008*
1.61
87.
953*
3.92
0*H
eter
osce
dast
icit
yB
PG s
tat.
[k-1
df]
11.8
514.
382
8.29
53.
054
22.9
58*
13.0
71*
355
(con
tinu
ed)

Spec
ifica
tion
RE
SET
(2) [
1,n-
k-1
df]
3.01
865.
9188
*0.
3948
23.8
07*
0.52
384.
5387
*R
ESE
T(3
) [2,
n-k-
2df
]5.
9622
*5.
4155
*0.
3641
12.2
82*
0.26
452.
2432
RE
SET
(4) [
3,n-
k-3
df]
4.52
604.
3568
*1.
977
8.06
31*
0.25
651.
6722
Nor
mal
ity
Jarq
ue-B
era
stat
. [2
df]
2.08
841.
3648
65.0
03*
0.85
960.
9951
3.67
07
Not
e:D
EM
O=
6-po
int
scal
eof
dem
ocra
tic
acco
unta
bilit
y;C
OR
RU
P=
6-po
int
scal
em
easu
reof
corr
upti
onw
ithi
nth
epo
litic
alsy
stem
;GD
PPC
=gr
oss
dom
esti
cpr
oduc
tcon
vert
edto
inte
rnat
iona
ldol
lars
usin
gpu
rcha
sing
pow
erpa
rity
rate
sfor
1998
;PO
P=
popu
lati
ond
ensi
tyof
peop
lepe
rsqu
are
kilo
met
er;
CO
NST
AN
T=
inte
rcep
tter
min
OL
Sre
gres
sion
;k=
num
bero
freg
ress
ors;
n=
num
bero
fobs
erva
tion
s;df
=d
egre
esof
free
dom
.pva
lues
are
inbr
acke
tsw
here
ifit
issm
alle
rtha
nth
ech
osen
leve
lofs
igni
fica
nce
(.10)
then
we
reje
ctth
etw
o-ta
iled
test
that
the
esti
mat
edco
effi
cien
tis
equa
lto
zero
.Est
imat
edco
effi
cien
tsfo
rth
eS0
2an
dT
SPm
odel
sha
vetw
ose
tsof
pva
lues
wit
hth
ese
cond
set
calc
ulat
edus
ing
Whi
te’s
met
hod
toco
rrec
tfo
ran
unkn
own
form
ofhe
tero
sced
asti
city
.Tes
tsta
tist
icst
hati
ndic
ate
we
shou
ldre
ject
the
null
hypo
thes
isat
the
5%le
velo
fsig
nifi
canc
ear
ed
enot
edby
*.T
heF-
test
stat
isti
cis
fort
henu
llhy
poth
esis
that
the
coef
fici
ents
ofal
lth
ere
gres
sors
,exc
ept
the
cons
tant
term
,are
equa
lto
zero
.The
BPG
test
stat
isti
cis
for
the
null
hypo
thes
isof
hom
osce
das
tici
tyan
dco
nver
gest
oa
chi-
squa
red
istr
ibut
ion
ifth
enu
llis
true
.The
RE
SET
test
sare
fort
henu
llhy
poth
esis
that
the
coef
fici
ents
ofth
ere
gres
sors
inal
tern
ativ
em
odel
spec
ific
atio
nsar
eal
lzer
oan
dha
vean
Fd
istr
ibut
ion
ifth
enu
llis
true
.The
Jarq
ue-B
era
test
stat
isti
cis
for
the
null
hypo
thes
isth
atth
eer
rors
are
nor
mal
ly d
istr
ibut
ed a
nd c
onve
rges
to a
chi
-squ
are
dis
trib
utio
n if
the
null
is tr
ue. E
-id
enot
es th
at th
e co
effi
cien
t is
mul
tipl
ied
by
10-i.
356
Tabl
e 5
(con
tinu
ed)
Var
iabl
eE
SISY
SSY
SASY
SWSO
2T
SP

The diagnostic tests indicate possible misspecification for the modelswhen ESI, SYS, and SYSW are the regressands, and for the SYSW modelwe fail to reject the null hypothesis that all the coefficients, except theintercept, are equal to zero.
Table 5 indicates that improvements in democratic accountabilityreduce SO2 and that there may be a complementary relationshipbetween government honesty and per capita income in models whereESI and SYS are the dependent variables. Correcting for an unknownform of heteroscedasticity in the model where SO2 is the regressand alsorenders the coefficient for the interaction term between democraticaccountability and per capita income significant at the 1% level of signif-icance. This result, however, is puzzling because it implies that the bene-ficial effect of democracy on SO2 declines with per capita income.
The effect of democracy on environmental performance is a weakresult in that it is only found in the SO2 model and not in the other fivemeasures of environmental performance. Our findings, however, arenot inconsistent with mixed results found where democracy is anexplanatory variable in models that explain environmental outcomes(Neumayer, 2002). Nevertheless, we would expect that if democracywere to have a beneficial effect on the environment it would be morelikely for easily monitored and visible forms of pollution that have animmediate and local effect such as sulfur dioxide, rather than for stockpollutants such as carbon dioxide, where the negative consequencesmay not be felt for many years into the future. In summary, the results donot indicate a broad-based beneficial relationship between public socialcapital and national environmental performance.
SOCIAL DIVERGENCE
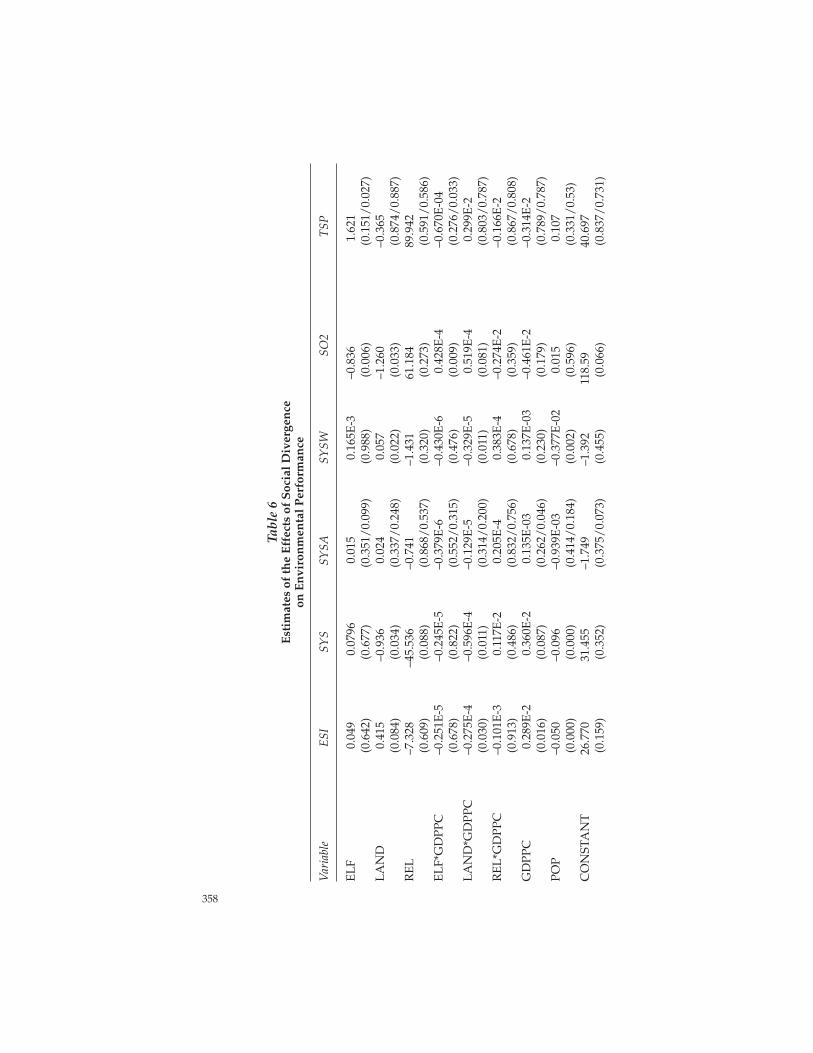
Table 6 provides the results of the regressions with the social diver-gence regressors. In all of the models we do not find a statistically signifi-cant beneficial relationship such that lower levels of social divergence(decrease in ELF and LAND and rise in REL) improve national environ-mental performance with the exception of the coefficient for landinequality where SYS is the regressand. In the model with SYS as thedependent variable, it also appears that the negative effect of landinequality on environmental systems appears to be accentuated with arise in per capita income.
Correcting for an unknown form of heteroscedasticity in the modelswith SYSA and TSP renders the coefficient for ELF statistically signifi-cant. This implies that reducing ELF worsens air pollution as measuredby an air quality index and urban total suspended particulate matter. In
Grafton, Knowles / SOCIAL CAPITAL 357
(text continues on p. 362)
Tabl
e 6
Est
imat
es o
f th
e E
ffec
ts o
f S
ocia
l Div
erge
nce
on E
nvi
ron
men
tal P
erfo
rman
ce
Var
iabl
eE
SISY
SSY
SASY
SWSO
2T
SP
EL
F0.
049
0.07
960.
015
0.16
5E-3
–0.8
361.
621
(0.6
42)
(0.6
77)
(0.3
51/
0.09
9)(0
.988
)(0
.006
)(0
.151
/0.
027)
LA
ND
0.41
5–0
.936
0.02
40.
057
–1.2
60–0
.365
(0.0
84)
(0.0
34)
(0.3
37/
0.24
8)(0
.022
)(0
.033
)(0
.874
/0.
887)
RE
L–7
.328
–45.
536
–0.7
41–1
.431
61.1
8489
.942
(0.6
09)
(0.0
88)
(0.8
68/
0.53
7)(0
.320
)(0
.273
)(0
.591
/0.
586)
EL
F*G
DPP
C–0
.251
E-5
–0.2
45E
-5–0
.379
E-6
–0.4
30E
-60.
428E
-4–0
.670
E-0
4(0
.678
)(0
.822
)(0
.552
/0.
315)
(0.4
76)
(0.0
09)
(0.2
76/
0.03
3)L
AN
D*G
DPP
C–0
.275
E-4
–0.5
96E
-4–0
.129
E-5
–0.3
29E
-50.
519E
-40.
299E
-2(0
.030
)(0
.011
)(0
.314
/0.
200)
(0.0
11)
(0.0
81)
(0.8
03/
0.78
7)R
EL
*GD
PPC
–0.1
01E
-30.
117E
-20.
205E
-40.
383E
-4–0
.274
E-2
–0.1
66E
-2(0
.913
)(0
.486
)(0
.832
/0.
756)
(0.6
78)
(0.3
59)
(0.8
67/
0.80
8)G
DPP
C0.
289E
-20.
360E
-20.
135E
-03
0.13
7E-0
3–0
.461
E-2
–0.3
14E
-2(0
.016
)(0
.087
)(0
.262
/0.
046)
(0.2
30)
(0.1
79)
(0.7
89/
0.78
7)PO
P–0
.050
–0.0
96–0
.939
E-0
3–0
.377
E-0
20.
015
0.10
7(0
.000
)(0
.000
)(0
.414
/0.
184)
(0.0
02)
(0.5
96)
(0.3
31/
0.53
)C
ON
STA
NT
26.7
7031
.455
–1.7
49–1
.392
118.
5940
.697
(0.1
59)
(0.3
52)
(0.3
75/
0.07
3)(0
.455
)(0
.066
)(0
.837
/0.
731)
358

Ad
j.R
2.7
43.5
96.2
46.4
49.5
97.3
98N
o. O
bs.
3131
3131
2523
Fst
at. [
k-1,
n-k
df]
11.8
4*6.
525*
2.22
53.
941
5.45
0*2.
819*
Het
eros
ceda
stic
ity
BPG
sta
t. [k
-1df
]11
.654
7.14
618
.669
*7.
729
9.68
728
.094
*Sp
ecifi
cati
onR
ESE
T(2
) [1,
n-k-
1df
]0.
4902
0.03
960.
0780
5.44
99*
12.7
94*
0.03
42R
ESE
T(3
) [2,
n-k-
2df
]0.
2696
0.05
212.
1048
12.2
06*
6.83
690.
9218
RE
SET
(4) [
3,n-
k-3
df]
0.31
610.
1598
1.44
828.
8868
*6.
1421
0.82
76N
orm
alit
yJa
rque
-Ber
a st
at. [
2df
]0.
4122
0.09
7150
.644
3*0.
2820
0.76
6625
.076
*
Not
e:E
LF
=et
hnol
ingu
isti
cfr
acti
onal
izat
ion
ind
ex;L
AN
D=
land
ineq
ualit
yG
inic
oeff
icie
nt;R
EL
=in
dex
ofre
ligio
usho
mog
enei
ty;G
DPP
C=
gros
sdom
es-
tic
prod
uct
conv
erte
dto
inte
rnat
iona
ld
olla
rsus
ing
purc
hasi
ngpo
wer
pari
tyra
tes
for
1998
;PO
P=
popu
lati
ond
ensi
tyof
peop
lepe
rsq
uare
kilo
met
er;
CO
NST
AN
T=
inte
rcep
tter
min
OL
Sre
gres
sion
;k=
num
bero
freg
ress
ors;
n=
num
bero
fobs
erva
tion
s;df
=d
egre
esof
free
dom
.pva
lues
are
inbr
acke
tsw
here
ifit
issm
alle
rtha
nth
ech
osen
leve
lofs
igni
fica
nce
(.10)
then
we
reje
ctth
etw
o-ta
iled
test
that
the
esti
mat
edco
effi
cien
tis
equa
lto
zero
.Est
imat
edco
effi
cien
tsfo
rth
eSY
SAan
dT
SPm
odel
sha
vetw
ose
tsof
pva
lues
wit
hth
ese
cond
set
calc
ulat
edus
ing
Whi
te’s
met
hod
toco
rrec
tfo
ran
unkn
own
form
ofhe
tero
sced
asti
city
.Tes
tsta
tist
ics
that
ind
icat
ew
esh
ould
reje
ctth
enu
llhy
poth
esis
atth
e5%
leve
lofs
igni
fica
nce
are
den
oted
by*.
The
F-te
stst
atis
tic
isfo
ra
null
hypo
thes
isth
atth
eco
effi
cien
tsof
all
the
regr
esso
rs,e
xcep
tth
eco
nsta
ntte
rm,a
reeq
ual
toze
ro.T
heB
PGte
stst
atis
tic
isfo
rth
enu
llhy
poth
esis
ofho
mos
ced
asti
city
and
conv
erge
sto
ach
i-sq
uare
dis
trib
utio
nif
the
null
istr
ue.T
heR
ESE
Tte
stsa
refo
rthe
null
hypo
thes
isth
atth
eco
effi
cien
tsof
the
regr
esso
rsin
alte
rnat
ive
mod
elsp
ecif
icat
ions
are
allz
ero
and
have
anF
dis
trib
utio
nif
the
null
istr
ue.T
heJa
rque
-Ber
ate
stst
atis
tic
isfo
rth
enu
llhy
poth
esis
that
the
erro
rs a
re n
orm
ally
dis
trib
uted
and
con
verg
es to
a c
hi-s
quar
e d
istr
ibut
ion
if th
e nu
ll is
true
. E-i
den
otes
that
the
coef
fici
ent i
s m
ulti
plie
d b
y 10
-i.
359

Tabl
e 7
Est
imat
es o
f th
e E
ffec
ts o
f S
ocia
l Cap
acit
y on
En
viro
nm
enta
l Per
form
ance
Var
iabl
eE
SISY
SSY
SASY
SWSO
2T
SP
CA
L–0
.020
–0.5
69–0
.024
–0.0
221.
369
0.66
9(0
.884
)(0
.069
)(0
.168
/0.
144)
(0.2
40)
(0.0
26/
0.00
4)(0
.766
)A
YS
–1.0
67–1
.779
–0.0
69–0
.86E
-2–1
0.79
3–1
.067
(0.2
67)
(0.4
09)
(0.5
74/
0.42
3)(0
.948
)(0
.190
/0.
030)
(0.9
56)
CA
L*G
DPP
C–0
.221
E-4
–0.1
08E
-40.
291E
-6–0
.143
E-6
–0.4
95E
-40.
892E
-4(0
.017
)(0
.589
)(0
.798
/0.
736)
(0.9
07)
(0.1
44/
0.04
3)(0
.513
)A
YS*
GD
PPC
0.10
2E-4
0.27
6E-4
–0.6
43E
-60.
110E
-60.
703E
-30.
972E
-03
(0.8
62)
(0.8
35)
(0.9
32/
0.91
9)(0
.989
)(0
.010
/0.
012)
(0.4
27)
GD
PPC
0.41
7E-2
0.31
9E-2
0.74
0E-0
40.
345E
-04
–0.2
44E
-2–0
.030
(0.0
01)
(0.2
18)
(0.6
12/
0.48
1)(0
.826
)(0
.559
/0.
547)
(0.1
10)
POP
–0.0
23–0
.489
E-2
–0.2
05E
-03
–0.2
11E
-02
0.03
80.
130
(0.0
00)
(0.0
00)
(0.7
68/
0.62
7)(0
.008
)(0
.152
/0.
152)
(0.0
7)C
ON
STA
NT
51.4
0511
4.8
2.23
52.
870
–21.
262
144.
91(0
.000
)(0
.000
)(0
.172
/0.
089)
(0.1
06)
(0.7
08/
0.70
2)(0
.454
)
360

Ad
j.R
2.8
00.5
76.3
80.1
77.5
31.4
75N
o. O
bs.
3838
3838
3127
Fst
at. [
k-1,
n-k
df]
25.6
7*9.
389*
4.78
7*2.
323
6.66
1*4.
92*
Het
eros
ceda
stic
ity
BPG
sta
t. [k
-1df
]15
.863
8.76
212
.759
*2.
855
21.5
88*
9.86
0Sp
ecifi
cati
onR
ESE
T(2
) [1,
n-k-
1df
]10
.311
*5.
9808
2.54
0521
.093
*0.
228
4.04
43R
ESE
T(3
) [2,
n-k-
2df
]11
.628
*3.
7896
1.82
0210
.389
*1.
8165
1.94
47R
ESE
T(4
) [3,
n-k-
3df
]7.
7205
*3.
4863
1.18
796.
6946
*3.
3093
1.24
12N
orm
alit
yJa
rque
-Ber
a st
at. [
2df
]0.
3631
0.79
9010
.822
3*2.
8292
1.67
842.
6397
Not
e:C
AL
=d
aily
perc
apit
aca
lori
esu
pply
asa
perc
enta
geof
tota
lreq
uire
men
ts;A
YS
=av
erag
eye
ars
ofsc
hool
ing
ofth
epo
pula
tion
age
25ye
ars
orol
der
;G
DPP
C=
gros
sd
omes
tic
prod
uctc
onve
rted
toin
tern
atio
nald
olla
rsus
ing
purc
hasi
ngpo
wer
pari
tyra
tes
for
1998
;PO
P=
popu
lati
ond
ensi
tyof
peop
lepe
rsq
uare
kilo
met
er;C
ON
STA
NT
=in
terc
eptt
erm
inO
LS
regr
essi
on;k
=nu
mbe
rofr
egre
ssor
s;n
=nu
mbe
rofo
bser
vati
ons;
df=
deg
rees
offr
eed
om.p
valu
esar
ein
brac
kets
whe
reif
itis
smal
lert
han
the
chos
enle
velo
fsig
nifi
canc
e(0
.10)
then
we
reje
ctth
etw
o-ta
iled
test
that
the
esti
mat
edco
effi
cien
tise
qual
toze
ro.E
sti-
mat
edco
effi
cien
tsfo
rthe
SYSA
and
SO2
mod
elsh
ave
two
sets
ofp
valu
esw
ith
the
seco
ndse
tcal
cula
ted
usin
gW
hite
’sm
etho
dto
corr
ectf
oran
unkn
own
form
ofhe
tero
sced
asti
city
.Tes
tsta
tist
icst
hati
ndic
ate
we
shou
ldre
ject
the
null
hypo
thes
isat
the
5%le
velo
fsig
nifi
canc
ear
ed
enot
edby
*.T
heF-
test
stat
isti
cis
fora
null
hypo
thes
isth
atth
eco
effi
cien
tsof
all
the
regr
esso
rs,e
xcep
tth
eco
nsta
ntte
rm,a
reeq
ual
toze
ro.T
heB
PGte
stst
atis
tic
isfo
rth
enu
llhy
poth
esis
ofho
mos
ced
asti
city
and
conv
erge
sto
ach
i-sq
uare
dis
trib
utio
nif
the
null
istr
ue.T
heR
ESE
Tte
stsa
refo
rthe
null
hypo
thes
isth
atth
eco
effi
cien
tsof
the
regr
esso
rsin
alte
rnat
ive
mod
elsp
ecif
icat
ions
are
allz
ero
and
have
anF
dis
trib
utio
nif
the
null
istr
ue.T
heJa
rque
-Ber
ate
stst
atis
tic
isfo
rth
enu
llhy
poth
esis
that
the
erro
rs a
re n
orm
ally
dis
trib
uted
and
con
verg
es to
a c
hi-s
quar
e d
istr
ibut
ion
if th
e nu
ll is
true
. E-i
den
otes
that
the
coef
fici
ent i
s m
ulti
plie
d b
y 10
-i.
361

sum, the results provide almost no evidence that lower levels of socialdivergence improve national measures of environmental performance.
SOCIAL CAPACITY
The results of the regressions that model the effect of social capacityon national environmental performance are provided in Table 7. TheAYS coefficient is not significantly different from zero in any of the mod-els except when we correct for an unknown form of heteroscedasticity inthe model with SO2 as the dependent variable.10 In the error correctedSO2 model, higher levels of average years of schooling are associatedwith lower levels of urban concentrations of sulfur dioxide. By contrast,the CAL coefficient is significant where SYS and SO2 are theregressands, but the results indicate that an increase in calorie intake hasa detrimental effect on national environmental performance.
PER CAPITA INCOME AND POPULATION DENSITY
Measures of per capita income and population density are controlvariables that are expected to affect national measures of environmentalperformance. Additional models were also estimated to test for an EKCrelationship by the inclusion of per capita income squared and also bysplitting the countries into high and low income groups. We also sepa-rately estimated models for civic and public social capital, social diver-gence, and social capacity without any interaction terms between themeasures of social determinants and per capita income. These models,available on request, generate similar findings to those reported inTables 4 to 7; namely, social determinants do not appear to have a statisti-cally significant effect on national environmental performance.
Selden and Song (1994) have shown that emissions per capita aredecreasing as a function of population density although total emissionsmay rise with population density. Scruggs (1998) has hypothesized thathigher density can reduce environmental degradation as it accentuatesits effects and provides an impetus to address problems of pollution. Analternative perspective, not inconsistent with Selden and Song’s results,is that higher density may be associated with a reduced assimilativeenvironmental capacity and, thus, poorer ambient measures of environ-mental performance. Cole and Neumayer (2004) also found that popula-tion density is an important explanatory variable in terms of air pollu-
362 JOURNAL OF ENVIRONMENT & DEVELOPMENT
10. Torras and Boyce (1998) found that increased literacy in low-income countriesimproved a number of ambient air and water quality measures. However, for high-incomecountries they found contradictory results with literacy improving measures of heavy par-ticles and dissolved oxygen but increasing ambient measures of smoke and faecal coliform(see their Table 3, p. 156).

tion such that carbon dioxide rises monotonically with populationdensity, but sulfur dioxide exhibits a more complex relationship.
Our results show that the coefficient for population density is statisti-cally different from zero and has a detrimental effect on national envi-ronmental performance in 13 of the possible 24 separate models pre-sented in Tables 4 to 7. Moreover, this finding holds true in everyspecification of the ESI and SYS models for all four different sets ofexplanatory variables and also with the model with all the explanatoryvariables combined as presented in Table 3. Thus, our most robust find-ing is that increases in population density are associated with a deleteri-ous effect on national environmental performance.
The results presented in Tables 4 to 7 show that the coefficient for percapita income is significantly different from zero and has a beneficialeffect on environmental performance in 7 of the 24 estimated models.Per capita income also has a statistically significant and positive coeffi-cient in the combined model, reported in Table 3, where SYS and an over-all SYSW are the regressands. These findings provide weak support forthe notion that increases in per capita income are associated with a bene-ficial effect for some measures of national environmental performancethrough either a composition and/or a technique effect. A possibleexplanation for this result is that in countries with high per capitaincomes more efficient methods of production (lower input and pollu-tion intensities), and also a greater ability to pay to abate pollution, maybe sufficient to offset a larger scale effect, at least for some pollutants.11
Our findings, however, should not be interpreted as suggesting thatcountries can grow out of their environmental problems as detailed test-ing of the relationship between per capita income and environmentalperformance is best accomplished using time series or panel data (Day &Grafton, 2003; Stern, 2004). Moreover, our study is not in any way adetailed analysis of the existence or otherwise of an EKC but rather anexamination of the effects of social determinants on environmentalperformance.12
Policy Implications
The results provide, at best, weak support that measures of desirablecivic behavior and democratic accountability may have some beneficial
Grafton, Knowles / SOCIAL CAPITAL 363
11. See Stern (2004, p. 1420) for a further discussion on the relationship between percapita income and environmental degradation and the importance of time effects.
12. See de Bruyn (2000); Dasgupta, Laplante, Wang, and Wheeler (2002); Harbaugh,Levinson, and Wilson (2002); and Stern (1998) for examinations of the empirical evidencefor an environmental Kuznets curve.

effect on national environmental performance. We also fail to find con-vincing evidence that a complementary relationship exists betweenmeasures of social determinants and per capita income to improve envi-ronmental quality. Our most robust result is that an increase in popula-tion density is associated with increased environmental degradation.Some evidence is also found that an increase in per capita income is asso-ciated with an improvement in some measures of environmentalperformance.
Our findings provide no convincing empirical support for the widelyheld notion that social capital is good for the environment. Indeed, if ourresults are supported by future work, the presumption that social capitalis always good for the environment may turn out to be as flawed as thepreviously widely held view that higher incomes are always associatedwith increased environmental degradation (Copeland & Taylor, 2004).
Before interpreting the results further or providing any policy impli-cations we offer several caveats about our findings. First, we emphasizethe difficulty in adequately measuring, at a national level, social deter-minants and environmental quality. Thus, measurement and data issuesmay, in part, contribute to our inability to find a statistically significantrelationship between social determinants and national environmentalperformance. Second, the effects of social determinants may interactwith income levels and economic performance in ways that we cannotcontrol for in reduced-form models. Third, the approach we use esti-mates a direct relationship between social determinants and environ-mental performance, but the effect is likely to be felt indirectly via envi-ronmental policies and regulations that are difficult to quantify overtime and across countries. Fourth, a lack of a statistical relationshipbetween social determinants at a cross-sectional level does not precludethe possibility that such a relationship exists at a national level.
BRIDGING VERSUS BONDING SOCIAL CAPITAL
The extent to which aggregate measures of social capital, social diver-gence, and social capacity play a role in determining national environ-mental performance likely depends on how societies are structured. Forinstance, Putnam (2000) distinguished between bridging social capital,which links across groups and aids information diffusion, and bondingsocial capital, which helps to reinforce existing and more exclusive iden-tities and groupings. Thus, if measures of social capital such as associa-tion membership merely reflect bonding social capital, this may not nec-essarily have any positive effect on the national levels of environmentalperformance. Indeed, it is conceivable that some forms of bonding socialcapital such as strong union membership in so-called rust belt or heavy-polluting industries may even be detrimental to environmental quality.
364 JOURNAL OF ENVIRONMENT & DEVELOPMENT

USE OF SOCIAL CAPITAL
The importance of social capital in affecting environmental outcomesmay also be related to how it is used. For example, Ostrom (2000, p. 198)emphasized that the benefits that accrue from social capital at a locallevel arise from self-organized resource governance systems. In otherwords, social capital directed toward stewardship may be more impor-tant in affecting environmental performance than social capital directedtoward advocacy.13 For example, the goal of the Downside LandcareGroup in southeastern Australia is to combat dryland salinity on theirfarms, whereas the Water Watchers in Perth, Australia, began first as awomen’s group but now encompasses both genders and measureswater quality in the local area (Carr, 2002). Both stewardship groups arecommunity based and work within well-defined geographical areas toachieve their common objectives. Evidence that social capital mayimprove environmental performance at the local level, however, doesnot necessarily imply that the federation of such networks on a nationallevel (Pretty & Ward, 2001) will be successful or that the requirements foreffective collective action will exist at higher levels of aggregation.14
Another issue of importance is that many aspects of social capital maynot directly lead to improvements in national environmental perfor-mance. For instance, a country might be characterized by a high level oftrust and church attendance, but this may not translate itself into a betterstate of the environment. Indeed, given the time constraints on all indi-viduals, the greater the time spent in one particular set of activities ornetworks the less time, ceteris paribus, that can be devoted to competingactivities. Furthermore, an increase in membership of social organiza-tions that focus on the environment does not necessarily imply a rise incivic engagement focused on the environment (Putnam, 2000, p. 53).
Another possibility is that institutional characteristics differ in impor-tance across countries or regions. For instance, in terms of the effects onper capita income, infant mortality, and adult literacy, Campos andNugent (1999) found that in East Asia the quality of bureaucracy is a sig-nificant explanatory variable explaining performance. By contrast, inLatin America the rule of law is a more important dominant factor.
Grafton, Knowles / SOCIAL CAPITAL 365
13. Pretty and Ward (2001, p. 213) also emphasized the importance of distinguishingbetween social capital embedded in social and church groups and social capital embodiedin groups focused on natural resources.
14. Ostrom et al. (1994) observed, “Efforts to establish one set of rules to cover large ter-ritories, which include significantly different types of local environments, are as problem-atic as the presumption that those involved may find adequate solutions entirely on theirown” (p. 328).

ECONOMIC AND DEMOGRAPHIC FACTORS
A probable explanation for the overall lack of a significant relation-ship between aggregate measures of civic and public social capital,social divergence and social capacity, and national environmental per-formance is that environmental quality (or degradation) is dominatedby economic and demographic factors. Such a finding is consistent withthe results of a number of authors, especially in regard to income. In par-ticular, Xepapadeas and Amri (1998) found that the probability of hav-ing acceptable environmental quality changes with the level of eco-nomic development. Our results are consistent with this finding andsuggest that population density and factors associated with per capitaincome may account for much of the variation in national environmentalperformance across countries. This is not to say that social determinantshave no environmental impact but that their effects are likely to be morecomplex than commonly assumed and may be felt through both directenvironmental policies and economic outcomes. Indeed, if the scaleeffect from increases in per capita income, which may be increasing insome measures of social capital, dominates the technique and composi-tion effects, it is possible for improvements in social capital to increaseenvironmental degradation.
Another implication of our findings, supported by the work ofBruvoll and Medin (2003), is that technical factors represented by emis-sions intensities and input intensities appear to play a dominant role inexplaining environmental degradation. This suggests that policiesdirected to reducing emissions and input intensities and technical inno-vation are critical instruments in environmental policy.
Concluding Remarks
Using cross-sectional data from a sample of low-, middle-, and high-income countries, the article empirically tests whether a range ofnational measures of civic and public social capital, social divergence,and social capacity influence national environmental performance.Overall, the findings provide very little empirical support for thehypothesis that higher levels of social capital and related variablesimprove cross-national environmental quality. In contrast, the resultsprovide robust support for the notion that increased population densityis associated with greater environmental degradation.
The results should be viewed as preliminary given the difficulty inmeasuring national social determinants and national environmentalindicators but do suggest that the mere existence of social capital andrelated social variables is not sufficient to improve national environmen-tal outcomes. Thus, the common presumption that greater levels of
366 JOURNAL OF ENVIRONMENT & DEVELOPMENT

social capital are always good for the environment may turn out to be asflawed as the previously and widely held view that increases in percapita income are always associated with greater environmentaldegradation.
Possible explanations as to why social capital may not have a benefi-cial effect on the environment are that it depends on the type of socialcapital, how it is applied, and whether it is directed to environmentalstewardship or advocacy. It may also be that social determinants affectthe economy and environment in more complex ways than is commonlythought. For example, social determinants may improve economic per-formance and raise per capita incomes that, in turn, can have a scaleeffect that may increase environmental degradation.
The implications from our study are that factors associated withincome, and especially demographic considerations, play an importantrole in explaining cross-national environmental performance. Ourresults suggest that if policy makers wish to improve overall nationalenvironmental performance they should direct their attention to chang-ing economic and demographic structural factors by limiting futureincreases in population density and lowering national emission andinput intensities.
Manuscript submitted March 29, 2004; revised manuscript accepted September 25,2004.
Acknowledgments
The authors gratefully acknowledge the financial support of the Mars-den Fund, administered by the Royal Society of New Zealand, in thepreparation of this article. They also thank three anonymous reviewersand the editor for very helpful comments and Anna Carr, Robin Connor,Kathleen Day, Tue Gorgens, Kuntala Lahiri-Dutt, and Dorian Owen aswell as participants at the November 29, 2001, Ecological EconomicsWorkshop of the Centre for Resource and Environmental Studies at TheAustralian National University, the Australian Agricultural and Re-source Economics Society February 2002 meeting, and the InauguralNational Workshop of the Economics and Environment Network held inCanberra in May 2003. The authors also thank Antonella De Dona andPaul Killerby for assistance in data compilation.
References
Ansuategi, A., & Perrings, C. (2000). Transboundary externalities and the environmentaltransition hypothesis. Environmental and Resource Economics, 17, 353-373.
Grafton, Knowles / SOCIAL CAPITAL 367

Barrett, D. B. (1982). World Christian encyclopedia: A comparative study of churches and religionsin the modern world. Oxford, UK: Oxford University Press.
Barrett, S., & Graddy, K. (2000). Freedom, growth, and the environment. Environment andDevelopment Economics, 5, 433-456.
Barro, R. J., & Lee, J.-W. (2001). Barlee.zip. Retrieved from http://www.nber.org/pub/barro.lee
Berkes, F. (Ed.). (1989). Common property resources: Ecology and community-based sustainabledevelopment. London: Bellhaven Press.
Binder, S., & Neumayer, E. (in press). Environmental pressure group strength and air pol-lution: An empirical analysis. Ecological Economics.
Bowles, S., & Gintis, H. (2002). Social capital and community governance. The EconomicJournal, 112, F419-F436.
Bromley, D. W., Feeny, F., McKean, M. A., Peters, P., Gilles, J. L., Oakerson, R. J., et al. (Eds.).(1992). Making the Commons work: Theory, practice, and policy. San Francisco: Institute forContemporary Studies.
Bruvoll, A., & Medin, H. (2003). Factors behind the environmental Kuznets curve. Environ-mental and Resource Economics, 24, 27-48.
Campos, N. F., & Nugent, J. B. (1999). Development performance and the institutions ofgovernance: Evidence from East Asia and Latin America. World Development, 27(3), 439-452.
Carr, A. (2002). Grass roots and green tape: Principles and practices of environmental stewardship.Sydney, Australia: The Federation Press.
Cole, M. A., & Neumayer, E. (2004). Examining the impact of demographic factors on airpollution. Population and Environment, 26(1), 5-21.
Congleton, R. D. (1992). Political institutions and pollution control. Review of Economics andStatistics, 74(3), 412-421.
Copeland, B. R., & Taylor, M. S. (2004). Trade, growth, and the environment. Journal of Eco-nomic Literature, 42, 7-71.
Damania, R. (2002). Environmental controls with corrupt bureaucrats. Environment andDevelopment Economics, 7, 407-427.
Damania, R., Fredriksson, P. G., & List, J. A. (2003). Trade liberalization, corruption, andenvironmental policy formation: Theory and evidence. Journal of Environmental Eco-nomics and Management, 46(3), 490-512.
Dasgupta, P., & Serageldin, I. (Eds.). (2000). Social capital: A multifaceted perspective. Wash-ington, DC: The World Bank.
Dasgupta, S., Laplante, B., Wang, H., & Wheeler, D. (2002). Confronting the environmentalKuznets curve. Journal of Economic Perspectives, 16(1), 147-168.
Day, K., & Grafton, R. Q. (2003). Growth and the environment in Canada: An empiricalanalysis. Canadian Journal of Agricultural Economics, 51, 197-216.
de Bruyn, S. M. (2000). Economic growth and the environment. Dordrecht, Netherlands:Kluwer Academic Publishers.
Didia, D. O. (1997). Democracies, political instability and tropical deforestation. GlobalEnvironmental Change, 7(1), 63-76.
Easterly, W. (2001). The middle class consensus and economic development. Journal of Eco-nomic Growth, 6, 317-335.
Eriksson, C., & Persson, J. (2003). Economic growth, inequality, democratization, and theenvironment. Environmental and Resource Economics, 25, 1-16.
Fredriksson, P. G., Neumayer, E., Damania, R., & Gates, S. (in press). Environmentalism,democracy, and pollution control. Journal of Environmental Economics and Management.
Fredriksson, P. G., Vollebergh, H. R. J., & Dijkgraaf, E. (2004). Corruption and energy effi-ciency in OECD countries: Theory and evidence. Journal of Environmental Economics andManagement, 47(2), 207-231.
Glaeser, E. L., Laibson, D. I., Scheinkman, J. A., & Soutter, C. L. (2000). Measuring trust.Quarterly Journal of Economics, 115, 811-846.
368 JOURNAL OF ENVIRONMENT & DEVELOPMENT

Global Leaders of Tomorrow Environment Task Force. (2001, January). 2001 EnvironmentalSustainability Index (prepared in collaboration with Yale Center for Environmental Lawand Policy and the Center for International Earth Science Information Network ofColumbia University for the World Economic Forum in Davos, Switzerland). Geneva,Switzerland: Author.
Gradstein, M., & Justman, M. (2002). Education, social cohesion, and economic growth. TheAmerican Economic Review, 92(4), 1192-1204.
Grafton, R. Q., Knowles, S., & Owen, P. D. (2002). Social divergence and productivity: Mak-ing a connection. In A. Sharpe, F. St. Hilaire, & K. Banting (Eds.), The review of economicperformance and social progress 2002: Towards a social understanding of productivity (pp.203-223). Montreal, Quebec, Canada: Institute for Research on Public Policy and the Centerfor the Study of Living Standards.
Grafton, R. Q., Knowles, S., & Owen, P. D. (2004). Total factor productivity, per capitaincome and social divergence. The Economic Record, 80(250), 302-313.
Grafton, R. Q., Kompas, T., & Owen, P. D. (2004). Productivity, factor accumulation and socialnetworks: Theory and evidence. Retrieved from http://www.caer.unsw.edu.au/DP/CAER0401.pdf
Grafton, R. Q., Pendleton, L. H., & Nelson, H. W. (2001). A dictionary of environmental eco-nomics, science and policy. Cheltenham, UK: Edward Elgar.
Grossman, G. M., & Krueger, A. B. (1995). Economic growth and the environment. Quar-terly Journal of Economics, 110(2), 353-377.
Hamilton, C., & Turton, H. (2002). Determinants of emissions growth in OECD countries.Energy Policy, 30, 63-71.
Harbaugh, W. T., Levinson, A., & Wilson, D. M. (2002). Re-examining the empirical evi-dence for an environmental Kuznets curve. Review of Economics and Statistics, 84(3), 541-551.
Inglehart, R., Aguir, C., Ahmad, A. H., Aliev, A., Alishauskiene, R., Andreyenkov, V., et al.(2000). World Values Surveys and European Values Surveys, 1981-84, 1990-93, and 1995-97.Ann Arbor, Michigan: Inter-University Consortium for Political and Social Research.
Jarque, C. M., & Bera, A. K. (1980). Efficient tests for normality, homoscedasticity and serialindependence of regression residuals. Economics Letters, 6, 255-259.
Jazairy, I., Alamgir, M., & Panuccio, T. (1992). State of world rural poverty: An inquiry into itscauses and consequences. Rome: International Fund for Agricultural Development.
Knack, S., & Keefer, P. (1997). Does social capital have an economic payoff? Across-countryinvestigation. Quarterly Journal of Economics, 112(4), 1251-1288.
Knowles, S. (2005). Inequality and economic growth: The empirical relationship reconsid-ered in the light of comparable data. Journal of Development Studies, 41, 135-159.
López, R., & Mitra, S. (2000). Corruption, pollution, and the Kuznets environment curve.Journal of Environmental Economics and Management, 40(2), 137-150.
Mauro, P. (1995). Corruption and growth. Quarterly Journal of Economics, 110(3), 681-712.Midlarsky, M. I. (1998). Democracy and the environment: An empirical assessment. Journal
of Peace Research, 35(3), 341-361.Neumayer, E. (2002). Do democracies exhibit stronger international environmental com-
mitment? A cross-country analysis. Journal of Peace Research, 39(2), 139-164.Ostrom, E. (1990). Governing the Commons: The evolution of institutions for collective action.
Cambridge, UK: Cambridge University Press.Ostrom, E. (2000). Social capital: A fad or a fundamental concept? In P. Dasgupta & I. Sere-
geldin (Eds.), Social capital: A multifaceted perspective (pp. 172-214). Washington, DC: TheWorld Bank.
Ostrom, E., Gardner, R., & Walker, J. (1994). Rules, games, and common-pool resources. AnnArbor: University of Michigan Press.
Pretty, J., & Ward, H. (2001). Social capital and the environment. World Development, 29(2),209-227.
Grafton, Knowles / SOCIAL CAPITAL 369

Putnam, R. D. (1993). The prosperous community: Social capital and public life. The Ameri-can Prospect, 13, 35-42.
Putnam, R. D. (2000). Bowling alone: The collapse and revival of American community. NewYork: Simon & Schuster.
Ramsey, J. B. (1969). Tests for specification errors in classical linear regression analysis. Jour-nal of the Royal Statistical Society, B31, 350-371.
Rose, R. (1999). What does social capital add to individual welfare? An empirical analysis of Russia(Social Capital Initiative Working Paper No. 15). Washington, DC: World Bank.
Rosenfeld, R., Messner, S. F., & Baumer, E. P. (2001). Social capital and homicide. SocialForces, 80, 283-309.
Scruggs, L. A. (1998). Political and economic inequality and the environment. EcologicalEconomics, 26, 259-275.
Sealy, T. S. (1999, June). International country risk guide (Vol. 20, No. 6). East Syracuse, NY:The PRS Group.
Selden, T. M., & Song, D. (1994). Environmental quality and development: Is there aKuznets curve for air pollution? Journal of Environmental Economics and Management, 27,147-162.
Stern, D. I. (1998). Progress on the environmental Kuznets curve? Environment and Develop-ment Economics, 3, 173-196.
Stern, D. I. (2004). The rise and fall of the environmental Kuznets curve. World Development,32(8), 1419-1439.
Temple, J., & Johnson, P. A. (1998). Social capability and economic growth. Quarterly Journalof Economics, 113, 965-990.
Torras, M., & Boyce, J. K. (1998). Income, inequality, and pollution: A reassessment of theenvironmental Kuznets curve. Ecological Economics, 25, 147-160.
World Bank. (2000). World development indicators on CD-ROM. Washington, DC: Author.Xepapadeas, A., & Amri, E. (1998). Some empirical indications of the relationship between
environmental quality and economic development. Environmental and Resource Eco-nomics, 11, 93-106.
Zak, P. J., & Knack, S. (2001). Trust and growth. Economic Journal, 111, 295-321.
R. Quentin Grafton is a professor of economics in the International and Development Economicsprogram at the Asia Pacific School of Economics and Government of the Australian National Uni-versity. His primary research interests are in environmental economics and social networks.
Stephen Knowles is a senior lecturer in the Department of Economics of the University of Otago. Hisprimary research interests are in the economics of development.
370 JOURNAL OF ENVIRONMENT & DEVELOPMENT