social capital and community cohesion for british-born
TRANSCRIPT

Social Capital and Community Cohesion for British-Born Residents and Migrants

Recent Findings
• Loneliness • Social Integration for Migrants • Perceptions of Neighbourhood Diversity in
Regeneration and Surrounding Areas.

Loneliness

Loneliness
“The manner in which a person experiences or evaluates his or her isolation or lack of communication with other people…where the number or intimacy of relationships with others is less than that which is desirable or admissible.”
Mental health problems. Sleep deprivation Stress and raised cortisol levels. High blood pressure. Impacts on the immune system. Overeating Reliance on alcohol Low physical activity
Health Problems
Comparable to the effects of smoking or ageing

Rates of Loneliness
Sometimes Often or Always Total
ALL 21.7 15.8 37.5
Aged 40-64 26.0 17.8 43.8
Single Adult, working age 31.0 24.5 54.5
Single Adult, older 28.2 19.1 47.3
Unemployed 28.2 15.8 44.0
Long-term sick or disabled 30.5 31.5 62.0
British 24.2 16.0 40.2
Non-British 21.5 14.2 35.7
“How often have you felt lonely over the past two weeks?”

Loneliness is Associated with Mental Health and Wellbeing
Respondent Reporting of Mental Health & Wellbeing
Reference Group
Predictor Odds Ratio for Frequent
Loneliness*
Mental wellbeing (WEMWBS) High (tertile) Low 2.87
GP consult on mental health issue in past year
No Yes 3.09
Mental health (SF-12) High (tertile) Low 6.46
Controlling for: age; gender; household structure; long-standing illness; employment status; education; migrant status.
* Feeling lonely ‘often’ or ‘all of the time’ in the past two weeks.
It is likely that the relationship examined here runs in both directions. Thus, avoiding loneliness is likely to be protective of mental health and wellbeing.
Source: GoWell Wave 3

Social Connectedness is Associated with Loneliness
Respondent Reporting of Social Connectedness
Reference Group
Predictor Odds Ratio for Frequent
Loneliness*
Speak to immediate neighbours Most days Monthly or less 2.56
Stop and talk to people in area A great deal Not much/never 2.16
Feel part of the community A great deal Not much/not at all 1.83
Know people in neighbourhood Many/most Very few/none 1.74
Source: GoWell Wave 3
Controlling for: age; gender; household structure; long-standing illness; employment status; education; migrant status.
* Feeling lonely ‘often’ or ‘all of the time’ in the past two weeks.

Social Integration of Migrants
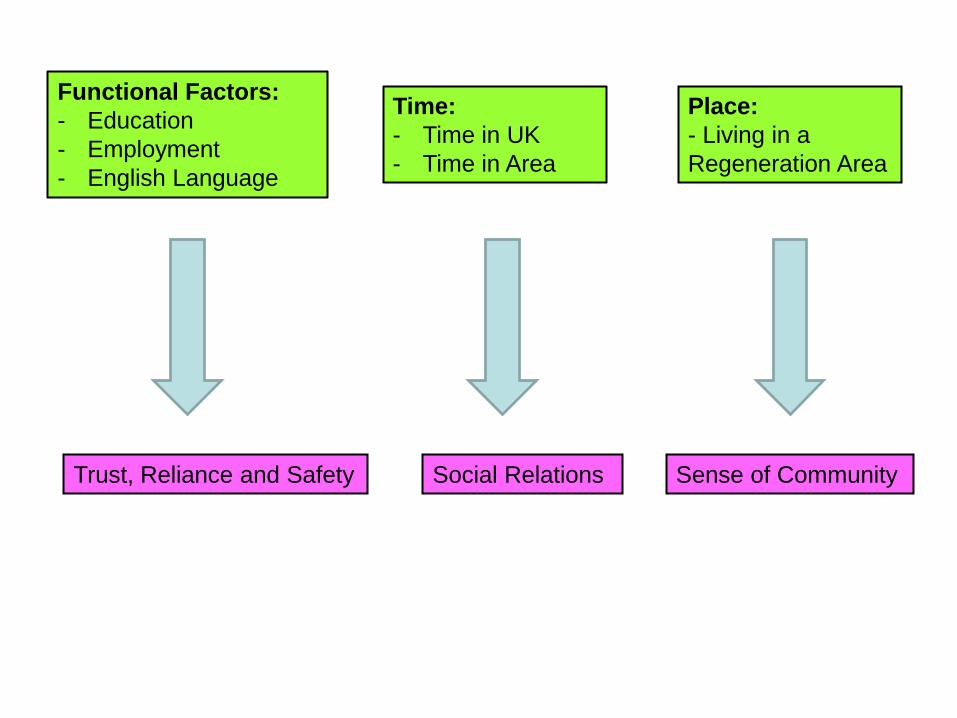
Functional Factors: - Education - Employment - English Language
Place: - Living in a Regeneration Area
Time: - Time in UK - Time in Area
Trust, Reliance and Safety Social Relations Sense of Community

Associations of Educational Qualifications
• Trust, Reliance and Safety: – Higher odds of citing antisocial behaviours.
• Social Relations: – Positive associations with 7 of 12 indicators, inc.:
• 50% higher odds of neighbourly exchanges • 60% higher odds of using local social amenities.
• Sense of Community: – No effects.
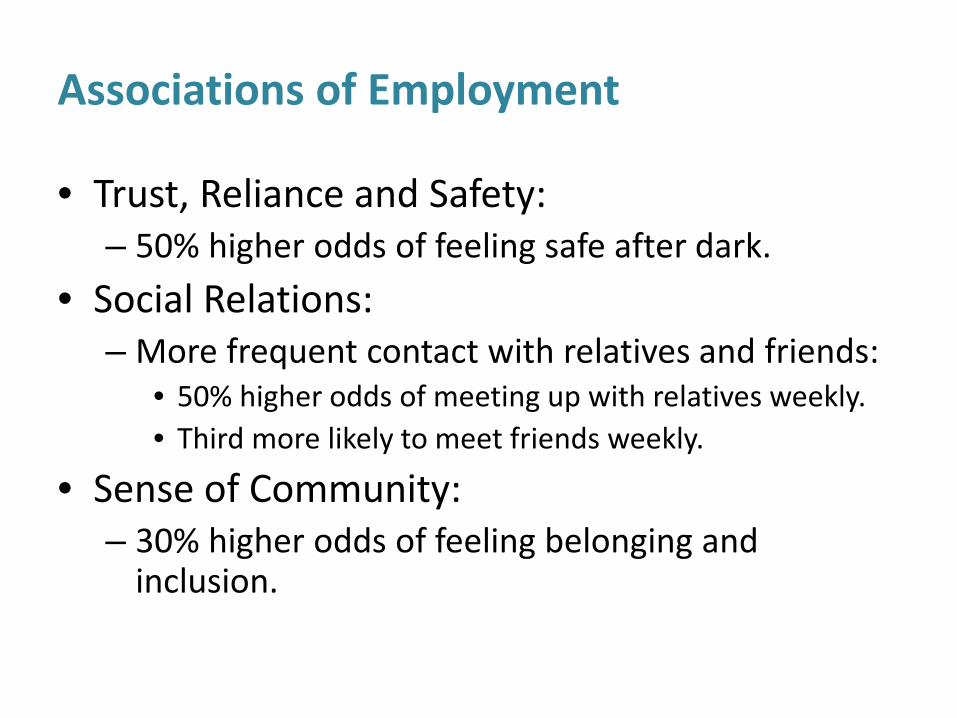
Associations of Employment
• Trust, Reliance and Safety: – 50% higher odds of feeling safe after dark.
• Social Relations: – More frequent contact with relatives and friends:
• 50% higher odds of meeting up with relatives weekly. • Third more likely to meet friends weekly.
• Sense of Community: – 30% higher odds of feeling belonging and
inclusion.

Associations of Speaking English Well
• Trust, Reliance and Safety: – 40% higher odds of perceiving informal social control. – More likely to identify antisocial behaviours.
• Social Relations: – Third more likely to have available practical social
support.
• Sense of Community: – Third less likely to have neighbourhood satisfaction.
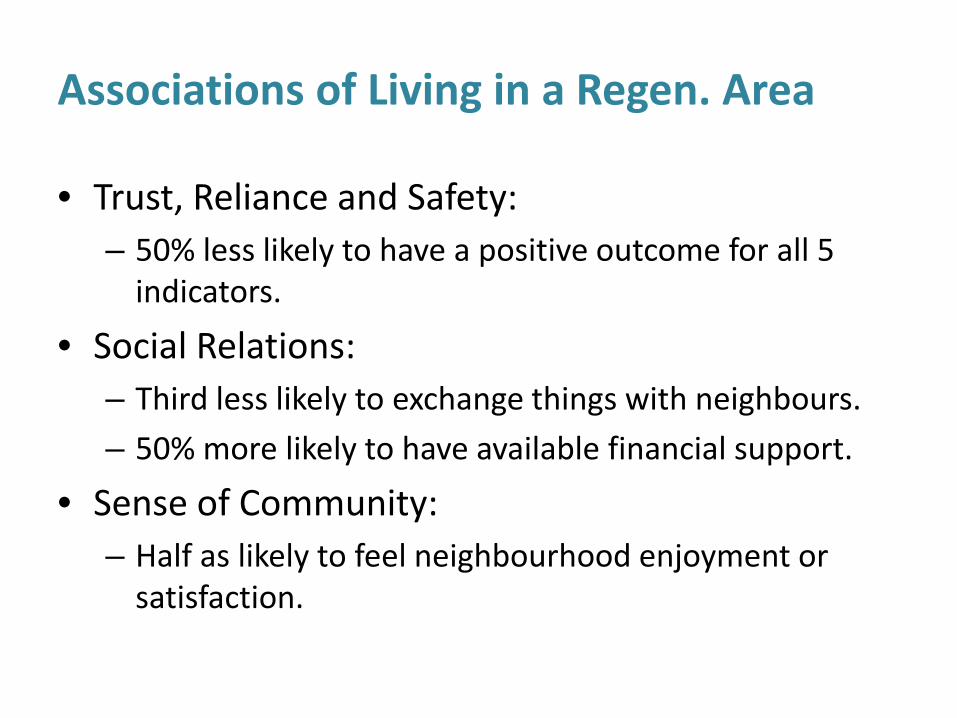
Associations of Living in a Regen. Area
• Trust, Reliance and Safety: – 50% less likely to have a positive outcome for all 5
indicators.
• Social Relations: – Third less likely to exchange things with neighbours. – 50% more likely to have available financial support.
• Sense of Community: – Half as likely to feel neighbourhood enjoyment or
satisfaction.

Effects of Time
Time in UK Time in Area
Trust, Reliance & Safety 2 out of 5 indictors (max. effect 3% p.a.)
2 out of 5 indicators (max. effect 5% p.a.)
Social Relations 4 out of 12 indicators (max. effect 5% p.a.)
7 out of 12 indicators (max. effect 8% p.a.)
Sense of Community 3 out of 4 indicators (max. effect 3% p.a.)
2 out of 4 indicators (max. effect 6% p.a.)
Social Integration for Migrants Improves with Time.

Perceived Ethnic Diversity

Perceptions of Diversity “How mixed do you think your neighbourhood is in terms of the ethnic background of the residents?”
Regeneration Areas
Surrounding Areas
Other Areas
Hardly mixed at all 10.3 38.5 40.1 Fairly mixed 45.4 50.0 44.9 Very mixed 44.3 11.5 15.0
Unweighted data.

Perceptions of Diversity “How mixed do you think your neighbourhood is in terms of the ethnic background of the residents?”
Regeneration Areas
Surrounding Areas
Other Areas
Hardly mixed at all 10.3 38.5 40.1 Fairly mixed 45.3 50.0 44.9 Very mixed 44.3 11.5 15.0 Compared with reality: % non-White-British or Irish1
38.3 14.7 12.9
1. Mean ethnic minority % in datazones covering the relevant study areas. Source: 2011 census.

Perceived Diversity and Cohesion
Regeneration Areas Surrounding Areas Hardly mixed
Very mixed Hardly mixed
Very mixed
Public Interaction1 1.00 2.21* 1.00 1.17 Informal Social Control2 1.00 1.83* 1.00 0.66 No serious ASB3 1.00 1.48* 1.00 0.77
1. Stop and talk to people in the neighbourhood ‘a great deal’. 2. Expect someone to intervene in an incident of harassment in public. 3. No ‘serious’ antisocial behaviours identified in the area from ten items. Controlling for: age group; sex; household type; employment status; ethnicity; and years in area.

Perceived Diversity, Neighbourhood Satisfaction, and Empowerment
Regeneration Areas Surrounding Areas Hardly mixed
Very mixed
Hardly mixed
Very mixed
Neighbourhood Satisfaction1 1.00 0.96 1.00 0.51* Community Influence2 1.00 0.97 1.00 1.00 Community Proactivity3 1.00 1.59* 1.00 1.10 Responsive Services4 1.00 1.65* 1.00 0.95
1. Very satisfied with neighbourhood as a place to live. 2. Community can influence decisions affecting the area. 3. Community can find ways to improve things. 4. Service providers respond to local people’s views. Controlling for: age group; sex; household type; employment status; ethnicity; and years in area.
Conclusions • Social capital (social relations with others) is important for
the health of our study group. – Prevention of loneliness is one route for this.
• The successful integration of migrant groups is important for the creation of cohesive, sustainable communities in deprived areas. – Providing education, employment and English language
opportunities are important. – So is allowing migrants to settle over time in an area.
• Perceived ethnic diversity is positively associated with cohesion and empowerment outcomes in regeneration areas (with larger and longer migrant presence), but not so in their surrounding areas (or, not yet…).
