social audit of governance and delivery of public services
TRANSCRIPT
Project Report PR-PK-pn2khw-05
Pakistan
Social audit of governance and delivery of public services:
Khanewal district – preventive child health
Anne Cockcroft, Khalid Omer, Ubaid Ullah Chaudhry, Rana Hssaan, Sohail Saeed, Amar Dass, Deborah Milne, Judith Matthis and Neil Andersson

Social audit of governance and delivery of public services
Khanewal District 2005
Preventive child health
A Cockcroft, K Omer, UU Chaudhry, R Hssaan, S Saeed, A Dass, D Milne, J Matthis, N Andersson Khanewal, January 2006

CIET/District Government Khanewal: social audit 2005 i
Contents List of tables.......................................................................................................................ii List of figures................................................................................................................... iii Acknowledgements...........................................................................................................iv
Summary ....................................................................................................................................v Methods..............................................................................................................................v Findings.............................................................................................................................vi
Introduction................................................................................................................................1 The social audit in focus districts...........................................................................................1
Operationalising the social audit in focus districts ............................................................2 Focus district national core group......................................................................................4
Methods......................................................................................................................................5 The topic for the social audit cycle ....................................................................................5 Data collection instruments................................................................................................6 Sample and sampling .........................................................................................................7 Field teams .........................................................................................................................8 Data collection ...................................................................................................................8 Data entry and analysis ......................................................................................................9
Findings....................................................................................................................................11 The information base ...........................................................................................................11 Childhood Diarrhoea............................................................................................................12
Frequency of childhood diarrhoea ...................................................................................12 Variables potentially related to childhood diarrhoea .......................................................12 Analysis of risk of diarrhoea in children..........................................................................15 Treatment of diarrhoea in children ..................................................................................17 Experience of treatment for diarrhoea .............................................................................19
Childhood respiratory infections..........................................................................................21 Frequency of childhood respiratory infections ................................................................21 Variables potentially related to ARI ................................................................................21 Analysis of risk of childhood ARI ...................................................................................23 Information from the lady health worker.........................................................................24 Treatment of ARI.............................................................................................................24
Childhood measles ...............................................................................................................27 Frequency of childhood measles......................................................................................27 Analysis of risk of measles ..............................................................................................27 Payment for cases of measles ..........................................................................................28
Childhood immunisations ....................................................................................................29 Immunisation status of the children.................................................................................29 Why children are not immunised.....................................................................................30 Mothers’ knowledge and perceptions about immunisations............................................31 Decisions about immunisation for children .....................................................................33
Measles immunisation .........................................................................................................34 Frequency of immunisation .............................................................................................34 Analysis of receiving measles vaccine ............................................................................34
Lady health workers.............................................................................................................37 Public satisfaction with basic services.................................................................................40
Commentary.............................................................................................................................47 Annexes....................................................................................................................................50

CIET/District Government Khanewal: social audit 2005 ii
List of tables 1. The household sample by tehsil 11 2. Household features by tehsil 11 3. Children in the survey by tehsil 11 4. % households using different sources of drinking water 12 5. % households with different conditions for drinking water containers 12 6. % households using and having latrines 13 7. % households observed with different hygienic conditions in and around the house 14 8. Frequency of LHW visits to visited households 14 9. Variables potentially associated with the risk of diarrhoea in children 15 10. Model of effects of variables on risk of diarrhoea in children whose mothers had some education 16 11. Potential gains in diarrhoea prevention among children whose mothers have some education 16 12. % children taken to different types of facilities for treatment of diarrhoea in the past 12 months 18 13. Why mothers were satisfied with the treatment from the facility (% mothers) 20 14. Why mothers were dissatisfied with the treatment from the facility (% mothers) 20 15. % that paid, mean and median amounts paid for travel for treatment of diarrhoea 20 16. % that paid, mean and median amounts paid for diarrhoea treatment at the facility 20 17. % that paid, mean and median amounts paid for diarrhoea medicines or investigations outside facility 20 18. % households with different stove types for cooking 21 19. % households with different heating systems% households with different heating systems 22 20. Variables potentially associated with the risk of ARI in children 23 21. Potential gains in ARI prevention 23 22. % children taken to different types of facilities for treatment of ARI in the past 12 months 24 23. % that paid, mean and median amounts paid for travel for treatment of ARI 26 24. % that paid, mean and median amounts paid for ARI treatment at the facility 26 25. % that paid, mean and median amounts paid for ARI medicines/investigations outside the facility 26 26. Variables potentially associated with the risk of measles in children 27 27. Model of effects of variables on the chance of not having measles 28 28. Potential gains in measles prevention in children 10-59 months old 28 29. % children 12-23 months immunised% children 12-23 months immunised 29 30. Reasons why children (12-59 months) are not immunised 30 31. Mothers’ sources of information about immunisation for children 31 32. Why mothers felt immunisation was not worthwhile 32 33. Where mothers had heard about adverse effects of immunisations 32 34. Mother’s recall about advice on immunisations given by LHWs 33 35. Mother’s involvement in decisions about immunisation for the child (% children) 33 36. Variables potentially associated with the risk of measles in children 34 37. Model of effects of variables on the chance of having measles vaccine 34 38. Potential gains in increasing measles immunisation 36 39. Where LHWs heard about adverse effects of immunisation 37 40. Why children are not always immunised: LHW views 38 41. Suggestions of LHWs to ensure all children are immunised 38 42. Advice reportedly given by LHWs about diarrhoea prevention 38 43. Advice reportedly given by LHWs about diarrhoea treatment 38 44. Advice reportedly given by LHWs about ARI treatment 39 45. % households reporting access to roads and public transport 40 46. % households reporting access to garbage, sewerage, and water services 42 47. % households reporting access to agricultural, education and health services 43 48. % households reporting access to gas and electricity services 45

CIET/District Government Khanewal: social audit 2005 iii
List of figures 1. Sample sites for Khanewal social audit 2005 (map) 7 2. % of “very vulnerable” households (map) 11 3. % of children with diarrhoea in the last 2 weeks 12 4. % of children with diarrhoea in the last 2 weeks (map) 12 5. % households with covered, clean, raised drinking water container (map) 13 6. % households with a formal latrine (map) 13 7. % households with excreta observed inside or at the doorstep (map) 14 8. % of mothers who could correctly cite a cause of diarrhoea in children (map) 15 9. % children under 60 months old given more fluids during last episode of diarrhoea (map) 17 10. % children under 60 months old given anti-diarrhoea medicine during last episode of diarrhoea (map) 17 11. % children under 60 months old taken for treatment during their last episode of diarrhoea (map) 18 12. % of children provided ORS and availability of other medicines from health facilities or practitioners 19 13. % of mothers of children with diarrhoea who thought they got a full explanation of their child's illness 19 14. % of children under 60 months old with ARI in the last 2 weeks 21 15. % of children under 60 months old with ARI in the last 2 weeks (map) 21 16. % children with ARI taken to different health care providers 24 17. % children under 60 months old taken anywhere for treatment in last episode of ARI (map) 24 18. % mothers/caregivers provided with a full explanation of their child's illness, for children with ARI 25 19. % of parents of children with ARI provided with all medicines prescribed 25 20. % children aged 10-59 months who have had measles, excluding cases at under 10 months old 27 21. % children aged 10-59 months who have had measles, excluding cases at under 10 months old (map) 27 22. % children 21-23 months who had BCG (map) 29 23. % children 12-23 months who had full course DPT (map) 29 24. % children 12-23 months who had measles vaccine (map) 29 25. % children (12-23 months) who have received measles vaccine 34 26. % households satisfied with roads 40 27. % households satisfied with roads (map) 40 28. % households satisfied with public transport 41 29. % households satisfied with public transport (map) 41 30. % households satisfied with garbage disposal 41 31. % households satisfied with garbage disposal (map) 41 32. % households satisfied with sewerage services 42 33. % households satisfied with sewerage services (map) 42 34. % households satisfied with government water supply 42 35. % households satisfied with government water supply (map) 43 36. % households satisfied with agriculture services 43 37. % households satisfied with agriculture services (map) 43 38. % households satisfied with government education services 44 39. % households satisfied with government education services (map) 44 40. % households satisfied with govt health services 44 41. % households satisfied with govt health services (map) 44 42. % households satisfied with gas supply 45 43. % households satisfied with gas supply (map) 45 44. % households satisfied with electricity supply 46 45. % households satisfied with electricity supply (map) 46

CIET/District Government Khanewal: social audit 2005 iv
Acknowledgements The social audit is funded by donors through DTCE (Devolution Trust for Community Empowerment) / UNDP (United Nations Development Programme), including SDC (Swiss Agency for Development Cooperation), Norway (Royal Norwegian Embassy), and DFID (UK Department for International Development); and by CIDA (Canadian International Development Agency. We are very grateful to Sardar Ahmed Yar Hiraj, District Nazim Khanewal, for his continuous support, guidance, and leadership of the district team, and facilitation, ownership and decision making about the social audit in Khanewal. We are thankful to Mr Muhammad Khan Khichi DCO Khanewal for his support and guidance, and provision of premises for the social audit office and the Officers' Club for training. We are grateful to Dr Waheed Tariq Gelani EDO Health Khanewal for his support and input into design, and for providing relevant information for the design of instruments. We thank Mr. Mirza Muhammad Akram ex-EDO Community Development (district focal person) and Mr Khalid Hasan Durrani EDO CD Khanewal and his office staff for their support and guidance, and provision of premises. We thank Mr Muhammad Ali Ammer EDO F&P, Mr. Manzoor Ahmed Chowhdry, DO Social Welfare, Mr Muhammad Altaf Khan DDO Social Welfare, and Mr Maqsood Ahmed Manager San'at Zaar Khanewal for facilitation and logistic support in organizing events for the social audit. We are grateful to Mr Muhammad Akram Anjum, ADLG Khanewal, and Mian Abdul Ghafoor Project Manager LG&RD, for their support and facilitation of logistic arrangements of data collection. We are grateful to the members of the social audit sub technical group (Annex 2) for their great help in design and planning of the social audit. We are grateful to Mr. Syed Farrukh Raza, General Secretary STEP Development Organisation Kabirwala, Ms Shazia Abbas, General Secretary SWANI Organsiation Kabirwala, members of Hamid Murtaza Welfare Society Khanewal, General Secretary Peoples Technical and Education Society Jehanian for their input and support. We extend sincere thanks to Col. (rtd.) Mohammad Shahbaz, Director General, Local Govt. & Rural Development, Punjab, for invaluable provincial liaison support, and guidance in developing a strong base for the social audit in Punjab. We greatly appreciate the support and advice of Mr. Mohammad Naeem ul Haq, Member NRB, including in his role as a member of the social audit National Core Group. We thank all the CIET team in Pakistan who contributed to this report, and Steve Mitchell for producing the maps. We thank Mr Muhammad Altaf Khan, DDO Social Welfare Khanewal, and Mian Abdul Ghafoor, Project Manager LG&RD Punjab, who contributed to this report during the recent CIET course on evidence based planning in the University of Peshawar. Most importantly we thank the thousands of citizens across Khanewal who took the time and trouble to share their views and offer suggestions in household interviews and focus group discussions. We hope that use of the social audit findings to improve the lives of the people of Khanewal will repay them for their time.

CIET/District Government Khanewal: social audit 2005 v
Summary Commissioned by the National Reconstruction Bureau (NRB), the CIET social audit tracks the public views, use and experience of public services under devolved local government and provides a mechanism for including citizens’ views and suggestions in planning and policy making, particularly at local level. The first and second national social audits took place in 2001/2 and 2004/5. During the first half of 2006 findings from the second national social audit will be discussed widely with the public, civil society, service providers, planners and policy makers. The social audit programme continues until 2009, with alternating years of data collection and dissemination and use of findings. To help involve citizens in local planning and to support evidence-based planning, CIET is implementing a district social audit in five focus districts. Work in Lasbela began in 2003, and Khairpur, Haripur, Sialkot, and Khanewal joined in late 2004. In these districts the social audit aims to help governments to plan and implement services tailored to the needs of their people. A national core group supports the social audit in the focus districts.
Methods After discussions in all the focus districts, the NCG agreed the topic of ‘public and preventive health’ as the main area for the first district social audit. Working with sub technical groups in each district, we designed the instruments for the cycle, including a household questionnaire, a community profile record, an institutional review of government health facilities, an interview with lady health workers (LHWs), and a feedback focus group guide. In each district we drew a stratified random cluster sample of communities to represent the tehsils (talukas) of the district. In Khanewal the sample comprised 19 rural and 4 urban communities across the tehsils. Trained field teams (mainly women) collected household information in April 2005 and the feedback focus groups in July 2005. Double data entry with validation ensured a clean dataset. We categorized household vulnerability on the

CIET/District Government Khanewal: social audit 2005 vi
basis of roof construction, room occupancy, and occupation of the main breadwinner. Analysis produced data on key indicators across the district, weighted to reflect any uneven sample distribution, and examined the potential effects of interventions to improve outcomes.
Findings Information base The survey covered 2400 households (representing 17316 people). The household sample in each tehsil is shown in Table s1. Some 48% of the households were ‘vulnerable’ and 15% were ‘very vulnerable’. Table s2 shows household features by tehsil. In the 2400 households we interviewed 2497 mothers or caregivers. Only 27% had any formal education. The 2497 mothers provided information about 3586 children less than 60 months old. We also interviewed 29 LHWs covering the sample communities. Childhood diarrhoea and related issues Among children aged less than 60 months, 29% had suffered diarrhoea during the last two weeks and 75% had suffered diarrhoea in the past 12 months. The proportion of children with diarrhoea during the last two weeks varied across the district (Figure s1). Some household features and practices are potentially related to the risk of diarrhoea in children. Drinking water Nearly all (97%) households in Khanewal rely on ground water as their main source of drinking water with very few using either piped water or surface water. Nearly all households (99%) have a water source defined as protected. Of the drinking water containers inspected, 97% were covered, 85% were clean, 59% were raised, and 53% were covered, clean and raised. Latrines and household hygiene Some 61% of households used a latrine and 58% had some formal type of latrine (Figure s2). Most
Table s1. The household sample by tehsil Tehsil No.
households Total
people Jahania 516 3760 Kabirwala 734 5060 Khanewal 410 3031 Mian Channu 740 5465
Table s2. Household features by tehsil
Feature Very vulnerable Vulnerable Educated
Head Male head
Jahania 13 45 51 95 Kabirwala 18 54 53 95 Khanewal 16 49 44 94 Mian Channu 11 41 56 93
District Khanewal 15 48 51 94
Punjab 12 47 54 92 Pakistan 13 47 53 93
% children with diarrhoea in the last two weeks
15 – 2526 – 3031 – 3536 – 40
Figure s1 % children under 60 months with diarrhoea in the last two weeks

CIET/District Government Khanewal: social audit 2005 vii
households without a latrine (89%) said this was because they could not afford one. Most community focus groups believed that having a latrine in the household could help prevent diarrhoea in children but they pointed out it was important to keep it clean. They felt households would need financial and technical support to help them install latrines. The field teams observed garbage inside or at the doorstep in 77% of households, sewage water in 43%, and excreta in 58%. Information and knowledge about diarrhoea Some 60% of mothers said an LHW visited their household, but few of these mothers (6%) recalled the LHW telling them about preventing diarrhoea in children. About two thirds of mothers (67%) could correctly identify a cause of childhood diarrhoea. Analysis of risk of diarrhoea The pattern of variables related to the risk of diarrhoea was different between children whose mothers had some education and those whose mothers had no education. If the mother had some education, then younger children, those whose mothers did not have knowledge of diarrhoea causes, and those without a latrine in the household were more likely to have diarrhoea. In this group of children, those with a latrine had only half the risk of diarrhoea. Across all children, if they all had latrines, 19 per thousand could be prevented from having diarrhoea. Treatment of diarrhoea Only 13% of mothers visited by an LHW recalled she told them about treating diarrhoea in children. Most (75%) mothers said they would give a child more fluids during an episode of diarrhoea and 60% said they would give the child either the same or more food. When actually treating an episode of diarrhoea, mothers gave 69% of the children more fluids and 63% with either the same or more food. In most cases (82%) the mother gave the child medicine to stop the diarrhoea (Figure s3). This is generally not good practice and these anti-diarrhoeal medications can be dangerous for young children.
% with a formal latrine14 – 3031 – 5051 – 6566 – 8586 – 100
Figure s2 % households with a formal latrine
% of children who were given anti-diarrhoea medicine
69 – 7576 – 8081 – 8586 – 9091 – 96
Figure s3 % children under 5 years old given anti-diarrhoea medicine during last episode of diarrhoea
CIET/District Government Khanewal: social audit 2005 viii
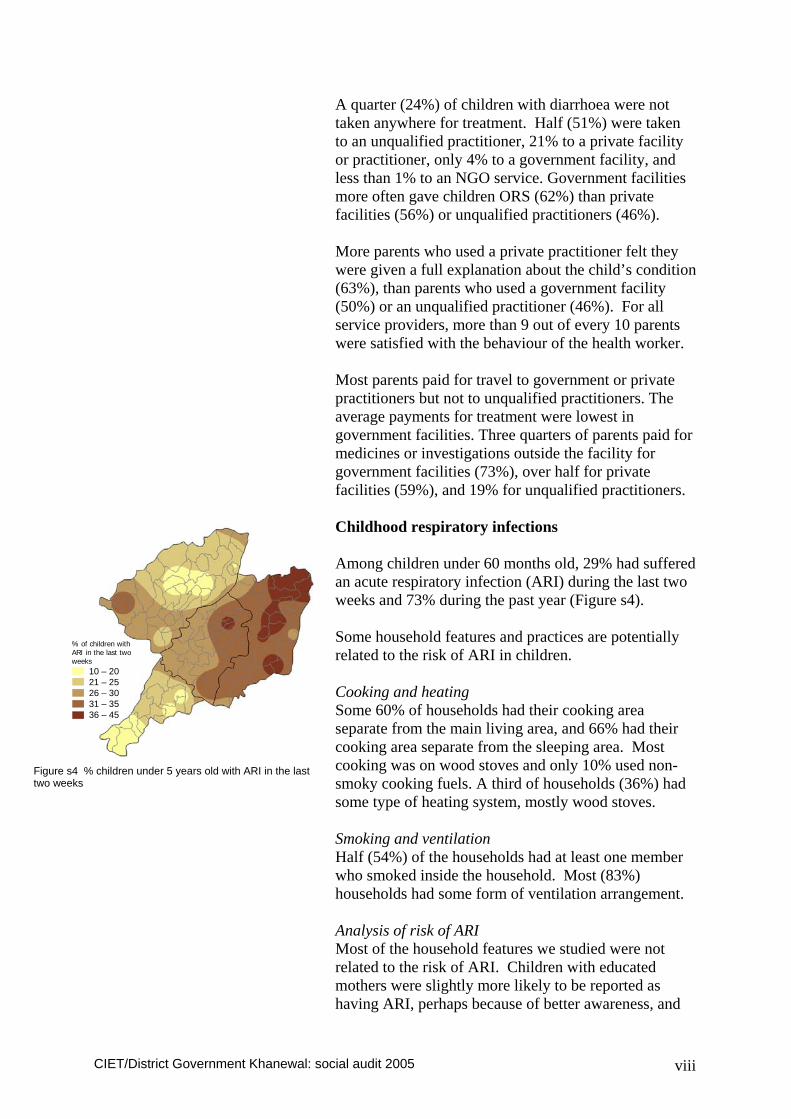
A quarter (24%) of children with diarrhoea were not taken anywhere for treatment. Half (51%) were taken to an unqualified practitioner, 21% to a private facility or practitioner, only 4% to a government facility, and less than 1% to an NGO service. Government facilities more often gave children ORS (62%) than private facilities (56%) or unqualified practitioners (46%). More parents who used a private practitioner felt they were given a full explanation about the child’s condition (63%), than parents who used a government facility (50%) or an unqualified practitioner (46%). For all service providers, more than 9 out of every 10 parents were satisfied with the behaviour of the health worker. Most parents paid for travel to government or private practitioners but not to unqualified practitioners. The average payments for treatment were lowest in government facilities. Three quarters of parents paid for medicines or investigations outside the facility for government facilities (73%), over half for private facilities (59%), and 19% for unqualified practitioners. Childhood respiratory infections Among children under 60 months old, 29% had suffered an acute respiratory infection (ARI) during the last two weeks and 73% during the past year (Figure s4). Some household features and practices are potentially related to the risk of ARI in children. Cooking and heating Some 60% of households had their cooking area separate from the main living area, and 66% had their cooking area separate from the sleeping area. Most cooking was on wood stoves and only 10% used non-smoky cooking fuels. A third of households (36%) had some type of heating system, mostly wood stoves. Smoking and ventilation Half (54%) of the households had at least one member who smoked inside the household. Most (83%) households had some form of ventilation arrangement. Analysis of risk of ARI Most of the household features we studied were not related to the risk of ARI. Children with educated mothers were slightly more likely to be reported as having ARI, perhaps because of better awareness, and
% of children with ARI in the last two weeks
10 – 2021 – 2526 – 3031 – 3536 – 45
Figure s4 % children under 5 years old with ARI in the last two weeks

CIET/District Government Khanewal: social audit 2005 ix
children from households with a heating system were less likely to have ARI, especially in Jahania tehsil. The analysis model indicates that 40 per thousand children could potentially be protected from ARI if all households had a heating system. Treatment of ARI Of mothers visited by an LHW, very few recalled being told how to recognize (1%) or treat (2%) ARI. Of children with ARI in the last 12 months, 15% were not taken anywhere for treatment, 60% were taken to an unqualified practitioner, 23% to a private qualified practitioner, only 4% to a government facility, and 1% to an NGO service. Private practitioners provided a full explanation for 61% of children, government practitioners for 44%, and unqualified practitioners for 48%. All the medicines were provided in the facility for 85% of visits to unqualified practitioners, 51% to private facilities, and 44% to government facilities. Most families paid for travel to government or private facilities but not for travel to unqualified practitioners. Payments for treatment in government facilities were less than those for private or unqualified practitioners. But half of those visiting government facilities had to pay for medicines outside the facility. Childhood measles The description of measles frequency is among children 10-59 months old and excludes cases in children less than 10 months old. In these children, 19% were reported to have had measles (Figure s5). Analysis of risk of measles Younger children were less likely to have had measles than older children. Children who had not been immunised against measles had 1.7 times the risk of having measles compared with children who had been immunized. The analysis indicated that if all children were immunized, this could potentially protect 24 per thousand children from having measles. Costs of measles Of those children aged 10-59 months who had measles in the last 24 months, 63% of their parents paid
% of children 10-59 months who have had measles
10 – 1516 – 2021 – 3031 – 3536 – 40
Figure s5 % children 10-59 months who have had measles

CIET/District Government Khanewal: social audit 2005 x
something for treatment. Among those who paid, the mean amount was Rs 385 (median Rs 200). Childhood immunisations Among children aged 12-23 months, 81% had received BCG vaccine, 67% had received a full course of DPT injections, and 65% had received measles vaccine (Figure s6). Almost all children under 60 months had received polio drops at least once during the last year, and most of them had received drops many times. Knowledge and perceptions about immunisation Nearly all mothers had heard something about immunisations, but sometimes no more than information about where to go to get the immunisation. Some 76% of mothers were able to mention at least one illness preventable by immunisation. Almost all (96%) thought it was worthwhile to immunise children. Only 3% had heard of any adverse effect of immunisation. Among mothers visited by an LHW, 22% recalled being told something about immunisations. Most (84%) of mothers had discussed immunisation in the family. For 44% of the children mothers alone had made the decision about immunisation, for 33% the mother and father decided together, and for 23% mothers were not involved in the decision. Analysis of receiving measles vaccine Children were more likely to be immunised if: they were from urban communities, they were from less vulnerable households, they were older, their mother had some education, their mother knew of some vaccine preventable diseases, their mother had been told by the LHW about immunisations, their family had discussed immunisations, and if their community was visited by a vaccination team. Public satisfaction with basic services Isolated satisfaction ratings must be interpreted with caution as they may be influenced by many factors, but they nevertheless offer a feedback to district governments about a range of services provided by district and tehsil governments. Roads Some 56% of households were satisfied with the roads and 91% said they had access to roads.
% of children aged 12-23 months who had measles vaccine
10 – 3031 – 4546 – 6566 – 8081 – 100
Figure s6 % children 12-23 months who had measles vaccine
CIET/District Government Khanewal: social audit 2005 xi
Public transport Some 77% of households were satisfied with public transport and 98% said they had access to it. Government garbage disposal Only 4% of households were satisfied with garbage disposal and 10% said they had access to a service.. Government sewerage system Only 31% of households were satisfied with garbage disposal and 63% said they had access to a service. Government water supply Only 6% of households were satisfied with government water supply and 9% said they had access to a supply. Agriculture services Some 51% of households were satisfied with agriculture services and 73% said they had access to a service. Government education services Some 74% of households were satisfied with education services and 98% said they had access to a service. Government health services Some 42% of households were satisfied with health services and 92% said they had access to a service. Gas supply Only 10% of households were satisfied with gas supply and 11% said they had access to a supply. Electricity supply Some 77% of households were satisfied with the electricity supply and 94% said they had access to a supply. Commentary This report presents the main findings of the social audit in Khanewal. It will hopefully be a useful reference. But the main work of disseminating the findings and making use of them to support evidence-based planning is only just beginning. Over the coming months the social audit findings will be presented and discussed in many settings within the district, both within and outside government.

CIET/District Government Khanewal: social audit 2005 xii
Some findings worth highlighting for further discussion include: • the quite high rate of childhood diarrhoea and the
protective effect of latrines only if the mother had some education
• the high use of anti-diarrhoea medicines in children • the low use of government health services and high
use of unqualified practitioners for treatment of both diarrhoea and ARI
• the local evidence of the protective effect of measles vaccine on the risk of measles
• the need to increase the rate of childhood immunisations and the evidence for possible interventions to do this
• the contrast between LHW reports of giving information to most mothers and few mothers recalling being given information
• the information about public satisfaction with services and areas where Khanewal is above and below the overall figures for Punjab

CIET/District Government Khanewal: social audit 2005 1
Introduction Commissioned by the National Reconstruction Bureau (NRB), the CIET social audit tracks the public views, use and experience of public services under devolved local government and provides a mechanism for including citizens’ views and suggestions in planning and policy making, particularly at local level. The aims of the five year social audit programme are: • To provide citizen’s views and experience of
devolution • To examine delivery of public services to citizens
and track changes over time • To provide a means of input for citizens into district
level planning • To support evidence-based planning, especially at
district level CIET conducted the baseline national social audit in 2001/2 and the second cycle in 2004/5. The second cycle allowed an assessment of changes since the baseline at the beginning of devolution, and identified factors related to positive outcomes. During the coming months the findings of the second national social audit will be shared and discussed widely with the public, civil society, service providers, planners and policy makers. The third national social audit will begin in the second half of 2006. The social audit programme is set to continue until 2009, with alternating years of data collection and dissemination and use of the findings. The national social audit collects information from a representative sample of some 54,000 households in communities in all districts. The social audit goes beyond information gathering, analysis, and reporting. It goes on to facilitate discussion with communities, formulation of solutions and strategies, validation with other institutions such as health and education facilities, and discussion with local government authorities.
The social audit in focus districts In order to achieve the second two aims of the social audit (above) it is necessary to work in more detail within districts, and CIET is implementing a district social audit in five focus districts. Experience in these districts will facilitate the roll-out of district level social audit to additional districts over time. Work in the first

CIET/District Government Khanewal: social audit 2005 2
focus district, Lasbela, began in 2003, and four further districts – Khairpur, Haripur, Sialkot, and Khanewal – joined towards the end of 2004. In the focus districts the social audit aims to help governments to plan and implement services tailored to the needs of their local populations. It is a means of giving form to the intention of the Local Government Order 2001 to empower citizens to participate in an informed way in decisions that affect their lives, and encourage them to engage in local democratic processes. A key element of the district social audit is the close involvement of government officers, elected representatives and civil society groups, building their skills over time institutionalising the process so that it can be sustained beyond the time of the project. In summary, the aims of the district social audit are: • To assist evidence-based planning at district, tehsil
and union levels • To provide a means of input for citizens into district
level planning • To build capacities of district officers and elected
representatives for evidence-based planning • To produce a sustainable process (over a five year
programme) The five focus districts all joined the scheme based primarily on the interest and enthusiasm of the nazims and other members of their district governments, beginning at the time of disseminating the findings of the baseline (2001/2) social audit in regional meetings. Provincial governments, especially through the provincial departments of local government and rural development, endorsed the choice of focus districts in their respective provinces.
Operationalising the social audit in focus districts In each of the five districts, CIET and the district government have made similar arrangements for the social audit. An initial district orientation meeting(s), attended by key stakeholders inside and outside government (at district and tehsil levels), introduced the concepts of the social audit and the objectives of the district social audit scheme, and provided an opportunity for questions and

CIET/District Government Khanewal: social audit 2005 3
discussion about the proposed processes in the district. Participants identified the issues they considered to be the first priorities to be covered by the district social audit, bearing in mind that the priority issue should be one where it could be possible for the district to act to change the situation. Participants also agreed to form a district social audit steering group, identified a suitable person to be the social audit focal point on behalf of the district government, agreed arrangements for providing office space for the CIET social audit district coordinator, and agreed arrangements for tehsil level orientation meetings. In Khanewal district the initial district orientation meeting took place on 28 October 2004. A series of tehsil orientation meetings across the district introduced participants to the social audit and heard their priority topics for the district social audit. The office of the EDO community development facilitated these tehsil meetings. Participants included tehsil level government officers and elected representatives, as well as representatives from union councils, from civil society, and from the media.
The district steering group discusses policy issues and makes decisions about the social audit at district level. It coordinates support to the CIET team for social audit activities. It also gives inputs into the design of the social audit cycles. It is the forum for discussing recommended actions emerging from the social audit evidence and helping to incorporate these into district planning. In general, the steering group comprises: • District Nazim & Naib Nazim • From district administration:
o DCO o Finance and planning department o Community development department o Key line departments such as health,
education, public health engineering, agriculture, livestock
• Representatives from the district council • Representatives from tehsil councils and
administrations • Civil society representatives such as
NGOs/CBOs/CCBs, academic institutions, media, or other professional bodies

CIET/District Government Khanewal: social audit 2005 4
Annex 1 gives the list of members of the social audit district steering group in Khanewal district. Each district government nominated a sub-technical group to work in detail with the CIET team on selection of the household sample and design of the instruments for the social audit. The groups generally included representation from relevant line departments including finance and planning, community development, health, public health engineering, members from the district council, selected TMOs, and relevant civil society representatives. Annex 2 lists the members of the sub-technical group in Khanewal district. The CIET district coordinator collected basic information about the district to facilitate sampling, mapping and communication. This included: • A list of all important contacts within the district and
all tehsils with full contact details • Population data about district tehsil and union
councils with urban and rural distribution. • A list of union councils in each tehsil, marked as
urban or rural • A recent map of the district with tehsil and union
boundaries
Focus district national core group A national core group supports the social audit in the focus districts. The group includes representation from all the focus districts, from provincial local government departments, and from NRB, with CIET providing the logistic and secretarial support. The terms of reference for the national core group are shown in Annex 3. The national core group shares experiences of the district social audit between the focus districts, identifying what has worked especially well, so that a tool-box for district social audit in other districts can be developed. The inaugural meeting of the group took place on 3 December 2004 in Islamabad, with a follow-up meeting on 11 June 2005 in Lasbela. In these meetings the group agreed their terms of reference, approved a memorandum of understanding between CIET and focus districts (subsequently sent to provincial governments for endorsement), agreed a common topic for the social audit in all the focus districts, received preliminary findings from the social audit and discussed plans for their dissemination.

CIET/District Government Khanewal: social audit 2005 5
Methods Annex 4 gives a general description of the CIET social audit methods. The concept of the social audit is simple: collect information about a key problem from the people concerned and from service providers. Then use this information as a basis for involving the public and service providers in making changes to improve the services. The key steps include: collect information from women and men in households in representative communities about their knowledge, use, perceptions and experience of the problem and their use of relevant services; link this with information from the services and service providers; analyse the findings in a way that points to what actions might improve matters; take the findings back to the communities for their views about what could improve the situation; bring the findings and suggestions to discussions between service providers, planners and community representatives to plan and implement changes. The loop is closed when a repeat fact-finding exercise assesses the changes and their effects.
The topic for the social audit cycle In each district, a short list of topics emerged from the consultative process in district and tehsil level meetings including government and civil society (see Introduction). Four topics came up in all the focus districts, in slightly differing orders of priority. 1. Health (including public and preventive health issues such as hygiene, sanitation and drinking water) 2. Education (with emphasis on girls’ education, special and technical education) 3. Irrigation (islahe aabpashi) 4. Roads and communication These district priorities were discussed in the first national core group meeting. The group agreed on “Public and preventive health” as the topic for the first cycle, noting that others on the shortlist could be topics of subsequent social audit cycles. In the case of Lasbela, some aspects of public health, water supply and sanitation had already been covered in their first social audit cycles, so they extended the focus more onto aspects of childhood immunisation.
A social audit cycle - Clarify the strategic focus - Design instruments, pilot test - Collect information from households on
use, perceptions and their experience of public services
- Link this with information from key informants and relevant services
- Analyse the findings in a way that points to action
- Take findings back to the communities for their views about how to improve the situation
- Bring evidence and community voice into discussions between service providers, planners and community representatives to plan and implement changes

CIET/District Government Khanewal: social audit 2005 6
Data collection instruments CIET worked with district sub-technical groups to design the instruments for social audit, with an emphasis on collecting information that could be useful for planning service improvements. This exercise was also an opportunity for skills transfer to the district teams. Sharing of expertise and suggestions between districts ensured that a common set of instruments emerged with inputs from all districts, suitable for collecting information in the diverse circumstances of the five focus districts. The social audit instruments are standards-based, drawing on CIET experience as well as other relevant sources. In this case, we used in particular the experience of the first social audit in Lasbela as a guide for relevant sections of the instruments. The instruments for the social audit cycle included: a household questionnaire, a community profile, an institutional review of health facilities, a key informant interview for lady health workers, and a feedback focus group guide. The household questionnaire comprised two sections: • general household information from a household
respondent, including demographics of the household, household hygiene practices and water supply, and satisfaction and perceived access to a range of public services
• information from mothers of under five years old children, concerning their education, knowledge, attitudes and practices, as well as illnesses in the children and their management, and immunisation of the children
The community profile was completed by means of discussion with a knowledgeable person in the community and observations by the field workers. It covered garbage disposal, the sewerage system, community drinking water sources, type and location of health facilities, and information about any community organizations. The institutional review of government health facilities serving communities collected information about records and supplies, and, by observation, the presence and functioning of facilities and equipment. It included

CIET/District Government Khanewal: social audit 2005 7
an interview with the vaccinator or other person responsible for the facility vaccination services. A key informant interview collected information from lady health workers in those sites where they worked, including their education and training, visits to the households, any problems they faced, and their relevant knowledge and practice. Feedback focus group guides were developed once the basic findings from the households were available. They presented tehsil level key findings and invited discussion and suggestions for solutions. The guide covered the use of latrines and childhood diarrhoea, management of diarrhoea, the household environment and respiratory infection in children, and how to encourage and support parents to vaccinate children.
Sample and sampling The CIET team and the sub-technical group in each district selected a stratified random cluster sample of communities to give representation of the situation in the different tehsils or talukas. First union councils were randomly selected from each tehsil, reflecting urban/rural spread and with the number according to the population in each tehsil. We included a minimum of four union councils per tehsil. The official list of union councils provided by the district government was used as the sampling frame for the selection of union councils. From each union council we randomly selected one community (village or mohalla) from the list of communities in the union. Khanewal district consists of four tehsils and has 100 union councils – 17 urban and 83 rural. The sample (Figure 1) comprised the following urban and rural sites from each tehsil: Urban Rural Khanewal 1 3 Kabirwala 1 6 Mian Channu 1 6 Jahania 1 4
Total 4 19 In each selected community, the sample included a group of 100 contiguous households with children under five years, spreading out from a random starting
Figure 1. Sample sites for Khanewal social audit 2005 (map)

CIET/District Government Khanewal: social audit 2005 8
point. There was no sampling within the site, all the households were included.
Field teams The field teams comprised district residents, with a majority of women since the main household interviews were with women. In the different focus districts, team members included members of NGOs, senior university students, recent graduates, and councillors. Teams for the household survey and key informant interviews attended a three-day training, including classroom sessions and field practice. Each field team comprised eight female interviewers, one female quality control associate and one male logistic control associate. The field teams trained to conduct the community focus group discussions each comprised two men and two women. More than half of them had participated in the household data collection. Their training lasted three days, including classroom and field practice.
Data collection The field teams undertook data collection for the 23 sites in the sample of Khanewal district in April 2005. Generally, each team completed the household survey in one community in one day. In come cases a site could not be completed in a single day due to difficult terrain or weather conditions. The field teams took with them a letter from DCO, giving official status to the work. On entering each community, the team logistic control associate made contact with community leaders to explain the purpose of the survey and to seek their support for the field work in the community. After preliminary analysis of the household findings, the teams returned to the same communities and conducted focus group discussions. The focus group discussions in Khanewal district took place in July 2005.
Training of field teams
Approaching a household
A household interview

CIET/District Government Khanewal: social audit 2005 9
Data entry and analysis The field supervisers checked the registers and sent them to the CIET data management unit (DMU) in Karachi. Data entry by trained operators used the public domain software package Epi Info. Double data entry with validation reduced key stroke errors. After validation further cleaning of the dataset looked for logical errors, out of range responses and duplications. The cleaning was completed by checking back to the original data registers as necessary. Analysis used CIETmap software. For questions that had multiple responses, we used SPSS software to generate frequencies. Analysis followed and elaborated the analysis plan outlined during the design phase, which identified key outcomes of interest in relation to preventive child health, and factors potentially related to these outcomes. Initial analysis generated frequencies of all main indicators. The values for all the main indicators at district and tehsil level are shown in the tables in Annex 5. Although the sample size in each tehsil reflected the relative population in that tehsil, this was not exact. Therefore, to take into account under- and over-sampling between tehsils, we calculated weights and applied these when making district level estimates. All the figures shown in this report are weighted, unless stated otherwise. Further analysis examined the associations between outcomes and related risk and resilience factors, first in a univariate analysis and then in a multivariate model to examine the effects of relevant variables simultaneously. In this analysis, we included factors measured in instruments other than the household questionnaire, linked to the household and child data by means of linking code numbers. For example, this meso-analysis allowed us to examine the relationship between the distance of the nearest government health facility from the community and vaccination in children, taking into account the effects of other variables related to vaccination. To investigate the relationship between household economic status and important outcomes, we defined a composite variable for household vulnerability, based

CIET/District Government Khanewal: social audit 2005 10
on household roof construction, degree of overcrowding, and occupation of the main breadwinner. If all three factors were adverse, we defined the household as very vulnerable, while if two out of three were adverse, we defined the household as vulnerable. In analysing the reports of the focus group discussions, we identified certain themes mentioned by groups and coded the reports according to whether the theme was present or not. We entered this into the computer to allow us to compare it with household findings. We also used the reports to provide a qualitative understanding of some of the quantitative findings, including extracting quotes of people describing the situation in their own words.

CIET/District Government Khanewal: social audit 2005 11
Findings
The information base Households The survey covered 2400 households (representing 17316 people) in 23 representative communities (Box). The household sample by tehsil is shown in Table 1. The general household respondent was a woman in 88% (2119/2398) of households. Almost all (94% 2266/2400) household heads were male. About half (51%; 1241/2397) of them had some formal education. Some 48% (1112/2360) of the households were ‘vulnerable’ and 15% (338/2360) were ‘very vulnerable’. Table 2 shows household features by tehsil. The proportions of vulnerable and very vulnerable households and of household heads with some education in Khanewal are similar to those across Punjab and in Pakistan overall. The map in Figure 2 shows household vulnerability across the district. Mothers/caregivers In the 2400 households we interviewed 2497 mothers or caregivers. Most of them were the mothers of the children being inquired after (91%; (2275/2497). Only 27% (706/2494) had any formal education. Children The 2497 mothers provided information about 3586 children below 60 months old. Just over half (52%; 1846/3586) were male. Table 3 shows the number of children in each tehsil by age group. Lady health workers (LHW) We interviewed 29 LHWs. Most (18/29) of these were young women between the ages of 18 and 30, 14/29 had less than a 10th grade education while 15/29 had at least a 10th grade education. About half (14/27) had been working as an LHW for 5 years or more and 4/27 were new to the position within the past year.
Box: Household information base • 2400 households • 17316 people • 1846 boys aged less than 60 months • 1740 girls aged less than 60 months
Table 1. The household sample by tehsil Tehsil No.
households Total
people Jahania 516 3760 Kabirwala 734 5060 Khanewal 410 3031 Mian Channu 740 5465
Table 2. Household features by tehsil
Feature Very vulnerable Vulnerable Educated
Head Male head
Jahania 13 45 51 95 Kabirwala 18 54 53 95 Khanewal 16 49 44 94 Mian Channu 11 41 56 93
District Khanewal 15 48 51 94
Punjab 12 47 54 92 Pakistan 13 47 53 93
Table 3 Children in the survey by tehsil
Feature Total children
Children <60
months
Children 12-23
months Jahania 942 803 136 Kabirwala 1280 1078 203 Khanewal 729 615 114 Mian Channu 1300 1090 199 District Khanewal 4251 3586 652
% of very vulnerable households
3 – 1011 – 1516 – 2021 – 2526 – 30
Figure 2 % of “very vulnerable” households (map)

CIET/District Government Khanewal: social audit 2005 12
Childhood Diarrhoea
Frequency of childhood diarrhoea Among children aged less than 60 months, 28% (976/3482) had suffered diarrhoea during the last two weeks and 75% (2629/3482) had suffered diarrhoea in the past 12 months. As shown in figure 3, the proportion of children with diarrhoea during the last two weeks was rather higher in Mian Channu and Khanewal tehsils than in Kabirwala and Jahania. The map in Figure 4 shows the variation across the district in the proportion of children under 5 years old with diarrhoea in the last two weeks. In about half (54%; 1077/2345) the children who had diarrhoea in the past 12 months their last episodes went on for longer than three days and 12% (317/2621) had blood in their stool during the last episode.
Variables potentially related to childhood diarrhoea The field teams collected information about variables at household level potentially related to the risk of diarrhoea in children. Drinking water Nearly all (97%; 2331/2396) households in Khanewal rely on ground water as their main source of drinking water with only a few using either piped water (3%; 61/2396) or surface water (0.3%; 4/2396) (Table 4). As a consequence, nearly all households have a water source defined as a protected source (99%; 2370/2396). Very few households treated their water in any way (1%; 27/2347) and those that did most commonly boiled it. Across the district 74% (1748/2389) respondents allowed interviewers to inspect the household drinking water container. Of these, 97% (1695/1744) were covered, 85% (1476/1738) were clean, and 59% (1022/1733) were raised above ground level. Some
28
26
25
32
30
0 10 20 30 40
Khanewal District
Jahania
Kabirwala
Khanewal
Mian Channu
Figure 3 % of children with diarrhoea in the last 2 weeks
Table 4 % households using different sources of drinking water Piped Ground
Water Surface Water
N
Janania - 100 - 515 Kabirwala 6 94 - 733 Khanewal 1 99 1 410 Mian Channu 2 98 - 738
Khanewal District 3 97 <1 2396
Table 5 % households with different conditions for drinking water containers
Covered Clean Raised Covered,
clean, raised
Janania 99 86 64 60 Kabirwala 97 82 70 63 Khanewal 96 90 57 53 Mian Channu 97 84 46 41
Khanewal District 97 85 59 53
% children with diarrhoea in the last two weeks
15 – 2526 – 3031 – 3536 – 40
Figure 4 % of children with diarrhoea in the last 2 weeks (map)

CIET/District Government Khanewal: social audit 2005 13
53% (928/1734) met the ideal conditions of being covered, clean and raised (Table 5). The map in Figure 5 shows the variation in proportion of households with a covered, clean, raised drinking water container across the district. Latrines Across the district, 61% (1503/2399) of households used a latrine (either a communal or household latrine). Some 58% (1428/2385) of households had some formal type of latrine. Most households without a latrine (90%; 731/819) said this was because they could not afford to have one. The proportions of households using a latrine and having a formal latrine in the household in the different tehsils are shown in Table 6. The map in Figure 6 shows the variation in households with a formal latrine across the district. Focus group views about latrines The community focus groups (of men and women separately) in the sample communities discussed some of the issues around latrines. They first discussed whether, from what they knew, children from households where the members did not use a latrine seemed to get more diarrhoea. Most groups agreed this was the case. Some people noted that the latrines did not help unless they were kept clean. A few were not convinced that latrines made any difference, or considered that they were not necessary in villages surrounded by large fields that people could use for defaecation. Coming to the issue of what could be done to help households install and use latrines, most groups considered that outside financial or technical support was needed, although some also mentioned the need to raise awareness of the benefits of latrines in some households. Most groups were of the opinion that there
Table 6 % households using and having latrines
Use a latrine
Have a latrine
Jahania 66 64 Kabirwala 52 48 Khanewal 54 52 Mian Channu 76 74 Khanewal District 61 58
% with a clean, covered, and raised drinking water container
16 – 3031 – 4041 – 5556 – 6566 – 80
Figure 5 % households with covered, clean, raised drinking water container (map)
% with a formal latrine14 – 3031 – 5051 – 6566 – 8586 – 100
Figure 6 % households with a formal latrine (map)
“It is essential to have a latrine in the house. Children are protected from illnesses and the honour of young girls also remains safe.” Female focus group, Jahania tehsil “Children get diarrhoea even where they have access to a latrine in their houses. It is important to keep a latrine clean.” Female focus group, Kabirwala tehsil “It does not make any difference whether a house has a latrine or not. Children get diarrhoea either way.” Female focus group, Kabirwala tehsil “We do not need latrines in big villages. They have vast fields that people use without any difficulty. Male focus group, Mian Channu tehsil

CIET/District Government Khanewal: social audit 2005 14
was little communities could do to help themselves, mentioning that their neighbours would be unlikely to take their advice or that they were too poor to help themselves. Generally they felt it was the responsibility of the government to help them. This help should, they suggested, be financial and technical. Some participants pointed out that building latrines was no use without a proper sewerage system and water supply. On the other hand, in some communities the focus groups suggested they needed to help themselves, with or without assistance from the government. And some were sceptical about the government helping them even if there were funds to do so. Household hygiene The field teams conducting the household interviews observed and noted some aspects of household hygiene. They observed garbage in the household compound or at the doorway in 77% (1842/2388) of households. They noted sewage water inside the compound or at the doorstep in 43% (1019/2392) of households and excreta (animal or human) inside or at the doorstep of 58% (1383/2389) of households. Table 7 summarises the observations about household hygiene in the four tehsils. The map in Figure 7 shows the variation in proportion of households with excreta observed in or around the homestead across the district. Information about prevention of diarrhoea from the lady health worker (LHW) Some 60% (1447/2496) of mothers said an LHW visited their household. In some households more than one mother was interviewed. Over half the households (60%; 1329/2390) had been visited by an LHW and about half of all households (54% (1228/2325) had been visited in the last month. (Table 8). Few (6%; 87/1410) of those mothers reporting being visited by an LHW recalled that the LHW told them anything about preventing diarrhoea in children. When considered all mothers (including those not visited by an LHW) only 4% (87/2459) had been told by an LHW about prevention of diarrhoea.
Table 7 % households observed with different hygienic conditions in and around the house
Garbage
Sewage water Excreta
Janania 83 44 61 Kabirwala 85 47 71 Khanewal 81 49 61 Mian Channu 63 34 41 Khanewal District 77 43 59
Table 8 Frequency of LHW visits to households %
households Never visited 41 Within the last month 54 More than a month ago, within last 3 months 4 More than 3 months ago, within last 6 months <1 More than 6 months ago but within a year <1 N 2325
“The poor are not even able to educate their children How can they construct latrines?” Female focus group, Khanewal tehsil “People will construct latrines only when they have access to proper drainage.” Female focus group, Khanewal tehsil “The government should give us employment so that we may work hard, earn money and construct latrines on a self-help basis.” Female focus group, Jahania tehsil “This problem is better solved if we all sit together.” Male focus group, Kabirwala tehsil “Even when the government provides funds, it does not follow-up to find out where they are being used.” Female focus group, Mian Channu tehsil
% with excreta observed inside or at the doorstep
0 – 2021 – 3536 – 5051 – 6566 – 85
Figure 7 % households with excreta observed inside or at the doorstep (map)

CIET/District Government Khanewal: social audit 2005 15
The mothers’ recall of what the LHW told them about prevention of childhood diarrhoea contrasts with the information from the interviews with LHWs covering some of the sample communities (see later section). Most of the LHWs reported telling the mothers they visited about prevention of diarrhoea. Mothers' knowledge of causes of diarrhoea About two thirds of mothers (67%; 1626/2464) could correctly identify a cause of diarrhoea in children. The map in Figure 8 shows the variation across the district in the proportion of mothers who could cite a correct cause of diarrhoea in children.
Analysis of risk of diarrhoea in children We collected information about a number of variables that might be associated (positively or negatively) with the risk of diarrhoea in children (diarrhoea in the last two weeks in children aged under 60 months old). These are listed in Table 9. Several of these variables, examined separately, were associated with the risk of diarrhoea. We then undertook multivariate analysis to examine the effects of each of these variables, taking into account the effects of the others. Education of the mother Children whose mothers had some formal education were less likely to have suffered diarrhoea in the last two weeks, taking account of the effects of other variables1. The education of the mother interacted with some of the other variables, so we undertook separate analyses for children whose mothers had some education and children whose mothers had no education. Among children whose mothers had some education: • Younger children (0-36 months) were more likely to
have had diarrhoea in the last two weeks than older children2.
• Children whose mothers could name a correct cause of diarrhoea were less likely to have had diarrhoea than children whose mothers lacked this knowledge3.
1 Weighted OR 0.70, 95% CI 0.58-0.84, 231/979 children whose mothers had some education had diarrhoea compared with 743/2501 whose mothers had no education 2 Weighted OR 2.96, 95% CI 2.08-4.22, 184/6260 younger children had diarrhoea compared with 35/246 older children 3 Weighted OR 0.71, 95% CI 0.52-0.99, 146/675 children whose mothers knew a cause of diarrhoea had diarrhoea compared with 82/292 whose mothers did not know a cause of diarrhoea
% who could correctly identify a cause of diarrhoea
40 – 5051 – 6061 – 6566 – 7071 – 80
Figure 8 % of mothers who could correctly cite a cause of diarrhoea in children (map)
Table 9 Variables potentially associated with the risk of diarrhoea in children • Urban/rural location • Tehsil • Education of the household head • Education of the mother • Household vulnerability • Sex of the child • Age of the child • Nutritional status of the child • Mother’s knowledge of causes of diarrhoea • LHW advice about diarrhoea • Protected water source • Good water storage • Household latrine • Sewage in household or around door • Excreta in household or around door • Garbage in household or around door • Garbage in streets (from community profile) • Sewage in streets (from community profile) • Stagnant water in streets (from CP)*

CIET/District Government Khanewal: social audit 2005 16
• Children from households with a formal latrine were less likely to have had diarrhoea than children from households without a formal latrine4.
The final analysis model for children whose mothers had some education is shown in Table 10. Among children whose mothers had no education: • Younger children (0-36 months) were more likely to
have had diarrhoea in the last two weeks than older children (37-59 months)5.
• There was no effect of a household latrine on the risk of a child having diarrhoea
The fact that a latrine in the household is only protective against diarrhoea if the mother of the child has some education supports the view voiced by some focus group participants that a latrine will only be of benefit if it is kept clean and if mothers teach their children how to use it properly. Mothers with some education are apparently more likely to appreciate this. Their knowledge about causes of diarrhoea is apparently also put into practice, since the children of those educated mothers who could cite one or more of the causes of diarrhoea were less at risk of diarrhoea. We can estimate the number of children who could be protected from diarrhoea by different interventions. In Table 11, the “gain” per thousand children is the number of children who could be saved from having diarrhoea if all children had the intervention in question. If an intervention ensured that all mothers with some education knew about causes of diarrhoea, this could prevent diarrhoea in 23 per thousand children. If all households had latrines, where there was an educated mother this could prevent diarrhoea in 19 per thousand children. But these interventions would only be effective among children whose mothers have some education. Ensuring all households have a latrine, without paying attention to the education of mothers, would not reduce the number of cases of childhood diarrhoea.
4 Weighted OR 0.55, 95% CI 0.36-0.82, 184/832 children from households with a latrine had diarrhoea compared with 44/140 from households without a latrine 5 Weighted OR 1.57, 95% CI 1.29-1.91, 506/1499 younger children had diarrhoea compared with 180/731 older children
Table 10 Model of effects of variables on risk of diarrhoea in children whose mothers had some education Crude
OR Weighted OR
95% CI of weighted OR
Younger age 2.70 2.80 1.87-4.19 Mothers know a cause of diarrhoea
0.75 0.71 0.50-0.99
Formal latrine 0.63 0.57 0.37-0.86 OR=Odds Ratio, a measure of relative risk
Table 11 Potential gains in diarrhoea prevention among children whose mothers have some education Intervention Proportion requiring
intervention (%) Weighted risk difference
95% CI weighted risk difference
Weighted gain per 1000 children
Focus on younger children 64.2 0.167 0.113-0.222 107 Teach mothers about causes of diarrhoea 29.9 0.078 0.002-o.154 23 Ensure latrines in all households 14.4 0.135 0.044-0.226 19 Proportion requiring intervention means those who do not currently have the favourable condition, eg % who currently have no latrine

CIET/District Government Khanewal: social audit 2005 17
Treatment of diarrhoea in children
The following descriptions of experiences with treating diarrhoea are based on the 75% (2629/3482) of children less than 60 months old who had suffered an episode of diarrhoea in the last 12 months. Recall of episodes longer than 12 months ago is less likely to be clear.
Advice from the LHW Few of those mothers reporting being visited by an LHW (13%; 181/1410) recalled that the LHW told them anything about treating diarrhoea in children. When considered all mothers (including those not visited by an LHW) only 8% had been told about treatment (181/2459) of diarrhoea. Mothers’ knowledge and household management of diarrhoea Some 75% (1915/2493) of mothers reported they would give a child more fluids during an episode of diarrhoea while 60% (1530/2491) said they would give the child either the same or more food. When actually treating an episode of diarrhoea in the last 12 months in children under five years old, mothers provided 69% (1870/2626) of the children with more fluids and 63% (1689/2621) with either the same or more food. The variation across the district in the proportion of children given more fluids in their last episode of diarrhoea during the last year is shown in the map in Figure 9. In most cases (82%; 2152/2606) the mothers or other carers in the home reported giving the child medicine to stop the diarrhoea. The variation across the district is shown in Figure 10. This is generally not good practice and these anti-diarrhoeal medications can be dangerous for young children. However, it is clearly a common practice in home management of diarrhoea to give such medication and anti-diarrhoea medicines are perhaps even prescribed by health care practitioners (see below).
% of children who were given more fluids
46 – 5556 – 6061 – 7071 – 7576 – 86
Figure 9 % children under 5 years old given more fluids during last episode of diarrhoea (map)
% of children who were given anti-diarrhoea medicine
69 – 7576 – 8081 – 8586 – 9091 – 96
Figure 10 % children under 5 years old given anti-diarrhoea medicine during last episode of diarrhoea (map)

CIET/District Government Khanewal: social audit 2005 18
Focus group views about fluids for children with diarrhoea Clearly not all mothers or caregivers know to give children with diarrhoea extra fluids, and even less manage to do this in practice. We discussed this in the community focus groups. The groups first discussed why many mothers do give extra fluids to children with diarrhoea. Participants explained that giving fluids prevented children from becoming sick with dehydration. Some also mentioned that the child would be thirsty and ask for water, while others noted that it could avoid having to take the child for medical attention outside the home. In discussing why some mothers do not give children with diarrhoea extra fluids, most groups mentioned poor education or lack of knowledge among mothers, while others noted mothers may not have time to give the extra fluids, that the water available was poor quality, or that they had misconceptions about adverse effects of giving extra fluids. The groups suggested that health workers, especially LHWs, community and religious leaders, and parents or other family members could give the message about extra fluids to mothers. Taking children with diarrhoea for treatment Among those children less than 60 months old who had suffered diarrhoea in the last 12 months, 24% (622/2619) were not taken anywhere for treatment. The most popular choice for treatment was an unqualified practitioner. Half (51%; 1320/2619) of the children with diarrhoea were taken to an unqualified practitioner, 21% (560/2619) to a private facility or practitioner, only 4% (102/2619) to a government facility, and less than 1% (15/2619) to an NGO service. The type of service used is shown by tehsil in Table 12. The variation across the district in the proportion of children with diarrhoea taken somewhere for medical care is shown in the map in Figure 11.
Table 12 % children taken to different types of facilities for treatment of diarrhoea in the past 12 months
No where
Gov't facility
Private facility Unqualified NGO
Janania 20 5 21 52 2 Kabirwala 19 5 17 59 0.4 Khanewal 24 3 22 51 0.2 Mian Channu 32 2 26 40 0
Khanewal district 24 4 22 50 0.4
“Children whose mothers give them water during diarrhoea do not develop the disease of dryness.” Female focus group, Kabirwala tehsil “The poor cannot afford injections and drips. It is better to give the child water in the house.” Female focus group, Mian Channu tehsil
“Mothers are so ignorant they even stop fresh air reaching their children with diarrhoea. How can they be expected to give their children more water?” Male focus group, Mian Channu tehsil “They have a lot of children and it gets difficult to look after all of them” Female focus group, Jahania tehsil “Spiritual practitioners give amulets to women and tell them to make the child drink less water.” Female focus group, Mian Channu tehsil
“People from the health department must call on every house to tell them about this.” Male focus group, Kabirwala tehsil
% of children who were taken somewhere for treatment
54 – 6566 – 7071 – 7576 – 8081 – 90
Figure 11 % children under 60 months old taken for treatment during their last episode of diarrhoea (map)

CIET/District Government Khanewal: social audit 2005 19
Experience of treatment for diarrhoea Virtually all children (99%; 2755/2775) who were taken for treatment were seen by a doctor/ practitioner or health worker regardless of the type of facility. ORS and other medication Children taken to a government facility for treatment were more frequently provided with ORS (62%; 66/101) than children taken to either a private facility (56%; 315/560) or an unqualified practitioner (46%; 606/1307). Unqualified practitioners (81%; 1067/1301) and private facilities (47%; 271/560) more commonly provided any other medicines if prescribed than did government facilities (34%; 40/101) (Figure 12). We do not know what these other medicines were nor in how many cases any other medicines were prescribed. In most cases no “other medicines” should be prescribed. Anti-diarrhoea medicines can be dangerous in young children, and antibiotics are not advisable in most cases of diarrhoea. Government services apparently gave more ORS than the other two services but we do not know if they prescribed less “other medicines” than the other service providers. Explanation of illness More of the parents who took their child to a private practitioner or clinic felt they were given a full explanation about the child’s condition (63%; 365/559), than the parents who took their child to a government facility (50%; 51/102) or to an unqualified practitioner (46%; 603/1295) (Figure 13) Satisfaction with service received Generally, satisfaction with the behaviour of the doctor or health worker was high. Satisfaction among users of unqualified (97%; 1270/1306) and of private practitioners (96%; 541/560) was slightly greater than among users of government facilities (92%; 95/102). But for all service types, more than 9 out of every 10 parents of children with diarrhoea said they were satisfied with the behaviour of the doctor or health worker. Similarly, nearly all mothers were satisfied with the treatment received from the facility for all facility types.
62
56
46
34
47
81
0 20 40 60 80 100
Government
Private
UnqualifiedOther medicinesavailableORS given
Figure 12 % of children provided ORS and availability of other medicines from health facilities or practitioners
50
63
46
0 20 40 60 80
Government
Private
Unqualified
Figure 13 % of mothers of children with diarrhoea who thought they got a full explanation of their child's illness

CIET/District Government Khanewal: social audit 2005 20
Some 92% (95/102) were satisfied with the treatment at a government facility, 96% (534/560) were satisfied with treatment from a private facility and 94% (1238/1309) were satisfied with their treatment from an unqualified practitioner. For all facility types mothers most frequently reported being satisfied with the treatment at the facility simply because they received “good treatment”. Some were satisfied because of the good doctors and staff available at the facility (Table 13). Those few people who were dissatisfied with the facility most commonly simply cited “poor treatment” as their reason for all types of facilities. Other reasons mentioned are shown in Table 14. Costs of treatment Travel In 60% (38/101) of cases where children were taken for treatment to a government facility, families had to pay something for travel. The mean amount for these families was Rs39. For private treatment families had to pay for travel in 70% (353/554) of cases with a mean amount of Rs68. Few families who took their children to unqualified practitioners had any travel costs (16%; 200/1313) averaging Rs81. (Table 15) Treatment at the facility Most families had to pay for treatment at the facility or practitioner for all types of facilities. The mean amount paid at a government facility (Rs90) was less than that paid at either a private facility (Rs276) or an unqualified practitioner (Rs123) (Table 16) Medicines or investigations outside the facility In about three quarters cases of children going for treatment at a government facility (73%;59/99) and in about half for those going to a private facility (59%; 318/549) families had to pay for medicines or investigations outside the facility. Families had to pay in fewer cases (19%; 218/1301) when getting treatment at unqualified practitioners. The mean amount paid for medicines or investigations after visiting a government facility (Rs953) was higher than for either a private (Rs454) or an unqualified facility (Rs300). (Table 17)
Table 15 % cases that paid, mean and median amounts paid (of those who paid) for travel for treatment of diarrhoea
Facility type % cases paid
Mean amount (Rs)
Median amount (Rs)
Government 60 (38/101) 39 20 Private 70 (353/554) 68 20
Unqualified 16 (200/1313) 81 20
Table 16 % cases that paid, mean and median amounts paid (of those who paid) for diarrhoea treatment at the facility
Facility type % cases paid
Mean amount (Rs)
Median amount (Rs)
Government 91 (93/101) 90 5 Private 96 (527/552) 276 60
Unqualified 96 (1227/1276) 123 40
Table 17 % cases that paid, mean and median amounts paid (out of those who paid) for diarrhoea medicines or investigations outside the facility
Facility type % cases paid
Mean amount (Rs)
Median amount (Rs)
Government 73 (59/99) 953 100
Private 59 (318/549) 454 200
Unqualified 19 (218/1301) 300 80
Table 13 Why mothers were satisfied with the treatment from the facility (% mothers) Reasons Govt Private Unqualified Good doctor/staff 12 20 13 Good facilities/services 2 - 1 Good treatment 78 78 83 Low cost/free treatment 7 <1 2 Good access/nearby 1 <1 2 No other choice - - <1 N 95 534 1238
Table 14 Why mothers were dissatisfied with the treatment from the facility (% mothers) Reasons Govt Private Unqualified Doctor/staff not available - 11 - Poor facilities/services 21 4 - Poor treatment 79 62 81 Too expensive/can't afford - 17 6
No other choice - 5 13 N 5 20 66

CIET/District Government Khanewal: social audit 2005 21
Childhood respiratory infections
Frequency of childhood respiratory infections Among children aged less than 60 months, 29% (959/3493) had suffered an acute respiratory infection (ARI) during the last two weeks and 75% (2602/3493) suffered from ARI during the past year. The information about episodes of ARI came from the mother or main carer of the child. They were asked about episodes when the child had a cough, fever and rapid breathing. The proportions of children with ARI during the last two weeks are shown by tehsil in Figure 14. ARI seems to be rather less frequent in Jahania and Kabirwala tehsils than in Khanewal and Mian Channu tehsils. The map in Figure 15 shows the variation across the district in proportion of children under 60 months old with ARI in the last two weeks.
Variables potentially related to ARI The field teams collected information about factors at household level that might have an impact on the risk of respiratory infections in children. Kitchen and cooking arrangements Some 57% (1418/2400) of households had their kitchen or cooking area separate from the main living area. And 66% (1622/2400) had their kitchen or cooking area separate from the sleeping area. The types of cooking stove used are shown in Table 18. They were mostly wood stoves. We categorized stoves into those producing smoke and those not producing smoke on the basis of the type of fuel. Across the district just 10% (295/2397) of households used a cooking stove that did not produce smoke.
29
17
23
32
37
0 10 20 30 40
Khanewal District
Jahania
Kabirwala
Khanewal
Mian Channu
Figure 14 % of children under 60 months old with ARI in the last 2 weeks
Table 18 % households with different stove types for cooking Stove type % households Wood stove 89 Sui gas stove 10 Kerosene stove <1 Electric stove <1 Cow dung 1 Gas cylinder 1 N 2397
% of children with ARI in the last two weeks
10 – 2021 – 2526 – 3031 – 3536 – 45
Figure 15 % of children under 60 months old with ARI in the last 2 weeks (map)

CIET/District Government Khanewal: social audit 2005 22
Heating arrangements Table 19 shows the heating methods used in households. Some 36% (881/2400) of households used some type of heating system, mostly wood stoves. We categorised heating systems into those producing smoke and those not producing smoke. Some 69% (1657/2400) of households used a heating system not producing smoke (or no heating system at all) and 32% (743/2400) used a heating system likely to produce smoke. Smoking in the household We asked about smoking by members of the household, and in particular about smoking within the household. Some 54% (1116/2396) of households had a least one member who smoked inside the household. Ventilation The field teams observed ventilation arrangements in the households. They recorded some sort of ventilation system in 83% (2002/2374) of households across the district. Focus group views about smoke in the household There is evidence from the literature that exposure to smoke in the household, through cooking stoves, heating arrangements, or smoking by members of the household, increases a child’s risk of ARI and can have adverse long term consequences for lung development. In the community focus groups we discussed what could be done to improve the household environment so as to prevent children’s exposure to smoke. The group participants suggested using alternative fuels, providing more ventilation, keeping the kitchen and sleeping areas separate, and ensuring that household members did not smoke indoors. However, they also mentioned problems with implementing these ideas. The groups suggested that while they themselves could do things like avoiding smoking in front of children, the government would have to help, for example by providing access to gas as a fuel.
Table 19 % households with different heating systems Heater type % households None 64 Wood heater 29 Sui gas heater 4 Coal heater 1 Kerosene heater <1 Electric heater 1 Cow dung <1 Gas cylinder <1 N 2400
“Those who have only one room for eating as well as sleeping, what can they do about it?” Female focus group, Khanewal tehsil “The government cannot install exhausts in every house. People should at least do this themselves.” Female focus group, Jahania tehsil “If a husband smokes, he should go out and smoke. But here husbands sit and exhale the smoke onto their wives.” Female focus group, Kabirwala tehsil “If we have access to gas, we will save more and there will be less smoke as well.” Male focus group, Mian Channu tehsil

CIET/District Government Khanewal: social audit 2005 23
Analysis of risk of childhood ARI As described above, we collected information about several variables that might be associated (positively or negatively) with the risk of ARI in children (ARI in the last two weeks in children aged under 60 months old). These are listed in Table 20. We found no association between most of these variables and the risk of ARI in the last two weeks. The only two variables that were associated with the risk of ARI were education of the mother and whether the household used some type of heating system (whether or not it produced smoke – almost all the systems in use did produce smoke). We examined the effects these two variables together, each taking into account the effect of the other. Education of the mother Children whose mothers had some education were slightly more likely to be reported by their mothers to have had ARI in the last two weeks, compared with children whose mothers had no education6. This may be due to improved recognition of ARI by mothers with some education. Household heating system Children from households with a heating system were less likely to have had ARI in the last two weeks, compared with children from households without a heating system7. This relationship between having a heating system and the risk of ARI in children was much more marked in Jahania tehsil, where children from households without a heating system had nearly three times the risk of ARI compared with children from households with a heating system8. As shown in Table 21, if all households had a heating system this could be predicted to reduce the number of cases of ARI in the district by 40 per thousand children.
6 Weighted OR 1.16, 95% CI 0.98-1.37, 299/985 children whose mothers had some education had ARI compared with 660/2506 whose mothers had no education 7 Weighted OR 0.68, 95% CI 0.58-0.79, 302/1337 children from households with a heating system had ARI compared with 657/2156 from households without a heating system 8 Weighted OR 0.36, 95% CI 0.24-0.54, in Jahania tehsil 33/342 children from households with a heating system had ARI compared with 104/455 without a heating system
Table 20 Variables potentially associated with the risk of ARI in children • Urban/rural location • Tehsil • Education of the household head • Education of the mother • Household vulnerability • Sex of the child • Age of the child • Nutritional status of the child • Measles vaccination of the child • Household heating system • Heating system producing smoke • Kitchen separate from living area • Sleeping area separate from kitchen • Cooking stove producing smoke • Ventilation for household • Household members smoking inside
Table 21 Potential gains in ARI prevention Intervention Proportion requiring
intervention (%) Weighted risk difference
95% CI weighted risk difference
Weighted gain per 1000 children
Ensure heating system in all households 61.7 0.066 0.039-0.092 40 Proportion requiring intervention means those who do not currently have the favourable condition, eg % who have no heating system

CIET/District Government Khanewal: social audit 2005 24
Information from the lady health worker Of the 60% (1447/2496) of mothers that reported an LHW visited their household less than 1% (0.6%; 12/1407) recalled that the LHW told them anything about recognising when a child has ARI and just 2% (33/1409) recalled being told anything about treating a child with ARI. Considering all mothers, including those not visited by an LHW, only 0.5% (12/2496) were told by an LHW about recognition of ARI and 1% (33/2459) about treatment for ARI.
Treatment of ARI The following description of experiences with treating ARI are based on the 75% if children under 60 months who had suffered an ARI episode in the last 12 months. Recall of episodes longer than 12 months ago is less likely to be clear. Source of treatment Among those children less than 60 months old and who suffered an ARI episode in the last 12 months, 15% (371/2594) were not taken anywhere for treatment. The most common choice for treatment was an unqualified practitioner. Across the district, 57% (1475/2594) were taken to a private non-qualified practitioner, 23% (612/2594) were taken to a private, qualified practitioner, only 4% (107/2594) were taken to a government facility, and 1% (29/2594) were taken to an NGO service (Figure 16). Table 22 shows the proportions of children taken to different types of facilities for treatment for ARI in each tehsil. The map in Figure 17 shows the variation across the district in the proportion of children with ARI taken anywhere for treatment. Views of community focus groups The focus groups discussed why some children with ARI are not taken anywhere for treatment. They also considered the ways in parents which could be encouraged and supported to take children with ARI for treatment.
15
4
23
57
1
0 10 20 30 40 50 60
No where
Government
Private
Unqualified
NGO
Figure 16 % children with ARI taken to different health care providers
Table 22 % children taken to different types of facilities for treatment of ARI in the past 12 months
No where
Gov't facility
Private facility Unqualified NGO
Janania 8 6 25 59 3 Kabirwala 12 4 16 66 1 Khanewal 18 4 23 55 0.2 Mian Channu 18 3 30 50 0.1
Khanewal district 15 4 23 57 1
% of children with ARI who were taken somewhere for treatment
70 – 7576 – 8081 – 8586 – 9091 – 95
Figure 17 % children under 60 months old taken anywhere for treatment in last episode of ARI (map)

CIET/District Government Khanewal: social audit 2005 25
Focus group participants explained the problems of poverty, meaning they could not afford the visit, and especially the cost of medicines which were usually not available in government health facilities, and of lack of access to health facilities. A few expressed the view that the children would get better without the need for taking them for treatment or even that some parents did not pay attention to the needs of their children. The main suggestions from the groups to support people to take their children with ARI for treatment were concerned with better access to health facilities, as well as more medicines available in health facilities, and better treatment from doctors and health workers. Service received from health care providers Virtually all children (99.5%; 2172/2183) who were taken for treatment were seen by a doctor or health worker regardless of the type of facility they went to. Private practitioners provided a full explanation of the child's illness more often than either government or unqualified practitioners. Private practitioners provided a full explanation for 61% (374/593) of children, government practitioners for 44% (45/107) of children and unqualified practitioners for 48% (702/1435) of children (Figure 18). There was greater variation between facility/practitioner types around providing all the prescribed medicines when the child with ARI was taken for treatment. Parents taking their children with ARI to an unqualified practitioner were more frequently (85%; 1227/1443) provided with all medicines than those who sought treatment at a private (51%; 311/593) or government (44%; 46/105) facility (Figure 19). Satisfaction with treatment received Nearly all mothers were satisfied with the behaviour of the doctor or health worker (98%; 2102/2146) and with the treatment from the facility (97%; 2086/2150) for all facility types. For all three types of facilities or /practitioners the most common reason for being satisfied was the “good treatment” received (79%; 1625/2060) followed by the good doctors/ staff at the facility (17%; 350/2060).
44
61
48
0 10 20 30 40 50 60 70
Government
Private
Unqualified
Figure 18 % mothers/caregivers provided with a full explanation of their child's illness, for children with ARI
44
51
85
0 10 20 30 40 50 60 70 80 90
Government
Private
Unqualified
Figure 19 % of parents of children with ARI provided with all medicines prescribed
“We earn 100 rupees a day. If we buy medicine with it, the rest of the household members will starve.” Male focus group, Mian Channu tehsil “Where can we take our children for treatment? We don’t have access to hospitals.” Female focus group, Khanewal tehsil “Children get well through household remedies.” Female focus group, Jahania tehsil “People have a lot of children. That’s why they are not bothered about them.” Male focus group, Mian Channu tehsil
“We must have access to either transport or a hospital nearby.” Male focus group, Khanewal tehsil “The government must keep an eye on public doctors so that they perform their duties responsibly.” Female focus group, Jahania tehsil

CIET/District Government Khanewal: social audit 2005 26
Those few parents who were dissatisfied with the facility most commonly cited “poor treatment” as their reason (46/62), for all types of facilities. Not having any other choice (7/62) and not having good doctors or staff available (4/62) were also mentioned. Costs of treatment of ARI Travel In 55% (56/106) of cases where children were taken for treatment to a government facility, families had to pay something for travel. The mean amount for these families was Rs36. For private treatment families had to pay in 64% (363/591) of cases with a mean amount of Rs58. Few families who took their children to unqualified practitioners had any travel costs (16%; 241/1450) averaging Rs56. (Table 23) Treatment costs at the facility Most families had to pay for treatment at the facility or practitioner for all types of facilities. The mean amount paid at a government facility (Rs34) was less than that paid at either an unqualified practitioner (Rs99) or private facility (Rs292). (Table 24) Medicine or investigation costs outside the facility In about half of the cases of children taken for treatment at a government facility (55%; 58/106) or a private facility (53%; 303/585) families had to pay for medicines or investigations outside the facility. Families had to pay in fewer cases (14% (201/1434) after getting treatment at unqualified practitioners. The mean amount paid after visits to a government facility (Rs198) was less than after visits to either a private qualified (Rs486) or an unqualified facility (Rs251). (Table 25)
Table 25 % cases that paid, mean and median amounts paid (out of those who paid) for ARI medicines /investigations outside the facility
Facility type % cases paid
Mean amount Rs)
Median amount (Rs)
Government 55 (58/106) 198 100
Private 53 (303/585) 486 200
Unqualified 14 (201/1434) 251 100
Table 24 % cases that paid, mean and median amounts paid (out of those who paid) for ARI treatment at the facility
Facility type % cases paid
Mean amount (Rs)
Median amount (Rs)
Government 95% (100/106) 34 2
Private 94% (546/582) 292 95
Unqualified 94% (1358/1437) 99 50
Table 23 % cases that paid, mean and median amounts paid (out of those who paid) for travel for treatment of ARI
Facility type % cases paid
Mean amount (Rs)
Median amount (Rs)
Government 55 (56/102) 36 20 Private 64 (363/591) 58 24
Unqualified 16 (241/1450) 56 20

CIET/District Government Khanewal: social audit 2005 27
Childhood measles
Frequency of childhood measles The following analysis and description of the frequency of measles excludes children who were less than 10 months old at the time of the survey as well as those children who had measles at less than 10 months of age because diagnosis of measles in children under 10 months of age can be unreliable. Among children 10-59 months old 19% (498/2690) had had measles, excluding measles cases at under 10 months old. The rate of measles infection in the different tehsils is shown in Figure 20. Measles was most common in Mian Channu tehsil and least common in Jahania tehsil. The map in Figure 21 shows the variation across the district in the proportion of children aged 10-59 months who have had measles.
Analysis of risk of measles We collected information about a number of variables that might be associated (positively or negatively) with the risk of measles in children (measles children aged 10-59 months and excluding ‘measles’ occurring at under 10 months old). These are listed in Table 26. Note that we excluded from the analysis cases of measles that occurred before measles vaccination or within one month after the vaccination (it takes a month for the protection to be fully developed). Those associated with the risk of measles when examined separately are marked with a (*). We then undertook multivariate analysis to examine the effects of each of these variables, taking into account the effects of the others. The model from the multivariate analysis is shown in Table 27. Age of the child Older children were more likely to have had measles than younger children9. This may simply reflect that they have had a longer time at risk, since we are examining the risk of ever having had measles.
9 Weighted OR 2.81, 95% CI 2.25-3.50, 1221/1384 children aged 10-36 months did not have measles compared with 971/1306 children aged 37-59 months
19
15
17
17
23
0 10 20 30
Khanewal District
Jahania
Kabirwala
Khanewal
Mian Channu
Figure 20 % children aged 10-59 months who have had measles, excluding cases at under 10 months old
% of children 10-59 months who have had measles
10 – 1516 – 2021 – 3031 – 3536 – 40
Figure 21 % children aged 10-59 months who have had measles, excluding cases at under 10 months old (map)
Table 26 Variables potentially associated with the risk of measles in children • Urban/rural location* • Tehsil • Education of the household head • Education of the mother • Household vulnerability • Sex of the child • Age of the child* • Nutritional status of the child • Measles vaccination of the child* * variables related to risk of measles in univariate analysis

CIET/District Government Khanewal: social audit 2005 28
Measles immunisation Children who had not been immunised against measles had 1.7 times the risk of having measles compared with children who had been immunised10. This is the protective effect of measles vaccine, taking into account other variables potentially related to the risk of contracting measles. Population benefit from measles immunisation We can estimate the number of children in the population of Khanewal who could be prevented from having measles if all children were immunised against measles. If all children were immunised against measles, this could reduce the number of cases of measles in the district by 24 per thousand children (Table 28). At present, 190 per thousand children in Khanewal have had measles, so this would be a useful reduction.
Payment for cases of measles We asked mothers whose children had had measles about the cost of treating the child. In order to ensure a reasonable recall of events, we restricted our analysis of costs to cases of measles in the last 24 months, among children 10-59 months old. Of those children aged 10-59 months who had measles in the last 24 months, 63% (226/354) of their parents paid something for the treatment of the disease. Among those 226 who paid, the weighted mean amount was Rs 385 (median Rs 200, range 5-6000).
10 Weighted OR 1.73, 95% CI 1.35-2.21, 1487/1751 children who had received measles vaccine did not have measles compared with 638/787 children who had not received measles vaccine
Table 27 Model of effects of variables on the chance of not having measles Crude
OR Weighted OR
95% CI of weighted OR
Younger age 2.71 2.81 2.25-3.50 Measles vaccine 1.32 1.73 1.35-2.21 OR=Odds Ratio, a measure of relative risk
Table 28 Potential gains in measles prevention in children 10-59 months old Intervention Proportion requiring
intervention (%) Weighted risk difference
95% CI weighted risk difference
Weighted gain per 1000 children
Ensure all children are vaccinated 31.0 0.077 0.043-0.112 24 Proportion requiring intervention means those who do not currently have the favourable condition, eg % who are unvaccinated

CIET/District Government Khanewal: social audit 2005 29
Childhood immunisations
Immunisation status of the children In this section, the immunisation status of the children is described among children aged 12-23 months old, who should by then have completed all their immunisations. Table 29 summaries the immunisation status of children across the district, for the basic childhood vaccines. BCG Some 81% (526/644) of the children aged 12-23 months had received BCG vaccine, normally given at birth or soon after (Table 29). The map in Figure 22 shows the variation in BCG vaccination rate across the district. DPT Among the children aged 12-23 months, 80% (507/637) had received at least one DPT injection, and 67% (427/637) had received at least three injections (or a ‘full course’) during their first year of life. We may have over-estimated the number of children who received three injections of DPT vaccine because we included children whose mothers were only able to say they had “completed the course” without saying how many injections this comprised. The proportion of children who had received three injections, or a full course, of DPT vaccine, was rather lower in Kabirwala than in other tehsils, and highest in Mian Channu tehsil (Table 29). The map in Figure 23 shows the variation in rate of completion of a full course of DPT vaccine across the district. Measles Some 65% (413/635) of children aged 12-23 months had received the measles vaccine, usually given at around nine months old. The measles vaccine is the last in the series of childhood vaccines, and many children have apparently “dropped out” of the immunisation schedule before the age of nine months. Once again, Kabirwala tehsil had the lowest rate of measles immunisation and Mian Channu tehsil had the highest rate (Table 29). The variation in measles immunisation rate across the district is shown in the map in Figure 24.
Table 29 % children 12-23 months immunised
BCG DPT (full course) Measles Polio drops
(in last 12 m) Jahania 84 65 64 100 Kabirwala 71 45 44 100 Khanewal 86 76 74 100 Mian Channu 89 85 81 100
Khanewal district 81 67 65 100
% of children aged 12-23 months who had BCG vaccine
55 – 6566 – 7576 – 8081 – 9091 – 100
Figure 22 % children 12-23 months who had BCG (map)
% of children aged 12-23 months who had DPT 3 injections
10 – 3031 – 4546 – 6566 – 8081 – 100
Figure 23 % children 12-23 months who had full course of DPT injections (map)
% of children aged 12-23 months who had measles vaccine
10 – 3031 – 4546 – 6566 – 8081 – 100
Figure 24 % children 12-23 months who had measles vaccine (map)

CIET/District Government Khanewal: social audit 2005 30
Polio Among children aged 12-23 months, 100% (638/639) had received polio drops at least once in the last 12 months (Table 29). When all children aged less than 60 months were included, almost all (97%; 3440/3530) had received polio drops in the last 12 months. Many of the children had received polio drops several times during the last year, with mothers reporting they got them “every time” the polio team visited.
Why children are not immunised For each child (12-59 months) that had not received all the immunisations (or any of them), we asked the mother or main caregiver why not. The mothers most commonly cited problems of access: either that the health facility for immunisations was too far away or that the family could not spare the time of someone to take the child for immunisation. Table 30 shows the reasons given for children not being immunised. Carelessness or lack of awareness implied that immunisation of children was not prioritised by the family over other calls on their time and household economy. A few mothers said they thought vaccination caused harm or that they did not believe in it. Views from community focus groups The community focus groups explored the reasons why some families did not have their children immunised. The participants were asked if they thought parents who did not immunise their children understood the risk they were taking and why they might still not immunise even if they did understand the risk. Most of the focus groups agreed that probably people did not fully understand the risk they were taking by failing to immunise their children. Mostly they ascribed this to lack of education. Some mentioned that people did not realise how serious measles could be. To explain why people who understood the risk would still not immunise their children, the groups mentioned the problems of access, especially difficulties for women travelling a distance from their homes. Some mentioned fears and misconceptions about adverse effects of immunisation. Others explained that the risk of something in the future would not weigh up against more immediate problems.
Table 30 Reasons why children (12-59 months) are not immunised Reasons % children No facility nearby/difficult access 51 Lack of awareness 13 Carelessness of family 10 Vaccination would cause harm 9 Don't have time/ no one to take child 7 Don't believe in it / no tradition 8 Family does not allow 1 Can't afford it / too poor 1 N 782
“People are uneducated. That’s why they are not aware of the dangers of lack of immunisations.” Male focus group, Kabirwala tehsil “People don’t feel that measles is such a serious disease. If they knew that, they would attach a lot of importance to it.” Male focus group, Jahania tehsil
“Immunisation teams don’t visit our area. How can anyone blame parents and their children?” Female focus group, Kabirwala tehsil “People are afraid that vaccinations will sterilize their children.” Male focus group, Khanewal tehsil “Our problems are so many that we are only able to fathom coming dangers, not those that seem far away.” Male focus group, Mian Channu tehsil

CIET/District Government Khanewal: social audit 2005 31
Some groups complained about vaccination services, mentioning problems of visiting teams falsely inflating the number of children they actually immunised in a community, or mothers not finding vaccine or vaccinators when they visited health facilities. Others explained their families did not have a tradition of vaccination. To help parents to have their children immunised, the groups suggested both increasing public awareness of the importance of immunisation, and at the same time increasing access to immunisation services. The idea of visiting immunisation teams was especially popular, but participants also mentioned improving access to health facilities offering immunisation.
Mothers’ knowledge and perceptions about immunisations Awareness about immunisation Some 94% (2323/2490) of the mothers (or carers) had heard about immunisation for children from some source. Some mothers gave more than one source for their information. Their sources of information about immunisation for children are shown in Table 31. Their most common source of knowledge was announcements from the mosque or a visiting team. This information is really only about the logistics of getting the child to an immunisation point, rather than anything about the vaccines and their effects. Among the mothers, 84% (2043/2459) were able to mention at least one illness preventable by immunisation. In some cases, their perceptions about which diseases could be prevented by immunisation were incorrect. For example, some mothers thought “all illnesses” could be prevented by immunisation. Some 76% (1855/2459) of mothers were able to mention correctly at least one illness preventable by immunisation. Views about benefits of immunisation The interviewers first asked the mothers what they believed their neighbours thought about immunising children. Not all the mothers knew what their neighbours’ views on this matter were. Some 91% (2268/2496) of the mothers said their neighbours
Table 31: Mothers' sources of information about immunisation for children Indicator % mothers Announcement 34 Electronic media (TV, radio) 28 Family, neighbours, friends 14 Doctor/hospital 10 Vaccination team 8 LHV/ LHW/ Dai 5 Written material (newspapers, books, pamphlets) 1
“Vaccination teams just see 5-10 children. They leave and write down that all the children have been immunised.” Male focus group, Mian Channu tehsil “When we go to a health centre we are told that the vaccine has ended.” Female focus group, Jahania tehsil “My mother in law says: ‘What kind of children have you produced that they ought to be immunised? We were never immunised, so why are you behaving so delicately?’” Female focus group, Kabirwala tehsil
“Special programmes about vaccinations must be broadcast on television.” Male focus group, Jahania tehsil “Two days before the immunisation team is expected, announcements must be made through mosques so that mothers may be prepared.” Female focus group, Kabirwala tehsil

CIET/District Government Khanewal: social audit 2005 32
thought it was worthwhile to immunise children, 2% (50/2496) said their neighbours did not think it worthwhile, and 7% (178/2496) said they did not know what their neighbours thought about it. Coming to their own views on the question, 96% (2387/2495) of mothers thought it was worthwhile to immunise children, 2% (67/2495) thought it was not worthwhile, and 2% (41/2495) did not know if it was worthwhile or not. Almost all mothers (98%; 2278/2332) who thought it was worthwhile to immunise children cited protection from illness as their reason. Those few mothers who thought it was not worthwhile to immunise children most often said they thought the vaccine would make the child sick or that they did not feel immunisation was necessary (Table 32). Views about adverse effects of immunisation Parents might avoid immunising their children because of fear of adverse effects, justified or not. In fact, very few mothers could mention any adverse effects of immunisation that they knew of. Only 3% (81/2490) of mothers had heard of any adverse effect of immunisation. Most of the effects they mentioned were recognised adverse effects of immunisation, including fever and swelling or pain at the injection site. A few mentioned things that are not recognised adverse effects of immunisation, such as stomach problems and family planning. This last perception is a belief that vaccinations will make children sterile or cause them to have only female children in the future. Overall, 97% (2409/2490) of mothers mentioned no adverse effects of immunisation, 1% (32/2260) mentioned actual side effects, and 2% (42/2490) mentioned misconceptions about adverse effects. The interviewers asked mothers who mentioned they had heard of adverse effects of immunisation where they heard this. Table 33 shows the main sources of information. In many cases, the mothers could not give a specific source for their information. Over half (43/80) said they had heard of the side effects from their family or neighbours.
Table 32 Why mothers felt immunisation was not worthwhile Reasons % mothers Child gets sick from vaccine 42 Feel it is not necessary 40 Immunisation has no effect 8 Child may die 2 Hospital too far 4 Limbs stop working 3 N 55
Table 33: Where mothers had heard about adverse effects of immunisations Source: % mothers Family, neighbours 55 Don't know/ myself 37 Electronic media (TV, radio) 3 No where 5 N 80

CIET/District Government Khanewal: social audit 2005 33
Information from the lady health worker Among the 60% (1447/2496) of mothers that reported an LHW visited their household, just 25% (326/1403) recalled that the LHW told them anything about immunisations. Those who recalled any information mentioned the LHW told them immunisations were to protect against illness and that it was important to immunise children (Table 34). Among all mothers (including those not visited by an LHW), only 15% had been given any advice about immunisations from an LHW. The recall of mothers contrasts with the information from interviews with LHWs covering some of the sample communities (see below). The LHWs nearly all reported telling the mothers they visited about the benefits and importance of immunising children.
Decisions about immunisation for children Some 84% (2064/2485) of mothers said they had discussed immunisation of children within the family. For each child under 60 months we asked the mother who had been involved in deciding about immunisation for that child. For 44% (1576/3473) of the children mothers alone had made the decision, for 33% (1187/3473) of children the mother and father decided together, and for 23% (710/3473) of children mothers were not involved in deciding about immunisations. Table 35 shows who was involved in decision making in each tehsil.
Table 35 Mother’s involvement in decisions about immunisation for the child (% children) Mother
alone Mother and
father Mother not involved
Jahania 44 48 9 Kabirwala 40 37 23 Khanewal 36 33 30 Mian Channu 57 22 21 Khanewal District 44 33 23
Table 34 Mother’s recall about advice on immunisations given by LHWs Advice given % mothers Nothing 78 Protects against illness 12 Important to immunise 10 Always complete the vaccination course <1 Government order <1 N 1403

CIET/District Government Khanewal: social audit 2005 34
Measles immunisation We collected additional information about measles immunisation specifically and analysed the variables related to the chances of children being immunised against measles. This supplements the analysis of the variables related to the risk of contracting measles (see Childhood Measles above), which showed the beneficial effects of measles immunisation on the risk of suffering measles.
Frequency of immunisation As reported above, 65% (413/635) of children aged 12-23 months had received the measles vaccine, usually given at around nine months old. Figure 25 shows the variation in measles immunisation between the four tehsils. Among children 10-59 months 70% (1920/2761) had received the measles vaccine.
Analysis of receiving measles vaccine We collected information about a number of variables that might be associated (positively or negatively) with the chances of a child being immunised against measles. These are listed in Table 36. A number of these variables, examined separately, were associated with the chances of a child being immunised against measles. These are marked (*) in Table 36. We then undertook a multivariate analysis to examine the effects of each of these variables, taking into account the effects of the others. The model from the multivariate analysis is shown in Table 37. Urban or rural location Children in urban communities were more likely to have been immunised against measles than children in rural communities11. Household vulnerability Children from vulnerable households were less likely to have been immunised than children from less vulnerable households12.
11 Weighted OR 1.63, 95% CI 1.19-2.23, 359/458 urban children had measles vaccine compared with 1561/2303 rural children
65
64
44
74
81
0 10 20 30 40 50 60 70 80 90
Khanewal District
Jahania
Kabirwala
Khanewal
Mian Channu
Figure 25 % children (12-23 months) who have received measles vaccine
Table 36 Variables potentially associated with the risk of measles in children • Urban/rural location* • Tehsil • Education of the household head* • Education of the mother* • Household vulnerability* • Sex of the child* • Age of the child* • Mother has heard about immunisations* • Mother knows a vaccine-preventable illness* • LHW told mother about vaccines* • Mother thinks it worthwhile to immunise* • Family have discussed immunisations* • Government immunisation facility within 5Km* • Vaccination team visits community* * variables related to risk of measles in univariate analysis
Table 37 Model of effects of variables on the chance of having measles vaccine Crude
OR Weighted OR
95% CI of weighted OR
Urban location 1.34 1.63 1.19-2.23 Vulnerable house 0.48 0.62 0.50-0.78 Younger children 0.71 0.61 0.49-0.76 Educated mother 2.74 2.08 1.56-2.78 Mother knows vaccine benefit
2.92 1.92 1.51-2.45
LHW vaccine info 1.47 1.71 1.17-2.50 Discussed imms 4.73 3.33 2.49-4.44 Vaccination team visits community
1.63 3.42 1.93-6.04
OR=Odds Ratio, a measure of relative risk

CIET/District Government Khanewal: social audit 2005 35
Age group Younger children (10-36 months) were less likely to have been immunised than older children (37-59 months)13. Education of the mother Children whose mothers had some education were twice as likely to have been immunised as children whose mothers had no education14. Knowledge about vaccine benefits Children whose mothers could cite correctly at least one disease preventable by immunisation were twice as likely to have been immunised as children whose mothers did not have this knowledge15. Information from LHW Children whose mothers had been visited by an LHW and who recalled being told about immunisations were more likely to have been immunised than children whose mothers had not received such information from an LHW16. Discussion in the family about immunisations Children whose families had discussed about immunisation were three times more likely to have been immunised than children whose families had not discussed immunisation17. Vaccination team visiting community Children from communities where a vaccination team had visited were three times more likely to have been vaccinated than children from communities not visited by a vaccination team18.
12 Weighted OR 0.62, 95% CI 0.50-0.78, 813/1326 children from vulnerable households had measles vaccine compared with 1075/1387 from less vulnerable households 13 Weighted OR 0.61, 95% CI 0.49-0.76, 942/1432 children 10-36 months old had measles vaccine compared with 978/1326 children 37-59 months old 14 Weighted OR 2.08, 95% CI 1.56-2.78, 651/764 children whose mother had some education had measles vaccine compared with 1268/1995 whose mother had no education 15 Weighted OR 1.92, 95% CI 1.51-2.45, 1571/2059 children whose mothers could identify an illness prevented by immunisation had measles vaccine compared with 326/653 whose mothers did not have this knowledge 16 Weighted OR 1.71, 95% CI 1.17-2.50, 301/360 children whose mothers recalled an LHW telling them about immunisations had measles vaccine compared with 1583/2349 whose mothers did not get such information from an LHW 17 Weighted OR 3.33, 95% CI 2.49-4.44, 1753/2314 children whose family discussed immunisation had measles vaccine compared with 157/432 whose family did not discuss immunisation 18 Weighted OR 3.42, 95% CI 1.93-6.04, 1836/2570 children from communities visited by a vaccination team had measles vaccine compared with 68/132 from communities not visited by a vaccination team

CIET/District Government Khanewal: social audit 2005 36
Potential population gains in measles immunisation We can estimate the number of additional children who could be vaccinated as a result of different interventions, based on the model in Table 37 showing the increased chances of individual children being immunised if different variables could be changed. The model of the potential population gains in measles immunisation is shown in Table 38. From this table, we can see that ensuring LHWs reach all mothers and tell them about immunisation, in a way that the mothers can understand and recall, could have the biggest impact and could increase the number of children who receive measles vaccine by 73 per thousand. Useful gains could also be made by educating mothers about the benefits of immunisation (51 per thousand additional children immunised) and encouraging household discussion about immunisation (50 per thousand additional children immunised). Both of these interventions could perhaps be achieved by a visiting LHW, as well as by using other people and modalities to reach the mothers with information. Having vaccination teams visiting every community could achieve an additional 60 children per thousand immunised but it could be an expensive option.
Table 38 Potential gains in increasing measles immunisation Intervention Proportion requiring
intervention (%) Weighted risk difference
95% CI weighted risk difference
Weighted gain per 1000 children
Focus on rural communities 82.3 0.037 0.016-0.058 31 Focus on vulnerable households 48.3 0.030 0.019-0.040 14 Educate mothers about immunisation benefit 24.5 0.207 0.153-0.261 51 Ensure LHWs tell mothers about immunisation 83.6 0.088 0.043-0.133 73 Encourage discussion about immunisation 16.1 0.313 0.243-0.384 50 Have visiting teams for all communities 19.9 0.301 0.169-0.434 60 Proportion requiring intervention means those who do not currently have the favourable condition, eg % children whose mothers do not know about immunisation preventable diseases

CIET/District Government Khanewal: social audit 2005 37
Lady health workers The data collection teams interviewed 29 LHWs identified as visiting the sample communities, to collect information about their work, knowledge and views about childhood diarrhoea, ARI, measles, and immunisation. Training All of the LHWs interviewed had received some initial training to work as an LHW and over half (17/29) had received additional training after this. For 13/17 LHWs this additional training had been within the last year. Work load Most of the LHWs (20/28) covered more than 150 households in their catchment area. All (25/25) said they visited each household at least once a month. Only 3/28 of the LHWs reported having difficulty visiting the households in their catchment area and their suggestions for helping them to get to the households included to increase community support (2/29), to have more medicines and equipment available (1/29), and to provide transport (1/29). Supervision Most of the LHWs reported they were visited by a supervisor once a month or less frequently (22/29), 4/29 reported they were visited more than once a month, and 3/29 reported they were never visited by a supervisor. Knowledge and attitudes about immunisation Virtually all the LHWs (28/29) could correctly identify at least one illness prevented by immunisation. About a third of them (11/29) had heard something about adverse effects of immunisation. Of those who had heard about adverse effects 8/11 mentioned actual side effects, 2/11 mentioned misconceptions about side effects, and 1/11 believed immunisation had no effect. The LHWs’ sources of information about adverse effects of immunisation are shown in Table 39.
Table 39 Where LHWs heard about adverse effects of immunisation
No of LHWs
Family, neighbours, friends 3/11 Doctor/health worker 3/11 During training 3/11 During visits (from parents) 2/11
CIET/District Government Khanewal: social audit 2005 38
Most LHWs said they provided their clients (mothers) with information about the importance and benefits of immunisation (24/29), 4/29 said they told mothers about the scheduling of immunisations, and only one LHW said she did not give mothers any information about immunisations. This reported passing on of information to mothers was not reflected in interviews with mothers visited by LHWs, few of whom could recall the LHW telling them anything about immunisations. LHWs most commonly (12/29) gave “carelessness” as the reason for children in their communities not being immunised. They also mentioned family problems or migration (5/29). Other reasons they cited are shown in Table 40. The most common suggestion from the LHWs to ensure that all children got immunised was to provide information and raise awareness about the issue (10/24). Other suggestions are shown in Table 41. Knowledge and attitudes about diarrhoea Virtually all the LHWs could correctly state at least one cause of childhood diarrhoea. All of them said a child should be given more fluids during an episode of diarrhoea and 26/29 said a child should be given the same or more food. Just 3/29 LHWs said a child should be given less or no food during diarrhoea. All the LHWs reported they gave advice to mothers and families about preventing and treating childhood diarrhoea (Tables 42 and 43). Most (26/29) reported they gave advice about good hygiene practices and cleanliness to prevent diarrhoea and (28/29) about giving more fluids and ORS to treat diarrhoea. This is in contrast to the reports from mothers visited by LHWs (see Childhood Diarrhoea above), few of whom could recall the LHW telling them anything about diarrhoea prevention or management. However, when directly asked, most of the LHWs (22/29) said children with diarrhoea should be given anti-diarrhoeal drugs, although these can in fact be dangerous in young children. They presumably pass on this misconception to the mothers they visit.
Table 40 Why children are not always immunised: LHW views Reason No. responses Carelessness 12 Family problem/migration 5 No reason 4 Team does not come 3 Lack of awareness 3 Not allowed 2 Don't believe in it 2 Fear of side effects 1 No time / no one to take child 1
Table 41 Suggestions of LHWs to ensure all children are immunised Suggestion No. responses Give information/ increase awareness 10 Mobile teams 6 Facility nearby/transport 4 More staff/vaccinators/train LHWs 2 Ensure vaccine availability 2 No suggestion 2
Table 42 Advice reportedly given by LHWs about diarrhoea prevention Advice No of responses Good hygiene and cleanliness 26 Good nutrition 9 Give more fluids/ ORS 5
Table 43 Advice reportedly given by LHWs about diarrhoea treatment Reason No of responses Give more fluids/ ORS 28 Good nutrition/food 8 Contact doctor 8 Hygiene/cleanliness 2

CIET/District Government Khanewal: social audit 2005 39
Knowledge and attitudes of LHWs about ARI Nearly all the LHWs (28/29) could mention some correct advice about recognising ARI in children. Most of the LHWs reported that they advised mothers to treat a child with ARI by giving medicines (22/28) or taking the child to a doctor, or consulting a doctor (16/28) (Table 44) Again, the report from the LHWs is in contrast to the information from mothers visited by LHWs, few of whom could recall the LHW telling them anything about recognition or treatment of ARI.
Table 44 Advice reportedly given by LHWs about ARI treatment Advice No of responses Give medicines 22 Take to doctor or contact doctor 16 Protect from cold 3 Breast feed 1 Feed eggs and honey/hot foods 1

CIET/District Government Khanewal: social audit 2005 40
Public satisfaction with basic services In a general section of the household interview we asked households about their satisfaction with a range of basic public services provided by the government. In some cases, household respondents said that they had no such service available to them. This same information was also collected as part of the 2004/05 national social audit, so comparison with national and provincial figures is possible. As mentioned in the report of the national social audit, isolated satisfaction ratings of public services must be interpreted with caution, as they may be influenced by many factors other than the quality of a service. However, they do provide some guide to how citizens view the public services supposed to be available to them. It can be useful to track satisfaction ratings over time, but again care must be taken not to over-interpret changes, especially small changes, which may even be due to chance. In the focus districts, we have the opportunity to compare satisfaction with a range of public services in different parts of the district. Roads Across the district, 56% (1334/2383) were satisfied with the roads in their area. Figure 26 includes a comparison with the findings about satisfaction with roads at national and provincial levels. The map in Figure 27 shows the variation across the district in household satisfaction with roads. Most (90%; 2212/2383) households across the district considered they had access to roads in their area. This is shown by tehsil and in comparison with national and provincial figures in Table 45.
38
42
56
47
66
47
57
0 10 20 30 40 50 60 70
Pakistan
Punjab
Khanewal District
Jahania
Kabirwala
Khanewal
Mian Channu
Figure 26 % households satisfied with roads
Table 45. % households reporting access to roads and public transport Roads Public transport Jahania 98 100 Kabirwala 93 100 Khanewal 74 95 Mian Channu 99 100 District Khanewal 90 99
Punjab 85 95 Pakistan 92 93
% satisfied with the roads
0 – 2021 – 3536 – 5051 – 6566 – 85
Figure 27 % households satisfied with roads (map)

CIET/District Government Khanewal: social audit 2005 41
Public transport Across the district, 77% (1852/2385) were satisfied with the public transport in their area. Figure 28 includes a comparison with the findings about satisfaction with public transport at national and provincial levels. The map in Figure 29 shows the variation across the district in the proportion of households satisfied with public transport. Almost all (99%; 2361/2385) of households across the district considered they had access to public transport in their area. This is shown by tehsil and in comparison with national and provincial figures in Table 45. Government garbage disposal Across the district, only 4% (99/2389) of households were satisfied with the government garbage disposal in their community. Figure 30 includes a comparison with the findings about satisfaction with garbage disposal at national and provincial levels. Satisfaction with garbage disposal services in Khanewal, except in Mian Channu tehsil, is rather low in comparison with Punjab as a province and with Pakistan overall. The map in Figure 31 shows the variation across the district in household satisfaction with government garbage disposal services. Satisfaction is confined to the urban area in Mian Channu. Some 10% (273/2389) of households across the district considered they had access to garbage disposal in their community. This is shown by tehsil and in comparison with national and provincial figures in Table 46.
59
61
77
71
78
67
88
0 10 20 30 40 50 60 70 80 90
Pakistan
Punjab
Khanewal District
Jahania
Kabirwala
Khanewal
Mian Channu
Figure 28 % households satisfied with public transport
8
8
4
1
1
1
11
0 2 4 6 8 10 12
Pakistan
Punjab
Khanewal District
Jahania
Kabirwala
Khanewal
Mian Channu
Figure 30 % households satisfied with garbage disposal
% satisfied with public transport
40 – 5556 – 6566 – 7576 – 8586 – 100
Figure 29 % households satisfied with public transport (map)
% satisfied with garbage disposal
0 – 1516 – 3536 – 5556 – 70
Figure 31 % households satisfied with garbage disposal (map)

CIET/District Government Khanewal: social audit 2005 42
Government sewerage services Across the district, 31% (715/2384) of households were satisfied with the government sewerage services in their community. Figure 32 includes a comparison with the findings about satisfaction with sewerage services at national and provincial levels. The overall satisfaction with government sewerage services is higher in Khanewal than across Punjab or nationally, but there is considerable variation between tehsils. The map in Figure 33 shows the variation across the district in household satisfaction with government sewerage services. Some 63% (1476/2384) of households across the district considered they had access to sewerage services in their community. This is shown by tehsil and in comparison with national and provincial figures in Table 46. Government water supply Across the district, only 6% (133/2398) were satisfied with the government water supply in their area. Figure 34 includes a comparison with the findings about satisfaction with government water supply at national and provincial levels. Household satisfaction with government water supply in Khanewal was apparently lower than for Punjab province and for Pakistan as a whole. But this is largely because few households actually had access to a government water supply (see below).
Table 46. % households reporting access to garbage, sewerage, and water services Garbage Sewerage Water Jahania 17 38 0 Kabirwala 5 71 15 Khanewal 2 51 0 Mian Channu 19 77 13 Khanewal District 10 63 9
Punjab 72 70 34 Pakistan 64 53 44
20
22
31
13
38
22
37
0 10 20 30 40
Pakistan
Punjab
Khanewal District
Jahania
Kabirwala
Khanewal
Mian Channu
Figure 32 % households satisfied with sewerage services
19
14
6
0
14
0
4
0 5 10 15 20
Pakistan
Punjab
Khanewal District
Jahania
Kabirwala
Khanewal
Mian Channu
Figure 34 % households satisfied with government water supply
% satisfied with sewerage service
0 – 1516 – 3031 – 5051 – 6566 – 80
Figure 33 % households satisfied with sewerage services (map)

CIET/District Government Khanewal: social audit 2005 43
The map in Figure 35 shows the variation across the district in the proportion of households satisfied with the government water supply. Satisfaction with the government water supply is confined to one area in Kabirwala tehsil. Only 9% (205/2398) of households across the district considered they had access to a government water supply in their area. This is shown by tehsil and in comparison with national and provincial figures in Table 46. Most households make use of a private source of underground water, for example through a household pump. Agriculture services Across the district, 51% (1041/1910) of households were satisfied with the agriculture services in their area. Figure 36 includes a comparison with the findings about satisfaction with agriculture services at national and provincial levels. The satisfaction with agriculture services in Khanewal is considerably higher than in Punjab province or in Pakistan as a whole. This is partly because of the higher access to agriculture services in this agricultural district (see below). The map in Figure 37 shows the variation across the district in the proportion of households satisfied with government agriculture services. Some 73% (1493/1910) of households across the district considered they had access to agriculture services in their area. This is shown by tehsil and in comparison with national and provincial figures in Table 47.
15
18
51
70
67
24
48
0 20 40 60 80
Pakistan
Punjab
Khanew al District
Jahania
Kabirw ala
Khanew al
Mian Channu
Figure 36 % households satisfied with agriculture services
% satisfied with the government water supply
0 – 2021 – 4041 – 6061 – 8081 – 100
Figure 35 % households satisfied with government water supply (map)
% satisfied with agriculture services
4 – 2021 – 3536 – 5051 – 6566 – 80
Figure 37 % households satisfied with agriculture services (map)
Table 47. % households reporting access to agricultural, education and health services Agriculture Education Health Jahania 91 100 87 Kabirwala 83 99 96 Khanewal 41 94 84 Mian Channu 89 100 98 Khanewal District 73 98 92
Punjab 56 96 81 Pakistan 49 96 78

CIET/District Government Khanewal: social audit 2005 44
Education Across the district, 74% (1781/2375) of households were satisfied with the government education service in their area. Figure 38 includes a comparison with the findings about satisfaction with the government education service at national and provincial levels. The satisfaction with government education services in Khanewal compares quite favourably with the figures for Punjab province and for Pakistan as a whole. The map in Figure 39 shows the variation across the district in proportion of households satisfied with the government education services in their area. Virtually all (98%; 2342/2375) households across the district considered they had access to a government education service in their area. This is shown by tehsil and in comparison with national and provincial figures in Table 47. Health Across the district, 42% (981/2347) of households were satisfied with the government health services in their area. Figure 40 includes a comparison with the findings about satisfaction with the government health services at national and provincial levels. Again, satisfaction with government health services in Khanewal compares favourably with the satisfaction across Punjab province and in Pakistan as a whole. The map in Figure 41 shows the variation across the district in the proportion of households satisfied with the government health services in their area Most (92%; 2173/2347) households across the district considered they had access to government health services in their area. This is shown by tehsil and in comparison with national and provincial figures in Table 47.
53
52
74
67
81
58
84
0 10 20 30 40 50 60 70 80 90
Pakistan
Punjab
Khanewal District
Jahania
Kabirwala
Khanewal
Mian Channu
Figure 38 % households satisfied with government education services
27
28
42
37
50
38
39
0 10 20 30 40 50
Pakistan
Punjab
Khanew al District
Jahania
Kabirw ala
Khanew al
Mian Channu
Figure 40 % households satisfied with govt health services
% satisfied with government education services
39 – 5051 – 6061 – 7576 – 8586 – 95
Figure 39 % households satisfied with government education services (map)
% satisfied with government health services
20 – 3031 – 4041 – 5556 – 6566 – 76
Figure 41 % households satisfied with govt health services (map)

CIET/District Government Khanewal: social audit 2005 45
Gas supply Across the district, 10% (282/2397) of households were satisfied with the gas supply in their area. Figure 42 includes a comparison with the findings about satisfaction with gas supply at national and provincial levels. The satisfaction with gas supply in Khanewal was lower than for Punjab or for Pakistan as a whole. This is partly because two of the tehsils have no access to a gas supply. The map in Figure 43 shows the variation across the district in the proportion of households satisfied with the gas supply. Satisfaction is confined to urban areas in Mian Channu and Jahania tehsils. Only 11% (322/2397) of households across the district reported they had a gas supply. This is shown by tehsil and in comparison with national and provincial figures in Table 48. Of the four tehsils only Jahania and Mian Channu had access to a gas supply.
26
21
10
19
0
0
25
0 10 20 30
Pakistan
Punjab
Khanewal District
Jahania
Kabirwala
Khanewal
Mian Channu
Figure 42 % households satisfied with gas supply
% satisfied with the government gas supply
0 – 2021 – 4041 – 6061 – 8081 – 100
Figure 43 % households satisfied with gas supply (map)
Table 48. % households reporting access to gas and electricity services Gas Electricity Jahania 20 100 Kabirwala 0 87 Khanewal 0 93 Mian Channu 29 99 Khanewal District 11 94
Punjab 25 95 Pakistan 30 93

CIET/District Government Khanewal: social audit 2005 46
Electricity supply Across the district, 77% (1873/2394) of households were satisfied with the electricity supply in their area. Figure 44 includes a comparison with the findings about satisfaction with electricity supply at national and provincial levels. The satisfaction with electricity in Khanewal is similar to that for Punjab as a province. The map in Figure 45 shows the variation across the district in the proportion of households satisfied with the government electricity supply. Most (94%; 2270/2394) households across the district reported they had an electricity supply. This is shown by tehsil and in comparison with national and provincial figures in Table 48.
62
70
77
79
78
71
76
0 20 40 60 80
Pakistan
Punjab
Khanewal District
Jahania
Kabirwala
Khanewal
Mian Channu
Figure 44 % households satisfied with electricity supply
% satisfied with the government electricity supply
34 – 4546 – 6061 – 7071 – 8586 – 95
Figure 45 % households satisfied with electricity supply (map)

CIET/District Government Khanewal: social audit 2005 47
Commentary This report presents the main findings of the social audit in Khanewal. It is by no means the end of the process. It will hopefully be a useful reference. But the main work of disseminating the findings and making use of them to support evidence-based planning is only just beginning. Over the coming months the social audit findings will be presented and discussed in many settings within the district, both within and outside government. During this process many people will no doubt examine the findings closely and look beyond what is included in this report, relating the findings to what they know about the district and tehsil settings and looking for feasible ways to improve outcomes. Some findings bear highlighting even at this stage. Childhood diarrhoea The rate of diarrhoea – 29% of children under five years old with diarrhoea in the last two weeks – is quite high by international standards. In many studies the quality of drinking water is found to be a factor, with children whose households do not have a protected water source having a higher rate of diarrhoea. In Khanewal, almost all households have a water source that is classified as ‘protected’ as it is underground water. So it was not possible to examine the effect of water source protection on the risk of diarrhoea. Perhaps not surprisingly, children from households with a latrine had a lower risk of diarrhoea but, importantly, this effect was only seen among those children whose mothers had some education. Simply getting a latrine into households is not all that is required; they have to be kept clean and children have to be taught how to use them properly. Coming to treatment of diarrhoea, it is encouraging that most mothers know (and believe) children with diarrhoea should be given extra fluids. There is still work to be done to convince them all and to help them do it in practice. Of concern is the high rate of use of anti-diarrhoea medicines. It is not good practice to use these for young children and it can be dangerous. But many LHWs believed in the use of anti-diarrhoea medicines for children and other health practitioners may also be prescribing them.

CIET/District Government Khanewal: social audit 2005 48
By far the most popular source of treatment for children with diarrhoea is unqualified practitioners (51%), while only 4% of children with diarrhoea were taken to a government facility. There is evidence to suggest that the treatment at government facilities might be more appropriate: they gave more ORS than either private or unqualified practitioners. Yet in most cases children are being treated by unregulated unqualified practitioners. Childhood acute respiratory infections (ARI) Evidence from the literature suggests that smoke in the household increases the risk of ARI in children but we were unable to demonstrate this in Khanewal. We found a beneficial effect of household heating, even though most of this was by wood burning heaters. Children with ARI do need medical attention so it was encouraging to see that only 15% were not taken anywhere for treatment. Once again, the usual choice of parents was unqualified practitioners, and only 4% of children with ARI were taken to a government facility for treatment. The easy access to unqualified practitioners and the concerns about lack of medicines in government facilities seem to be factors in the decision of where to take children for treatment. Childhood measles Measles is quite common in Khanewal: 19% of children aged 10-59 months old have had measles, even excluding those cases under 10 months old (which may not be measles). Taking other factors into account, we were able to show that children who were not immunised had nearly twice the risk of measles compared with immunised children. This recent information specifically from Khanewal district is useful to give to parents deciding whether to immunise their children. We were also able to show that 24 per thousand children in Khanewal could be protected from measles if all children were immunised. Actually, this could be an underestimate because once nearly all children are immunised there is a “herd immunity” effect further reducing the risk of measles, even in non-immunised children. Childhood immunisations Khanewal is some way from universal immunisation. Most (81%) children receive BCG at birth, but the rates
CIET/District Government Khanewal: social audit 2005 49
of immunisation fall off afterwards, so that only two thirds (67%) of children receive the full course of DPT injections, and only two thirds (65%) receive measles vaccine. Some of the discussions held with parents in focus groups help to explain reasons why children are not immunised and could be useful inputs into an advocacy campaign, together with the evidence about the beneficial effects of measles immunisation. The analysis of variables related to the chances of a child being immunised against measles offers a number of options for interventions that could help to increase the number of immunised children. Which of these options might be feasible in Khanewal will be a subject for discussion over the coming months. Some interventions would be much cheaper than others. The role of lady health workers (LHWs) The coverage of mothers by LHWs in Khanewal is quite good: 60% of mothers reported they were visited by an LHW. However, it is striking that most mothers visited by an LHW did not recall being told anything about prevention or treatment of diarrhoea in children, recognition and treatment of ARIs in children, or immunisations. On the other hand, nearly all the LHWs we interviewed said they did tell mothers about these things. The reasons for this contrast need to be explored and perhaps LHWs need to be equipped with different methods of getting over information to mothers. Information from LHWs can clearly have an impact; recall of information about immunisations from an LHW was a variable that increased the chances of a child being immunised against measles. Satisfaction with a range of government services We asked households a general question about their satisfaction (and access) to a range of basic services, provided from different levels of government. While we caution against over-interpretation of these isolated satisfaction ratings, they do provide a general guide. Khanewal is doing relatively well for public satisfaction with some services, such as health and education, in comparison with Punjab as a whole, but less well with services such as garbage disposal. These ratings can provide an ongoing feedback from citizens, but bearing in mind their limitations.

CIET/District Government Khanewal: social audit 2005 50
Annexes
1. Members of Khanewal district social audit steering group 2. Members of Khanewal district social audit sub-technical group 3. Terms of reference of social audit national core group 4. CIET methods 5. Main indicators from household interviews, by tehsil 6. Main indicators from community profiles and LHW interviews 7. Main themes from focus group discussions

CIET/District Government Khanewal: social audit 2005 51
Annex 1 Members of Khanewal social audit district steering group 1. Mr Ahmed Yar Hiraj, Zila Nazim, Khanewal 2. Mr Pir Ahmed Nadeem Bodla, District Nayeb Nazim, Khanewal 3. Mr Muhammad Khan Khicchi, DCO, Khanewal 4. Mr Mirza Muhammad Akram, EDO Community Development, Khanewal 5. Mr M Ammer Saleemi, EDO Finance & Planning, Khanewal 6. Mr Dr Farkhnad Shakeel Mehmood, EDO Education, Khanewal 7. Mr Dr Muhammad Tariq Gelani, EDO Health, Khanewal 8. Mr Muhammad Saleem Nihang, EDO Agriculture, Khanewal 9. Mr Khalid Hasan Durrani, Tehsil Municipal Officer, Khanewal 10. Mr Mehr Manzoor Hussain, Tehsil Municipal Officer, Kabirwala 11. Mr Muhammad Anwar Gill, Tehsil Municipal Officer, Jehania 12. Mr Muhammad Naseem Akhtar Khan, Tehsil Municipal Officer, Mianchannu 13. Mr Haji Ataurrehman, Member District Assembly, Khanewal 14. Mr Javed Rehmat, Member District Assembly, Khanewal 15. Mr Rao Muhammad Arif, Member District Assembly, Khanewal 16. Mr Qari Muhammad Yousaf, Member District Assembly, Khanewal 17. Mr Dr Qaiser Javed, PLYC, Khanewal 18. Ms Farhana Firdous, Member District Assembly, Khanewal 19. Ms Bismillah Erum, Member District Assembly, Khanewal 20. Ms Ghazala Jabeen, Kabirwala

CIET/District Government Khanewal: social audit 2005 52
Annex 2 Members of Khanewal social audit sub-technical group 1. Mirza Muhammad Akram, EDO CD Khanewal 2. Mr Dr Muhammad Tariq Gelani, EDO Health, Khanewal 3. Mr M Ammer Saleemi, EDO F&P, Khanewal 4. Mr Masood Kamal Akhtar, DO Planning, Khanewal 5. Mr Khalid Hasan Durrani, TMO, Khanewal 6. Mr Naseem Akhtar Khan, TMO, Mianchannu 7. Mr Shafeequrrehman, TOP, Mianchannu 8. Ms Bismillah Erum, Khanewal 9. Ms Farhana Firdous, Khanewal 10. Ms Kanwal Shamim advocate, Khanewal 11. Mr Naeem Tariq, Jehanian 12. Mr Dr Muhammad Aslam Jehanian 13. Mr Dr Qaiser Javed, Chairman PLYC 14. Mr Rao M Arif, Chairman The National Foundation

CIET/District Government Khanewal: social audit 2005 53
Annex 3: Terms of reference of social audit national core group Membership The membership will include: • From each focus district: the zila nazim or representative and the DCO or district focal
person for the social audit • The social audit focal point from each provincial department of Local Government and
Rural Development • The CIET district coordinator from each focus district, CIET provincial coordinators and
national coordinator, and representation from the CIET liaison office in Islamabad • A representative from NRB • Other members as may be co-opted for specific purposes from time to time The group will be chaired by one of the members from the focus districts, to be elected by the core group members. The group members will elect a chair every six months. CIET will provide the secretariat for the group. Purposes of the group The intention of the national core group is to share experiences of the district social audit scheme between the districts, identifying what has worked especially well, so that a tool-box for district social audit schemes in other districts can be developed. The group will: • develop means of horizontal connectivity: methods of sharing learning between the
participating districts, both in terms of how best to apply the social audit effectively and in terms of findings and action plans developed as a result. These might include email listserves, a newsletter, shared reports, and meetings.
• explore means of increasing vertical connectivity: identifying common issues arising from the social audit to bring to the attention of the NRB; developing the role of the provincial LGRD departments in supporting the district social audit schemes; and findings ways to involve sub-district governments and civil society in social audit.
• provide a forum for discussing and agreeing matters of common interest, such as the focus of each social audit cycle and methods of publicizing the findings
• act as a point of reference for other districts that wish to develop district social audit schemes
Meetings Meetings will be held six monthly. The venue for each meeting will be one of the participating districts, to be agreed in the preceding meeting. The Minutes of the meetings will be circulated to the members and to the Chief Secretary, the head of the Planning and Development, and the head of the Local Government department in each province. In between physical meetings, matters of interest or importance to the Group will be circulated for comment and discussion, mostly electronically.

CIET/District Government Khanewal: social audit 2005 54
Annex 4: CIET methods Rooted in modern epidemiology and participatory research techniques, CIET methods have been applied in health19, education20, water and sanitation21, land mines22, economic sanctions23, prevention of sexual violence24 and the impact of structural adjustment measures on the vulnerable. The method has been used to measure impact, coverage and cost in the fields of environment25, urban transport26, agricultural extension27 and judiciary28. It has proved useful for community-designed strategies to combat corruption in the public services in several countries2930. CIET processes have been established in over 40 countries during the last decade. A representative sample of communities is selected to represent conditions across the entire country. In these sentinel communities, all public services to be included in the audit are reviewed. This allows for conclusions not just on the performance of each department, but on the performance of the services taken together. In each sentinel community, several types of interaction are developed with the community, including a service delivery household survey. The fact that the public services are reviewed in the same sentinel communities as the household survey and focus groups means that these different types of information – community and service, quantitative and qualitative – can be combined economically and rapidly. There are several specific steps in the social audit that examine and strengthen community participation: - the sample is carefully chosen to cover all types of community; information they provide includes their experience with services, their satisfaction and willingness to pay; - community members and service providers participate in the fact finding; - community members and service providers participate in analysis of the evidence, adding their experience and ideas to formulate local solutions; - the workshopping process allows both one-to-one interaction and group discussion of the evidence and the ways forward; and - the reiterative nature of the process helps to build community capacities and confidence.
19Cockcroft A. Performance and Perceptions of Health and Agriculture Services in Uganda. CIETinternational/World Bank/UNICEF/CIDA: Washington, D.C., December 1996. 20 CIETinternational. Gender gap in primary education. Secretary Planning & Development Department, Government of Sindh, Pakistan/UNICEF Karachi 1996. 21 Andersson N, Villegas A, Paredes S. Micro-regional Planning. in Four Essays on Evidence-based Planning . EDI/World Bank, 1995. 22 Andersson N, da Sousa C, Paredes C. Social costs of land mines in four countries: Afghanistan, Bosnia, Cambodia and Mozambique. British Medical Journal. 1995;311:718-721.
23 Andersson N. The social conditions for health in Serbia. CIETinternational: New York. 1994 24 Andersson, N., Mhatre S, Mqotsi N., Penderis, M. Prevention of sexual violence - a social audit of the role of the police in the jurisdiction of Johannesburg’s Southern Metropolitan Local Council. Johannesburg, October 1998. 25 Arostegui J and Andersson N. Nicaragua: Impact of the National Environmental Program. EDI/World Bank, December 1995. 26 Arostegui J and Andersson N. Results-oriented management of Managua urban public transport. EDI/World Bank December 1995. 27Cockcroft A. Performance and Perceptions of Health and Agriculture Services in Uganda. CIETinternational/World Bank/UNICEF/CIDA: Washington, D.C., December 1996. 28 Massoud N. Measuring client satisfaction and expectations: The Case of the Mali Public Service. EDI/World Bank. September 1995. 29 Cockcroft A. Tanzania Service Delivery Survey: Corruption in the Police, Judiciary, Revenue & Lands Service. EDI/World Bank July 1996. 30Cockcroft A, Legorreta J. National Integrity Survey, Uganda. Inspectorate of Government, Uganda & CIETinternational, August 1998.

CIET/District Government Khanewal: social audit 2005 55
Taken together with hard evidence of what needs to change and how it should be changed, this participation can produce a radical change in public services, increasing accountability and providing the public with value for money. In addition to a detailed review of public services, and interviews with service providers, community-based social audits collect information on users and non-users of a service from the standpoint of the community. A community-based audit compares users and non users in the same community, and it can compare entire communities that benefit form a service with entire communities that do not benefit. This is a strong analytical position for understanding programme performance. Since it places community dynamics at the centre of the audit, it is very easy to answer questions about who the programme leaves out and why they are left out, something that service-based approaches cannot do easily. It also allows for evaluation of ‘knock-on’ or secondary effects, for example, when some women in a community are exposed to programme content and they relay the benefits to others in some way or another. Analysis The most basic level of analysis is simply a description of the levels of the different indicators of service performance. However, this does not in itself contribute to changing the situation. Formal epidemiological analysis probes behind the indicators to reach a deeper understanding of what is happening and how it be changed to improve outcomes for the well-being of the population in question. The CIET community-based cross-design methods focus principally on what is working (the proof that something is not working requires considerably bigger sample sizes). Even when a relationship is found between a particular intervention or service and a positive outcome, in order to be sure it is the intervention that produces the positive outcome, it is necessary to exclude other possible factors as explanations of the outcome. This leads to the development of several higher-level indicators, each with a purpose in planning. Modern epidemiological methods, for example the Mantel-Haenszel31 procedure and the Mantel-Extension32 test for trend, widely used for studying causes in the medical sphere, have been adapted to look behind the indicators in management in other sectors, including justice, transport, environment, customs services, water, sanitation, agriculture, food security and education. These techniques allow detailed analysis of factors that contribute to impact at national and sub-national levels. They can be used in analysis of data from social audits. GIS component: maps for planning CIET mapping techniques are an important means of displaying findings for planners and policy makers. The CIETmap geographic information process is designed for communication and modelling of epidemiological data for planning.33 It represents the spatial variations of indicators but it can also model the effects of interventions, programme changes, and time-series data.
31Mantel N, Haenszel W. Statistical aspects of the analysis of data from retrospective studies of disease. J Natl Cancer Inst 1959;22:719_748. 32Mantel N. Chi_square tests with one degree of freedom: extensions of the Mantel Haenszel procedure. J Amer Stat Assoc 1963;58:690_700. 33 Andersson N., Mitchell S. CIETmap: free GIS and epidemiology software from the CIET group, helping to build the community voice into planning. World Congress of Epidemiology, Montreal, Canada, 19 August, 2002.

CIET/District Government Khanewal: social audit 2005 56
Sample data collected in the field are linked to a set of sentinel sites on the map and interpolated to create a raster surface of the study area. An adjustment is made to the interpolation in order to account for the population weighting of the sites. This transforms the map into one which represents proportion of the population rather than simply geographic area. A colour palette is then applied to show the gradient changes between classes of data, with darker colours representing high values and lighter colours representing low values. CIET raster maps are interpreted much like a standard weather map where regional trends are more accurate than the exact location of any contour gradient. However, since they are population weighted, if 30% of the map falls within a certain class range then 30% of the population is in that range. CIETmaps can be used to measure community participation and coverage of services in different sectors including social welfare, health, education, sports, art and culture. Each level of CIET indicators can be displayed on the maps in order to show access to services, the current effect of services on the community, and the possible effects of any programme change or reallocation. For example, a level 0 ‘coverage’ map can show which households have access to, say, government health services and which do not. This can be helpful in determining where the gaps of services occur based upon community reported needs. This map can then be compared with the coverage with roads of different types in different areas. Satisfaction is partly a function of expectations. The level 0 maps can demonstrate regional variations of satisfaction or access to services which may be important to consider for any reallocation or reform of services. CIETmaps can then be used to determine how any projected road construction might change overall satisfaction with this service. These ‘gains’ can be clearly modelled on the maps through a ‘morph’ series. The morph series is so named due to the visible change that occurs in the indicator on the map, much like a series of steps in an animation. For example, the morph series may show a significant increase in user satisfaction if ‘Reform A’ was implemented. The Morph series not only shows how much of an effect there may be, but also where the effect takes place. Morph series maps can also be used to compare interventions, such as the effect of Reform A vs. Reform B, or the effect of A and B together.

CIET/District Government Khanewal: social audit 2005 57
Annex 5: Main indicators from household interviews Table 1. General household indicators by tehsil
Indicator DISTRICT % wt (unwt)
95% CI
Based on JAHANIA % unwt
95% CI
Based on
KABIRWALA % unwt 95% CI
Based on
KHANEWAL % unwt 95% CI
Based on
MIAN CHANNU % unwt 95% CI
Based on
Household demographic and socio-economic characteristics Total households interviewed 72.23(72.09)
70.70 - 73.77 2400 72.27
68.92 - 75.62 516 80.93
78.31 - 83.54 734 70.09
66.29 - 73.88 410 74.97
73.48 - 76.45 740
Total population covered 17316 3760 5060 3031 5465 Mean household size 7.2
7.0-7.4 2400 7.2
7.0-7.5 516 6.8
6.7-7.0 734 7.3
7.1-7.6 410 7.3
7.1-7.6 740
Households where a women responded
87.84(88.37) 86.51 - 89.17
2389 90.12 87.44-92.79
516 85.11 82.46-87.76
732 85.85 82.36-89.35
410 91.76 89.71-93.81
740
Households with a male head 94.39(94.42) 93.45 - 95.33
2400 94.96 92.98 - 96.95
516 95.37 93.78 - 96.96
734 94.15 91.75 - 96.54
410 93.24 91.37 - 95.12
740
Household head with any education
51.19(51.77) 49.17 - 53.21
2397 50.87 46.46-55.29
515 52.60 48.91-56.28
732 44.39 39.46-49.32
410 55.68 52.03-59.32
740
Houses with poor roof construction 45.16(44.7) 43.15 - 47.18
2385 42.55 38.16 - 46.94
510 57.61 53.96 - 61.27
729 41.71 36.81 - 46.60
410 35.05 31.54 - 38.57
736
Houses with >4 people/room 37.41(36.64) 35.46 - 39.37
2396 34.69 30.49 - 38.89
516 37.24 33.68 - 40.81
733 42.79 37.87 - 47.70
409 34.01 30.53 - 37.50
738
Main breadwinner unemployed or unskilled
60.67(60.39) 58.69 - 62.66
2378 60.62 56.30 - 64.95
513 60.39 56.76 - 64.01
727 63.64 58.84 - 68.43
407 58.41 54.77 - 62.05
731
Vulnerable households 47.81(47.12) 45.78 - 49.85
2360 44.77 40.35 - 49.20
507 53.74 50.03 - 57.45
722 49.26 44.27 - 54.25
406 40.97 37.32 - 44.61
725
Very vulnerable households 14.75(14.32) 13.29 - 16.20
2360 12.62 9.63 - 15.61
507 17.59 14.74 - 20.44
722 15.76 12.10 - 19.43
406 11.45 9.06 - 13.83
725
General opinion about services Roads n=2383 n=508 n=730 n=407 n=738
Satisfied 56.39(55.98) 54.37 - 58.40
1334 46.85 42.41 - 51.29
238 66.16 62.66 - 69.67
483 47.42 42.45 - 52.39
193 56.91 53.27 - 60.55
420
Not satisfied 34.38(36.84) 32.45 - 36.31
878 50.98 46.54 - 55.43
259 26.58 23.30 - 29.85
194 28.01 23.52 - 32.50
114 42.14 38.51 - 45.77
311
No service 9.23(7.18) 8.05 - 10.42
171 2.17 0.80 - 3.53
11 7.26 5.31 - 9.21
53 24.57 20.26 - 28.88
100 0.95 0.18 - 1.72
7
Public transport n=2385 n=515 n=729 n=407 n=734 Satisfied 77.18(77.65)
75.47 - 78.88 1852 71.26
67.26 - 75.27 367 77.78
74.69 - 80.86 567 66.83
62.13 - 71.53 272 88.01
85.59 - 90.43 646
Not satisfied 21.35(21.34) 19.68 - 23.01
509 28.74 24.73 - 32.74
148 21.95 18.87 - 25.02
160 27.76 23.29 - 32.24
113 11.99 9.57 - 14.41
88
No service 1.47(1.01) 0.97 - 1.98
24 0 0 0.27 -0.17 - 0.72
2 5.41 3.09 - 7.73
22 0 0

CIET/District Government Khanewal: social audit 2005 58
Indicator DISTRICT % wt (unwt)
95% CI
Based on JAHANIA % unwt
95% CI
Based on
KABIRWALA % unwt 95% CI
Based on
KHANEWAL % unwt 95% CI
Based on
MIAN CHANNU % unwt 95% CI
Based on
Sewerage service n=2384 n=515 n=733 n=405 n=731 Satisfied 31.12(29.99)
29.24 - 33.00 715 12.62
9.66 - 15.59 65 39.29
35.69 - 42.89 288 21.98
17.82 - 26.13 89 37.35
33.77 - 40.92 273
Not satisfied 32.18(31.92) 30.28 - 34.08
761 24.85 21.02 - 28.68
128 31.24 27.82 - 34.66
229 28.64 24.12 - 33.17
116 39.4 35.79 - 43.01
288
No service 36.7(38.09) 34.74 - 38.65
908 62.52 58.25 - 66.80
322 29.47 26.10 - 32.84
216 49.38 44.39 - 54.38
200 23.26 20.12 - 26.39
170
Garbage service n=2389 n=513 n=729 n=409 n=738 Satisfied 3.94(4.14)
3.14 - 4.74 99 1.17
0.14 - 2.20 6 1.1
0.27 - 1.92 8 0.73
-0.22 - 1.68 3 11.11
8.78 - 13.45 82
Not satisfied 5.79(7.28) 4.83 - 6.75
174 15.98 12.72 - 19.25
82 3.98 2.49 - 5.47
29 0.73 -0.22 - 1.68
3 8.13 6.09 - 10.17
60
No service 90.27(88.57) 89.07 - 91.48
2116 82.85 79.49 - 86.21
425 94.92 93.26 - 96.59
692 98.53 97.25 - 99.82
403 80.76 77.85 - 83.67
596
Government water supply n=2398 n=516 n=734 n=410 n=738 Satisfied 5.87(5.55)
4.90 - 6.83 133 0.19
-0.28 - 0.67 1 14.03
11.45 - 16.61 103 0.24
-0.36 - 0.84 1 4.07
2.57 - 5.56 30
Not satisfied 2.87(3) 2.18 - 3.56
72 99.81 99.33 - 100.28
515 0.54 -0.06 - 1.15
4 99.76 99.16 - 100.36
409 8.94 6.82 - 11.07
66
No service 91.26(91.45) 90.11 - 92.42
2193 0 0 85.42 82.80 - 88.04
627 0 0 86.99 84.50 - 89.49
642
Gas supply n=2397 n=516 n=733 n=733 n=738 Satisfied 9.51(11.76)
8.31 - 10.70 282 19.19
15.69 - 22.68 99 0 0 0 0 24.8
21.61 - 27.98 183
Not satisfied 1.54(1.67) 1.03 - 2.06
40 0.78 -0.08 - 1.63
4 0.14 -0.20 - 0.47
1 0.24 -0.36 - 0.84
1 4.61 3.03 - 6.19
34
No service 88.95(86.57) 87.67 - 90.23
2075 80.04 76.49 - 83.58
413 99.86 99.53 - 100.20
732 99.76 99.16 - 100.36
409 70.6 67.24 - 73.95
521
Electricity supply n=2394 n=515 n=732 n=410 n=737 Satisfied 76.74(78.24)
75.02 - 78.45 1873 87.57
84.63 - 90.52 451 77.6
74.51 - 80.68 568 70.98
66.46 - 75.49 291 76.39
73.26 - 79.52 563
Not satisfied 17.19(16.58) 15.65 - 18.72
397 12.43 9.48 - 15.37
64 9.84 7.61 - 12.06
72 22.44 18.28 - 26.60
92 22.93 19.83 - 26.03
169
No service 6.08(5.18) 5.10 - 7.05
124 0 0 12.57 10.10 - 15.04
92 6.59 4.06 - 9.11
27 0.68 0.02 - 1.34
5
Government health service n=2347 n=510 n=700 n=403 n=734 Satisfied 42.2(41.8)
40.18 - 44.22 981 36.86
32.58 - 41.15 188 49.71
45.94 - 53.49 348 37.97
33.10 - 42.83 153 39.78
36.17 - 43.39 292
Not satisfied 50.2(50.79) 48.15 - 52.24
1192 49.8 45.37 - 54.24
254 46.43 42.66 - 50.19
325 45.66 40.67 - 50.64
184 58.45 54.81 - 62.08
429
No service 7.61(7.41) 6.51 - 8.70
174 13.33 10.28 - 16.38
68 3.86 2.36 - 5.36
27 16.38 12.64 - 20.11
66 1.77 0.75 - 2.79
13
CIET/District Government Khanewal: social audit 2005 59
Indicator DISTRICT % wt (unwt)
95% CI
Based on JAHANIA % unwt
95% CI
Based on
KABIRWALA % unwt 95% CI
Based on
KHANEWAL % unwt 95% CI
Based on
MIAN CHANNU % unwt 95% CI
Based on
Government education service
n=2375 n=511 n=717 n=409 n=738
Satisfied 74.35(74.99) 72.58 - 76.13
1781 66.93 62.75 - 71.10
342 80.89 77.95 - 83.84
580 58.44 53.54 - 63.33
239 84.01 81.30 - 86.72
620
Not satisfied 23.72(23.62) 21.99 - 25.45
561 33.07 28.90 - 37.25
169 17.85 14.98 - 20.73
128 35.7 30.93 - 40.46
146 15.99 13.28 - 18.70
118
No service 1.93(1.39) 1.35 - 2.50
33 0 0 1.26 0.37 – 2.14
9 5.87 3.47 - 8.27
24 0 0
Government agriculture service
n=1910 n=428 n=640 n=371 n=471
Satisfied 50.51(54.5) 48.24 - 52.77
1041 69.63 65.15 - 74.10
298 66.88 63.15 - 70.60
428 23.45 19.00 - 27.90
87 48.41 43.79 - 53.03
228
Not satisfied 22.92(23.66) 21.01 - 24.84
452 21.03 17.05 - 25.01
90 16.41 13.46 - 19.35
105 17.79 13.76 - 21.82
66 40.55 36.01 - 45.09
191
No service 26.57(21.83) 24.56 - 28.58
417 9.35 6.47 - 12.22
40 16.72 13.75 - 19.69
107 58.76 53.62 - 63.90
218 11.04 8.10 - 13.98
52
Household environment and ventilation Houses with some arrangement for ventilation
82.91(84.33) 81.37 - 84.44
2374 90.04 87.35 - 92.73
512 90.44 88.23 - 92.66
722 71.57 67.07 - 76.07
408 81.42 78.53 - 84.31
732
Kitchen/cooking area separate from main living area
56.95(59.08) 54.94 - 58.95
2400 72.48 68.53 - 76.43
516 71.12 67.77 - 74.46
734 42.68 37.77 - 47.59
410 46.89 43.23 - 50.56
740
Kitchen/cooking area separate from sleeping area
65.76(67.58) 63.85 - 67.68
2400 81.2 77.73 - 84.67
516 75.75 72.58 - 78.92
734 56.59 51.67 - 61.51
410 56.08 52.44 - 59.72
740
Types of cooking stove used by households
n=2397 n=515 n=733 n=409 n=740
Sui gas stove 9.53(11.72) 8.33 - 10.72
281 18.83 15.36 - 22.31
97 0 0 0.24 -0.36 - 0.85
1 24.73 21.55 - 27.91
183
Wood stove 88.42(86.19) 87.12 - 89.72
2066 78.64 75.00 - 82.28
405 97 95.70 - 98.30
711 98.04 96.58 - 99.51
401 74.19 70.97 - 77.41
549
Kerosene stove 0.05(0.04) -0.06 - 0.15
1 0 0 0.14 -0.20 - 0.47
1 0 0 0 0
Electric 0.05(0.04) -0.06 - 0.15
1 0 0 0.14 -0.20 - 0.47
1 0 0 0 0
Cow dung (Ooplay) 1.37(1.46) 0.89 - 1.86
35 1.94 0.65 - 3.23
10 2.46 1.27 - 3.64
18 0.49 -0.31 - 1.29
2 0.68 0.02 - 1.33
5
Gas Cylinder 0.59(0.54) 0.26 - 0.92
13 0.58 -0.17 - 1.34
3 0.27 -0.17 - 0.72
2 1.22 0.04 - 2.41
5 0.41 -0.12 - 0.93
3
Households using cooking stove that doesn’t produce smoke
10.16(12.31) 8.93 - 11.39
2397 19.42 15.90 - 22.93
515 0.41 -0.12 - 0.94
733 1.47 0.18 - 2.75
409 25.14 21.94 - 28.33
740
Households use some heating system
36.09(36.71) 34.15 - 38.03
2400 40.89 36.55 - 45.23
516 36.65 33.09 - 40.20
734 33.9 29.20 - 38.61
410 35.41 31.89 - 38.92
740
Types of heating system used by households
n=2400 n=516 n=734 n=410 n=740
None 63.91(63.29) 61.97 - 65.85
1519 59.11 54.77 - 63.45
305 63.35 59.80 - 66.91
465 66.1 61.39 - 70.80
271 64.59 61.08 - 68.11
478

CIET/District Government Khanewal: social audit 2005 60
Indicator DISTRICT % wt (unwt)
95% CI
Based on JAHANIA % unwt
95% CI
Based on
KABIRWALA % unwt 95% CI
Based on
KHANEWAL % unwt 95% CI
Based on
MIAN CHANNU % unwt 95% CI
Based on
Sui gas stove 3.93(5.04) 3.13 - 4.72
121 10.08 7.38 - 12.77
52 0.14 -0.20 - 0.47
1 0 0 9.19 7.04 - 11.34
68
Wood heater stove 29.44(29.29) 27.60 - 31.29
703 29.65 25.61 - 33.69
153 35.01 31.49 - 38.53
257 28.54 24.04 - 33.03
117 23.78 20.65 - 26.92
176
Coal heater stove 1.43(1.17) 0.94 - 1.93
28 0.39 -0.25 - 1.02
2 0.41 -0.12 - 0.94
3 3.66 1.72 - 5.60
15 1.08 0.27 - 1.89
8
Kerosene heater stove 0.1(0.13) -0.05 - 0.25
3 0.19 -0.28 - 0.67
1 0 0 0 0 0.27 -0.17 - 0.71
2
Electric heater stove 0.56(0.54) 0.24 - 0.87
13 0.58 -0.17 - 1.33
3 0.54 -0.06 - 1.15
4 0.73 -0.22 - 1.68
3 0.41 -0.12 - 0.93
3
Cow dung (Ooplay) 0.47(0.38) 0.18 - 0.77
9 0 0 0.54 -0.06 - 1.15
4 0.98 -0.10 - 2.05
4 0.14 -0.20 - 0.47
1
Gas Cylinder 0.16(0.17) -0.02 - 0.34
4 0 0 0 0 0 0 0.54 -0.06 - 1.14
4
Households using heating system that doesn’t produce smoke
68.55(69.04) 66.67 - 70.43
2400 69.77 65.71 - 73.83
516 64.03 60.49 - 67.57
734 66.83 62.15 - 71.51
410 74.73 71.53 - 77.93
740
Households with someone smoking inside the household
54.44(53.42) 52.43 - 56.46
2396 51.46 47.04 - 55.87
515 52.94 49.25 - 56.63
731 62.68 57.88 - 67.49
410 50.14 46.47 - 53.81
740
Household drinking water supply Type of water supply n=2396 n=515 n=733 n=410 n=738
Piped water 2.71(2.55) 2.04 - 3.38
61 0 0 5.87 4.10 - 7.64
43 0.49 -0.31 - 1.28
2 2.17 1.05 - 3.29
16
Underground water 97.04(97.29) 96.34 - 97.74
2331 100 99.90 - 100.10
515 94.13 92.36 - 95.90
690 98.54 97.25 - 99.82
404 97.83 96.71 - 98.95
722
Surface water 0.25(0.17) 0.03 - 0.47
4 0 0 0 0 0.98 -0.10 - 2.05
4 0 0
Distance of source from the household Household with water supply within the household
97.13(97.62) 96.44 - 97.82
2396 99.22 98.37 - 100.08
515 97.95 96.86 - 99.05
733 93.66 91.18 - 96.14
410 98.37 97.39 - 99.35
738
Water source with in 500m of the households including those within the household
99.51(99.66) 99.21 - 99.81
2378 100 99.90 - 100.10
515 99.86 99.53 - 100.20
730 98.23 96.81 - 99.66
396 100 99.93 - 100.07
737
Protection of water source Households getting their drinking water from a protected source
98.85(98.91) 98.40 - 99.29
2396 99.81 99.33 -100.28
515 99.86 99.53 - 100.20
733 98.54 97.25 - 99.82
410 97.56 96.38 - 98.74
738
Use some method to treat drinking water
1.29(1.15) 0.81 - 1.76
2347 1.03 0.03 - 2.04
484 0.14 -0.20 - 0.48
717 2.94 1.18 - 4.70
408 1.22 0.36 - 2.08
738
Household use of latrine Use household or communal latrine
61.08(62.65) 59.11 - 63.05
2399 66.09 61.90 - 70.27
516 51.77 48.09 - 55.45
734 54.15 49.20 - 59.09
410 75.78 72.62 - 78.93
739
Household with formal type of latrine
58.26(59.87) 56.26 - 60.26
2385 63.5 59.24 - 67.75
515 47.67 43.98 - 51.36
730 51.72 46.74 - 56.69
408 74.04 70.80 - 77.29
732

CIET/District Government Khanewal: social audit 2005 61
Indicator DISTRICT % wt (unwt)
95% CI
Based on JAHANIA % unwt
95% CI
Based on
KABIRWALA % unwt 95% CI
Based on
KHANEWAL % unwt 95% CI
Based on
MIAN CHANNU % unwt 95% CI
Based on
Reasons for not having a latrine n=821 n=150 n=325 n=181 n=165 No Money/Latrine not provided 89.14(89.04)
86.95 - 91.33 731 90.67
85.68 - 95.66 136 84.92
80.88 - 88.97 276 92.82
88.78 - 96.86 168 91.52
86.96 - 96.07 151
No need/no tradition/no awareness 5.79(6.33) 4.13 - 7.45
52 7.33 2.83 - 11.84
11 11.08 7.51 - 14.64
36 0 0 3.03 0.11 - 5.95
5
No space/damaged by rain 2.33(2.19) 1.24 - 3.42
18 2 -0.57 - 4.57
3 0.92 -0.27 - 2.12
3 3.87 0.78 - 6.95
7 3.03 0.11 - 5.95
5
No water/no electricity/no sewerage/bad smell
2.74(2.44) 1.56 - 3.91
20 0 0 3.08 1.05 - 5.11
10 3.31 0.43 - 6.20
6 2.42 -0.23 - 5.07
4
Observations on household hygiene Garbage present in the household around the door step
77.39(77.14) 75.69 - 79.09
2388 83.07 79.73 - 86.41
514 85.05 82.39 - 87.71
729 81.42 77.53 - 85.31
409 62.77 59.21 - 66.33
736
Excreta present in the household around the doorstep
58.49(57.89) 56.49 - 60.49
2389 61.4 57.09 - 65.71
513 70.55 67.17 - 73.92
730 61.43 56.57 - 66.28
407 41 37.39 - 44.62
739
Sewage water present in the household around the doorstep
43.21(42.6) 41.21 - 45.22
2392 44.19 39.80 - 48.57
516 46.85 43.16 - 50.54
730 48.53 43.56 - 53.50
408 34.01 30.53 - 37.50
738
Proportion of households where observation of drinking water container was possible
73.88(73.17) 72.09 - 75.66
2389 70.35 66.31 - 74.39
516 71.39 68.04 - 74.74
727 78.97 74.90 - 83.04
409 73.68 70.43 - 76.92
737
Drinking water container is covered
96.95(97.19) 96.11 - 97.78
1744 98.62 97.28 - 99.96
362 97.09 95.55 - 98.64
516 95.98 93.68 - 98.27
323 97.05 95.54 - 98.57
543
Drinking water container was clean 85.22(84.93) 83.52 - 86.92
1738 85.87 82.14 - 89.60
361 82.1 78.69 - 85.51
514 89.75 86.28 - 93.22
322 84.1 80.93 - 87.28
541
Water container is raised from ground level
58.78(58.97) 56.43 - 61.13
1733 64.25 59.14 - 69.35
358 70.04 65.98 - 74.10
514 56.56 50.98 - 62.15
320 46.4 42.10 - 50.69
541
Households with their water container clean, covered and raised
53.34(53.52) 50.96 - 55.72
1734 59.61 54.39 - 64.83
359 63.23 58.96 - 67.50
514 52.5 46.87 - 58.13
320 40.85 36.62 - 45.08
541
LHW visits to the household Proportion of households ever visited by a LHW
59.94(58.24) 57.95 - 61.92
2390 46.32 41.92 - 50.72
516 49.11 45.41 - 52.81
729 69.85 65.28 - 74.43
408 69.2 65.80 - 72.60
737
Time since last visit by an LHW n=2325 n=481 n=710 n=403 n=731 Never visited by an LHW 40.97(42.92)
38.95 - 43.00 998 57.59
53.07 - 62.11 277 52.25
48.51 - 56.00 371 30.52
25.90 - 35.14 123 31.05
27.63 - 34.48 227
Last visit within a month 54.31(52.82) 52.26 - 56.35
1228 41.37 36.87 - 45.88
199 44.23 40.50 - 47.95
314 62.78 57.94 - 67.62
253 63.2 59.64 - 66.77
462
More than one but within last three months
4.36(3.91) 3.51 - 5.22
91 1.04 0.03 - 2.05
5 3.38 1.98 - 4.78
24 6.45 3.93 - 8.97
26 4.92 3.29 - 6.56
36
More than three but within last six months
0.21(0.22) 0.00 - 0.42
5 0 0 0.14 -0.21 - 0.49
1 0 0 0.55 -0.06 - 1.15
4
More than six months but within the last year
0.15(0.13) 0.03 - 0.32
3 0 0 0 0 0.25 -0.36 - 0.86
1 0.27 -0.17 - 0.72
2
CIET/District Government Khanewal: social audit 2005 62
Table 2. Mother and child indicators by tehsil Indicator District
% wt (unwt) 95% CI
Based on
JAHANIA Unwt
95% CI
Based on
KABIRWALA unwt
95% CI
Based on
KHANEWAL unwt
95% CI
Based on
MIAN CHANNU unwt
95% CI
Based on
INFORMATION BASE
Total mothers/care takers interviewed
2497 551 756 419 771
Respondents in each age group n=2487 n=550 n=752 n=418 n=767 Less then 18 years 0.68(0.68)
0.34 - 1.03 17 0.73
-0.07 - 1.53 4 1.2
0.35 - 2.04 9 0.48
-0.30 - 1.26 2 0.26
-0.17 - 0.69 2
18-30 years 62.98(62.4) 61.06 -64.90
1552 59.45 55.26 - 63.65
327 65.03 61.55 - 68.50
489 64.59 59.89 - 69.30
270 60.76 57.24 - 64.28
466
31-50 years 33.7(34.02) 31.82 -35.58
846 35.27 31.19 - 39.36
194 30.85 27.48 - 34.22
232 33.25 28.62 - 37.89
139 36.64 33.16 - 40.11
281
51 years and above 2.64(2.9) 1.99 - 3.29
72 4.55 2.71 – 6.38
25 2.93 1.65 - 4.20
22 1.67 0.32 - 3.02
7 2.35 1.21 - 3.48
18
Mothers/caretakers with some formal education
27.48(28.5) 25.71 -29.25
709/2488 29.82 25.90 - 33.73
164/550 20.72 17.76 - 23.68
156/753 22.49 18.37 - 26.61
94/418 38.46 34.95 - 41.97
295/767
Total children aged <60 months 3586 803 1078 615 1090 Among children 0-59 months of age
Proportion of boys 51.54(51.48) 49.89 -53.19
1846/ 3586
51.06 47.54 - 54.58
410/803 51.48 48.45 - 54.51
555/1078 51.71 47.68 - 55.74
318/615 51.65 48.64 - 54.66
563/1090
Proportion of girls aged 48.46(48.52) 46.81 -50.11
1740/ 3586
48.94 45.42 - 52.46
393/803 48.52 45.49 - 51.55
523/1078 48.29 44.26 - 52.32
297/615 48.35 45.34 - 51.36
527/1090
Children for whom their mothers provided the information
91.13(90.84) 90.19 -92.08
3253/ 3581
89.66 87.50 -91.83
720/803 90.8 89.03 - 92.57
977/1076 92.85 90.73 - 94.96
571/615 90.62 88.84 - 92.40
985/1087
MOTHERS’/CARETAKERS’ KNOWLEDGE, ATTITUDE AND PRACTICES ABOUT CHILD HEALTH AND CARE Awareness about immunization
Mothers having heard about immunization
93.85(93.29) 92.89 -94.82
2323/ 2490
88.34 85.57 - 91.12
485/549 90.73 88.59 - 92.86
685/755 95.92 93.91 - 97.94
400/417 97.92 96.85 - 98.99
753/769
Sources to hear about immunization from (multiple responses recorded)
2490 549 755 417 769
Nowhere 2.7 68 2.4 13 4.9 37 2.6 11 2.6 7 Electronic media 28.4 707 41.2 226 30.2 228 16.8 70 16.8 183
Written material (newspaper, pamphlet)
.7 17 1.6 9 .7 5 .7 3 .7 0
Family, neighbours, friends 13.9 346 14.6 80 12.1 91 13.2 55 13.2 120 School .2 4 0 0 .1 1 .2 1 .2 2
Doctor, hospital 10.4 260 9.8 54 13.4 101 6.0 25 6 80 LHW, LHV, Dai 4.7 116 1.6 9 2.8 21 9.1 38 9.1 48
Vaccination team 8.4 209 10.6 58 7.4 56 10.6 44 10.6 51

CIET/District Government Khanewal: social audit 2005 63
Indicator District % wt (unwt)
95% CI
Based on
JAHANIA Unwt
95% CI
Based on
KABIRWALA unwt
95% CI
Based on
KHANEWAL unwt
95% CI
Based on
MIAN CHANNU unwt
95% CI
Based on
Announcement 33.8 842 21.1 116 30.7 232 45.6 190 39.5 304 Don’t know (incl. I knew myself) 4.3 108 10.0 55 4.6 32 1.7 7 1.4 11
Mothers mentioning at least one illness prevented by immunization (even if incorrect)
83.71(83.08) 82.23 -85.19
2043/ 2459
79.71 76.25 - 83.17
436/547 75.75 72.59 - 78.91
559/738 90.1 87.10 - 93.09
373/414 88.82 86.51 - 91.12
675/760
Mothers mentioning at least one correct illness that can be prevented by immunization
75.97(75.44) 74.26 -77.68
1855/ 2459
72.21 68.37 - 76.06
395/547 70.05 66.68 - 73.43
517/738 80.68 76.75 - 84.60
334/414 80.13 77.23 - 83.03
609/760
Views about benefits of immunization
Neighbours’ views about immunizing as reported by mothers/caretakers
n=2496 n=551 n=755 n=419 n=771
Thinks it's worthwhile 90.98(90.87) 89.84 -92.13
2268 90.56 88.03 - 3.09
499 91.26 89.18 - 93.3
689 91.65 88.88 - 94.4
384 90.27 88.12 - 92.43
696
Don't think it's worthwhile 2.09(2) 1.51 - 2.67
50 2.18 0.87 - 3.49
12 2.91 1.65 - 4.18
22 2.63 0.98 - 4.28
11 0.65 0.02 - 1.28
5
Don't know 6.93(7.13) 5.92 - 7.95
178 7.26 5.00 - 9.52
40 5.83 4.09 - 7.57
44 5.73 3.38 - 8.07
24 9.08 6.99 - 11.17
70
Mothers’ own perception about immunizing the child
n=2495 n=550 n=755 n=419 n=771
Thinks it's worthwhile 95.91(95.67) 95.12 -96.71
2387 92.91 90.67 - 95.15
511 94.17 92.43 - 95.91
711 96.42 94.52 - 98.32
404 98.7 97.84 - 99.57
761
Don't think it's worthwhile 2.38(2.69) 1.77 - 3.00
67 5.64 3.62 - 7.65
31 2.78 1.54 - 4.02
21 2.15 0.64 - 3.66
9 0.78 0.09 - 1.46
6
Don't know if it's worthwhile or not 1.7(1.64) 1.17 - 2.23
41 1.45 0.36 - 2.55
8 3.05 1.75 - 4.34
23 1.43 0.18 - 2.69
6 0.52 -0.05 - 1.09
4
Reasons for being worthwhile n=2332 n=503 n=682 n=393 n=760 Protection against illness 97.88(97.68)
97.28 -98.49 2278 96.02
94.22-97.83 483 97.36
96.08-98.44 664 98.74
97.13-99.81 387 98.67
97.79-99.56 744
Important to immunize 1.32(1.42) 0.84 - 1.81
33 1.99 0.67-3.31
10 1.76 0.70-2.82
12 0.76 -0.22-1.75
3 1.06 0.26-1.86
8
Create immunities against 0.06(0.04) -0.06 - 0.19
1 0 0 0 0 0.25 -0.37-0.88
1 0 0
Govt order 0.73(0.86) 0.36 - 1.10
20 1.99 0.67-3.31
10 0.88 0.11-1.65
6 0.51 -0.32-1.34
2 0.27 -0.17-0.70
2
Reasons for not being worthwhile n=55 n=23 n=17 n=9 n=6 Felt it is not necessary 40.22(47.27)
26.35 -54.09 26 65.22
43.58-86.86 15 41.8
14.84-67.51 7 11.11
-14.98-37.20 1 50
1.66-98.34 3
Child gets sick from vaccine 42.15(34.55) 28.19 -56.11
19 13.04 -2.89-28.98
3 47.06 20.39-73.73
8 66.67 30.31-103.02
6 33.33 -12.72-79.39
2
Immunization has no effect 8.14(9.09) 0.00 - 16.28
5 13.04 -2.89-28.98
3 0 0 11.11 -14.98-37.20
1 16.67 -21.49-54.82
1
Limbs stop working 2.97(1.82) -2.43 - 8.36
1 0 0 0 0 11.11 -14.98-37.20
1 0 0

CIET/District Government Khanewal: social audit 2005 64
Indicator District % wt (unwt)
95% CI
Based on
JAHANIA Unwt
95% CI
Based on
KABIRWALA unwt
95% CI
Based on
KHANEWAL unwt
95% CI
Based on
MIAN CHANNU unwt
95% CI
Based on
Child may die 2.16(1.82) -2.59 - 6.91
1 0 0 5.88 -8.24-20.01
1 0 0 0 0
Hospital too far 4.36(5.45) -1.95 - 10.67
3 8.70 -4.99-22.39
2 5.88 -8.24-20.01
1 0 0 0 0
Views about adverse effects of immunization Mothers who have heard about any bad effects of immunization
3.34(3.25) 2.61 - 4.06
81/2490 3.45 1.83 - 5.06
19/551 2.26 1.13 - 3.39
17/753 4.82 2.64 - 7.00
20/415 3.24 1.93 - 4.56
25/771
Types of bad effects of immunization that mothers had heard of
n=2490 n=551 n=753 n=415 n=771
Nothing 96.66(96.75) 95.94 -97.39
2409 96.55 94.94 - 98.17
532 97.74 96.61 - 98.87
736 95.18 93.00 - 97.36
395 96.76 95.44 - 98.07
746
Actual side-effects 1.24(1.29) 0.78 - 1.69
32 2.18 0.87 - 3.49
12 0.66 0.02 - 1.31
5 1.93 0.48 - 3.37
8 0.91 0.17 - 1.64
7
Incorrect perceptions 1.78(1.69) 1.24 - 2.32
42 1.09 0.13 - 2.05
6 1.06 0.26 - 1.86
8 2.41 0.81 - 4.01
10 2.33 1.20 - 3.47
18
Not specified 0.32(0.28) 0.08 - 0.56
7 0.18 -0.26 - 0.63
1 0.53 -0.05 - 1.12
4 0.48 -0.30 - 1.27
2 0 0
Heard from somewhere specific 57.84(56.25) 46.39 -69.29
45/80 44.44 18.71 - 70.18
8/18 62.5 35.65 -89.35
10/16 59.09 36.27 - 81.91
13/22 58.33 36.53 - 80.14
14/24
Source of information about bad effects of immunization
n=80 n=18 n=16 n=22 n=24
Nowhere 4.94(5) -0.43 - 10.31
4 11.11 -6.19 - 28.41
2 0 0 9.09 -5.19 - 23.38
2 0 0
Electronic media (incl govt) 2.63(2.5) -1.50 - 6.75
2 0 0 12.5 -6.83 - 31.83
2 0 0 0 0
Family, neighbours, friends 55.21(53.75) 43.69 -66.74
43 44.44 18.71 - 0.18
8 50 22.38 - 77.63
8 59.09 36.27 - 81.91
13 58.33 36.53 - 80.14
14
Don't know/myself 37.22(38.75) 26.00 -48.44
31 44.44 18.71 -70.18
8 37.5 10.65 - 64.35
6 31.82 10.08 - 53.55
7 41.67 19.86 - 63.47
10
Mothers who had discussed immunization in their family
84.15(83.06) 82.70 -85.61
2064/ 2485
75.92 72.23 - 79.60
413/544 74.44 71.26 - 77.61
562/755 92.33 89.65 - 95.00
385/417 91.55 89.52 - 93.58
704/769
Knowledge about diarrhoea and its management Mentioned something as a reason for diarrhoea even if incorrect or non specific
91.54(90.63) 90.42 -92.66
2233/ 2464
81.43 78.07 - 84.79
443/544 89.37 87.08 - 91.65
664/743 92.51 89.86 - 95.17
383/414 97.38 96.18 - 98.58
743/763
Mentioned correct reasons for diarrhoea
67.05(65.99) 65.17 -68.92
1626/ 2464
56.62 52.36 -60.87
308/544 61.91 58.35 - 65.47
460/743 70.53 66.02 - 75.04
292/414 74.18 71.01 - 77.35
566/763
Mother would give more fluid during diarrhoea
74.58(76.82) 72.85 -76.31
1915/ 2493
85.48 82.45 - 88.51
471/551 75.27 72.12 - 78.42
566/752 61.58 56.80 - 66.35
258/419 80.42 77.55 - 83.28
620/771
Mother would give same or more food during diarrhoea
59.84(61.42) 57.90 -61.79
1530/ 2491
64.97 60.90 - 69.05
358/551 50.27 46.63 - 53.91
378/752 53 48.09 - 57.91
221/417 74.32 71.17 - 77.47
573/771
Mothers’ interaction with LHW
Proportion of mothers ever visited by a LHW
59.77(57.97) 57.83 -61.71
1447/ 2496
45.55 41.30 - 49.80
251/551 48.08 44.45 - 51.71
363/755 70.41 65.92 - 74.90
295/419 69.78 66.47 - 73.09
538/771

CIET/District Government Khanewal: social audit 2005 65
Indicator District % wt (unwt)
95% CI
Based on
JAHANIA Unwt
95% CI
Based on
KABIRWALA unwt
95% CI
Based on
KHANEWAL unwt
95% CI
Based on
MIAN CHANNU unwt
95% CI
Based on
Period since last LHW visit n=2433 n=516 n=738 n=414 n=765 Never 41.08(43.12)
39.10 -43.05 1049 58.14
53.79 - 62.49 300 53.12
49.45 - 56.78 392 29.95
25.42 - 34.48 124 30.46
27.13 - 33.78 233
Within the last one month 54.07(52.53) 52.07 -56.07
1278 40.5 36.17 - 44.8
209 43.5 39.85 - 47.1
321 62.56 57.78 - 67.3
259 63.92 60.45 - 67.39
489
More than one but within last 6 months
4.52(4.03) 3.67 - 5.36
98 1.36 0.26 - 2.45
7 3.25 1.90 - 4.60
24 7.25 4.63 - 9.86
30 4.84 3.25 - 6.42
37
More than six month but within 1 year 0.2(0.21) 0.00 - 0.40
5 0 0 0.14 -0.20 - 0.47
1 0 0 0.52 -0.05 - 1.10
4
More than a year ago 0.14(0.12) -0.03 - 0.31
3 0 0 0 0 0.24 -0.35 - 0.84
1 0.26 -0.17 - 0.69
2
Among mothers/caretakers ever visited by LHW LHW did tell something about diarrhoea prevention
6.18(6.17) 4.89 - 7.47
87/1410 4.09 1.25 - 6.94
9/220 9.44 6.28 - 12.60
34/360 4.08 1.65 - 6.51
12/294 5.97 3.87 - 8.07
32/536
LHW did tell something about diarrhoea treatment
12.79(12.84) 11.01 -14.57
181/1410 8.64 4.70 - 12.58
19/220 15 11.17 - 18.83
54/360 9.52 6.00 - 13.05
28/294 14.93 11.82 - 18.04
80/536
LHW did tell something about recognizing ARI
0.86(0.85) 0.34 - 1.37
12/1407 0 0/219 1.11 -0.11 - 2.33
4/360 0.34 -0.50 - 1.18
1/294 1.31 0.25 - 2.37
7/534
LHW did tell something about treatment for ARI
2.32(2.34) 1.49 - 3.14
33/1409 1.37 -0.40 - 3.14
3/219 3.06 1.14 - 4.97
11/360 1.36 -0.13 - 2.85
4/294 2.8 1.31 - 4.29
15/536
LHW did tell something about vaccination
24.77(23.24) 22.48 -27.06
326/1403 9.17 5.11 - 13.24
20/218 29.97 25.08 - 34.86
107/357 27.46 22.20 - 32.72
81/295 22.14 18.52 - 25.76
118/533
CHILD HEALTH AND CARE
Total children aged <60 months 3586 803 1078 615 1090 Proportion of children attending a school (incl. pre-primary schooling)
6.95(7.16) 6.10 - 7.79
255/3561 8.02 6.07 - 9.97
64/798 4.61 3.30 - 5.91
49/1064 6.86 4.78 - 8.95
42/612 9.2 7.44 - 10.96
100/1087
Proportion of children 0-6 months of age being exclusively breastfed
66.28(63.91) 62.06 -70.49
324/507 55.56 47.09 -64.02
80/144 68.15 59.92 - 76.38
92/135 76.74 67.23 - 86.25
66/86 60.56 52.17 - 68.95
86/142
Childhood Diarrhoea
Prevalence of diarrhoea
Children 0-59 months who suffered from diarrhoea during last 15 days
28.84(28.03) 27.32 -30.36
976/3482 26.42 23.29 - 29.56
209/791 24.83 22.16 - 27.51
258/1039 31.75 27.90 - 35.59
187/589 30.29 27.48 - 33.10
322/1063
Children 0-59 months who suffered from diarrhoea during last 12 months
74.81(75.5) 73.35 -76.27
2629/ 3482
74.59 71.49 -77.69
590/791 78.25 75.69 - 80.81
813/1039 71.99 68.27 - 75.70
424/589 75.45 72.81 - 78.08
802/1063
Among those who suffered from diarrhoea during last 12 months
Children whose last episode of diarrhoea lasted for more than 3 days
54.5(54.07) 52.46 -56.54
1077/ 2345
51.98 47.63 - 56.3
275/529 46 42.37 - 49.63
345/750 47.15 41.93 - 52.3
174/369 40.6 36.88 - 44.32
283/697
Children who had blood in stools during last episode of diarrhoea
11.81(12.09) 10.55 -13.06
317/2621 12.8 10.01 - 15.59
75/586 11.48 9.22 - 13.74
93/810 9.91 6.94 - 12.87
42/424 13.36 10.94 - 15.78
107/801

CIET/District Government Khanewal: social audit 2005 66
Indicator District % wt (unwt)
95% CI
Based on
JAHANIA Unwt
95% CI
Based on
KABIRWALA unwt
95% CI
Based on
KHANEWAL unwt
95% CI
Based on
MIAN CHANNU unwt
95% CI
Based on
Treatment of diarrhoea (among those who suffered from diarrhoea during last 12 months) Household management of diarrhoea
Proportion of children who were given more fluid during last episode of diarrhoea
69.2(71.21) 67.41 -70.98
1870/ 2626
76.27 72.75 -79.79
450/590 72.29 69.15 - 75.43
587/812 53.19 48.32 - 58.06
225/423 75.91 72.88 - 78.93
608/801
Proportion of children who were given same or more quantity of food during diarrhoea
62.85(64.44) 60.98 -64.72
1689/ 2621
70 66.22 - 73.78
413/590 52.96 49.46 - 56.45
430/812 57.96 53.12 - 62.79
244/421 75.44 72.39 - 78.49
602/798
Proportion of children who were given anti-diarrhoeal drugs during last episode of diarrhoea
82.4(82.58) 80.92 -83.88
2152/ 2606
83.45 80.35 - 86.54
489/586 85.27 82.75 - 87.79
683/801 80.09 76.17 - 84.02
338/422 80.55 77.74 - 83.36
642/797
Taking children with diarrhoea to a health facility/provider
Type of health facility where the child taken for treatment
n=2619 n=588 n=809 n=424 n=798
Nowhere 23.91(23.75) 22.26 -25.57
622 19.56 16.27 - 22.8
115 19.04 16.27 - 21.8
154 23.82 19.65 - 27.9
101 31.58 28.29 - 34.87
252
Government health facility 3.78(3.89) 3.03 - 4.53
102 5.1 3.24 - 6.97
30 4.94 3.39 - 6.50
40 3.3 1.48 - 5.12
14 2.26 1.16 - 3.35
18
Private qualified facility/practitioner 21.22(21.38) 19.64 -22.81
560 21.09 17.71 - 24.4
124 16.69 14.06 - 19.3
135 21.7 17.66 - 25.74
92 26.19 23.08 - 29.30
209
Private, non medically qualified practitioner
50.66(50.4) 48.73 -52.59
1320 52.38 48.26 - 56.50
308 58.96 55.51 - 62.41
477 50.94 46.07 - 55.8
216 39.97 36.51 - 43.44
319
NGO/services facility 0.42(0.57) 0.15 - 0.68
15 1.87 0.69 - 3.05
11 0.37 -0.11 - 0.85
3 0.24 -0.34 - 0.82
1 0 0
Proportion of children taken somewhere for treatment
76.09(76.25) 74.43 -77.74
1997/ 2619
80.44 77.15 - 83.73
473/588 80.96 78.20 - 83.73
655/809 76.18 72.01 - 80.35
323/424 68.42 65.13 - 71.71
546/798
Experience at the health facility
Doctor or a health worker present at the time of visit Government health facility 97.3(97)
93.63 -100.98 97/100 93.1
82.16 -104.1 27/29 100
98.72 - 101.3 39/39 92.86
75.79-10.9 13/14 100
7.22-10.2 18/18
Private qualified health provider 99.52(99.46) 98.86 - 100.19
550/553 99.19 97.2 - 101.2
122/123 99.25 97.42 - 101.1
133/134 100 99.4 - 100.6
90/90 99.51 98.32 - 100.71
205/206
Private unqualified health provider 99.68(99.62) 99.33 - 100.02
1306/ 1311
99.01 97.74 -100.3
301/304 99.79 99.27 - 100.3
472/473 99.54 98.40 - 100.7
215/216 100 99.84 - 100.16
318/318
Proportion of children who were provided ORS
Government health facility 62.31(65.35) 52.37 - 72.26
66/101 80 64.02 - 95.98
24/30 74.36 59.37 - 89.35
29/39 42.86 13.36 - 72.35
6/14 38.89 13.59 - 64.19
7/18
Private qualified health provider 56.38(56.25) 52.19 - 60.58
315/560 56.45 47.32 - 65.5
70/124 71.11 63.09 - 79.1
96/135 52.17 41.42 - 62.9
48/92 48.33 41.31 - 55.34
101/209
Private unqualified health provider 45.5(46.37) 42.77 - 48.24
606/1307 49.83 44.02 - 55.65
150/301 58.56 54.02 - 63.11
277/473 33.33 26.82 - 39.85
72/216 33.75 28.39 - 39.12
107/317

CIET/District Government Khanewal: social audit 2005 67
Indicator District % wt (unwt)
95% CI
Based on
JAHANIA Unwt
95% CI
Based on
KABIRWALA unwt
95% CI
Based on
KHANEWAL unwt
95% CI
Based on
MIAN CHANNU unwt
95% CI
Based on
Proportion of children who had all prescribed medicines from the health facility
Government health facility 34.29(39.6) 24.54 - 44.04
40/101 58.62 38.97 - 78.27
17/29 40 23.57 - 56.43
16/40 100 96.43 - 103.5
14/14 38.89 13.59 - 64.19
7/18
Private qualified health provider 46.7(48.39) 42.48 - 50.92
271/560 59.68 50.64 - 68.7
74/124 52.59 43.80 - 61.3
71/135 39.13 28.61 - 49.65
36/92 43.06 36.11 - 50.01
90/209
Private unqualified health provider 81.11(82.01) 78.95 - 83.28
1067/ 1301
85.33 81.16 - 89.50
256/300 77.64 73.78 - 81.49
368/474 77.93 72.13 - 83.7
166/213 88.22 84.49 - 91.94
277/314
Proportion of children for whom the health worker gave full explanation about illness
Government health facility 50.39(50) 40.20 - 60.59
51/102 40 20.80 - 59.20
12/30 65 48.97 - 81.03
26/40 28.57 1.34 - 55.81
4/14 50 24.12 - 75.88
9/18
Private qualified health provider 63.28(65.3) 59.20 - 67.37
365/559 78.05 70.33 - 85.7
96/123 74.07 66.31 - 81.8
100/135 52.17 41.42 - 62.9
48/92 57.89 50.96 - 64.83
121/209
Private unqualified health provider 46.24(46.56) 43.48 - 48.99
603/1295 51 45.18 - 56.82
153/300 57.96 53.40 - 62.53
273/471 40.67 33.77 - 47.57
85/209 29.21 24.03 - 34.39
92/315
Satisfaction with the service provider Government health facility
Proportion of children whose parents were satisfied with behaviour of doctor/health worker
92.09(93.14) 86.37 - 97.82
95/102 96.67 88.6 - 104.8
29/30 92.5 83.09 - 101.9
37/40 85.71 63.8 - 107.6
12/14 94.44 81.08 - 107.80
17/18
Proportion of children whose parents were satisfied with the treatment
93.77(94.12) 88.58 - 98.95
96/102 96.67 88.58 - 104.8
29/30 95.0 87.00 - 103.0
38/40 92.86 75.8 - 109.9
13/14 88.89 71.59 - 106.19
16/18
Reason for being satisfied n=96 n=29 n=35 n=13 n=16 Good doctor/staff available 11.69(11.46)
4.74 - 18.64 11 10.34
-2.46 - 23.15 3 7.89
-1.99 -17.78 3 15.38
-8.07 - 38.84 2 18.75
-3.50 - 41.00 3
Good facilities/services 1.79(2.08) -1.38 - 4.96
2 3.45 -4.92 -11.81
1 2.63 -3.77 - 9.04
1 0 0 0 0
Good treatment 78.36(77.08) 69.60 - 87.11
74 72.41 54.42 - 90.41
21 78.95 64.67 -93.23
30 84.62 61.16 -108.1
11 75.00 50.66 - 99.34
12
Low cost/free treatment 6.99(8.33) 1.37 - 12.61
8 13.79 -0.48 -28.07
4 7.89 -1.99 - 17.78
3 0 0 6.25 -8.74 - 21.24
1
Good access/nearby 1.18(1.04) -1.50 - 3.87
1 0 0 2.63 -3.77 - 9.04
1 0 0 0 0
Reason for being dissatisfied n=5 n=1 n=2 n=1 n=1 Poor facilities/services 21.06(20)
-24.68 - 66.80 1 0 0 50.00
-44.3 - 144.3 1 0 0 0 0
Treatment not good 78.94(80) 33.20 - 124.68
4 100.00 50.00-150.00
1 50.00 -44.3 - 144.3
1 100 50.00 - 150.0
1 100 50.00 - 150.00
1
Private qualified health provider
Proportion of children whose parents were satisfied with behaviour of doctor/health worker
96.06(96.61) 94.36 - 97.76
541/560 99.19 97.2 -101.2
123/124 98.52 96.11 - 100.9
133/135 92.39 86.43 - 98.35
85/92 95.69 92.70 - 98.69
200/209

CIET/District Government Khanewal: social audit 2005 68
Indicator District % wt (unwt)
95% CI
Based on
JAHANIA Unwt
95% CI
Based on
KABIRWALA unwt
95% CI
Based on
KHANEWAL unwt
95% CI
Based on
MIAN CHANNU unwt
95% CI
Based on
Proportion of children whose parents were satisfied with the treatment
96.13(96.43) 94.45 - 97.82
534/560 98.39 95.77 - 101.0
122/124 97.78 94.92 - 100.6
132/135 94.57 89.39 - 99.74
87/92 95.22 92.08 - 98.35
199/209
Reason for being satisfied n=540 n=122 n=132 n=87 n=199 Good doctor/staff available 20.25(20.74)
16.77 - 23.73 112 22.95
15.08 - 30.82 28 27.27
19.30 - 35.25 36 14.94
6.88 - 23.01 13 17.59
12.05 - 23.13 35
Good treatment 78.84(78.33) 75.31 - 82.38
423 75.41 67.36 - 83.46
92 71.21 63.11 - 79.32
94 83.91 75.61 - 92.20
73 82.41 76.87 - 87.10
164
Low cost/free treatment 0.62(0.74) -0.13 - 1.38
4 1.64 -1.02 - 4.30
2 1.52 -0.95 - 3.98
2 0 0 0 0
Good access/nearby 0.28(0.19) -0.26 - 0.82
1 0 0 0 0 1.15 -1.67 - 3.96
1 0 0
Reason for being dissatisfied n=20 n=2 n=3 n=5 n=10 Good doctor/staff not available 11.46(10)
-5.00 - 27.92 2 0 0 0 0 20
-25.06 - 65.06 1 10
-13.59 - 33.59 1
Poor facilities/services 4.43(5) -7.09 - 15.96
1 0 0 0 0 0 0 10 -13.59 - 33.59
1
Treatment not good 62.42(65) 38.70 - 86.15
13 100 75.00 - 125.00
2 33.33 -36.68 - 103.3
1 60 7.06 - 112.94
3 70 36.60 - 103.40
7
Too expensive/can't afford 16.57(15) -2.22 - 35.37
3 0 0 33.33 -36.68 - 103.3
1 20 -25.06 - 65.06
1 10 -13.59 - 33.59
1
No other choice 5.11(5) -7.04 - 17.27
1 0 0 33.33 -36.68 - 103.3
1 0 0 0 0
Private unqualified health provider
Proportion of children whose parents were satisfied with behaviour of doctor/health worker
97.3(97.24) 96.38 - 98.22
1270/ 1306
95.68 93.22 - 98.14
288/301 98.94 97.92 - 99.97
468/473 95.35 92.30 - 98.40
205/215 97.48 95.59 - 99.36
309/317
Proportion of children whose parents were satisfied with the treatment
94.39(94.58) 93.10 - 95.67
1238/ 1309
94.68 91.98 -97.38
285/301 97.05 95.43 - 98.68
461/475 91.20 87.19 - 95.21
197/216 93.06 90.1 - 96.02
295/317
Reason for being satisfied n=1232 n=283 n=458 n=196 n=295 Good doctor/staff available 12.77(13.72)
10.86 - 14.67 169 17.31
12.73 - 21.90 49 12.01
8.92 - 15.09 55 7.65
3.68 - 11.63 15 16.95
12.50 - 21.40 50
Good facilities/services 0.52(0.57) 0.08 - 0.96
7 0.35 -0.51 - 1.22
1 0.22 -0.32 - 0.75
1 0 0 1.69 0.05 - 3.34
5
Good treatment 83.06(82.22) 80.92 - 85.19
1013 79.86 75.01 - 84.71
226 83.84 80.36 - 87.32
384 88.27 83.50 - 93.03
173 77.97 73.07 - 82.87
230
Low cost/free treatment 1.79(1.62) 1.01 - 2.58
20 0.71 -0.45 - 1.86
2 1.75 0.44 - 3.06
8 2.55 0.09 - 5.01
5 1.69 0.05 - 3.34
5
Good access/nearby 1.74(1.79) 0.97 - 2.51
22 1.77 0.06 - 3.48
5 2.18 0.74 - 3.63
10 1.02 -0.64 - 2.68
2 1.69 0.05 - 3.34
5
Medicines available 0.12(0.08) -0.11 - 0.36
1 0 0 0 0 0.51 -0.74 - 1.76
1 0 0
Reason for being dissatisfied n=66 n=15 n=14 n=17 n=20 Treatment not good 81.35(80.3)
71.19 - 91.50 53 73.33
47.62 - 99.05 11 85.71
63.81 - 107.6 12 82.35
61.29 - 103.4 14 80.00
59.97 - 100.03 16

CIET/District Government Khanewal: social audit 2005 69
Indicator District % wt (unwt)
95% CI
Based on
JAHANIA Unwt
95% CI
Based on
KABIRWALA unwt
95% CI
Based on
KHANEWAL unwt
95% CI
Based on
MIAN CHANNU unwt
95% CI
Based on
Too expensive/can't afford 6.02(6.06) -0.48 - 12.51
4 6.67 -9.29 - 22.62
1 7.14 -9.92 - 24.21
1 5.88 -8.24 - 20.01
1 5 -7.05 - 17.05
1
No other choice 12.64(13.64) 3.86 - 21.41
9 20 -3.58 - 43.58
3 7.14 -9.92 - 24.21
1 11.76 -6.49 - 30.02
2 15 -3.15 - 33.15
3
Cost of treatment of diarrhoea
Travel cost
Government health facility
Paid some cost 41.58(37.62) 31.47 - 51.68
38/101 16.67 1.66 - 31.67
5/30 25.64 10.65 - 40.63
10/39 64.29 35.61 - 92.96
9/14 77.78 55.79 - 99.76
14/18
Mean amount paid in Pak Rs. 37.96 (38.29) 20.02 - 55.89
38 42 13.2 - 70.7
42 32 14.2 - 49.7
32 38.8 20.5 - 57.2
38.889 41.0 1.6 - 80.4
14
Private qualified health provider Paid some cost 66.71(63.72)
62.70 - 70.73 353/554 38.52
29.48 - 47.57 47/122 58.52
49.84 - 67.20 79/135 74.44
64.88 - 84.01 67/90 77.29
71.35 - 83.24 160/207
Mean amount paid in Pak Rs. 62.95 (65.26) 45.69 - 80.20
353 59.0 35.2 - 82.7
59.021 98.6 45.3 - 151.9
98.671 28.8 23.4 - 34.3
28.896 65.856 46.418 - 85.295
160
Private unqualified health provider Paid some cost 15.28(15.23)
13.30 - 17.27 200/1313 16.17
11.86-20.48 49/303 11.34
8.39-14.30 54/476 18.98
13.52-24.44 41/216 17.61
13.27-21.95 56/318
Mean amount paid in Pak Rs. 45.50 (46.33) 33.82 - 57.18
200 37.04 17.07-57.00
49 43.41 27.43-59.38
54 32.2 24.38-40.01
41 67.61 24.58-110.64
56
Treatment cost at the facility Government health facility
Paid some cost 91.45(92.08) 85.50 - 97.40
93/101 96.67 88.58 - 104.8
29/30 89.74 78.94 - 100.6
35/39 92.86 75.79 - 109.9
13/14 88.89 71.59 - 106.19
16/18
Mean amount paid in Pak Rs. 69.53 (62.022) 14.66 - 124.39
93 3.414 2.574 - 4.254
29 81.171 -31.74 - 194.1
35 48.85 11.8 - 109.5
13 137.1 106.7 - 380.9
16
Private qualified health provider Paid some cost 95.52(95.47)
93.71 - 97.34 527/552 95
90.68 - 99.32 114/120 95.56
91.71 - 99.40 129/135 95.56
90.7 - 100.4 86/90 95.65
92.63 - 98.67 198/207
Mean amount paid in Pak Rs. 251.75 (240.56) 192.70 - 310.79
527 139.25 74.7 -203.8
114 185.4 124.3 - 246.5
129 289.6 200.2 - 379.0
86 313.6 201.7 - 425.5
198
Private unqualified health provider Paid some cost 96.21(96.16)
95.12 - 97.29 1227/ 1276
95.86 93.40 - 98.33
278/290 97.17 95.55 - 98.80
447/460 95.79 92.87 - 98.72
205/214 95.19 92.66 - 97.73
297/312
Mean amount paid in Pak Rs. 105.45 (108.26) 77.27 - 133.62
1227 118.183 4.32 - 232.1
278 70.82 59.31 - 82.32
447 108.7 78.8 - 138.5
205 155.04 44.65 - 265.43
297
Cost of medicines or investigations outside the facility
Government health facility
Paid some cost 64.05(59.6) 54.09 - 74.01
59/99 43.33 23.93 - 62.73
13/30 58.97 42.25 - 75.69
23/39 92.31 73.98 - 110.6
12/13 64.71 39.05 - 90.36
11/17

CIET/District Government Khanewal: social audit 2005 70
Indicator District % wt (unwt)
95% CI
Based on
JAHANIA Unwt
95% CI
Based on
KABIRWALA unwt
95% CI
Based on
KHANEWAL unwt
95% CI
Based on
MIAN CHANNU unwt
95% CI
Based on
Mean amount paid in Pak Rs. 487.41 (503.39) 90.34 - 884.48
59 201.69 29.57 - 373.8
13 319.35 146.9 - 491.8
23 218.2 113.8 - 322.5
12 1555.9 604.1 - 3715.9
11
Private qualified health provider Paid some cost 59.4(57.92)
55.21 - 63.60 318/549 40.98
31.85 - 50.12 50/122 49.24
40.33 - 58.15 65/132 61.11
50.48 - 71.74 55/90 72.2
65.82 - 78.57 148/205
Mean amount paid in Pak Rs. 466.22(458.05) 382.18 - 550.27
318 214.82 146.9 -282.7
50 269.12 194.3 - 344.0
65 446.5 273.3 - 619.7
55 627.5 443.5 - 811.5
148
Private unqualified health provider Paid some cost 17.99(16.76)
15.86 - 20.11 218/1301 12.33
8.45 - 16.22 37/300 21.82
17.99 - 25.6 103/472 23
17.12 - 28.89 49/213 9.18
5.84 - 12.52 29/316
Mean amount paid in Pak Rs. 256.61 (246.56) 98.18 - 415.05
218 145.3 78.9 - 211.8
37 241.21 43.01 - 525.4
103 282.2 139.1 - 425.3
49 334.52 45.13 - 623.90
29
Childhood Acute Respiratory Infections (ARI) Prevalence of ARI
Proportion of 0-59 children who suffered from ARI within last 15 days
28.61(27.45) 27.10 - 30.12
959/3493 17.19 14.51 - 19.87
137/797 22.69 20.10 - 25.2
236/1040 32.24 28.34 - 36.14
186/577 37.07 34.14 - 40.00
400/1079
Proportion of 0-59 children who suffered from ARI in the last 12 months
74.84(74.49) 73.38 - 76.29
2602/ 3493
67.75 64.45 - 71.0
540/797 72.12 69.34 - 74.89
750/1040 72.79 69.07 - 76.5
420/577 82.67 80.36 - 84.97
892/1079
Taking children with ARI for treatment at the health facility (Among children who suffered from ARI during last 12 months) Type of health facility where the child was taken for treatment
n=2594 n=538 n=749 n=418 n=798
Nowhere 15.11(14.3) 13.72 - 16.51
371 7.62 5.29 - 9.96
41 12.42 9.99 - 14.85
93 18.18 14.36 -22.00
76 18.11 15.52 - 20.70
161
Government health facilities 4.02(4.12) 3.24 - 4.79
107 5.76 3.70 - 7.82
31 4.41 2.87 - 5.94
33 4.31 2.24 - 6.37
18 2.81 1.67 - 3.96
25
Private qualified facility/practitioners 23.1(23.59) 21.46 - 24.74
612 24.72 20.98 - 28.46
133 16.42 13.70 -19.14
123 22.49 18.37 - 26.61
94 29.47 26.42 - 32.52
262
Private unqualified practitioners incl. spiritual or religious healer
56.9(56.86) 54.98 - 58.83
1475 58.55 54.29 -62.81
315 65.55 62.08 - 69.02
491 54.78 49.89 -59.68
229 49.49 46.15 - 52.84
440
NGO/services facilities 0.86(1.12) 0.49 - 1.24
29 3.35 1.73 - 4.96
18 1.2 0.35 - 2.05
9 0.24 -0.35 - 0.83
1 0.11 -0.16 - 0.39
1
Proportion children taken somewhere or consulted for treatment of ARI
84.89(85.7) 83.49 - 86.28
2223/ 2594
92.38 90.04 -94.71
497/538 87.58 85.15 - 90.01
656/749 81.82 78.00 - 85.64
342/418 81.89 79.30 - 84.48
728/889
Experience at the health facility
Doctor or a health worker present at the time of visit Government health facility 99.47(99.07)
97.62 - 101.31 106/107 96.77
88.94 104.61 30/31 100
98.48 101.52 33/33 100
97.22 102.78 18/18 100
98.00 - 102.00 25/25
Private qualified health provider 99.55(99.49) 98.93 - 100.17
591/594 99.24 97.36 101.11
130/131 99.19 97.19 101.18
122/123 100 99.46 100.54
92/92 99.6 98.61 - 100.59
247/248
Private unqualified health provider 99.57(99.52) 99.19 - 99.94
1446/ 1453
99.04 97.80 100.28
309/312 99.59 98.93 100.26
488/490 99.56 98.48 100.64
227/228 99.76 99.18 - 100.34
422/423

CIET/District Government Khanewal: social audit 2005 71
Indicator District % wt (unwt)
95% CI
Based on
JAHANIA Unwt
95% CI
Based on
KABIRWALA unwt
95% CI
Based on
KHANEWAL unwt
95% CI
Based on
MIAN CHANNU unwt
95% CI
Based on
Proportion of children who had all prescribed medicines from the health facility
Government health facility 43.61(43.81) 33.65 - 53.57
46/105 36.67 17.76 - 55.58
11/30 43.75 25.00 - 62.50
14/32 33.33 8.78 - 57.89
6/18 60 38.80 - 81.20
15/25
Private qualified health provider 50.89(52.45) 46.79 - 55.00
311/593 59.85 51.11 - 68.59
79/132 56.91 47.75 - 66.07
70/123 40.86 30.33 - 51.39
38/93 50.61 44.15 - 57.08
124/245
Private unqualified health provider 84.75(85.03) 82.86 - 86.64
1227/ 1443
84.19 79.97 - 88.42
261/310 78.94 75.22 - 82.65
386/489 84.44 79.49 - 89.40
190/225 93.08 90.53 - 95.63
390/419
Proportion of children for whom the health worker gave full explanation about illness
Government health facility 44.05(42.06) 34.17 - 53.92
45/107 35.48 17.03 - 53.94
11/31 63.64 45.71 - 81.56
21/33 44.44 18.71 - 70.18
8/18 20 2.32 - 37.68
5/25
Private qualified health provider 60.61(63.07) 56.59 - 64.62
374/593 76.34 68.68 - 84.0
100/131 73.98 65.82 - 82.1
91/123 44.57 33.87 - 55.27
41/92 57.49 51.12 - 63.86
142/247
Private unqualified health provider 48.33(48.92) 45.71 - 50.95
702/1435 53.85 48.15 - 59.54
168/312 60.12 55.66 - 64.59
291/484 40.63 33.97 - 47.28
91/224 36.63 31.87 - 41.38
152/415
Satisfaction with the service provider
Government health facility
Proportion of children whose parents were satisfied with behaviour of doctor/health worker
95.68(96.26) 91.37 - 100.00
103/107 100 98.39 -101.6
31/31 96.97 89.6 - 104.3
32/33 94.44 81.08 - 107.8
17/18 92 79.37 - 104.63
23/25
Proportion of children whose parents were satisfied with the treatment
94.77(95.33) 90.09 - 99.46
102/107 100 98.39 - 101.6
31/31 96.97 89.6 - 104.3
32/33 94.44 81.08 - 107.8
17/18 88 00 73.26 - 102.74
22/25
Reason for being satisfied n=101 n=31 n=31 n=17 n=22 Good doctor/staff available 13.73(11.88)
6.52 - 20.93 12 6.45
-3.81 - 16.71 2 12.9
-0.51 - 26.32 4 23.53
0.42 - 46.63 4 9.09
-5.19 - 23.38 2
Good facilities/services 4.05(3.96) -0.29 - 8.40
4 3.23 -4.61 - 11.06
1 0 0 5.88 -8.24 - 20.01
1 9.09 -5.19 - 23.38
2
Good treatment 75.45(76.24) 66.56 - 84.34
77 77.42 61.09 - 93.75
24 74.19 57.18 - 91.21
23 70.59 45.99 - 95.19
12 81.82 63.43 - 100.21
18
low cost/free treatment 3.4(4.95) -0.63 - 7.43
5 12.9 -0.51 - 26.32
4 3.23 -4.61 - 11.06
1 0 0 0 0
Good access/nearby 3.36(2.97) -0.65 - 7.37
3 0 0 9.68 -2.34 - 21.70
3 0 0 0 0
Reason for being dissatisfied n=3 n=0 n=0 n=1 n=2 Treatment not good 72.09(66.67)
4.67 - 139.52 2 0 0 0 0 100
50.00 - 150.0 1 50
-44.30 - 144.30 1
Too expensive/can’t afford 27.91(33.33) -39.52 - 95.33
1 0 0 0 0 0 0 50 -44.30 - 144.30
1
Private qualified health provider
Proportion of children whose parents were satisfied with behaviour of doctor/health worker
98.01(97.99) 96.80 - 99.21
584/596 97.73 94.8 -100.7
129/132 98.37 95.73 - 101.0
121/123 97.85 94.36 - 101.3
91/93 97.98 96.03 - 99.93
243/248
Proportion of children whose parents were satisfied with the treatment
97(97.32) 95.55 - 98.46
574/595 97.73 94.8 - 100.7
129/132 99.19 97.2 - 101.2
122123 93.55 88.82 - 99.08
87/93 95.78 95.47 - 99.69
242/248
CIET/District Government Khanewal: social audit 2005 72
Indicator District % wt (unwt)
95% CI
Based on
JAHANIA Unwt
95% CI
Based on
KABIRWALA unwt
95% CI
Based on
KHANEWAL unwt
95% CI
Based on
MIAN CHANNU unwt
95% CI
Based on
Reason for being satisfied n=576 n=127 n=121 n=87 n=241 Good doctor/staff available 20.79(22.22)
17.39 - 24.19 128 30.71
22.29 - 39.13 39 17.36
10.19 - 24.52 21 16.09
7.80 - 24.39 14 22.41
16.93 - 27.88 54
Good treatment 78.38(77.08) 74.93 - 81.83
444 68.5 60.03 - 76.98
87 81.82 74.53 – 89.10
99 81.61 72.89 - 90.32
71 77.59 72.12 - 83.07
187
low cost/free treatment 0.53(0.35) -0.15 - 1.22
2 0 0 0 0 2.3 -1.43 - 6.02
2 0 0
Good access/nearby 0.29(0.35) -0.24 - 0.82
2 0.79 -1.14 - 2.72
1 0.83 -1.2 - 2.85
1 0 0 0 0
Reason for being dissatisfied n=16 n=3 n=1 n=6 n=6 Treatment not good 79.71(81.25)
56.88 - 102.54 13 100
83.33 - 116.67 3 0 0 83.33
45.18 - 121.5 5 83.33
45.18 - 121.49 5
Too expensive/can’t afford 6.26(6.25) -8.73 - 21.26
1 0 0 100.0 50.0 - 150.0
1 0 0 0 0
No other choice 14.03(12.5) -6.11 - 34.17
2 0 0 0 0 16.67 -21.49 - 54.8
1 16.67 -21.49 - 54.82
1
Private unqualified health provider
Proportion of children whose parents were satisfied with behaviour of doctor/health worker
97.97(98.06) 97.21 - 98.73
1415/ 1443
97.76 95.95 - 9.56
305/312 99.38 98.6 - 100.2
484/487 95.98 93.19 - 98.78
215/224 97.86 96.35 - 99.36
411/420
Proportion of children whose parents were satisfied with the treatment
96.79(97.03) 95.84 - 97.73
1396/ 1447
97.12 95.10-99.13
303/312 97.96 96.6 - 99.31
479/489 93.81 90.44 - 97.17
212/226 97.62 96.04 - 99.20
410/420
Reason for being satisfied n=1383 n=299 n=472 n=206 n=406 Good doctor/staff available 14.76(15.18)
12.86 - 16.67 210 18.73
14.14 - 23.32 56 15.47
12.10 - 18.83 73 13.59
8.67 - 18.51 28 13.05
9.65 - 16.45 53
Good facilities/services 0.53(0.51) 0.11 - 0.95
7 0 0 0.21 -0.31 - 0.73
1 0.49 -0.71 - 1.68
1 1.23 0.04 - 2.43
5
Good treatment 80.38(79.83) 78.25 - 82.51
1104 76.25 71.26 - 81.24
228 81.14 77.51 - 84.78
383 82.04 76.55 - 87.52
169 79.8 75.77 - 83.83
324
low cost/free treatment 2.45(2.46) 1.60 - 3.30
34 2.01 0.25 - 3.76
6 1.48 0.29 - 2.68
7 2.43 0.08 - 4.77
5 3.94 1.93 - 5.96
16
Good access/nearby 1.88(2.02) 1.13 - 2.63
28 3.01 0.91 - 5.11
9 1.69 0.42 - 2.97
8 1.46 -0.42 - 3.33
3 1.97 0.50 - 3.45
8
Reason for being dissatisfied n=43 n=9 n=10 n=14 n=10 Good doctor/staff not available 9.98(9.3)
-0.14 - 20.11 4 0 0 20
-9.79 - 49.79 2 7.14
-9.92 - 24.21 1 10.00
-13.59 - 33.59 1
Poor facilities/services 1.2(2.33) -3.22 - 5.61
1 11.11 -14.98- 37.20
1 0 0 0 0 0 0
Treatment not good 74.09(72.09) 59.83 - 88.34
31 66.67 30.31 - 103.0
6 50 14.01 - 85.99
5 85.71 63.81 - 107.6
12 80 50.21 - 109.79
8
Too expensive/can’t afford 3.24(4.65) -3.22 - 9.69
2 11.11 -14.98 - 37.2
1 0 0 0 0 10.00 -13.59 - 33.59
1
No other choice 11.49(11.63) 0.80 - 22.19
5 11.11 -14.98 - 37.2
1 30 -3.40 - 63.40
3 7.14 -9.92 - 24.21
1 0 0

CIET/District Government Khanewal: social audit 2005 73
Indicator District % wt (unwt)
95% CI
Based on
JAHANIA Unwt
95% CI
Based on
KABIRWALA unwt
95% CI
Based on
KHANEWAL unwt
95% CI
Based on
MIAN CHANNU unwt
95% CI
Based on
Cost of treatment of ARI
Travel cost
Government health facility
Paid some cost 54.81(52.83) 44.86 - 64.75
56/106 51.61 32.41- 70.82
16/31 28.13 10.98 - 45.27
9/32 83.33 63.34-103.33
15/18 64.0 43.18 - 84.82
16/25
Mean amount paid in Pak Rs. 35.95 (38) 18.258 - 53.642
56 48.44 36.55 - 60.33
16 65.56 -18.62-149-7
9 27.6 14.34 - 29.28
15 21.81 14.34 - 29.28
16
Private qualified health provider
Paid some cost 63.99(61.42) 60.04 - 67.95
363/591 38.93 30.20 - 47.66
51/31 50.41 41.09 - 59.74
61/121 71.47 61.99 - 61.48
66/92 74.90 69.29 - 80.51
185/247
Mean amount paid in Pak Rs. 58.409 (59.152) 40.291 - 76.528
363 61.90 34.9 - 88.9
51 78.34 51.8 - 104.9
61 48.49 29.8 - 67.2
66 55.87 40.72 - 71.01
185
Private unqualified health provider Paid some cost 16.11(16.62)
14.18 - 18.03 241/1450 18.59
14.11 - 23.07 58/312 12.45
9.42 - 15.47 61/490 14.98
10.12 - 19.84 34/227 20.9
16.9 - 24.91 88/421
Mean amount paid in Pak Rs. 55.752 (54.282) 22.488 - 89.017
241 27.69 22.56 - 32.81
58 80.71 -16.1 - 177.5
61 27.94 18.66 - 37.23
34 63.67 29.67 - 97.67
88
Treatment cost at the facility
Government health facility
Paid some cost 94.95(94.34) 90.31 - 99.59
100/106 93.55 83.29 - 103.8
29/31 93.75 83.80 - 103.7
30/32 100 97.22 - 102.8
18/18 92 79.2 - 104
23/25
Mean amount paid in Pak Rs. 34.28 (29.91) 11.94 - 56.63
100 9.379 0.56 - 19.32
29 65.23 14.8 - 145.3
30 33.94 5.2 - 62.7
18 6.57 0.96 - 12.17
23
Private qualified health provider Paid some cost 93.54(93.81)
91.46 - 95.63 546/582 96.12
92.41 - 99.84 124/129 95.93
92.04 - 99.83 118/123 92.31
86.28 - 98.33 84/91 92.05
88.41 - 95.69 220/239
Mean amount paid in Pak Rs. 292.24(280.56) 170.90 - 413.59
546 158.23 114.6 - 201.9
124 252.76 122.2 - 383.3
118 296.9 180.8 - 412.9
84 358.20 29.60 - 686.81
220
Private unqualified health provider Paid some cost 94.09(94.5)
92.84 - 95.34 1358/ 1437
95.78 93.37 - 98.19
295/308 96.69 95.00 - 98.39
468/484 89.73 85.53 - 93.93
201/224 93.59 91.13 - 96.05
394/421
Mean amount paid in Pak Rs. 99.02 (98.43) 80.12 - 117.93
1358 81.88 48.7 - 115.1
295 81.85 69.3 - 94.4
468 98.50 76.21 - 120.8
201 130.5 80.1 - 180.9
394
Cost of medicines or investigations outside the facility Government health facility
Paid some cost 55.37(54.72) 45.44 - 65.31
58/106 61.29 42.53 - 80.05
19/31 60.61 42.42 - 78.79
20/33 66.67 42.11 - 91.22
12/18 29.17 8.90 - 49.43
7/24
Mean amount paid in Pak Rs. 197.69 (189.84) 78.40 - 316.99
57 177.33 110.0 - 244.7
18 169.6 68.7 - 270.4
20 252.33 62.2 - 566.8
12 172.86 97.52 - 248.20
7

CIET/District Government Khanewal: social audit 2005 74
Indicator District % wt (unwt)
95% CI
Based on
JAHANIA Unwt
95% CI
Based on
KABIRWALA unwt
95% CI
Based on
KHANEWAL unwt
95% CI
Based on
MIAN CHANNU unwt
95% CI
Based on
Private qualified health provider Paid some cost 52.71(51.79)
48.58 - 56.84 303/585 37.98
29.22 - 46.75 49/129 39.34
30.27 - 48.42 48/122 52.75
41.94 - 63.55 48/91 65.02
58.82 - 71.22 158/243
Mean amount paid in Pak Rs. 485.75 (474.36) 285.76 - 685.75
303 207.755 86.5 -329.0
49 219.23 153.8 - 284.6
48 477.8 254.6 - 701.0
48 633.53 301.9 - 965.2
158
Private unqualified health provider Paid some cost 14.17(14.02)
12.33 - 16.01 201/1434 14.94
10.79 - 9.08 46/308 20.54
16.83 - 24.25 99/482 12.95
8.33 - 17.57 29/224 6.43
3.96 - 8.89 27/420
Mean amount paid in Pak Rs. 250.96 (245.94) 179.88 - 322.03
201 145.1 58.6 - 231.6
46 251.62 129.9 - 373.3
99 191.03 105.2 - 276.9
29 455.9 132.1 - 779.8
27
Prevalence and cost on treatment of measles
Proportion of children 10-59 months ever suffering from measles
18.62(18.51) 17.13 - 20.11
498/2690 15.01 12.00 - 18.02
86/573 17.4 14.74 - 20.06
142/816 17.06 13.53 - 20.60
79/463 22.79 19.89 - 25.69
191/838
Proportion of children 10-59 months suffering from measles during last 24 months
13.63(13.68) 12.31 - 14.94
368/2690 11.34 8.66 - 14.03
65/573 13.36 10.96 - 15.75
109/816 11.23 8.25 - 14.22
52/463 16.95 14.35 - 19.54
142/838
Among 10-59 children who suffered from measles during last 24 months
Paid some cost for treatment of measles
63.71(63.84) 58.56 - 68.86
226/354 56.67 43.29 - 70.04
34/60 57.69 47.72 - 67.67
60/104 59.62 45.32 - 73.91
31/52 73.19 65.44 - 80.94
101/138
Mean amount paid in Pak Rs. 385.448(378.022) 297.504 - 473.392
226 391.8 51.65 - 731.9
34 475 333.8 - 616.3
60 437.6 236.3 - 638.9
31 297.5 179.7 - 415.3
101
Immunization of Children
Who decides about immunizing the child (children 0-59 months of age)
n=3473 n=785 n=1020 n=599 n=1069
Mothers alone (incl step mother) 44.44(45.38) 42.77 - 46.11
1576 43.57 40.03 - 47.10
342 40.1 37.04 - 3.15
409 36.23 32.29 - 40.16
217 56.88 53.86 - 59.89
608
mother with father 33.01(34.18) 31.44 - 34.59
1187 47.64 44.09 - 51.20
374 36.67 33.66 - 39.67
374 33.39 29.53 - 37.25
200 22.36 19.81 - 24.90
239
mother not involved at all 22.55(20.44) 21.14 - 23.95
710 8.79 6.75 - 10.83
69 23.24 20.59 - 25.88
237 30.38 26.62 - 34.15
182 20.77 18.29 - 23.25
222
Mother decides or is involved in the decision
77.45(79.56) 76.05 - 78.86
2763/ 3473
91.21 89.17 - 93.25
716/785 76.76 74.12 - 79.41
783/1020 69.62 65.85 - 73.38
417/599 79.23 76.75 - 81.71
847/1069
Vaccine coverage
No. children aged 12 to 23 months 652 136 203 114 199 Among children 12-23 months of age Proportion reported to have received BCG (TB) vaccine
81.42(81.68) 78.34 - 84.50
526/644 83.7 77.10 - 90.30
113/135 71 64.46 - 77.54
142/200 85.71 78.79 - 92.64
96/112 88.83 84.18 - 93.48
175/197
Proportion having BCG scar on the left upper arm
66.3(67.38) 62.29 - 70.31
376/558 76.11 67.80 - 84.41
86/113 50.57 42.86 - 58.29
88/174 71 61.61 - 80.39
71/100 76.61 69.97 - 83.25
131/171
Proportion reported to have received any DPT vaccine
80.36(79.59) 77.19 - 83.52
507/637 77.61 70.18 - 85.04
104/134 64.29 57.32 - 71.25
126/196 92.86 87.64 - 98.07
104/112 88.72 84.02 - 93.41
173/195
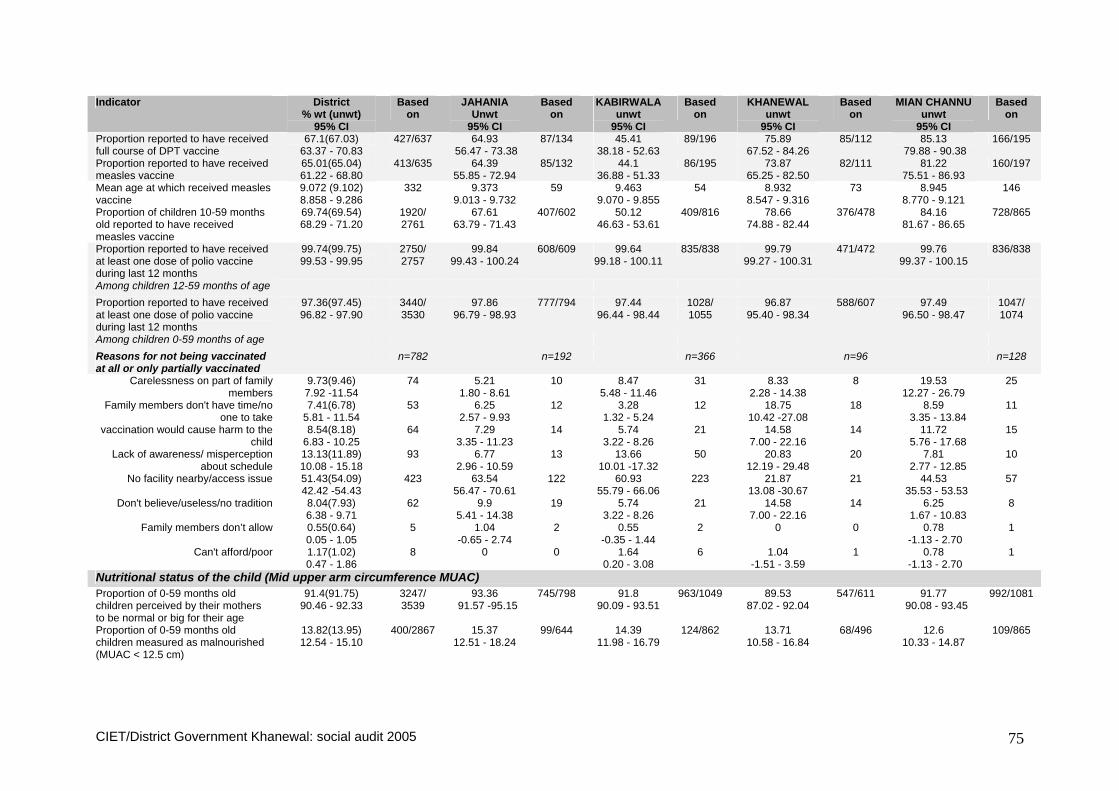
CIET/District Government Khanewal: social audit 2005 75
Indicator District % wt (unwt)
95% CI
Based on
JAHANIA Unwt
95% CI
Based on
KABIRWALA unwt
95% CI
Based on
KHANEWAL unwt
95% CI
Based on
MIAN CHANNU unwt
95% CI
Based on
Proportion reported to have received full course of DPT vaccine
67.1(67.03) 63.37 - 70.83
427/637 64.93 56.47 - 73.38
87/134 45.41 38.18 - 52.63
89/196 75.89 67.52 - 84.26
85/112 85.13 79.88 - 90.38
166/195
Proportion reported to have received measles vaccine
65.01(65.04) 61.22 - 68.80
413/635 64.39 55.85 - 72.94
85/132 44.1 36.88 - 51.33
86/195 73.87 65.25 - 82.50
82/111 81.22 75.51 - 86.93
160/197
Mean age at which received measles vaccine
9.072 (9.102) 8.858 - 9.286
332 9.373 9.013 - 9.732
59 9.463 9.070 - 9.855
54 8.932 8.547 - 9.316
73 8.945 8.770 - 9.121
146
Proportion of children 10-59 months old reported to have received measles vaccine
69.74(69.54) 68.29 - 71.20
1920/ 2761
67.61 63.79 - 71.43
407/602 50.12 46.63 - 53.61
409/816 78.66 74.88 - 82.44
376/478 84.16 81.67 - 86.65
728/865
Proportion reported to have received at least one dose of polio vaccine during last 12 months
99.74(99.75) 99.53 - 99.95
2750/ 2757
99.84 99.43 - 100.24
608/609 99.64 99.18 - 100.11
835/838 99.79 99.27 - 100.31
471/472 99.76 99.37 - 100.15
836/838
Among children 12-59 months of age Proportion reported to have received at least one dose of polio vaccine during last 12 months
97.36(97.45) 96.82 - 97.90
3440/ 3530
97.86 96.79 - 98.93
777/794 97.44 96.44 - 98.44
1028/ 1055
96.87 95.40 - 98.34
588/607 97.49 96.50 - 98.47
1047/ 1074
Among children 0-59 months of age Reasons for not being vaccinated at all or only partially vaccinated
n=782 n=192 n=366 n=96 n=128
Carelessness on part of family members
9.73(9.46) 7.92 -11.54
74 5.21 1.80 - 8.61
10 8.47 5.48 - 11.46
31 8.33 2.28 - 14.38
8 19.53 12.27 - 26.79
25
Family members don't have time/no one to take
7.41(6.78) 5.81 - 11.54
53 6.25 2.57 - 9.93
12 3.28 1.32 - 5.24
12 18.75 10.42 -27.08
18 8.59 3.35 - 13.84
11
vaccination would cause harm to the child
8.54(8.18) 6.83 - 10.25
64 7.29 3.35 - 11.23
14 5.74 3.22 - 8.26
21 14.58 7.00 - 22.16
14 11.72 5.76 - 17.68
15
Lack of awareness/ misperception about schedule
13.13(11.89) 10.08 - 15.18
93 6.77 2.96 - 10.59
13 13.66 10.01 -17.32
50 20.83 12.19 - 29.48
20 7.81 2.77 - 12.85
10
No facility nearby/access issue 51.43(54.09) 42.42 -54.43
423 63.54 56.47 - 70.61
122 60.93 55.79 - 66.06
223 21.87 13.08 -30.67
21 44.53 35.53 - 53.53
57
Don't believe/useless/no tradition 8.04(7.93) 6.38 - 9.71
62 9.9 5.41 - 14.38
19 5.74 3.22 - 8.26
21 14.58 7.00 - 22.16
14 6.25 1.67 - 10.83
8
Family members don’t allow 0.55(0.64) 0.05 - 1.05
5 1.04 -0.65 - 2.74
2 0.55 -0.35 - 1.44
2 0 0 0.78 -1.13 - 2.70
1
Can't afford/poor 1.17(1.02) 0.47 - 1.86
8 0 0 1.64 0.20 - 3.08
6 1.04 -1.51 - 3.59
1 0.78 -1.13 - 2.70
1
Nutritional status of the child (Mid upper arm circumference MUAC) Proportion of 0-59 months old children perceived by their mothers to be normal or big for their age
91.4(91.75) 90.46 - 92.33
3247/ 3539
93.36 91.57 -95.15
745/798 91.8 90.09 - 93.51
963/1049 89.53 87.02 - 92.04
547/611 91.77 90.08 - 93.45
992/1081
Proportion of 0-59 months old children measured as malnourished (MUAC < 12.5 cm)
13.82(13.95) 12.54 - 15.10
400/2867 15.37 12.51 - 18.24
99/644 14.39 11.98 - 16.79
124/862 13.71 10.58 - 16.84
68/496 12.6 10.33 - 14.87
109/865

CIET/District Government Khanewal: social audit 2005 76
Annex 6 Main indicators from community profiles and LHW interviews Table 1. Indicators from community profiles
Indicator Number of communities
Total number of communities visited 37 Urban communities 6 Rural communities 31 Garbage disposal system Communities with a system for removing garbage from individual households 4/37 Communities with a government system for removing garbage from the community 3/37 Frequency of removal of garbage by the government system (n=3)
Daily 2 Less frequently than once in a month 1
Communities with a proper method for disposal of garbage (including those with government system) 23/36 Communities with large amounts of garbage piled in the streets 34/35 Communities with large amounts of human/animal excreta in the streets 30/34 Sewerage system Communities with a government sewerage system 18/36 Communities with a better sewerage system 10/36 Communities with large amounts of stagnant water/ sewage in the streets 15/33 Drinking water Communities with sweet ground water 29/37 Availability of health facilities Within 5 km Availability of a health facility (n=37)
Government 31 Private 33
Any (government or private) 36 Availability of an evening/24 hr health facility (n=37)
Government 9 Private 31
Any (government or private) 32 Within 1 km Availability of a health facility (n=37)
Government 7 Private 30
Any (government or private) 31 Availability of an evening/24 hr health facility (n=37)
Government 3 Private 24
Any (government or private) 25 Availability of immunization services Availability of a health facility with immunization services for children within 5 km (n=37)
Government 31 Private 3
Any (government or private) 31 Availability of a health facility with immunization services for children within 1 km (n=37)
Government 7 Private 2
Any (government or private) 9

CIET/District Government Khanewal: social audit 2005 77
Indicator Number of communities
Usual place for people in the community to take their children to be immunized (n=33) Government health facility 4
Vaccination team visit at home 29 Communities where people take their children to a health facility for immunization 4/33 Communities visited by a vaccination team/person for routine immunization 35/37 Frequency of visit by a vaccination team to the community for routine immunization (n=37)
Never visited 2 At least once every month 14
Not every month but at least once every 6 months 19 Not every six months but at least once in a year 1
Less frequent than once in a year 1 Period since last visit by a vaccination team for routine immunization (n=35)
Never visited 2 Last visit with in a month 21
More than one month, but with in the last 6 months 11 More than 6 months , but with in last year 1
Polio campaign Communities with a Polio Campaign/Day celebrated within last one month 19/34 Number of polio campaign/days in the community in the last 12 months (n=37)
2 2 3 3 4 2 5 1 7 1 8 1
10 2 12 3
95 (yes not specified) 22 Community organization Communities with any NGOs/CBOs/voluntary organizations/committees 5/37 Communities with any women organization 0 Communities with any existing CCB 1/37 Communities with any project done by a CCB 0

CIET/District Government Khanewal: social audit 2005 78
Table 2. Indicators from LHW interviews Indicator Number of LHWs General information Total number of LHWs interviewed 29 Age distribution of LHWs (n=29)
18-30 years 18 31-40 years 9
41 years and above 2 Formal education level (n=29)
Less than 10th grade 14 Up to 10th grade 13
More then 10th grade 2 Period since started working as an LHW (n=27)
Less then one year 4 More then a year up to 5 years 9
More then 5 years up to 10 years 13 More then 10 years 1
Training of LHWs Period since received initial training (n=26)
Within last one year 5 More than a year but within last two years 8
More than two years ago 13 LHWs receiving any further refresher training 17/29 Period since received refresher training (n=17)
Within last three months/still going on 11 More than three months but within the last six months 1
More than six months but within the last one year 1 More than a year but within last five years 3
More than five years ago 1 Household visits Number of households covered by LHWs (n=28)
150 or less households 8 More than 150 households 20
Factors that would aid LHWs to visit the households (multiple responses recorded) (n=28) Nothing needed 25
Community support 2 More medicines/equipment 1
Provide transport 1 More LHWs/fewer households per LHW -
Supervisory support Frequency of visit by a supervisor (n=29)
Once a month or less frequently (including “no one visits”) 25 More than once a month 4
LHWs visited by a supervisor within last one month 14/22 Knowledge and practices about immunization LHWs that could mention at least one correct illness prevented by immunisation 28/29 LHWs that have heard about any bad effects of immunization 11/29 Type of bad effects of immunisation heard by LHWs (n=29)
Nothing 18 Actual side-effects 8
Incorrect perceptions 2 No effect of vaccine 1

CIET/District Government Khanewal: social audit 2005 79
Indicator Number of LHWs Source from where heard about bad effects of immunization (n=11)
Family/neighbours, (including knew myself) 3 Doctor/other health workers/health facility 3
During training/material 3 During household visits (from parents) 2
Advice given by LHWs to mothers and care givers about immunization of their children (n=29) Important to immunize 23
Illness protection 5 Get vaccination form birth 1
Information provide by LHWs to mothers/care givers about immunization (multiple responses recorded) (n=29) Importance and benefit 24
Schedule/follow schedule/ follow rules 4 Nothing 1
Main reasons as reported by LHWs for some children not being immunized (multiple responses recorded) (n=29) Carelessness 12
Family problem/migration 5 No reason 4
Lack of awareness 3 Wait for mobile team/team does not come 3
Don't believe in it 2 Not allowed 2
Don't have time/no one to take 1 Fear of side effects 1
Suggestions to help ensure that all children get immunized (multiple responses recorded) (n=29) Provide information/awareness 10
Mobile teams 6 Facility nearby/transport 4
Nothing 2 Mare staff/vaccinators/train LHWs 2
Ensure vaccine availability/generator/electricity 2 Knowledge and practices about childhood diarrhea LHWs mentioning at least one correct reasons for diarrhoea among children 0-5 years 27/28 LHWs thinking that child should be given more fluids than usual during diarhoea 29/29 LHWs thinking that child should be given more or same amount of food than usual during diarhoea 26/29 Advice given by LHWs to the mothers about preventing diarrhea in children (multiple responses recorded) (n=29)
Hygiene/cleanliness 26 Nutrition/food 9
More fluids/ORS 5 Advice given by LHWs to the mothers about treating diarrhea in children (multiple responses recorded) (n=29)
More fluids/ORS 28 Nutrition/food 8
Contact doctor 8 Hygiene/cleanliness 2
LHWs thinking that children suffering from diarrhea should be given anti-diarrhoeal drugs 22/29 Knowledge and practices about childhood Acute Respiratory Infections (ARI) LHWs telling mother at least one correct information about ARI recognition 28/29 Advice given by LHWs to the mothers about treating a child with ARI (multiple responses recorded) (n=29)
Provide medicine (co-trimoxazol/paraceutamol syrup) 22 Take to Doctor 14
Protect form coldness 3 Contact Doctor 2 Breast feeding 1
Give eggs and honey/ hot foods 1
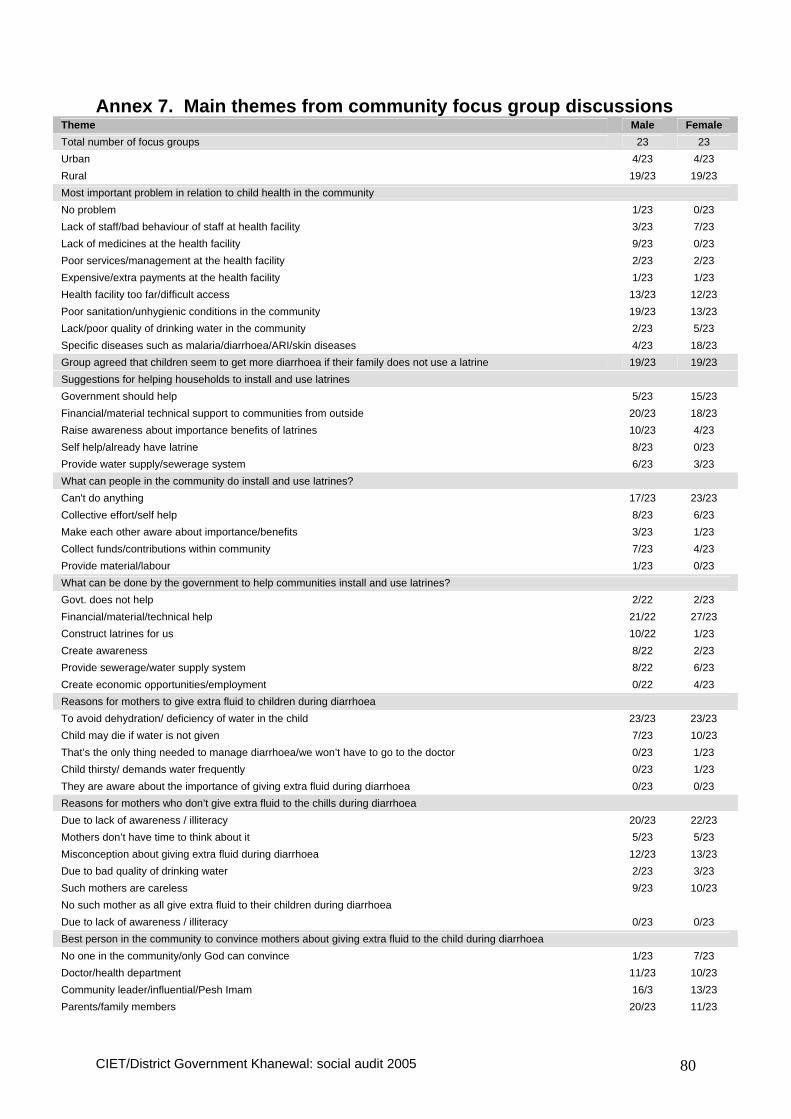
CIET/District Government Khanewal: social audit 2005 80
Annex 7. Main themes from community focus group discussions Theme Male Female Total number of focus groups 23 23 Urban 4/23 4/23 Rural 19/23 19/23 Most important problem in relation to child health in the community No problem 1/23 0/23 Lack of staff/bad behaviour of staff at health facility 3/23 7/23 Lack of medicines at the health facility 9/23 0/23 Poor services/management at the health facility 2/23 2/23 Expensive/extra payments at the health facility 1/23 1/23 Health facility too far/difficult access 13/23 12/23 Poor sanitation/unhygienic conditions in the community 19/23 13/23 Lack/poor quality of drinking water in the community 2/23 5/23 Specific diseases such as malaria/diarrhoea/ARI/skin diseases 4/23 18/23 Group agreed that children seem to get more diarrhoea if their family does not use a latrine 19/23 19/23 Suggestions for helping households to install and use latrines Government should help 5/23 15/23 Financial/material technical support to communities from outside 20/23 18/23 Raise awareness about importance benefits of latrines 10/23 4/23 Self help/already have latrine 8/23 0/23 Provide water supply/sewerage system 6/23 3/23 What can people in the community do install and use latrines? Can't do anything 17/23 23/23 Collective effort/self help 8/23 6/23 Make each other aware about importance/benefits 3/23 1/23 Collect funds/contributions within community 7/23 4/23 Provide material/labour 1/23 0/23 What can be done by the government to help communities install and use latrines? Govt. does not help 2/22 2/23 Financial/material/technical help 21/22 27/23 Construct latrines for us 10/22 1/23 Create awareness 8/22 2/23 Provide sewerage/water supply system 8/22 6/23 Create economic opportunities/employment 0/22 4/23 Reasons for mothers to give extra fluid to children during diarrhoea To avoid dehydration/ deficiency of water in the child 23/23 23/23 Child may die if water is not given 7/23 10/23 That’s the only thing needed to manage diarrhoea/we won’t have to go to the doctor 0/23 1/23 Child thirsty/ demands water frequently 0/23 1/23 They are aware about the importance of giving extra fluid during diarrhoea 0/23 0/23 Reasons for mothers who don’t give extra fluid to the chills during diarrhoea Due to lack of awareness / illiteracy 20/23 22/23 Mothers don’t have time to think about it 5/23 5/23 Misconception about giving extra fluid during diarrhoea 12/23 13/23 Due to bad quality of drinking water 2/23 3/23 Such mothers are careless 9/23 10/23 No such mother as all give extra fluid to their children during diarrhoea Due to lack of awareness / illiteracy 0/23 0/23 Best person in the community to convince mothers about giving extra fluid to the child during diarrhoea No one in the community/only God can convince 1/23 7/23 Doctor/health department 11/23 10/23 Community leader/influential/Pesh Imam 16/3 13/23 Parents/family members 20/23 11/23

CIET/District Government Khanewal: social audit 2005 81
Theme Male Female NGOs/social workers/teams from outside 3/23 4/23 Community women to each other 3/23 4/23 LHW 15/23 18/23 Other ways to convey such messages to mothers Pesh Imam in Friday sermon/prayers 3/23 2/22 Media/poster/pamphlet 25/23 20/22 Community meetings/events 3/23 2/22 NGOs/Social workers/trained community members/teachers/teams from outside 14/23 6/22 Through doctors and health workers 14/23 20/22 Community centres from info 4/23 1/22 Suggestions for improving household environment to prevent children’s exposure to smoke from fuel and smoking Kitchen should be made away from the place of sitting/sleeping in home 15/23 13/23 Alternative fuels - If gas is made available then there would be no smoke 18/23 17/23 Smoking of cigarettes should not be done inside home 23/23 22/23 Cooking should be done when children were in school or not at home 3/23 10/23 Outlets to exit smoke out of kitchen/home 21/23 19/23 Create awareness about proper ventilation and hazards of smoky environment 3/23 3/23 What can householders and people in the community do improve household environment? Nothing 13/23 15/23 Form committee to create awareness 3/23 5/23 Separate cooking area/keep children away from cooking area 15/23 5/23 Use gas/alternate fuel with less smoke 4/23 6/23 Control smoking 10/23 9/23 Proper ventilation for smoke exit from kitchen/house 12/23 11/23 What can be done by the government/ NGOs to help communities for improving household environment? Nothing 4/23 1/23 Provide gas 15/23 21/23 Awareness about hazards of smoking 10/23 6/23 Legislation to Ban smoking 21/23 23/23 Provide funds to construct separate kitchen/cooking area, ventilation 16/23 21/23 Reasons why children were not taken anywhere for treatment of ARI Poverty/too many children 23/23 23/23 Facility too far/No transport 16/23 16/23 No doctor/Bad behaviour of doctor 7/23 6/23 Medicines not available/poor quality of medicines 12/23 7/23 Lack of awareness/misconceptions/tradition/self medication 8/23 5/23 Careless/ignorant 2/23 6/23 Suggestions to encouraged /support parents so that they take their children to a health facility for treatment of ARI More/free/good quality medicines 14/23 22/23 Financial support/employment/control price 4/23 7/23 Health facility nearby/better roads 22/23 17/23 Awareness among people 5/23 4/23 Doctors available/better behaviour of doctors 11/23 13/23 Focus groups who parents who don’t immunise fully understand the risk that they are taking 5/23 8/23 Reasons for those who don’t understand the risk from not having their children immunized Illiteracy/lack of education 20/21 21/23 Don't take measles as a serious disease 8/21 4/23 No info about the risk/no one comes to tell 3/21 2/23 People ignorant/careless 5/21 8/23 Reasons for those who understand the risk, but still are unable to get their children immunized Lack/poor immunization services/no mobile team 17/23 13/23 No transport/roads 3/23 5/23 Poverty 9/23 6/23

CIET/District Government Khanewal: social audit 2005 82
Theme Male Female Carelessness/no tradition/women not allowed 14/23 16/23 Misconceptions about vaccination/fear of side effects/family planning 8/23 10/23 No time to take child for vaccination 2/23 10/23 Suggestions to help parents to have their children immunized Nothing would help/no need 0/23 1/23 Send mobile vaccination teams 18/23 17/23 Better access to health facility/nearby/transport/employment 5/23 17/23 More staff at health facility 1/23 3/23 Create awareness about immunization 21/23 19/23 More vaccines/use of disposable syringe/stop corruption 1/23 2/23