social and economic impacts of tourist lodges on local ... and economic impacts of tourist lodges on...
TRANSCRIPT

research for a sustainable future
Rosemary S Black
Social and economic impacts of tourist lodges on local communities: Case
studies from Rwanda and Botswana Report No. 82

i
SOCIAL AND ECONOMIC IMPACTS OF TOURIST LODGES ON
LOCAL COMMUNITIES: CASE STUDIES FROM RWANDA AND
BOTSWANA
A Report for the African Wildlife Foundation, Nairobi, Kenya
Dr Rosemary Black
With the assistance of Dr Patrick B. Cobbinah
School of Environmental Sciences
Charles Sturt University
Albury, Australia
May 2015

ii
Social and economic impacts of tourist lodges on local communities: Case
studies from Rwanda and Botswana
Black, R. S. a (2015) Social and economic impacts of tourist lodges on local communities:
Case studies from Rwanda and Botswana. Institute for Land, Water and Society, Charles Sturt
University, Albury-Wodonga. Report to the African Wildlife Foundation. May 2015.
a Institute for Land, Water and Society
Charles Sturt University
PO Box 789
Albury, NSW 2640
Report No: 82
Black, Rosemary
Social and economic impacts of tourist lodges on local communities: Case studies from
Rwanda and Botswana/ by Rosemary Black – Albury, NSW: Charles Sturt University,
Institute for Land, Water and Society, 2015.
ISBN 978-1-86-467261-9
Financial and in-kind support was provided for this project from the African Wildlife
Foundation and Charles Sturt University.
Cover images: SACOLA dance troupe, Volcanoes National Park, Rwanda (left), Giraffes,
Chobe National Park, Botswana (centre), Ngoma Safari Lodge, Botswana (right) Photograph
credits Rosemary Black.

iii
ACKNOWLEDGEMENTS
I would like to acknowledge the financial and in-kind support I received from the African
Wildlife Foundation (AWF) to undertake this research and in particular the support of Brian
McBrearity, Director, Conservation Enterprises, AWF. The support of many other AWF staff
in the Nairobi, Livingstone and Washington DC offices is also acknowledged including Karen
Ross, Per Karlsson and Nasson Tembo.
My sincerest thanks also go to the operators and managers of Ngoma Safari Lodge in
Botswana and Sabyinyo Silverback Lodge in Rwanda who were very helpful in providing
background information and supporting and facilitating the survey work with staff. I would
also like to sincerely thank the people in the local communities adjacent to the lodges who
agreed to be surveyed as part of this research; again their willingness to participate in the
surveys ensured that this research could be completed. Undertaking the survey work would
not have been possible without the help of my translators, Georginah Kachana in Botswana
and Angel Umutoni in Rwanda. Thank you both for your support, friendship and
professionalism. My thanks also go the all the staff working for the Chobe Enclave
Conservation Trust in Botswana and Sabyinyo Community Livelihoods Association in
Rwanda who supported me and provided invaluable background information on the
community trusts. Thanks too to all the people in both countries who provided excellent on-
ground support with transport, accommodation and other support.
The opportunity to undertake this research came from a chance meeting with Per Karlsson an
AWF staff member at an IUCN World Congress in South Korea who followed this up with
Brian McBrearity who then invited me to carry out this study. I would like to thank Brian for
giving me the opportunity to complete this study which has been an incredible experience and
opportunity for me professionally and personally. I sincerely I hope this report and the study
findings will assist the AWF in future decision making in policy and resource allocation.
The support of Charles Sturt University where I am an Associate Professor in the School of
Environmental Sciences is greatly appreciated, giving me six months special study leave and
some financial support to undertake this research in Africa. The assistance of Dr Patrick B.
Cobbinah in analysing the survey data is greatly appreciated.
Finally, I would like to thank my family, friends and colleagues for their continued support
and in particular my partner Ken who has been so supportive of my work and travel
adventures.

iv
EXECUTIVE SUMMARY
The purpose of this project was to explore the social and economic impacts of two tourist
lodges on local communities and their influence on local behaviour modification towards
conservation and tourism. The lodges were located in Botswana and Rwanda. The specific
objectives of the project were:
1. To investigate the social and economic impacts of the lodges on non-staff local
residents;
2. To examine the social and economic impacts of the lodges on local lodge staff;
3. To compare the social and economic impacts of the lodges on staff and non-staff local
residents, and between the two countries; and
4. To assess the influence of the social and economic impacts of the lodges on local
attitudes towards conservation.
Structured face-to-face questionnaires were administered to both lodge staff and local
residents living within the vicinity of the lodges. A number of semi-structured interviews
were undertaken with selected stakeholders.
The socio-economic data reveal a generally positive impact of tourism on the local
communities following the construction of the lodges. Across the two countries those who
reported positive benefits of the lodges in terms of jobs, environmental conservation, local
development and tourism development varied from 50% to 90% amongst the community
residents and 70% to 96% among the staff. Specifically, community benefits were mostly
collective community-based projects such as construction of school blocks, electrification
project, water tanks and seed multiplication projects, while the staff benefits were individual-
based, and included jobs, skills training, accommodation, food, medical aid, and bonuses.
There were also indirect socio-economic benefits associated with the lodges which both the
staff and community residents acknowledged had contributed to poverty reduction and
community development. For example, an average staff member, mostly unmarried, supports
four people, earns more, spends more in the local community, and owns more assets
compared to average community residents because of the income and other benefits the
lodges provide them.
The comparative analysis suggests that overall residents in Rwanda received more social and
economic benefits from the lodges compared with those in Botswana. As a result, they
v
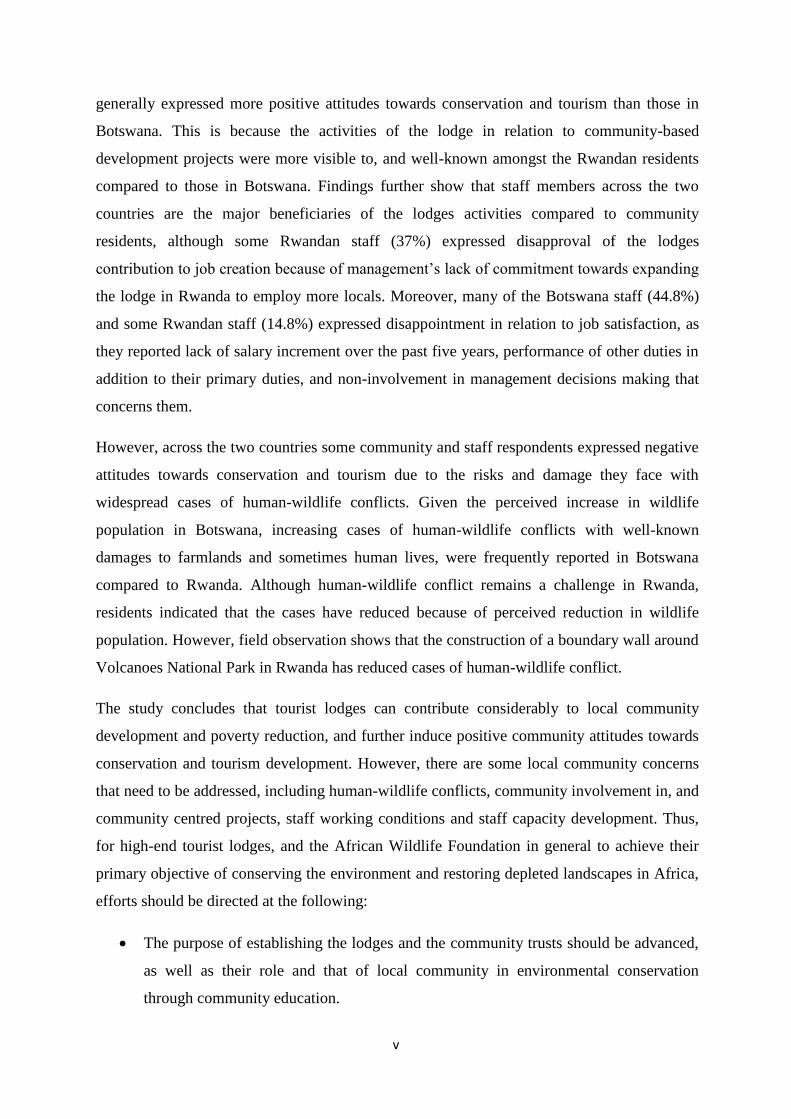
generally expressed more positive attitudes towards conservation and tourism than those in
Botswana. This is because the activities of the lodge in relation to community-based
development projects were more visible to, and well-known amongst the Rwandan residents
compared to those in Botswana. Findings further show that staff members across the two
countries are the major beneficiaries of the lodges activities compared to community
residents, although some Rwandan staff (37%) expressed disapproval of the lodges
contribution to job creation because of management’s lack of commitment towards expanding
the lodge in Rwanda to employ more locals. Moreover, many of the Botswana staff (44.8%)
and some Rwandan staff (14.8%) expressed disappointment in relation to job satisfaction, as
they reported lack of salary increment over the past five years, performance of other duties in
addition to their primary duties, and non-involvement in management decisions making that
concerns them.
However, across the two countries some community and staff respondents expressed negative
attitudes towards conservation and tourism due to the risks and damage they face with
widespread cases of human-wildlife conflicts. Given the perceived increase in wildlife
population in Botswana, increasing cases of human-wildlife conflicts with well-known
damages to farmlands and sometimes human lives, were frequently reported in Botswana
compared to Rwanda. Although human-wildlife conflict remains a challenge in Rwanda,
residents indicated that the cases have reduced because of perceived reduction in wildlife
population. However, field observation shows that the construction of a boundary wall around
Volcanoes National Park in Rwanda has reduced cases of human-wildlife conflict.
The study concludes that tourist lodges can contribute considerably to local community
development and poverty reduction, and further induce positive community attitudes towards
conservation and tourism development. However, there are some local community concerns
that need to be addressed, including human-wildlife conflicts, community involvement in, and
community centred projects, staff working conditions and staff capacity development. Thus,
for high-end tourist lodges, and the African Wildlife Foundation in general to achieve their
primary objective of conserving the environment and restoring depleted landscapes in Africa,
efforts should be directed at the following:
The purpose of establishing the lodges and the community trusts should be advanced,
as well as their role and that of local community in environmental conservation
through community education.
vi
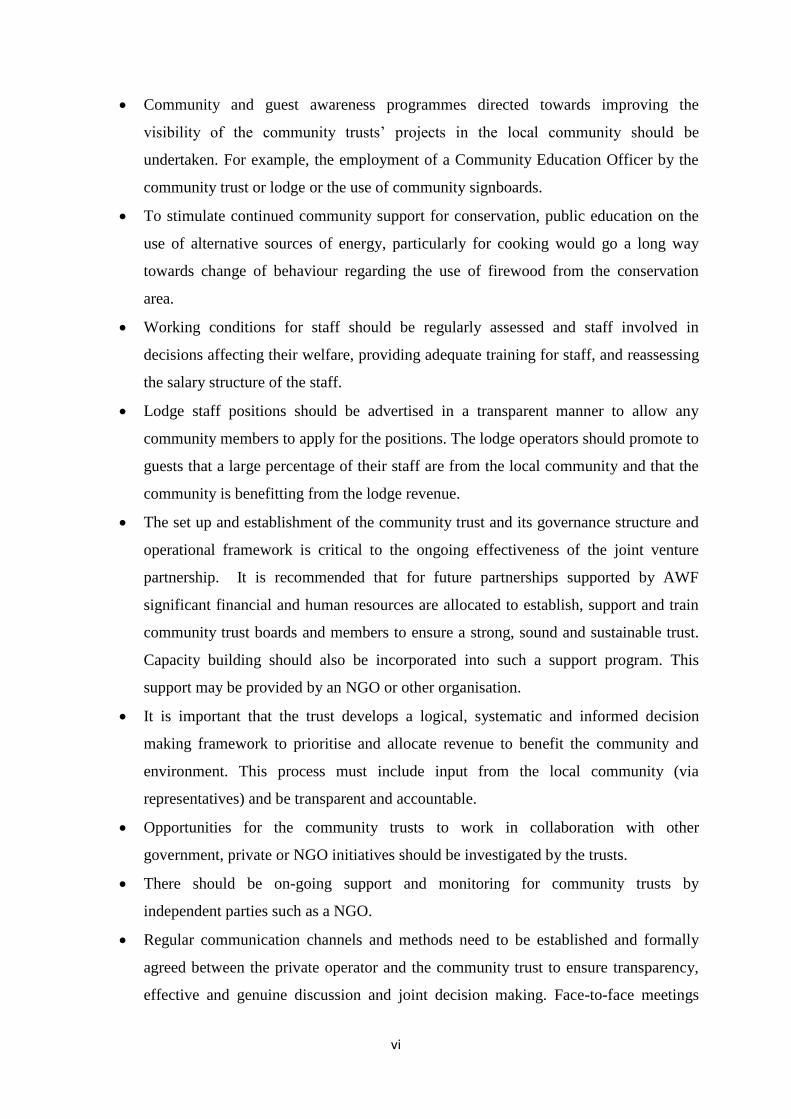
Community and guest awareness programmes directed towards improving the
visibility of the community trusts’ projects in the local community should be
undertaken. For example, the employment of a Community Education Officer by the
community trust or lodge or the use of community signboards.
To stimulate continued community support for conservation, public education on the
use of alternative sources of energy, particularly for cooking would go a long way
towards change of behaviour regarding the use of firewood from the conservation
area.
Working conditions for staff should be regularly assessed and staff involved in
decisions affecting their welfare, providing adequate training for staff, and reassessing
the salary structure of the staff.
Lodge staff positions should be advertised in a transparent manner to allow any
community members to apply for the positions. The lodge operators should promote to
guests that a large percentage of their staff are from the local community and that the
community is benefitting from the lodge revenue.
The set up and establishment of the community trust and its governance structure and
operational framework is critical to the ongoing effectiveness of the joint venture
partnership. It is recommended that for future partnerships supported by AWF
significant financial and human resources are allocated to establish, support and train
community trust boards and members to ensure a strong, sound and sustainable trust.
Capacity building should also be incorporated into such a support program. This
support may be provided by an NGO or other organisation.
It is important that the trust develops a logical, systematic and informed decision
making framework to prioritise and allocate revenue to benefit the community and
environment. This process must include input from the local community (via
representatives) and be transparent and accountable.
Opportunities for the community trusts to work in collaboration with other
government, private or NGO initiatives should be investigated by the trusts.
There should be on-going support and monitoring for community trusts by
independent parties such as a NGO.
Regular communication channels and methods need to be established and formally
agreed between the private operator and the community trust to ensure transparency,
effective and genuine discussion and joint decision making. Face-to-face meetings

vii
should be part of the communication process. It is also important that both parties
monitor and regularly consult the written agreement to ensure that all the clauses in
the agreement are being adhered to and followed such as staff training and
communication between the parties. A review of the joint venture agreement is
required on a regular basis by all parties as well as a review of the community trust
and its activities.
During the establishment phase of the lodge opportunities to benefit the local
community should be investigated and agreements made to procure local products and
services.
It must be clear to all parties especially the community trust the time commitment of
the AWF and other parties in relation to their involvement and establishment of the
trust. An exit strategy is needed when AWF or other parties remove their resources
and/or support.
The lodges should develop a social responsibility policy and community development
objectives. One of the roles of the lodge manager could be to liaise with the
community trust to ensure good communication and identify commercial opportunities
for the community.

viii
TABLE OF CONTENTS
EXECUTIVE SUMMARY ...................................................................................................... iv
INTRODUCTION ................................................................................................................... 13
BACKGROUND ..................................................................................................................... 14
METHODS .............................................................................................................................. 16
Survey Sampling .................................................................................................................. 16
Data Collection Technique and Procedure ........................................................................... 17
Data Analysis ....................................................................................................................... 18
Ethics Consideration ............................................................................................................ 18
Limitations ........................................................................................................................... 18
Case Study Descriptions....................................................................................................... 19
Ngoma Safari Lodge, Botswana ....................................................................................... 19
Sabyinyo Silverback Lodge, Rwanda ............................................................................... 20
RESULTS ................................................................................................................................ 20
Demographic Characteristics ............................................................................................... 20
Age Characteristics of Respondents ................................................................................. 20
Respondents’ Knowledge of Languages .......................................................................... 21
Marital Status of Respondents .......................................................................................... 22
Number of Children and Dependents of Respondents ..................................................... 23
Dwelling Types of Respondents ....................................................................................... 24
Health Status of Respondents ............................................................................................... 25
Energy, Water and Sanitation Conditions ............................................................................ 26
Energy for Lighting and Cooking by Respondents .......................................................... 26
Sources of Potable Water Used by Respondents .............................................................. 27
Distance Travelled by Respondents to Access Water (in minutes) .................................. 29
Type of Toilet Facility Used by Respondents .................................................................. 29
Waste Disposal Methods Used by Respondents............................................................... 30
Educational Characteristics of Respondents ........................................................................ 31
Highest Level of Education of Respondents .................................................................... 31
Factors Influencing the Level of Education of Respondents ............................................ 32
Further Education of Respondents ................................................................................... 34
Skills Training of Respondents......................................................................................... 35
Employment Characteristics ................................................................................................ 36
Employment Sectors of Community Respondents ........................................................... 36
Nature of Employment Position of Respondents ............................................................. 37
Current Positions of Staff Respondents in the Lodges ..................................................... 37
Work Benefits Received by Respondents ........................................................................ 38

ix
Type of Training Provided to Respondents by Employers ............................................... 40
Income and Expenditure Patterns of Respondents ............................................................... 40
Number and Sources of Income Respondents .................................................................. 40
Average Incomes of Respondents .................................................................................... 42
Average Monthly Expenditure of Respondents................................................................ 44
Saving Culture of Respondents ........................................................................................ 45
Ownership of Assets............................................................................................................. 46
Respondents’ Ownership of Assets .................................................................................. 46
Conservation and Tourism ................................................................................................... 47
Community Respondents Knowledge of Sabyinyo Silverback Lodge (Rwanda) and
Ngoma Safari Lodge (Botswana) ..................................................................................... 47
Community Respondents Knowledge of the Relationship between the Lodges and the
Community Trusts ............................................................................................................ 48
Respondents’ Responses to the Lodges’ Contribution to Job Creation............................ 49
Community Respondents to the Lodges’ Contribution to Tourist’s Attraction ............... 50
Community respondents’ Responses to the Lodges’ Contribution to Conservation of
Plants and Animals ........................................................................................................... 51
Community Respondents’ Responses to the Lodges’ Support to Local Communities .... 52
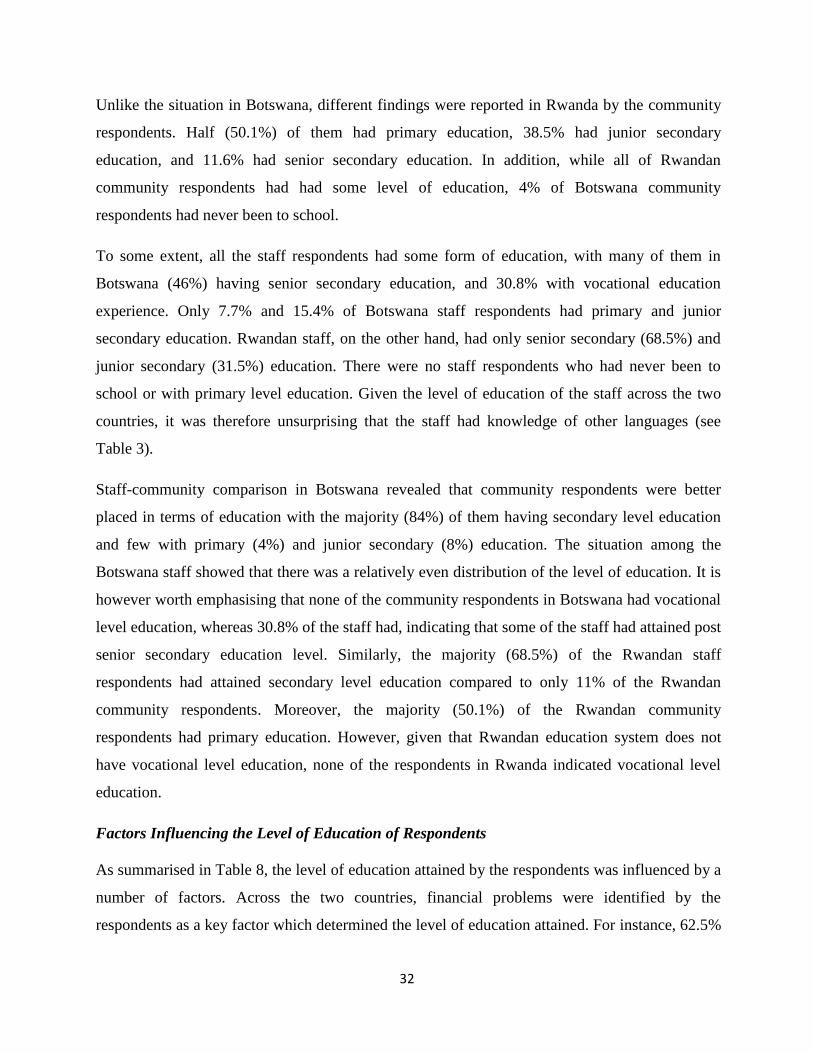
Community Respondents’ Responses to Whether the Lodges’ Could Do More ............. 53
Staff Respondents’ Responses to the Lodges Contribution to Staff’s Personal Growth
and Empowerment ............................................................................................................ 54
Staff Respondents’ Responses to Job Satisfaction with the Lodges ................................ 55
Community Respondents’ Knowledge of Community Projects by the Lodges ............... 56
Respondents’ Observation of Community Changes since the Construction of the Lodges
.......................................................................................................................................... 57
Respondents’ Observation of Positive Changes since the Construction of the Lodges ... 58
Respondents’ Observation of Negative Community Changes since the Construction of
the Lodges......................................................................................................................... 58
Respondents’ Responses to the Lodges’ Contribution to Poverty Reduction .................. 59
Lodge Area ........................................................................................................................... 60
Respondents’ Responses to Whether any of their Family Member is Employed in
Tourism or Conservation-Related Business ..................................................................... 60
Respondents’ Responses to Sector Providing the Most Jobs ........................................... 61
Respondents’ Responses to the Sector Providing Most Community Benefits ................. 62
Source/Place of Collection of Plants/Wood by Respondents ........................................... 62
Respondents’ Responses to Importance of Conservation of Plants/Animals ................... 63
Respondents’ Responses to Human Wildlife Conflicts .................................................... 64
Respondents’ Responses to the State of Human Wildlife Conflicts and Wildlife
Population ......................................................................................................................... 65

x
Results from the Semi-Structured Interviews ...................................................................... 66
Manager -Staff Relations .................................................................................................. 66
Employment of Staff ........................................................................................................ 66
Establishment of the Community Trusts .......................................................................... 67
Communication between Partners .................................................................................... 67
Opportunities for the Community ..................................................................................... 68
DISCUSSION .......................................................................................................................... 68
Socio-economic Impacts ...................................................................................................... 69
Lodge Area ........................................................................................................................... 71
Tourism and Conservation Attitudes ................................................................................... 72
CONCLUSION ........................................................................................................................ 74
RECOMMENDATIONS ......................................................................................................... 75
Proposed Methodologies for Future Assessment of Socio-Economic Impacts of
Conservation Enterprises...................................................................................................... 77
REFERENCES ........................................................................................................................ 80
APPENDICES ......................................................................................................................... 82
APPENDICES
Appendix 1 Questionnaires.................................................................................................... 82
Appendix 2 Proportion of Average Annual Income from Various Sources (US $) ............ 108
Appendix 3 Average Monthly Expenditure Patterns of Respondents ................................. 108
Appendix 4 Respondents’ Responses to the Type of Animals Involved in Human
Wildlife Conflicts............................................................................................. 109
Appendix 5 Recommended survey for future AWF research ............................................... 110

xi
LIST OF FIGURES
Figure 1 Marital Status of Respondents ............................................................................... 23
Figure 2 Health Status of Respondents ................................................................................ 25
Figure 3 Access to Electricity in Respondents’ Homes ....................................................... 26
Figure 4 Access to Running Water inside Respondents Homes .......................................... 28
Figure 5 Type of Toilet Facility Used by Respondents ....................................................... 30
Figure 6 Highest Level of Education of Respondents ......................................................... 31
Figure 7 Further Education of Respondents ........................................................................ 34
Figure 8 Skills Training of Respondents.............................................................................. 35
Figure 9 Current Positions of Staff Respondents ................................................................. 38
Figure 10 Work Place Benefits for Staff Respondents .......................................................... 39
Figure 11 Training Type Provided to Staff Respondents by Employers ............................... 40
Figure 12 Number of Income Sources of Respondents ......................................................... 41
Figure 13 Saving Culture of Respondents ............................................................................. 45
Figure 14 Respondents’ Ownership of Assets ....................................................................... 46
Figure 15 Community Respondents Knowledge of the Lodges, and the Link between the
Lodges and the Community Trust ......................................................................... 48
Figure 16 Respondents’ Responses to the Lodges Contribution to Job Creation .................. 49
Figure 17 Community Respondents’ Responses to the Lodges’ Contribution to Tourist
Attraction ............................................................................................................... 50
Figure 18 Community Respondents’ Responses to the Lodges’ Contribution to
Conservation of Plants and Animals...................................................................... 51
Figure 19 Community Respondents’ Responses to the Lodges’ Support to Local
Communities .......................................................................................................... 52
Figure 20 Community Respondents’ Responses to Whether the Lodges Could Do More .. 53
Figure 21 Staff Respondents’ Responses to the Lodges’ Contribution to Personal Growth
and Empowerment ................................................................................................. 54
Figure 22 Staff Respondents’ Responses to Job Satisfaction with the Lodges ..................... 55
Figure 23 Respondents’ Observation of Community Changes since the Construction of the
Lodges.................................................................................................................... 57
Figure 24 Respondents’ Responses to Whether Any of their Family Member is Employed
in Tourism or Conservation-Related Business ...................................................... 60
Figure 25 Respondents’ Responses to Human Wildlife Conflicts ......................................... 64
xii
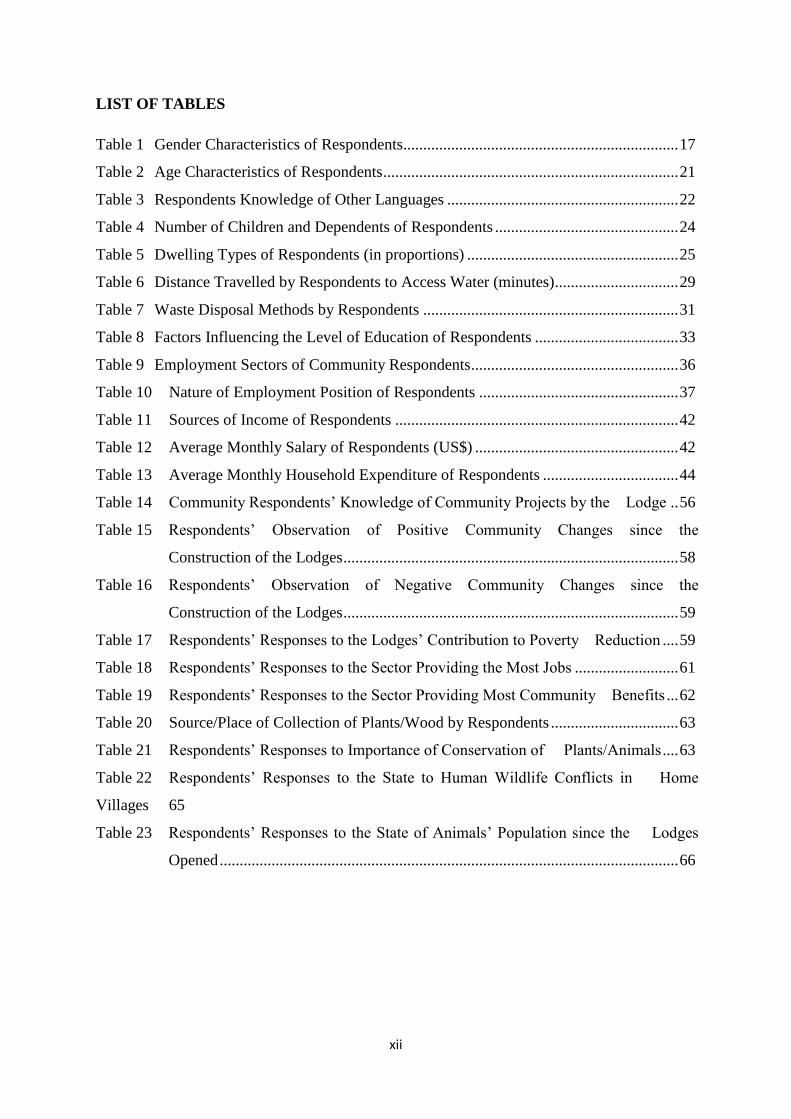
LIST OF TABLES
Table 1 Gender Characteristics of Respondents..................................................................... 17
Table 2 Age Characteristics of Respondents .......................................................................... 21
Table 3 Respondents Knowledge of Other Languages .......................................................... 22
Table 4 Number of Children and Dependents of Respondents .............................................. 24
Table 5 Dwelling Types of Respondents (in proportions) ..................................................... 25
Table 6 Distance Travelled by Respondents to Access Water (minutes)............................... 29
Table 7 Waste Disposal Methods by Respondents ................................................................ 31
Table 8 Factors Influencing the Level of Education of Respondents .................................... 33
Table 9 Employment Sectors of Community Respondents.................................................... 36
Table 10 Nature of Employment Position of Respondents .................................................. 37
Table 11 Sources of Income of Respondents ....................................................................... 42
Table 12 Average Monthly Salary of Respondents (US$) ................................................... 42
Table 13 Average Monthly Household Expenditure of Respondents .................................. 44
Table 14 Community Respondents’ Knowledge of Community Projects by the Lodge .. 56
Table 15 Respondents’ Observation of Positive Community Changes since the
Construction of the Lodges .................................................................................... 58
Table 16 Respondents’ Observation of Negative Community Changes since the
Construction of the Lodges .................................................................................... 59
Table 17 Respondents’ Responses to the Lodges’ Contribution to Poverty Reduction .... 59
Table 18 Respondents’ Responses to the Sector Providing the Most Jobs .......................... 61
Table 19 Respondents’ Responses to the Sector Providing Most Community Benefits ... 62
Table 20 Source/Place of Collection of Plants/Wood by Respondents ................................ 63
Table 21 Respondents’ Responses to Importance of Conservation of Plants/Animals .... 63
Table 22 Respondents’ Responses to the State to Human Wildlife Conflicts in Home
Villages 65
Table 23 Respondents’ Responses to the State of Animals’ Population since the Lodges
Opened ................................................................................................................... 66
13
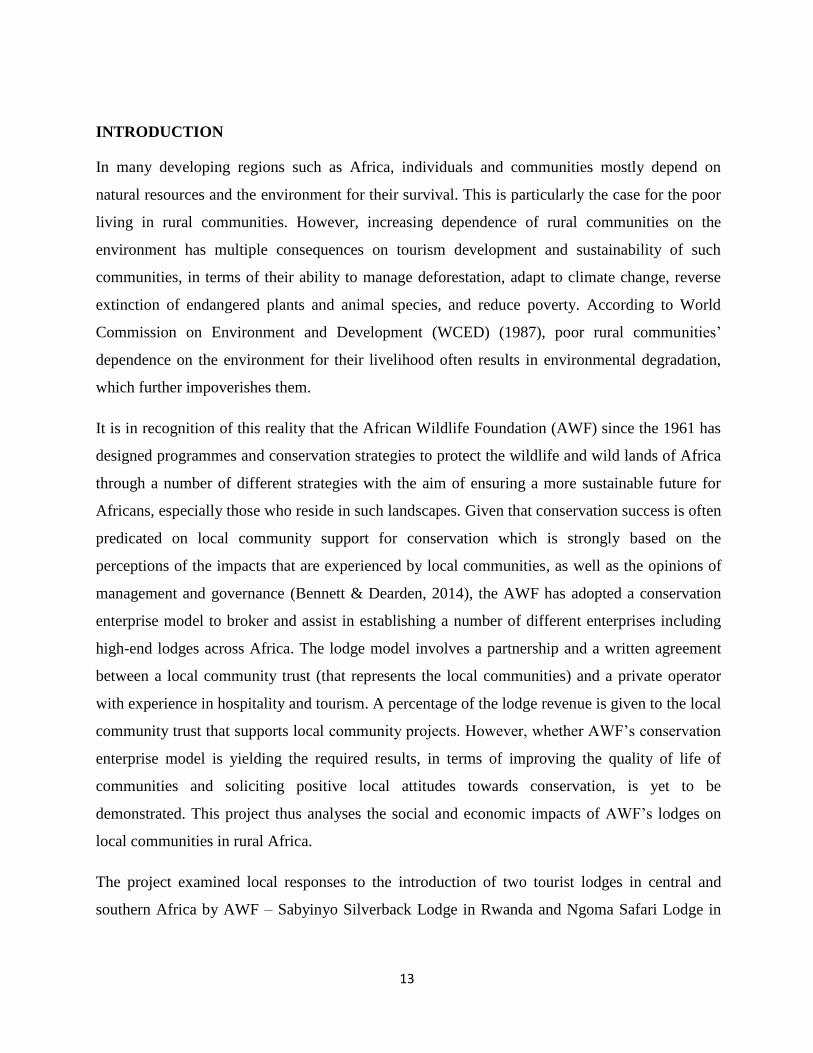
INTRODUCTION
In many developing regions such as Africa, individuals and communities mostly depend on
natural resources and the environment for their survival. This is particularly the case for the poor
living in rural communities. However, increasing dependence of rural communities on the
environment has multiple consequences on tourism development and sustainability of such
communities, in terms of their ability to manage deforestation, adapt to climate change, reverse
extinction of endangered plants and animal species, and reduce poverty. According to World
Commission on Environment and Development (WCED) (1987), poor rural communities’
dependence on the environment for their livelihood often results in environmental degradation,
which further impoverishes them.
It is in recognition of this reality that the African Wildlife Foundation (AWF) since the 1961 has
designed programmes and conservation strategies to protect the wildlife and wild lands of Africa
through a number of different strategies with the aim of ensuring a more sustainable future for
Africans, especially those who reside in such landscapes. Given that conservation success is often
predicated on local community support for conservation which is strongly based on the
perceptions of the impacts that are experienced by local communities, as well as the opinions of
management and governance (Bennett & Dearden, 2014), the AWF has adopted a conservation
enterprise model to broker and assist in establishing a number of different enterprises including
high-end lodges across Africa. The lodge model involves a partnership and a written agreement
between a local community trust (that represents the local communities) and a private operator
with experience in hospitality and tourism. A percentage of the lodge revenue is given to the local
community trust that supports local community projects. However, whether AWF’s conservation
enterprise model is yielding the required results, in terms of improving the quality of life of
communities and soliciting positive local attitudes towards conservation, is yet to be
demonstrated. This project thus analyses the social and economic impacts of AWF’s lodges on
local communities in rural Africa.
The project examined local responses to the introduction of two tourist lodges in central and
southern Africa by AWF – Sabyinyo Silverback Lodge in Rwanda and Ngoma Safari Lodge in

14
Botswana – in terms of social and economic impacts and attitudes towards conservation. The
specific objectives of the project were:
1. To investigate the social and economic impacts of the lodges on non-staff local residents;
2. To examine the social and economic impacts of the lodges on local lodge staff;
3. To compare the social and economic impacts of the lodges on staff and non-staff local
residents, and between the two countries; and
4. To assess the influence of the social and economic impacts of the lodges on local attitudes
towards conservation.
BACKGROUND
Since the early 1990s conservation organisations have been exploring a range of different
strategies to protect wildlife on private and communal land (Van der Duim, 2011). One strategy
is the development of high-end tourist lodges in biodiversity-rich areas. Since the late 1990s the
AWF has been providing advisory services to private sector parties and local communities to
develop conservation enterprises that include lodges, tented camps, and cultural villages (Elliot &
Sumba, 2010). This approach aims to incentivize landowners outside national parks to protect
wildlife and improve their livelihoods (Van Wijk, et al., 2014).
High-end tourism in particular ecotourism enterprises frequently claim to offer an efficient,
effective and sustainable option that shares the benefits of tourism with local communities
including employment, skills development, and improved social welfare (Mitchell & Ashley,
2010; Spenceley, 2008). These enterprises also claim to promote an appreciation of conservation
of natural resources among local communities (Kiss, 2004). Recent research (Snyman, 2012,
2013) has tested the efficacy of these claims of high-end tourism operations managed by one
private operator in South African countries including Namibia, Malawi and Botswana.
Acknowledging the effectiveness of high-end ecotourism enterprises with sole proprietorship,
this study examines a different joint venture model between a private tourism operator and the
local community.
The study explores the social and economic impacts on local communities of two high-end
lodges that AWF helped establish in Rwanda and Botswana. Revenue and community fees from

15
the lodges are managed by community trusts that facilitate socio-economic and conservation
initiatives in the communities near the lodges and local national parks.
In the context of socio-economic development and physical characteristics, there exist wide
variations between Rwanda and Botswana. With a total population of nearly 12 million and total
land area of 26,338 square kilometres, Rwanda is a low income country with the highest
population density in Africa – 350 people per square kilometres (United Nations Development
Programme [UNDP], 2007). The political, social and economic life of Rwanda is considerably
influenced by the civil war and the genocide of 1990s, which the country continues to fight its
repercussions. The agricultural sector employs about 80% of the population with subsistence food
production as the dominant activity (UNDP, 2007). Despite the rapidly growing tourism sector,
its economic contribution is marginal. With about 83% rural population and over 50% of people
living below the poverty line, poverty in Rwanda is mainly a rural phenomenon (National
Institutes of Statistics Rwanda, 2006). Average annual income per person in Rwanda is about
US$ 1000. This background of devastation caused by the war, high population density, high
poverty levels and high rural population, impinges on the attitudes of Rwandans towards land
ownership, environmental conservation and population issues. For example, an estimated 50.2%
of Rwandan’s forest cover was lost between 1990 and 2005 (UNDP, 2007).
In contrast, Botswana is a middle-income country with perhaps the most stable political
environment in Africa, has a total population of about 2.04 million (African Development Bank
[AfDB], 2009). The country occupies a total land area of 582,000 square kilometres with a
population density of 4 people per square kilometres and rural population of below 30% (AfDB,
2009). Botswana is the largest producer of diamonds in the world by value and volume, with
close to US$ 5000 as the average annual income per person. However, this figure may not
represent a true reflection of the situation in Botswana as there is large inequality gap between
those employed in the mining sector and those in the other sectors including agriculture
(Maipose, 2008). As a result, although only 18% of Botswana, mostly rural residents live below
the poverty line, deprivation and inequality seem entrenched (AfDB, 2009; Maipose, 2008). Over
34% of Botswana’s land area is protected in national parks, game reserves and wildlife
management areas. However, less than 5% of the total land area is cultivatable due to harsh arid
climatic conditions with inadequate rainfall, a situation which has constrained the potential of the

16
agriculture sector for employment creation and poverty reduction particularly in the rural
communities (Maipose, 2008).
The different economic and socio-politico contexts of the two countries create a complex
background for comparison purposes, especially on issues relating to economic impacts (such as
income) from high-end tourism lodges. Thus, caution is necessary in making inter-country
comparison of economic benefits from high-end tourism lodges. On the other hand, these
different contexts provide an opportunity to appreciate various perspectives and different
geopolitical locales in relation to local attitudes towards the high-end tourism lodges and
conservation in Africa.
METHODS
This study draws from both primary and secondary data sources. The secondary data sources
were based on reviews of recent conservation, tourism and local development literature
particularly on Africa. This provided a framework to situate the activities of AWF within a broad
context of environmental conservation and tourism development in poor rural communities. In
addition, the primary data sources were based on rural communities within the catchment area of
the Sabyinyo Community Trust Lodge Association (SACOLA) in Rwanda and the Chobe
Enclave Conservation Trust (CECT) in Botswana both located near Sabyinyo Silverback Lodge
and Ngoma Safari Lodge respectively and within the vicinity of local conservation areas. The
study focused on both staff working in the two lodges and residents within the community trust
areas. Nine semi-structured interviews were also conducted with a number of stakeholders
including community trust representatives, lodge operators and managers. Notes were taken by
the researcher during the meetings. In accordance with CSU Human Ethics Committee
requirements all survey and interview respondents were given an Information Statement
describing the research project and their involvement and were asked to sign a Consent Form.
Survey Sampling
Only lodge staff that lived in the community trust area were selected for surveying. If they did
not live in the area they were not surveyed. Given the relatively small numbers of local
employees in the lodges the researcher aimed to survey all the local staff in each lodge. In the
17
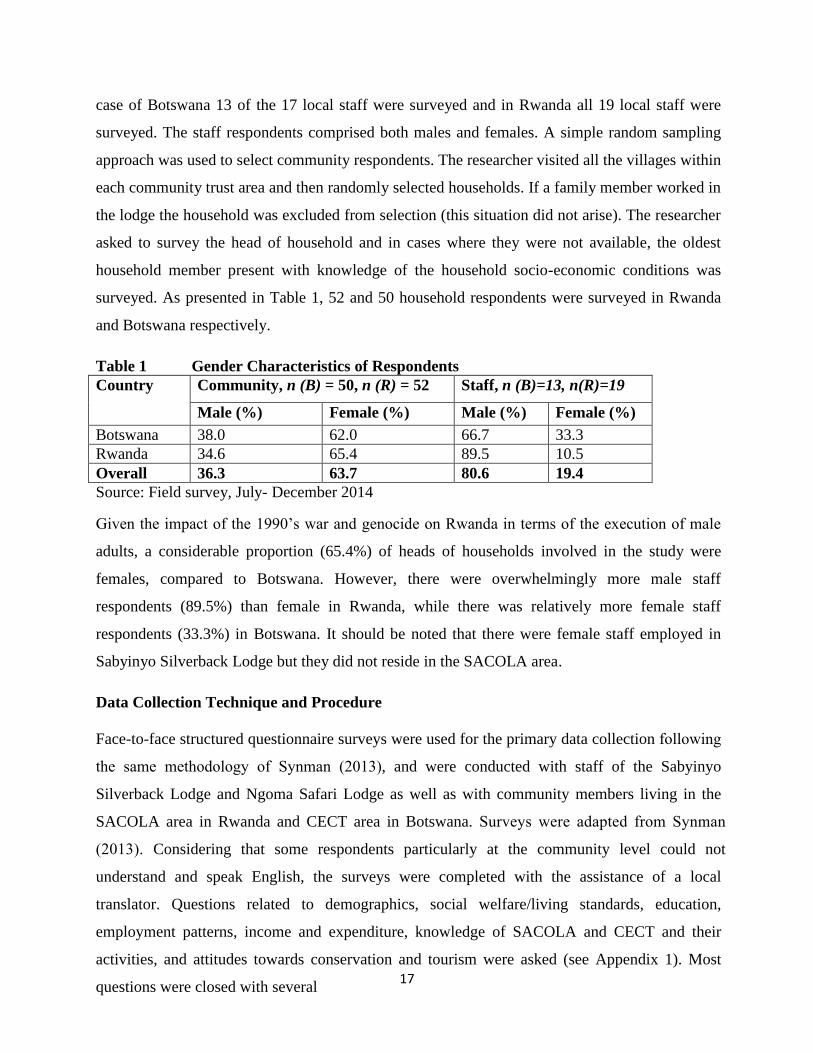
case of Botswana 13 of the 17 local staff were surveyed and in Rwanda all 19 local staff were
surveyed. The staff respondents comprised both males and females. A simple random sampling
approach was used to select community respondents. The researcher visited all the villages within
each community trust area and then randomly selected households. If a family member worked in
the lodge the household was excluded from selection (this situation did not arise). The researcher
asked to survey the head of household and in cases where they were not available, the oldest
household member present with knowledge of the household socio-economic conditions was
surveyed. As presented in Table 1, 52 and 50 household respondents were surveyed in Rwanda
and Botswana respectively.
Table 1 Gender Characteristics of Respondents
Country Community, n (B) = 50, n (R) = 52 Staff, n (B)=13, n(R)=19
Male (%) Female (%) Male (%) Female (%)
Botswana 38.0 62.0 66.7 33.3
Rwanda 34.6 65.4 89.5 10.5
Overall 36.3 63.7 80.6 19.4
Source: Field survey, July- December 2014
Given the impact of the 1990’s war and genocide on Rwanda in terms of the execution of male
adults, a considerable proportion (65.4%) of heads of households involved in the study were
females, compared to Botswana. However, there were overwhelmingly more male staff
respondents (89.5%) than female in Rwanda, while there was relatively more female staff
respondents (33.3%) in Botswana. It should be noted that there were female staff employed in
Sabyinyo Silverback Lodge but they did not reside in the SACOLA area.
Data Collection Technique and Procedure
Face-to-face structured questionnaire surveys were used for the primary data collection following
the same methodology of Synman (2013), and were conducted with staff of the Sabyinyo
Silverback Lodge and Ngoma Safari Lodge as well as with community members living in the
SACOLA area in Rwanda and CECT area in Botswana. Surveys were adapted from Synman
(2013). Considering that some respondents particularly at the community level could not
understand and speak English, the surveys were completed with the assistance of a local
translator. Questions related to demographics, social welfare/living standards, education,
employment patterns, income and expenditure, knowledge of SACOLA and CECT and their
activities, and attitudes towards conservation and tourism were asked (see Appendix 1). Most
questions were closed with several
18
open-ended questions on participant’s attitudes and views. Both quantitative and qualitative data
were collected. Responses to the survey questions were written by the researcher with each
survey lasting between 30-40 minutes. The data collection occurred on week and weekend days
and between the hours of approximately 8 am and 5pm and was conducted from July to
December 2014.
Data Analysis
Responses from the face-to-face structured questionnaire surveys were analysed using the
Statistical Package for the Social Sciences (SPSS) database. The SPSS was useful in generating
descriptive statistics such as frequencies, averages and percentages, and further facilitated the
production of graphs and charts. The database also provided a basis for comparing and
establishing relationships between the staff respondents and the community respondents both
within and across the two countries, in relation to impacts of tourism and attitudes towards
conservation. The qualitative data from the semi-structured interviews were manually analysed
for common themes and topics.
Ethics Consideration
Ethics approval was gained for this project through the Charles Sturt University Human Ethics
Committee. Prior to the commencement of the primary data collection, all respondents, both staff
and local community residents, were informed about the project, provided with an information
statement and requested to complete the informed consent form. Research permits were gained
from the Government of Botswana and the Government of Rwanda. The translators were
required to sign Confidentiality Agreements for all survey work.
Limitations
The major limitations of this study were resource and time constraints, which limited the scope of
the study. Although the catchment areas of the community trusts are extensive consisting of many
small villages, only 50 households from each of the areas across the two countries were selected
for surveying. While the number of respondents may not be representative enough, the use of
random sampling method ensured that each community within the catchment areas of the
community trusts had respondents. This process ensured a high degree of representativeness of
responses.

19
Another limitation related to the timing of the community survey questionnaire administration.
The surveys were conducted in the communities between the hours of approximately 8 am and
5.00 pm that may have coincided with the time heads of households were working. As a result,
the survey may have excluded some heads of households who worked outside the home.
However, the selection and involvement of oldest household members in the study, in cases
where heads of households were unavailable ensured the collection of adequate household data.
Case Study Descriptions
Ngoma Safari Lodge, Botswana
The lodge is located about 55 kilometres from Kasane in the north of Botswana in the Chobe
Forest Reserve bordering the western edge of the Chobe National Park. The lodge was set up in
2011. An agreement was signed between the lodge operators Ngoma Management Company and
the Chobe Enclave Conservation Trust (CECT). CECT is an organisation of residents of the
Chobe Enclave comprising of five villages. CECT’s mandate is laid out in its constitution and
reflects the broad mandate of community based natural resource management (CBNRM). CECT
aims to promote the socio-economic interests of the Chobe Enclave communities and to
conserving the surrounding environment. Each village elects a Village Trust Committee that
serves for two years. Each Village Trust selects two of its members to sit on the CECT Board.
Decisions are made for CECT by the members sitting in Annual General Meetings and General
Meetings. The Village Trusts and the Board carry out the mandate given to them by the kgotlas
and General Meetings. The Board manages relations with the district Technical Advisory
Committee, Department of Wildlife and National Parks and the joint venture partner (Ngoma
Management P/L). The Board receives payments from the joint venture partner and initially
divided 85% of the revenue equally between the five villages. This figure was reduced to 65% by
the Board who use the remaining 35% of the revenue for board administrative costs
(AWF/USAID, 2003). According to the AWF/USAID report (2003) this system recognises and
reinforces the villages and avoids creating an artificial Chobe Enclave wide institution. The
prominence of the Village Trusts in the re-circulation of CECT revenue and the relatively limited
role of the CECT Board are important institutional features of CECT. The revenue is used by the
Village Trusts for community and environmental benefits. The population of the CECT area is
approximately 4,300 and the area is approximately 1.8 square kilometres (177,051 hectares).

20
Sabyinyo Silverback Lodge, Rwanda
Sabyinyo Silverback Lodge is located about 10 kilometres from Kinigi in the north west of
Rwanda. Sabyinyo Community Livelihoods Association (SACOLA) was established in 2004 and
the lodge was opened in 2007 and an agreement was signed between the lodge operators
Governors Camp and SACOLA. The objectives of SACOLA are conservation of the natural
resources in Volcanoes National Park and to improve the livelihood of the population
surrounding the park. SACOLA has 65 elected community members representing all the villages
and has an Executive Committee of nine members (volunteers) that administers and distributes
the lodge revenue for the benefit of the environment and local community. There is a Liaison
Committee that has the SACOLA Executive members, Director of Governors Camp, Manager of
the lodge, RDB, IGCP, local government and national park representatives. They have supported
and funded many projects including housing for low income families and genocide victims, iron
roofing, cows and chickens to families, constructed a cultural centre, purchased computers for
local schools, constructed water tanks. The population of the SACOLA area (Kinigi and Nyange
sectors) is approximately 55,000. The area of SACOLA is approximately 98 square kilometres.
RESULTS
Demographic Characteristics
Age Characteristics of Respondents
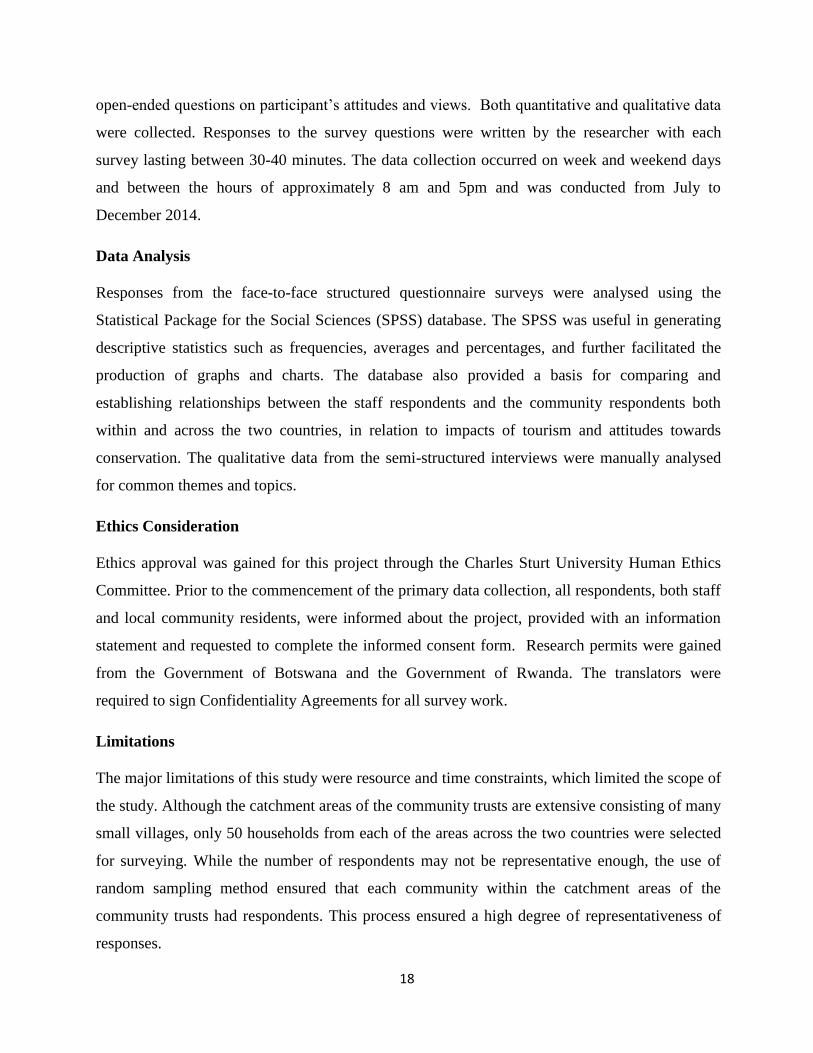
Table 2 below summarises the results of the age characteristics of the respondents. While the
overall average age of the staff respondents was about 29 years, the community respondents had
an overall average age of 47 years. The differential in average ages was a result of the age range
categories involved in the survey. For example, the age range for the community was 20-80 years
compared to 19-39 of the staff respondents. As a result the extent of deviation from the average
age was higher among the community respondents than the staff respondents (see Table 2).
21
Table 2 Age Characteristics of Respondents
Country Average Age (years) Minimum-Maximum Age Standard Dev. of Age
Community Staff Community Staff Community Staff
Botswana 51.60 28.3 20-80 19-36 18.17 4.95
Rwanda 43.32 29.7 20-73 24-39 14.83 3.88
Overall 47.38 29.2 20-80 19-39 16.98 4.33
p value <0.001 0.073
Source: Field survey, July-December 2014. p = significance
Across the two countries, there was no significant difference between the average ages of the
staff, with many of them within their 20s (p = 0.073). On the other hand, there was a statistical
significant difference between the community respondents’ ages (p < 0.001). The majority of the
community respondents in Botswana (58%) were aged 50 years and above compared to 39 years
and above in Rwanda (73%). However, both countries had few community respondents below the
age of 30 (B = 18%, R = 21%). While the statistical testing is perhaps unnecessary for the age
characteristics of respondents, it does highlight the level of involvement of young people in the
lodges’ activities.
Respondents’ Knowledge of Languages
The survey findings showed that, in Botswana, there were two home languages of the
respondents namely the Subea and Setswana. At the community level, 86% of the respondents
reported Subea as their home language while the remaining 14% mentioned Setswana as their
home language. At the same time, 92.3% of staff respondents in Botswana mentioned Subea as
their home language with the remaining mentioning Setswana. In Rwanda, all respondents both
community and staff reported Kinyarwanda as their home language. However, there was
diversity in terms of respondents’ ability to read and write their home languages. While 72% and
70% of community respondents in Botswana could read and write their home languages
respectively, about 63.5% and 55.8% respectively could do same in Rwanda. Among the staff
respondents across the two countries, however, all of them could read and write their home
languages.
In addition, the respondents were asked to demonstrate their knowledge of other languages. In
Botswana, those who reported Subea as their home language also had knowledge of Setswana

22
and vice versa. As a result, the 48% of Botswana community respondents who reported Setswana
as their home language could speak Subea and English languages, with which 30% could read
and write. On the other hand, 46% of the 52% of those who mentioned Subea as the home
language could speak Setswana and English languages, with which 25% could read and write.
The remaining 6% of those who reported Subea as the home language could also speak, read and
write Losi. As presented in Table 3, unlike the community respondents, all Botswana staff who
mentioned Subea as the home language could speak, read and write Setswana and English
languages, while those who had Setswana as the home language could also speak, read and write
Subea and English languages.
Table 3 Respondents Knowledge of Other Languages
Country Other Languages Community, n (B) = 50, n
(R) = 52 (%)
Staff, n (B)=13, n(R)=19
(%)
Speak Read Write Speak Read Write
Botswana
English/Subea 48.0 30.0 30.0 7.7 7.7 7.7
Losi 6.0 6.0 6.0 0.0 0.0 0.0
English/Setswana 46.0 26.0 26.0 92.3 92.3 92.3
Rwanda
English 59.6 5.8 5.8 36.8 31.6 31.6
French 40.4 3.8 3.8 5.3 5.3 5.3
English/French 0.0 0.0 0.0 57.9 47.4 47.4
Source: Field survey, July-December 2014
The situation was different in Rwanda where all respondents had Kinyarwanda as their home
language. However, the majority of Rwandan staff respondents (57.9%) could speak two other
languages – English and French – with nearly 50% able to read and write them (see Table 3). The
remaining staff respondents could speak, read and write either English or French. It is evident
from Table 3 that none of the Rwandan community respondents could speak, read and write both
French and English languages, although many of them could speak either English or French.
Thus, in terms of languages, the staff respondents were relatively more knowledgeable compared
to the community respondents across the two countries.
Marital Status of Respondents
The survey findings indicated that, across and within the two countries, there are sharp
differences between respondents marital status. For example in Rwanda, the majority of the
community respondents (82.7%) were married compared to few (36%) in Botswana. In addition,

23
the majority of the staff respondents in Rwanda (73.7) were married while none of the Botswana
staff respondent was married (see Figure 1). At the same time, 61.5% and 26.3% of staff
respondents in Botswana and Rwanda respectively were single.
Figure 1 Marital Status of Respondents
Source: Based on Field Survey Data, July-December 2014.
Although the relatively high proportion of single staff respondents could perhaps be linked to the
age characteristics of the respondents (see Table 2), the situation was also pronounced amongst
Botswana community respondents. As illustrated in Figure 1, about 28% of Botswana community
respondents were single with 14% involved in long term relationship, compared to 3.9% and 0%
respectively in Rwanda. With the relatively young age of the staff respondents, the survey
findings indicated that none was a widow/er, but 20% and 9.6% of community respondents in
Botswana and Rwanda respectively were widow/er(s).
Number of Children and Dependents of Respondents
Given that marital status, to a large extent, determines the number of children and dependents of
respondents, this section presents findings on the dependency burden of respondents. Across the
two countries, community respondents had more children compared to staff respondents. Table 4
indicates that average number of children of community respondents in Botswana was 3.5 and 4
in Rwanda compared to staff respondents in Botswana (1.1) and Rwanda (1.4). The low average
0
10
20
30
40
50
60
70
80
90
Botswana
Community
Botstwana Staff Rwanda
Community
Rwanda Staff
Pro
po
rtio
n o
f R
esp
on
den
ts
Category of Respondents
Divorced
Long term
relationship
Married
Single
Legend

24
number of children among staff respondents is possibly due to their relatively younger age
coupled with their mostly single marital status.
Table 4 Number of Children and Dependents of Respondents
Country Average Number
of Children
Min-Max
Number
Average Number
of Dependents
Min-Max
Dependents
Comm Staff Comm Staff Comm Staff Comm Staff
Botswana 3.5 1.1 0-9 0-4 4.3 4.6 0-11 0-13
Rwanda 4.0 1.4 0-9 0-5 4.4 3.3 1-10 0-6
Overall 3.7 1.3 0-9 0-5 4.4 3.8 0-11 0-13
Source: Field survey, July-December 2014
Despite the relatively low average number of children of staff respondents in the two countries,
there was high dependency ratio (1 staff: 3.8 dependents) among all the staff. In Botswana, the
average number of staff respondents’ dependents exceeded that of the community respondents.
The reverse was true in Rwanda despite an average number of staff dependents of 3.3 (see Table
4). The high dependency ratio among staff respondents could perhaps be attributed to the
certainty of employment and regular source of income from the lodges, which had positioned
them to support other family/household members.
Dwelling Types of Respondents
In rural Africa, housing remains one of the important indicators of wellbeing and standard of
living of people. The survey findings show that there existed considerable differences between
the two countries, and between staff and community respondents in relation to housing types. As
shown in Table 5, the majority of Botswana community (82%) and staff (76.9%) respondents had
brick dwelling with iron/asbestos roof compared with only 13.5% and 0% of Rwandan
community and staff respondents respectively. In addition, whereas the majority of Rwandan
community (73.1%) and staff (73.7%) had traditional dwelling with iron/asbestos roof, none of
the Botswana respondents lived in such dwelling. This reflects the relatively higher standard of
living in Botswana compared to Rwanda.
Interestingly, comparisons within countries further showed that community respondents were
better placed in terms of housing types than staff respondents. For instance, whilst few
community respondents in Botswana (2%) had brick dwelling with thatch roof, about 15% of the

25
staff used the same dwelling type. Also in Rwanda, about 13.5% of community respondents used
brick dwelling with iron/asbestos roof, whilst none of the staff had such dwelling type.
Table 5 Dwelling Types of Respondents (in proportions)
Dwelling Type Botswana, n (C)
= 50, n (S)=13
Rwanda, n(C) =
52, n(S)=19
Overall (%)
Comm Staff Comm Staff Comm Staff
Brick dwelling with iron/asbestos
roof
82.0 76.9 13.5 0.0 47.1 31.3
Brick dwelling with thatch roof 2.0 15.4 0.0 0.0 1.0 6.3
Brick dwelling with tiled roof 0.0 0.0 1.9 15.8 1.0 9.4
Traditional dwelling with thatch roof 16.0 7.7 1.9 5.3 8.8 6.3
Traditional dwelling with
iron/asbestos roof
0.0 0.0 73.1 73.7 37.3 43.8
Others (e.g., Cement with iron roof,
traditional dwelling with tiles )
0.0 0.0 9.6 5.3 4.9 3.3
Source: Field survey, July-December 2014
Health Status of Respondents
Across the two countries, both community and staff respondents reported average health
conditions with few indicating poor health. As shown in Figure 2, Botswana community
respondents reported excellent (6%), good (22%), average (58%) and poor (14%) health while
the staff reported excellent (38.5%), good (30.8%) and average (15.4%) health, with 15.4%
indicating that they did not know their health conditions.
Figure 2 Health Status of Respondents
Source: Based on Field Survey Data, July-December 2014.
0
10
20
30
40
50
60
Botswana
Community
Botswana Staff Rwanda
Community
Rwanda Staff
Pro
po
rtio
n o
f R
esp
on
den
ts
Category of Respondents
Excellent
Good
Average

26
Comparatively, it appeared that, in Botswana, more staff respondents had excellent and good
health conditions compared to community respondents. Similarly, staff respondents in Rwanda
reported excellent (21.1%), good (36.8%) and average (42.1%) health status, whereas the
community respondents reported excellent (5.8%), good (30.8%), average (42.1%) and poor
(19.3%) health conditions. Mirroring the situation in Botswana, it thus appeared that staff
respondents had better health conditions than community respondents in Rwanda.
Energy, Water and Sanitation Conditions
Energy for Lighting and Cooking by Respondents
As summarised in Figure 3, the majority of all community respondents (54.9%) across the two
countries did not have access to grid electricity (utility provided electricity) in their homes.
Access to grid electricity was particularly a challenge for Rwandan community respondents
where only 26.9% had access in their homes, compared to 64% in Botswana.
Figure 3 Access to Grid Electricity in Respondents’ Homes
Source: Based on Field Survey Data, July-December 2014.
Although in many cases it would not be untrue to link the marked disparity in community’s
access to grid electricity to the differential socio-economic development status of the two
countries, the survey findings indicated that the situation was different among the staff
0
10
20
30
40
50
60
70
80
90
Botswana Rwanda Overall
%
of
Res
po
nd
ents
wit
h a
cces
s
Countries
Community
Staff

27
respondents. For instance, about 84.2% and 76.9% of staff respondents in Rwanda and Botswana
respectively had access to grid electricity in their homes. In this case the comparative advantage
of Botswana over Rwanda in terms of socio-economic development could not be the only factor
influencing access to grid electricity, but instead, the socio-economic standings of the
respondents. For example, despite the limited community respondents’ access to grid electricity
in Rwanda, the staff respondents had close to complete access (84.2%) which might be due to the
benefits the lodges provided them in relation to employment and income which made it possible
for them to access grid electricity in their homes.
Responses to energy sources for lighting showed that community respondents in Botswana
largely used paraffin (16%), candles (10%), solar (4%), torch (4%) and battery lamp (2%) in
addition to electricity (64%) as lighting energy sources. Those in Rwanda used candles (36.5%),
torch (26.9%), paraffin (7.7%), and firewood (1.9%) in addition to grid electricity (26.9%).
Different attitudes regarding lighting energy sources were observed among the staff respondents,
who mostly used grid electricity and candles. For example in Rwanda, the staff used candles
(15.8%) in addition to grid electricity (84.2%), while those in Botswana used paraffin (15.4%)
and candles (7.7%) in addition to grid electricity (76.9%).
Similarly, findings on the energy source used for cooking showed that the majority of community
and staff respondents used firewood. In Botswana, 76% of community respondents used
firewood, 12% used gas and 12% used electricity. The staff used firewood (50%), charcoal
(18.8%), gas (16.2%), and electricity (5%). The situation was similar in Rwanda where 96.2% of
the community respondents used firewood with the remaining 3.6% using charcoal, while the
staff used firewood (62.8%), charcoal (21.2%), gas (12%), and electricity (4%). However, with
over 86% of all community respondents and 56% of all staff respondents across the countries
using firewood for cooking, efforts towards environmental conservation are important and urgent.
Sources of Potable Water Used by Respondents
The survey findings revealed that lack of access to running water inside respondents’ homes was
widespread in Rwanda compared to Botswana. Figure 4 shows that none of the community
respondents’ in Rwanda had access to running water inside their homes compared to 16% of
Botswana community respondents.

28
Figure 4 Access to Running Water inside Respondents Homes
Source: Based on Field Survey Data, July-December 2014.
However, there was a relative improvement among the staff respondents regarding access to
running water in their homes. For example, about 39.5% and 21.1% of Botswana and Rwandan
staff respondents respectively had access to running water in their homes. This situation is a
reflection of the different overall socio-economic development levels of the two countries. Thus,
staff respondents particularly in Botswana were relatively well-off in terms of access to running
water in their homes.
Unfortunately, none of the community respondents in Rwanda has running water in the home.
Given the limited access to running water inside respondents’ homes, respondents were asked to
identify their sources of potable water. Many community respondents in Rwanda (75%)
depended on public tap, 9.6% on outside/private tap, 5.8% on dam/lake, 3.9% on borehole, 3.9%
on well and 1.9% on river as their sources of potable water. In Botswana, most community
respondents (88.1%) depended on outside/private tap, and 11.9% on public tap as their potable
water sources. Among the staff respondents, the majority of those in Rwanda (66.7%) depended
on a public tap, and 26.7% on outside/private tap, while the majority of those in Botswana
(87.5%) depended on an outside/private tap, and 12.5% on public tap.
0
5
10
15
20
25
30
35
40
Botswana Rwanda Overall
%
of
Res
po
nd
ents
wit
h a
cces
s
Countries
Community
Staff
29
Generally, some community respondents in Rwanda appeared to be relying on unwholesome
sources such as dam/lake, river and well as their potable water. However, the staff respondents
across the two countries, and the Botswana community respondents used potable water sources
(i.e. outside/tap water and public tap).
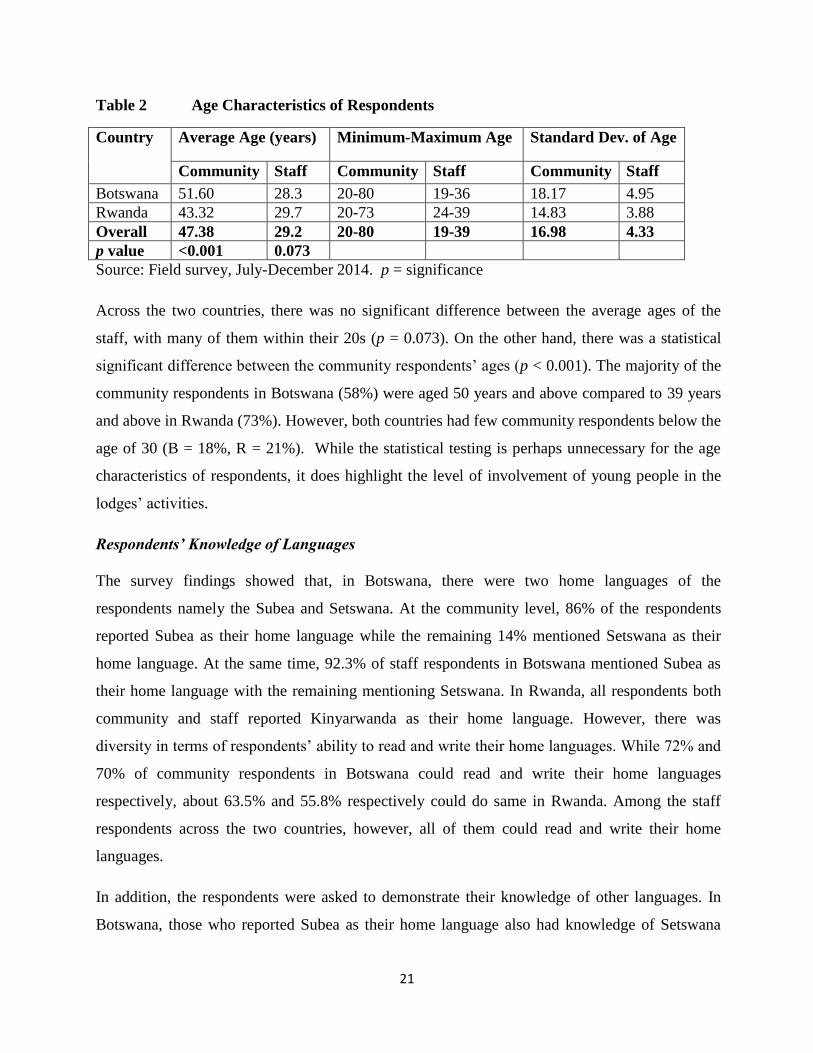
Distance Travelled by Respondents to Access Water (in minutes)
Access to private tap and outside tap did not require travel. Respondents who did not have such
facilities had to travel before they could access water. As presented in Table 6, there was no
considerable difference in terms of distance travelled by both staff and community respondents
who depended on public tap, river, well, dam/lake and borehole. Community respondents in
Botswana travelled, on average 13 minutes whilst the staff travelled 15 minutes to access water.
Rwandan community respondents travelled, on average 8.8 minutes while the staff travelled 7.6
minutes to access water. However, some community respondents in Botswana and Rwanda
travelled 30 minutes and 25 minutes respectively to access water.
Table 6 Distance Travelled by Respondents to Access Water (minutes)
Country Average Distance
(minutes)
Min-Max Minutes
Comm Staff Comm Staff
Botswana 13.0 15 2-30 15-15
Rwanda 8.8 7.6 0-25 0-15
Overall 9.1 8.3 0-30 0-30
Source: Field survey, July-December 2014
Type of Toilet Facility Used by Respondents
Across the two countries, pit latrines appeared to be the most common and most used toilet
facility. Figure 5 indicates that 98.1% and 72% of community respondents in Rwanda and
Botswana respectively used pit latrine toilet facility.

30
Figure 5 Type of Toilet Facility Used by Respondents
Source: Based on Field Survey Data, July-December 2014.
Similarly, 89.5% and 84.6% of staff respondents in Rwanda and Botswana respectively used pit
latrine. Only a few community respondents in Rwanda (1.9%) and Botswana (12%) used flush
toilet. In addition, 16% of community respondents in Botswana reported using the bush.
However, slightly more staff respondents in Rwanda (10.5%) and Botswana (15.4%) used flush
toilet compared to the community respondents.
Waste Disposal Methods Used by Respondents
The survey findings identified various types of waste disposal methods used by the respondents,
both safe (e.g., council collection), and unsafe (e.g., bush dumping) methods. Table 7 shows that
staff respondents especially in Botswana adopted a safer method of waste disposal (i.e. council)
compared to the community respondents. For instance, none of the staff respondents in the two
countries disposed off waste by burning, dumping or throwing into the bush. In addition, all and
89.5% of staff respondents in Botswana and Rwanda disposed of their waste through the council
and by burying respectively.
0
10
20
30
40
50
60
70
80
90
100
Botswana
Community
Botstwana Staff Rwanda
Community
Rwanda Staff
Pro
po
rtio
n o
f R
esp
on
den
ts
Category of Respondents
Pit latrine
Flush Toilet
Bush

31
Table 7 Waste Disposal Methods by Respondents
Waste Disposal Method Botswana, n (C) = 50,
n (S)=13
Rwanda, n(C) =
52, n(S)=19
Overall (%)
Comm Staff Comm Staff Comm Staff
Burn 2.0 0.0 0.0 0.0 1.0 0.0
Bush 0.0 0.0 1.9 0.0 1.0 0.0
Bury 2.0 0.0 92.3 89.5 48.0 53.1
Council 96.0 100.0 0.0 10.5 47.1 46.9
Dump 0.0 0.0 5.8 0.0 2.9 0.0
Source: Field survey, July-December 2014
Educational Characteristics of Respondents
Highest Level of Education of Respondents
Findings revealed that the respondents had attained various levels of education, but not all of
them completed their level of education. For example, some respondents indicated that they had
attained a secondary level education although they did not complete it. Thus, this section presents
findings on the highest level of education attained by the respondents, regardless of their
completion status. As shown in Figure 6, the majority (84%) of community respondents in
Botswana had senior secondary level education, 8% had junior secondary education, 4% had
primary education, and 4% had no education.
Figure 6 Highest Level of Education of Respondents
Source: Based on Field Survey Data, July-December 2014.
0
10
20
30
40
50
60
70
80
90
Botswana
Community
Botstwana Staff Rwanda
Community
Rwanda Staff
Pro
po
rtio
n o
f R
esp
on
den
ts
Category of Respondents
Primary
Junior
SecondarySenior
SecondaryVocational
Never
32
Unlike the situation in Botswana, different findings were reported in Rwanda by the community
respondents. Half (50.1%) of them had primary education, 38.5% had junior secondary
education, and 11.6% had senior secondary education. In addition, while all of Rwandan
community respondents had had some level of education, 4% of Botswana community
respondents had never been to school.
To some extent, all the staff respondents had some form of education, with many of them in
Botswana (46%) having senior secondary education, and 30.8% with vocational education
experience. Only 7.7% and 15.4% of Botswana staff respondents had primary and junior
secondary education. Rwandan staff, on the other hand, had only senior secondary (68.5%) and
junior secondary (31.5%) education. There were no staff respondents who had never been to
school or with primary level education. Given the level of education of the staff across the two
countries, it was therefore unsurprising that the staff had knowledge of other languages (see
Table 3).
Staff-community comparison in Botswana revealed that community respondents were better
placed in terms of education with the majority (84%) of them having secondary level education
and few with primary (4%) and junior secondary (8%) education. The situation among the
Botswana staff showed that there was a relatively even distribution of the level of education. It is
however worth emphasising that none of the community respondents in Botswana had vocational
level education, whereas 30.8% of the staff had, indicating that some of the staff had attained post
senior secondary education level. Similarly, the majority (68.5%) of the Rwandan staff
respondents had attained secondary level education compared to only 11% of the Rwandan
community respondents. Moreover, the majority (50.1%) of the Rwandan community
respondents had primary education. However, given that Rwandan education system does not
have vocational level education, none of the respondents in Rwanda indicated vocational level
education.
Factors Influencing the Level of Education of Respondents
As summarised in Table 8, the level of education attained by the respondents was influenced by a
number of factors. Across the two countries, financial problems were identified by the
respondents as a key factor which determined the level of education attained. For instance, 62.5%

33
and 27.5% of Botswana staff and community respondents respectively mentioned financial
constraints as the major influence on the level of education they could attained. Similar findings
were reported in Rwanda where 30% and 22% of staff and community respondents mentioned
financial problems.
Table 8 Factors Influencing the Level of Education of Respondents
Factors Botswana, n (C) =
40, n (S)=8
Rwanda, n(C) =
50, n(S)=10
Overall (%)
Comm Staff Comm Staff Comm Staff
Financial problems 27.5 62.5 22.0 30.0 24.4 44.4
Family responsibilities 0.0 0.0 18.0 20.0 10.0 11.1
Illness 2.5 0.0 4.0 10.0 3.3 5.6
Lack of parental support 7.5 0.0 20.0 20.0 14.4 11.1
Job 2.5 0.0 0.0 0.0 1.1 0.0
Personal decision 0.0 0.0 4.0 0.0 2.2 0.0
Marriage 20.0 0.0 2.0 0.0 10.0 0.0
Lack/ limited school capacity 7.5 0.0 6.0 0.0 5.5 0.0
War 0.0 0.0 8.0 20.0 4.4 11.1
Pregnant 2.5 0.0 0.0 0.0 1.1 0.0
Livestock carer 10.0 0.0 0.0 0.0 4.4 0.0
Failed 20.0 37.5 2.0 0.0 10.0 16.7
Don’t know 0.0 0.0 4.0 0.0 2.2 0.0
Source: Field survey, July-December 2014
In addition to financial constraints, failure and family responsibilities were the second most
important factors that influenced the level of education in Botswana and Rwanda respectively.
Another factor worth discussing particularly in Rwanda was the influence of the 1990s war and
genocide on education. With 20% of staff and 8% of community respondents mentioning the war,
it appeared that the 1990s war contributed to the relatively high proportion (50.1%) of Rwandan
community respondents’ having only primary level education, and the staff (31.6%) having
junior secondary education. However within countries, similar factors affecting level of education
attained were mentioned by both community and staff respondents. For example in Rwanda, both
staff and community respondents identified financial problems, the 1990s war and lack of
parental support as key factors influencing their level of education, whilst those in Botswana
mentioned financial problems, failure and marriage.

34
Further Education of Respondents
Beyond understanding the level of education of respondents and the factors that influenced it,
respondents were further asked to identify any further education they had received after leaving
school. This was to help appreciate the efforts of both community and staff respondents towards
developing themselves. As illustrated in Figure 7, only 12% and 3.8% of community respondents
in Botswana and Rwanda respectively had received further education, compared to 61.5% and
15.8% of staff respondents in Botswana and Rwanda respectively.
Figure 7 Further Education of Respondents
Source: Based on Field Survey Data, July-December 2014.
The 12% of community respondents in Botswana with further education had Certificate in
architecture, business communication, diploma in banking, and agricultural communication. In
Rwanda, however, the 3.8% of community respondents had further education in business
communication and hospitality.
Similarly, the 61.5% of staff respondents in Botswana had further education in arts, design,
technology, agriculture, hospitality and tourism, hotel management, and business administration
and management services. Rwandan staff respondents (15.8%) had their further education in
computing, hotel management, and land surveying.
0
10
20
30
40
50
60
70
Botswana Rwanda Overall
%
of
Res
po
nd
ents
wit
h
Fu
rth
er E
du
ati
on
Countries
Community
Staff

35
Although the proportion of staff respondents with further education was generally low
particularly in Rwanda, it was observed that tourism, hospitality and hotel management were the
key areas the staff respondents had their further education, compared to business/agricultural
communication by the community respondents. This situation perhaps could be associated with
the staff’s employment in the tourism sector.
Skills Training of Respondents
In addition to further education, the respondents were asked to identify any skills acquired before,
during or after their formal education. Findings indicated that more staff respondents across the
two countries generally had skills training than community respondents. Figure 8 shows that
33.3% of community respondents in Botswana had skills training compared to 26.9% in Rwanda.
Figure 8 Skills Training of Respondents
Source: Based on Field Survey Data, July-December 2014.
In Botswana, the community respondents had skills training in baking, building, carpentry,
cooking, crafts, dressmaking/tailoring, driving, fire and environmental safety, hairdressing, police
training, and training in auto-mechanics. Community respondents in Rwanda (26.9%) also
reported skills training in hygiene, environmental conservation, baking, farming, first aid, and
dressmaking/tailoring.
Across the two countries, the majority of all the staff (81.2%) had received skills training in
different fields. For example, the Botswana staff (92.3%) mentioned skills training in building,
0
10
20
30
40
50
60
70
80
90
100
Botswana Rwanda Overall
%
of
Res
po
nd
ents
wit
h S
kil
ls
Tra
inin
g
Countries
Community
Staff

36
carpentry, catering, first aid, and mobile safari. Those in Rwanda (73.7%) also reported skills
training in gardening, painting, mechanics, driving, housekeeping, first aid, catering and building.
Thus, it appeared that staff respondents across the two countries received similar skills training
particularly in first aid, building and catering.
Employment Characteristics
Employment Sectors of Community Respondents
Considering that staff respondents were all tourism-related workers, this section focuses on
community respondents, in terms of their employment sectors. Not unexpectedly, the majority of
the community respondents across both countries were involved in agriculture. The agricultural
sector employed 55.8% of community respondents in Botswana and 53.4% in Rwanda. This
emphasises the agrarian nature of the communities and the importance of agriculture to the
people. Moreover, as presented in Table 9, the tourism sector was the second largest employment
sector in the study areas across the two countries. The tourism sector provided employment for
28% of the Botswana community respondents and 21.3% of the Rwandan community
respondents.
Table 9 Employment Sectors of Community Respondents
Sector Botswana, n (C) = 47
(%)
Rwanda, n(C) = 47
(%)
Overall (%)
Agriculture 55.8 53.4 54.6
Civil service (e.g., government
employees)
12.2 5.3 8.8
Health 0.0 6.7 3.4
Tourism & Hospitality 28.0 21.3 24.7
Self-employed (e.g., carpentry,
local shop owners)
4.0 13.3 8.7
Source: Field survey, July-December 2014
It is worth mentioning that some community respondents in Botswana (12.2%) and Rwanda
(5.3%) were civil service employees, whereas 4% and 13.3% of Botswana and Rwandan
respondents respectively had their own businesses.

37
Nature of Employment Position of Respondents
Table 10 illustrates that the majority of both staff and community respondents had permanent
employment positions in tourism (lodge) and agriculture respectively. In Botswana, 94% of the
community respondents had permanent employment while 94.3% of the community respondents
were also permanently employed. Only 2% and 4% of Botswana community respondents had
contract and temporary positions. Similar findings were reported by staff respondents with
92.3% and 94.7% of those in Botswana and Rwanda respectively having permanent positions. In
addition, about 7.7% of staff respondents in Botswana had contract positions whereas 5.7% in
Rwanda had temporary positions.
Table 10 Nature of Employment Position of Respondents
Nature of Position Botswana, n (C) = 50, n
(S)=13
Rwanda, n(C) = 52,
n(S)=19
Overall (%)
Comm (%) Staff (%) Comm (%) Staff (%) Comm Staff
Contract 2.0 7.7 1.9 0.0 1.9 3.1
Permanent 94.0 92.3 94.3 94.7 94.2 93.6
Temporary 4.0 0.0 3.8 5.7 3.9 3.1
Source: Field Survey, July-December 2014.
Despite the high proportion of community respondents with permanent employment, findings
indicated that they were mostly farmers, and thus regarded agriculture as a permanent
employment type. However, agriculture in these communities is mostly small scale, and rain-fed,
providing uncertainty in yield and income. The majority of the staff respondents with permanent
positions had secure, predictable and regular incomes from the lodges, which was necessary in
making future plans and projections.
Current Positions of Staff Respondents in the Lodges
Given that the nature of staff respondents’ employment position varied, they were asked to
mention their current positions in the lodges. This was not only necessary in finding out the
variety of positions within the lodges, but understanding the level of influence of the local staff in
the activities of the lodge. Unfortunately, as shown in Figure 9, none of the staff respondents
across the two countries had management positions.

38
Figure 9 Current Positions of Staff Respondents
Source: Based on Field Survey Data, July-December 2014.
In Botswana, many staff respondents occupied positions of cleaner/housekeeping/porter (23.1%),
waiter/ress (23.1%), kitchen hand/scullery (15.4%) and gardener/technician/maintenance
(15.4%), with few chef (7.7%), drivers (7.7%) and tour guides (7.7%). Similarly, many staff
respondents in Rwanda occupied positions of cleaner/housekeeping/porter (57.9%),
gardener/technician/maintenance (26.4%) and kitchen hand/scullery (10.5%), with few
waiter/ress (5.3%).
Work Benefits Received by Respondents
Findings revealed that all Rwandan community respondents did not have any work benefits,
compared to 86% of Botswana community respondents (see Figure 10). This was perhaps due to
the fact that the majority of the community respondents were involved in small scale agriculture,
thus self-employed. The 16% of Botswana community respondents who received benefits from
their work places were civil servants (government officials and teachers), who mentioned
uniform, pension, accommodation and medical aid as benefits.
0
10
20
30
40
50
60
Botswana Rwanda
Pro
po
rtio
n o
f R
esp
on
den
ts
Countries
Chef
Cleaner/housekeeping
/porter
Driver
Gardener/Technician
/Maintenance
Guide
Kitchen hand
/Scullery
Waiter/ress

39
Figure 10 Work Place Benefits for Staff Respondents
Source: Based on Field Survey Data, July-December 2014.
The situation was however different as all staff respondents across the two countries indicated
various forms of work benefits. As illustrated in Figure 10, staff respondents in Botswana were
better resourced compared to those in Rwanda. For example all staff in Botswana reported
uniform, food, accommodation, transport, pension, gratuities and bonus benefits, with 58%
further reporting medical aid benefits. On the other hand, although all Rwandan staff respondents
reported work benefits, not all of them fully benefited. For instance, the following benefits were
mentioned; uniform (84.2%), food (63.2%), accommodation (58%), transport (63.2%), pension
(85.4%), medical aid (63.2%), gratuities (58%) and bonus (58%).
Interactions with Rwandan staff respondents revealed that the likelihood of permanent employees
receiving more benefits was higher than contract and temporary employees. This might explain
the relatively low response rate amongst Rwandan staff compared to those in Botswana. In
addition, the disparity in benefits received by staff respondents might reflect stronger workplace
legislation in Botswana which ensures that basic conditions were available to encourage
employees to perform their duties. Such workplace legislation appeared non-existent in Rwanda.
It must however be indicated that in relation to medical aid benefits, more staff in Rwanda
(63.2%) benefitted compared to Botswana (58%).
0
10
20
30
40
50
60
70
80
90
100
Botswana Rwanda
Pro
po
rtio
n o
f R
esp
on
den
ts
Countries
Uniform
Food
Accommodation
Transport
Pension
Medical aid
Gratuites
Bonus

40
Type of Training Provided to Respondents by Employers
Across the two countries, findings showed that 92% and 98.1% of Botswana and Rwandan
community respondents respectively had received no training from their employers. This was
largely due to the dominance of small scale agriculture in the communities. Alternatively, the
majority of the staff respondents had received either formal training or on the job training. In
Figure 11, more staff respondents in Rwanda (57.9%) had received formal training compared to
23.1% in Botswana.
Thus in terms of training provided by employers, Rwandan staff had benefitted more than those
in Botswana. However, more Botswana staff respondents (46.2%) had received on the job
training compared to those in Rwanda (26.3%). Moreover, while 30.8% of Botswana staff had
received no training, only 15.8% of Rwandan staff had no training.
Figure 11 Training Type Provided to Staff Respondents by Employers
Source: Based on Field Survey Data, July-December 2014.
Income and Expenditure Patterns of Respondents
Number and Sources of Income Respondents
Respondents were asked to indicate the number of sources from which they generated their
household incomes. This was necessary in understanding the various ways in which respondents
sustain their households in terms of income. Findings indicated that whereas none of the staff
0
10
20
30
40
50
60
Botswana Rwanda
Pro
po
rtio
n o
f R
esp
on
den
ts
Countries
Formal
No training
On the job training

41
respondents had more than two sources of income, some community respondents had three
sources. As summarised in Figure 12, 44%, 54% and 2% of Botswana community respondents
respectively depended on one, two and three income sources, whereas 38.5%, 55.8% and 5.7%
respectively of those in Rwanda also depended on one, two and three income sources. In regards
to the staff, findings revealed that 76.9% and 23.1% of Botswana staff respondents respectively
had one and two sources of income, whilst 73.7% and 26.3% respectively of those in Rwanda had
one and two sources of income.
Figure 12 Number of Income Sources of Respondents
Source: Based on Field Survey Data, July-December 2014.
Given the unpredictability of agricultural activities, in terms of output and income, it was
understandable that the majority of the community respondents had more than one income
source. In the same way, the benefits provided by the lodges to the staff regarding certainty of
income and job security, might have contributed to the reliance on one income source by the
majority of the staff respondents (see Table 11). Identifying the various income sources, findings
showed that while the majority of community respondents generated their income from
agriculture, staff respondents depended on income from the lodges.
0
10
20
30
40
50
60
70
80
Botswana
Community
Botswana Staff Rwanda
Community
Rwanda Staff
Pro
po
rtio
n o
f R
esp
on
den
ts
Category of Respondents
One
Two
Three

42
Table 11 Sources of Income of Respondents
Income Sources Botswana, n (C) = 50, n
(S)=13
Rwanda, n(C) = 52,
n(S)=19
Overall (%)
Comm (%) Staff (%) Comm (%) Staff(%) Comm Staff
Farming 58.0 12.0 57.7 20.3 57.9 16.2
Fishing 4.0 7.7 0.0 0.0 2.0 3.9
Crafts/Curios 14.0 3.8 0.0 0.0 7.0 1.9
Spouse/Family income 32.0 8.5 40.4 16.0 36.2 12.3 Piece work/Casual labour 8.0 8.0 34.6 5.3 21.3 6.7
Grants/Pension 34.0 0.0 1.9 0.0 17.9 0.0
Others (e.g., personal
business)
2.0 0.0 1.9 0.0 2.0 0.0
Lodge 0.0 100.0 0.0 100.0 0.0 100.0
Source: Field survey, July-December 2014
As presented in Table 10, 58% and 57.7% of community respondents in Botswana and Rwanda
respectively generated their incomes from agriculture, while all of the staff respondents in both
countries generated their incomes from the lodges. The high dependence of staff respondents on
the lodges for their income emphasised the benefits the lodges provide.
Average Incomes of Respondents
Considering that income remains a basic indicator of poverty and welfare particularly in Africa,
respondents were asked to indicate their monthly and annual incomes. Table 12 summarises the
average monthly and annual income of respondents, and further provides the minimum and
maximum income ranges. It is worth noting that respondents only mentioned their monthly
income from their major occupation without including income from other sources such as spouse
income. However, incomes from other sources were included in the calculation of the average
annual income.
Table 12 Average Monthly Salary of Respondents (US$)
Country Average Monthly Min-Max Monthly Average Annual Min-Max Annual
Comm Staff Comm Staff Comm Staff Comm Staff
Botswana 103.9 322.3 41.2-301.8 186-439.0 1868.4 4680.5 897.2 – 2067.3 2232.1 – 5268.0
Rwanda 29.3 59.6 10.5-82.7 52.4-108.9 703.2 1032.7 543.7 – 989.6 628.8 – 1306.8
Overall 66.6 190.95 10.5-175.8 52.4-439.0 1283.8 2856.6 543.7 – 2067.3 628.8 – 5268.0
Source: Field survey, July-December 2014. Note: US $1 = BWP 9.6; US $1= RWF 688.9
(February 2015 exchange rate).

43
In Table 12, staff respondents across the two countries had higher incomes in addition to other
benefits from the lodges (e.g., food, accommodation) compared to community respondents,
despite depending mostly on one income source (the lodges). Moreover, there were considerable
variations between the two countries. For example, average monthly (US $103.9) and annual (US
$ 1868.4) incomes of community respondents in Botswana were about three times that of
Rwandan community respondents who had US $ 29.3 monthly and US $ 703.2 annual average
incomes. Similar trends were recorded for the staff. As discussed in the Background section of
this report, the different socio-economic development status attained by the two countries might
have contributed to the variation in incomes. For example, Botswana is more developed
compared to Rwanda in socio-economic terms, and remains one of the most developed nations in
Africa. Rwanda on the other hand continues to recover from the 1990s war and genocide, despite
recording considerable progress over the past decade. Thus, it is understandable that incomes are
higher in Botswana compared to Rwanda. In addition, the value of the incomes, in terms of
purchasing power, in the various countries is worth considering. For example, while it might be
impossible to live on US $29.3 - the average monthly income in Rwanda – in Botswana for a
month, the value of US $103.9 ( the average monthly income in Botswana), in terms of
purchasing power might be the same as US $29.3 in Rwanda. Thus, the variations in the socio-
economic conditions of the two countries make it impossible to compare income in absolute
terms.
The most important factor, however, is the contribution of the various sources of income to the
total average income. The respondents were then asked to indicate the contribution of each source
of income (see details in Appendix 2). Findings revealed that while farming (agriculture)
contributed to many community respondents in Botswana (83.3%) and Rwanda (38.6%) annual
income, there was no contribution from the lodges. On the other hand, whilst the lodges
contributed 81.9% and 69.2% of staff annual income in Botswana and Rwanda respectively,
farming contributed only 10.7% in Botswana and 21% in Rwanda. Thus, across the two
countries, agriculture remained a major contributor to local community respondents’ annual
income while the lodges were the major contributor to staff respondents’ annual income.
Findings further showed that there were other income sources that contributed to the annual
income of respondents, though minimal. In Botswana, fishing (1.3%), crafts/curios (3.1%),

44
spouse/family income (5.5%), piece work/casual labour (1.4%), grants/pension (2.9%), and
others such as personal businesses (2.5%) contributed to the annual income of community
respondents. Rwandan community respondents identified the following minor contributors to
annual income; crafts/curios (1.1%), spouse/family income (25.5%), piece work/casual labour
(8.8%), grants/pension (1.1%) and others (1.1%). Among the staff respondents in Botswana,
minimal annual income contributions were generated from farming (10.7%), fishing (0.2%),
crafts/curios (3.4%), spouse/family income (3.4%), piece work/casual work (0.2%),
grants/pension (0.2%) and others (0.2%). Staff in Rwanda however mentioned few minor
contributors to their annual income and they included farming (21%), spouse/family income
(7.4%) and piece work/casual labour (2.4%).
Average Monthly Expenditure of Respondents
To understand the relative value of average monthly income, respondents were asked to report on
their household expenditure behaviour. Table 13 presents a summary of the average monthly
expenditure of the respondents. Given that staff respondents had higher average monthly income
than community respondents, the average monthly expenditure reflected a similar pattern. Staff
respondents in Botswana and Rwanda had average monthly income of US $298.2 and US $50.7
respectively compared to community respondents in Botswana (US $104.1%) and Rwanda (US
$30.9).
Table 13 Average Monthly Household Expenditure of Respondents
Country Average exp. (US$) Min-Max exp. (US$)
Comm Staff Comm Staff
Botswana 104.1 298.2 40.5 – 208.3 182.1 – 348.1
Rwanda 30.9 50.7 16.0 – 59.5 45.3 – 62.1
Overall 67.5 174.5 16.0 – 208.3 45.3 – 348.1
Source: Field survey, July-December 2014. Note: US $1 = BWP 9.6; US $1= RWF 688.9
(February 2015 exchange rate).
In relation to expenditure patterns, Botswana community respondents spent their income on
groceries/food (50.8%), transport (11.2%), water (7.5%), education (6.4%), electricity (6.1%),
telephone (5.4%), clothes (4.8%), paraffin/gas/candle (4%), childcare (2.1%), loan payment
(1.6%) and accommodation (0.1%). In Rwanda, community respondents spent their income on

45
groceries/food (52.8%), transport (12.2%), paraffin/gas/candle (10.9%), telephone (6.3%), water
(5.2%), clothes (5.1%), education (3.5%), childcare (2.3%), electricity (1.1%), and
alcohol/cigarette (0.1%). Similar expenditure patterns were reported by the staff respondents (see
Appendix 3 for details).
However, compared with the average monthly income, it appeared that the overall average
monthly expenditure of the community respondents across the two countries (US $67.5) was
equal to their overall average monthly income (US $66.6). This had implications on saving
culture of the community respondents, as no money was left for saving. On the other hand, about
one-fifth of the average monthly income of all the staff respondents in both countries was
‘saved’. The next section examines the saving culture – the ability and capacity to save – of the
respondents.
Saving Culture of Respondents
As illustrated in Figure 13, about 76% of community respondents across the two countries did not
save compared to only 14% of staff. At the community level, while 63.6% and 86.3% of
Botswana and Rwandan community respondents reported no saving. This poor saving culture
among community respondents was attributed to limited opportunities to earn income apart from
farming, low income from agriculture compared to other sectors, and a high dependency ratio.
Figure 13 Saving Culture of Respondents
Source: Based on Field Survey Data, July-December 2014.
0
10
20
30
40
50
60
70
80
90
100
Botswana Rwanda Overall%
of
Res
po
nd
ents
Wh
o S
av
e
Countries
Community
Staff

46
Contrary to the poor saving culture amongst the community respondents, the majority of the staff
respondents in Botswana (93.1%) and Rwanda (79%) indicated they were saving. While the
saving culture amongst the staff was remarkable and commendable, findings indicated that it was
largely due to the benefits that the lodges provided them particularly accommodation, food,
transport and bonuses. As a result, the staff respondents were better positioned to save compared
to the community respondents.
Ownership of Assets
Respondents’ Ownership of Assets
Given that the socio-economic wellbeing of any given society is influenced by people’s
ownership of assets, respondents were asked to indicate the assets they owned. The major assets
considered were motor vehicle, motorbike, television, mobile phones, bicycle and cattle. As
illustrated in Figure 14, none of the community respondents in Rwanda owned a motor vehicle
compared to 26% of those in Botswana. Similarly, none of the staff respondents in Rwanda
owned a motor vehicle compared to 38.5% of those in Botswana. Thus, across the two countries,
Botswana respondents were more likely to own a motor vehicle than those in Rwanda. Perhaps,
the socio-economic differential between the two countries might have influenced ownership of
motor vehicle.
Figure 14 Respondents’ Ownership of Assets
Source: Based on Field Survey Data, July-December 2014.
0102030405060708090
100
Botswana
Community
Botswana Staff Rwanda
Community
Rwanda Staff%
of
Res
po
nd
ents
Wh
o O
wn
Ass
et
Category of Respondents
Motor Vehicle
Motor Bike
Television
Mobile Phones
Bicycle
Cattle

47
Findings on ownership of motor bike revealed that none of the community respondents across the
two countries owned a motor bike. Similar findings were reported by Rwandan staff where none
of the respondents owned a motor bike. Even in Botswana, only 7.7% of the staff respondents
had motor bike. In terms of ownership of television, there were more respondents particularly
staff who owned it. For example in Botswana, 84.6% and 64% of the staff and community
respondents respectively owned television. Also in Rwanda, 57.9% of the staff respondents
owned television. Unlike the situation amongst community respondents in Botswana, only 1.9%
of Rwandan community respondents owned television.
In relation to ownership of a bicycle, few respondents especially in Rwanda owned one. Whereas
11.5% of community respondents and 10.5% of staff respondents in Rwanda reported ownership
of bicycle, 14% and 38.5% of community and staff respondents in Botswana indicated
ownership. Similar findings were reported for the ownership of cattle. In Botswana, 58% and
76.9% of community and staff respondents owned, on average, 24.4 and 14.6 cattle respectively.
In addition, about 34.6% and 42.1% of Rwandan community and staff respondents respectively
owned, on average, 1.3 and 2.3 cattle. It is however worth noting that the majority of staff across
the two countries owned more cattle than the community respondents. This situation is most
likely to be linked to the relatively higher incomes of the staff respondents compared to the
community respondents, which enabled them to purchase and raise more cattle.
Interestingly, findings indicated an overwhelming majority of all the respondents, community and
staff, owned mobile phones. In Botswana, 92% and 92.3% of community and staff respondents
respectively owned an average of 1.5 and 3.5 mobile phones per household respectively.
Similarly, all staff respondents and 69.2% of community households in Rwanda owned an
average of one mobile phone. This suggests that mobile phone is becoming an important asset for
the respondents. Conservation and Tourism
Community Respondents Knowledge of Sabyinyo Silverback Lodge (Rwanda) and Ngoma
Safari Lodge (Botswana)
Community respondents were asked of their knowledge of the existence of the lodges. This
question did not cover community respondents’ knowledge of the activities of the lodges but only
their existence. Across the two countries, the majority of the Rwandan respondents knew about

48
the existence of the lodges (see Figure 15 below). For instance, more community respondents in
Rwanda (94.2%) were aware of the existence of the Sabyinyo Silverback Lodge compared to
Botswana community respondents’ (48%) knowledge of the Ngoma Safari lodge.
Figure 15 Community Respondents Knowledge of the Lodges, and the Link
between the Lodges and the Community Trust
Source: Based on Field Survey Data, July-December 2014.
Community Respondents Knowledge of the Relationship between the Lodges and the
Community Trusts
As a follow up to community respondents’ knowledge of the lodges, the respondents’ knowledge
of the relationship between the lodges and the community trusts was tested. As shown in Figure
15, the majority of the respondents did not know the relationship between the lodges and the
community trust. In Rwanda, only 21.1% of respondents reported knowledge of the link between
the lodges and the community trust, compared to 48% of Botswana respondents.
While the situation in Botswana might be attributed to the recent establishment of the Ngoma
Safari Lodge (2011) and the community trust (CECT), community respondents in Rwanda also
consistently referred to the Sabyinyo Silverback Lodge as SACOLA. To them, the lodge and the
community trust were one.
0
20
40
60
80
100
Botswana Rwanda
Pro
po
rtio
n o
f R
esp
on
den
ts
Countries
Knowledge of the
lodges
Link between the
lodges and trusts

49
Respondents’ Responses to the Lodges’ Contribution to Job Creation
Figure 16 summarises the respondents’ perceptions of the contribution of the lodges to job
creation in the local communities. Generally, findings indicated that many of the respondents
agreed that the lodges were beneficial in creating jobs. Regarding job creation in Botswana, 26%
of community respondents strongly agreed, 30% agreed, 20% indicated neutral positions, 16%
disagreed and 8% strongly disagreed. With the staff respondents in Botswana, 21.7% strongly
agreed, 52.2% agreed and 26.1% reported neutral position in relation to the Ngoma Safari
Lodge’s contribution to job creation.
Figure 16 Respondents’ Responses to the Lodges Contribution to Job Creation
Source: Based on Field Survey Data, July-December 2014.
At the community level in Rwanda, 53.1% strongly agreed that Sabyinyo Silverback Lodge
contributed to job creation, 16.3% also agreed while 30.6% were neutral. Among the staff
respondents in Rwanda, however, 41.9% strongly agreed and 19.4% agreed, with 38.7%
disagreeing with the Sabyinyo Silverback Lodge’s contribution to job.
Generally, it was expected that staff of the lodges would express positive attitudes towards the
lodges’ contribution to job creation given that they had benefitted as employees. Interestingly,
comparison between staff and community respondents showed that more community respondents
strongly agreed to the lodges’ contribution to job creation compared to staff respondents across
0
10
20
30
40
50
60
Botswana
Community
Botswana Staff Rwanda
Community
Rwanda Staff
Pro
po
rtio
n o
f R
esp
on
den
ts
Category of Respondents
Strongly agree
Agree
Neutral
Disagree
Strongly
disagree

50
the two countries. This situation was more pronounced in Rwanda where 38.7% of staff
respondents expressed disagreement, and none of the community respondents disagreed or
strongly disagreed with the Sabyinyo Silverback Lodge’s contribution to job creation. Further
clarification from the Rwandan staff respondents revealed that they wanted the management of
the lodge to expand the lodge to create more jobs and generate more community benefits.
Although they argued that there was room for such expansion, in terms of resources and tourist
demand, it was not recognised as a priority by the management.
Community Respondents to the Lodges’ Contribution to Tourist’s Attraction
Across the two countries, community respondents in Rwanda strongly emphasised the
contribution of the Sabyinyo Silverback Lodge to tourist attraction compared to those in
Botswana’s responses to the Ngoma Safari Lodge’s contribution. As illustrated in Figure 17,
73.5%, 8.2% and 18.4% of Rwandan community respondents strongly agreed, agreed and
reported neutral positions respectively to the contribution of the lodge to tourist attraction.
Figure 17 Community Respondents’ Responses to the Lodges’ Contribution to
Tourist Attraction
Source: Based on Field Survey Data, July-December 2014.
Alternatively, 12.2%, 36.7%, 20.4% of Botswana community respondents strongly agreed,
agreed and indicated neutral position respectively to the lodge’s contribution to tourist attraction.
In addition, 18.4% and 12.2% of the Botswana respondents strongly disagreed and disagreed
respectively. Perhaps, the promotion of tourism, particularly the Mountain Gorillas, and
0
10
20
30
40
50
60
70
80
Botswana Rwanda
Pro
po
rtio
n o
f R
esp
on
den
ts
Countries
Strongly agree
Agree
Neutral
Disagree
Strongly
disagree

51
community awareness of the Sabyinyo Silverback Lodge in Rwanda might have determined the
high recognition of the lodge’s contribution to tourist attraction amongst the community
respondents. On the other hand, the relatively young nature of Ngoma Safari Lodge (established
in 2011) might have influenced the low community response rate regarding its contribution to
tourist attraction.
Community respondents’ Responses to the Lodges’ Contribution to Conservation of Plants and
Animals
Given that the fundamental objective of AWF is to restore depleted landscapes and protect the
natural environment in Africa, it is important to understand how AWF’s activities, through the
establishment of the lodges, are contributing to environmental and wildlife conservation. Thus,
community respondents were asked to indicate their level of agreement with the lodges’
contribution to plants and animal conservation. Findings revealed that while many community
respondents in Rwanda generally emphasised the contribution of the lodge to conservation, those
in Botswana reported neutral and negative responses (see Figure 18).
Figure 18 Community Respondents’ Responses to the Lodges’ Contribution to
Conservation of Plants and Animals
Source: Based on Field Survey Data, July-December 2014.
In Figure 18, 57.1% of Rwandan community respondents strongly agreed, 18.4% agreed, 22.5
were neutral and 2% disagreed with Sabyinyo Silverback Lodge’s contribution to environmental
conservation. On the other hand, only 22% of Botswana community respondents strongly agreed,
0
10
20
30
40
50
60
Botswana Rwanda
Pro
po
rtio
n o
f R
esp
on
den
ts
Countries
Strongly agree
Agree
Neutral
Disagree
Strongly
disagree

52
34% agreed, 30% were neutral, 10% disagreed and 4% strongly disagreed with the contribution
of Ngoma Safari Lodge to environmental conservation.
Community Respondents’ Responses to the Lodges’ Support to Local Communities
The low agreement pattern of Botswana community respondents’ responses towards Ngoma
Safari Lodge’s contribution to tourist attraction and environmental conservation continued, in
fact worsened, with the lodge’s support to local communities. As shown in Figure 19, only 14%
of Botswana community respondents believed that the lodge supported the local communities.
About 14% and 44% of Botswana community respondents strongly disagreed and disagreed
respectively with the Ngoma Safari Lodge’s support for local communities while 28% were
neutral. This suggests that Botswana community respondents considered Ngoma Safari Lodge’s
support to the local communities as very limited.
Figure 19 Community Respondents’ Responses to the Lodges’ Support to Local
Communities
Source: Based on Field Survey Data, July-December 2014.
Unlike the situation in Botswana, most Rwandan community respondents agreed with Sabyinyo
Silverback Lodge’s support for local communities. While 61.2% strongly agreed, 22.5% also
agreed, with 12.2% and 4.1% expressing neutral position and disagreement respectively. It thus
0
10
20
30
40
50
60
70
Botswana Rwanda
Pro
po
rtio
n o
f R
esp
on
den
ts
Countries
Strongly agree
Agree
Neutral
Disagree
Strongly
disagree
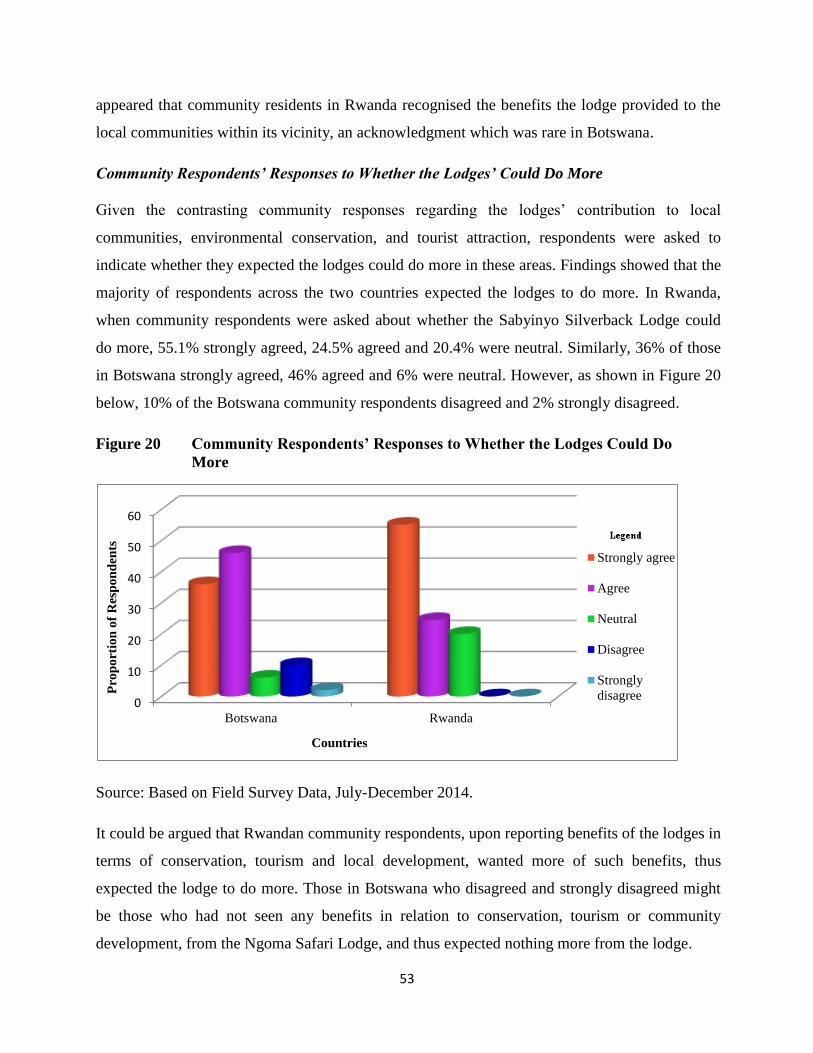
53
appeared that community residents in Rwanda recognised the benefits the lodge provided to the
local communities within its vicinity, an acknowledgment which was rare in Botswana.
Community Respondents’ Responses to Whether the Lodges’ Could Do More
Given the contrasting community responses regarding the lodges’ contribution to local
communities, environmental conservation, and tourist attraction, respondents were asked to
indicate whether they expected the lodges could do more in these areas. Findings showed that the
majority of respondents across the two countries expected the lodges to do more. In Rwanda,
when community respondents were asked about whether the Sabyinyo Silverback Lodge could
do more, 55.1% strongly agreed, 24.5% agreed and 20.4% were neutral. Similarly, 36% of those
in Botswana strongly agreed, 46% agreed and 6% were neutral. However, as shown in Figure 20
below, 10% of the Botswana community respondents disagreed and 2% strongly disagreed.
Figure 20 Community Respondents’ Responses to Whether the Lodges Could Do
More
Source: Based on Field Survey Data, July-December 2014.
It could be argued that Rwandan community respondents, upon reporting benefits of the lodges in
terms of conservation, tourism and local development, wanted more of such benefits, thus
expected the lodge to do more. Those in Botswana who disagreed and strongly disagreed might
be those who had not seen any benefits in relation to conservation, tourism or community
development, from the Ngoma Safari Lodge, and thus expected nothing more from the lodge.
0
10
20
30
40
50
60
Botswana Rwanda
Pro
po
rtio
n o
f R
esp
on
den
ts
Countries
Strongly agree
Agree
Neutral
Disagree
Strongly
disagree
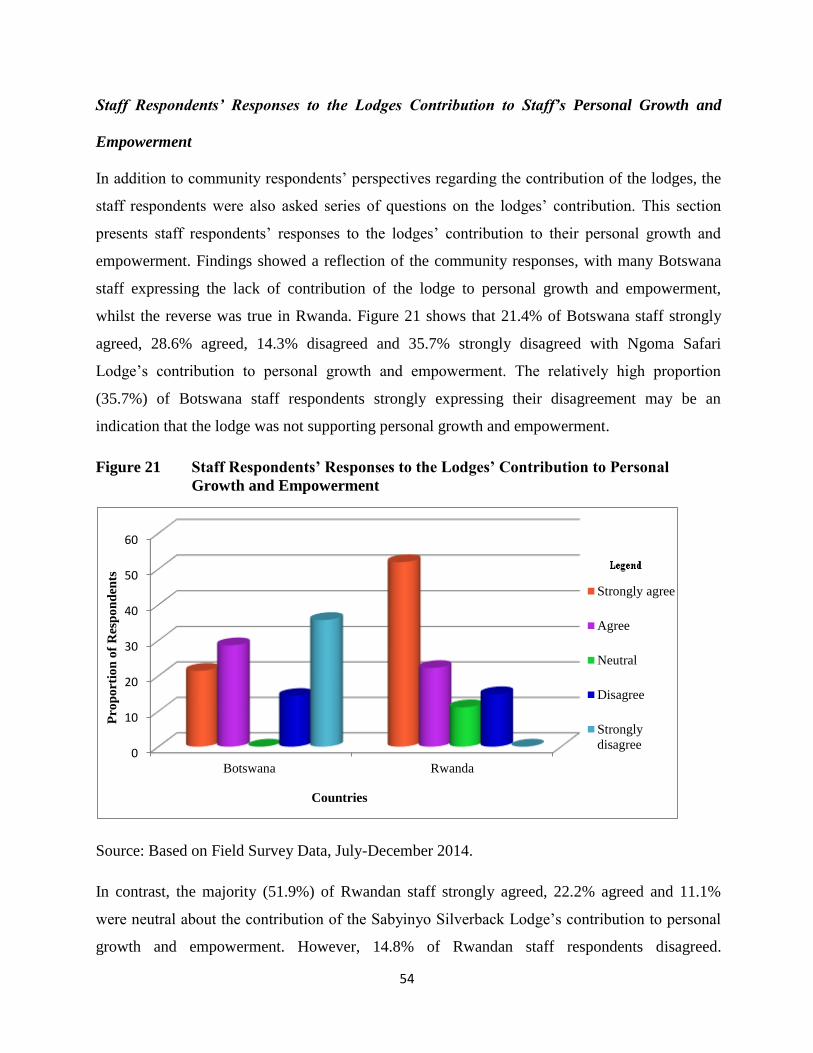
54
Staff Respondents’ Responses to the Lodges Contribution to Staff’s Personal Growth and
Empowerment
In addition to community respondents’ perspectives regarding the contribution of the lodges, the
staff respondents were also asked series of questions on the lodges’ contribution. This section
presents staff respondents’ responses to the lodges’ contribution to their personal growth and
empowerment. Findings showed a reflection of the community responses, with many Botswana
staff expressing the lack of contribution of the lodge to personal growth and empowerment,
whilst the reverse was true in Rwanda. Figure 21 shows that 21.4% of Botswana staff strongly
agreed, 28.6% agreed, 14.3% disagreed and 35.7% strongly disagreed with Ngoma Safari
Lodge’s contribution to personal growth and empowerment. The relatively high proportion
(35.7%) of Botswana staff respondents strongly expressing their disagreement may be an
indication that the lodge was not supporting personal growth and empowerment.
Figure 21 Staff Respondents’ Responses to the Lodges’ Contribution to Personal
Growth and Empowerment
Source: Based on Field Survey Data, July-December 2014.
In contrast, the majority (51.9%) of Rwandan staff strongly agreed, 22.2% agreed and 11.1%
were neutral about the contribution of the Sabyinyo Silverback Lodge’s contribution to personal
growth and empowerment. However, 14.8% of Rwandan staff respondents disagreed.
0
10
20
30
40
50
60
Botswana Rwanda
Pro
po
rtio
n o
f R
esp
on
den
ts
Countries
Strongly agree
Agree
Neutral
Disagree
Strongly
disagree

55
Interactions with the Rwandan staff respondents revealed that temporary and contract staff were
those more likely to express disagreement on the lodge’s contribution to personal growth and
development compared to permanent staff. Thus in Rwanda, permanent staff appeared to have
benefitted more from personal growth and empowerment through the lodge compared to staff on
contract and temporary basis.
Staff Respondents’ Responses to Job Satisfaction with the Lodges
Across the two countries, Rwandan staff respondents appeared to be more satisfied with their job
with the lodge compared to those in Botswana. Figure 22 shows that 48.1% of Rwandan staff
respondents strongly agreed, 37% agreed and 14.8% disagreed with the lodge providing job
satisfaction. Those who expressed disagreement in Rwanda mentioned lack of involvement of
staff in decision making, and low salaries indicating there had not been any salary increment over
the past five years.
Figure 22 Staff Respondents’ Responses to Job Satisfaction with the Lodges
Source: Based on Field Survey Data, July-December 2014.
Alternatively, relatively few (17.2%) Botswana staff respondents strongly agreed, 27.6% agreed
and 10.3% were neutral in relation to the lodge’s providing job satisfaction. Surprisingly, 27.6%
and 17.2% of Botswana staff disagreed and strongly disagreed with job satisfaction from the
0
5
10
15
20
25
30
35
40
45
50
Botswana Rwanda
Pro
po
rtio
n o
f R
esp
on
den
ts
Countries
Strongly agree
Agree
Neutral
Disagree
Strongly
disagree

56
lodge. Discussions with the respondents showed that heavy work load, performance of other
duties in addition to their primary duties, and lack of involvement of staff in decision making
were among the key causes of poor job satisfaction.
Community Respondents’ Knowledge of Community Projects by the Lodges
Table 14 shows wide variations regarding community respondents’ knowledge of the lodges’
projects in the local communities. While Sabyinyo Silverback Lodge’s projects were widely
recognised in the local communities in Rwanda, community members in Botswana could rarely
identify any project by the Ngoma Safari Lodge. For example, 87.8% of Rwandan staff reported
having knowledge of Sabyinyo Silverback Lodge’s project in the local communities, and
identified a number of projects, including building houses for the poor in the communities,
piggery and poultry farming, cattle donations, construction of local school blocks, provision of
sport kits for local schools (e.g., footballs kits, balls), provision of water tanks, electrification
project, seed multiplication, scholarships for school children, and provision of computers for
schools.
Table 14 Community Respondents’ Knowledge of Community Projects by the
Lodge
Country Community, n (B) = 50, n (R) = 52
Yes (%) No (%) Don’t know (%)
Botswana 12.2 87.8 0.0
Rwanda 72.3 4.3 23.4
Overall 41.7 46.9 11.5
Source: Field survey, July-December 2014
On the other hand, only 12.2% of Botswana community respondents indicated knowledge of
Ngoma Safari Lodge’s community projects and mentioned building of local schools, logistical
support to local schools, and support for school going children in the local communities. Field
observations thus show that community projects by Sabyinyo Silverback Lodge were more
visible to the Rwandan community respondents, compared to community projects by Ngoma
Safari Lodge in Botswana. Moreover, the year of establishment might have been a factor, as the
activities of Sabyinyo Silverback Lodge (2006) seemed to be well established and known by
Rwandan community respondents, compared to the Ngoma Safari Lodge (2011) in Botswana.

57
Respondents’ Observation of Community Changes since the Construction of the Lodges
In Figure 23, respondents’ responses to whether their local communities had changed following
the construction of the lodges are presented. Across the two communities, there were generally
low responses regarding changes in the communities since the lodges were constructed. In
Botswana, only 14% of community respondents had observed changes since the introduction of
the Ngoma Safari Lodge compared to 53.9% of staff. It might be argued that the staff (53.9%)
had observed changes because they had received some benefits, in terms of income and training,
from the Ngoma Safari lodge, whereas the community respondents observed no changes because
the activities of the lodge were not visible to them.
There were however relative improvement in Rwanda, regarding community changes following
the construction of the Sabyinyo Silverback Lodge. About 42.9% of the community respondents
reported changes compared to 94.7% of staff respondents. In addition, 20% of Rwandan
community respondents could not tell whether changes had occurred or not.
Figure 23 Respondents’ Observation of Community Changes since the
Construction of the Lodges
Source: Based on Field Survey Data, July-December 2014.
Across the two countries, it was evident that more staff respondents had observed changes in the
communities following the construction of the lodges compared to the community respondents.
Perhaps, the relatively more benefits that the lodges’ provided to the staff – such as income,
0
10
20
30
40
50
60
70
80
90
100
Botswana Rwanda Overall
Pro
po
rtio
n o
f R
esp
on
den
ts
Countries
Community
Staff
Community-
Don’t Know

58
training, accommodation and transport – compared to the benefits to the communities might have
influenced the high response levels amongst the staff.
Respondents’ Observation of Positive Changes since the Construction of the Lodges
Table 15 shows that there was considerable proportion of respondents in Rwanda who reported
positive changes following the construction of the lodges compared to those in Botswana.
Particularly, there were wide variations in community respondents’ observation of positive
changes in the communities after the lodges were built in Botswana and Rwanda. The Botswana
respondents seemed not to have witnessed much change since the Ngoma Safari Lodge was built.
Table 15 Respondents’ Observation of Positive Community Changes since the
Construction of the Lodges
Country Community, n (B) = 50, n (R) = 52 Staff, n (B)=13, n(R)=19
Yes (%) No (%) Don’t know (%) Yes (%) No (%) Don’t know
(%)
Botswana 16.0 84.0 0.0 69.2 23.1 7.7
Rwanda 93.9 2.0 4.1 100.0 0.0 0.0
Overall 54.6 43.4 2.0 87.5 9.4 3.1
Source: Field survey, July-December 2014
Respondents’ Observation of Negative Community Changes since the Construction of the
Lodges
As presented in Table 16, respondents considered that there was generally no negative changes
associated with the construction of the lodges in the two countries. However, with considerable
proportion (98.0%) of Botswana community respondents reporting no negative changes
associated with the introduction of the Ngoma Safari Lodge, and limited positive changes (16%
in Table 14), it appeared that, to the community respondents, there had not been any community
changes following the construction of the lodge in 2011.

59
Table 16 Respondents’ Observation of Negative Community Changes since the
Construction of the Lodges
Country Community, n (B) = 50, n (R) = 52 Staff, n (B)=13, n(R)=19
Yes (%) No (%) Don’t know (%) Yes (%) No (%) Don’t know
(%)
Botswana 0.0 98.0 2.0 7.7 76.9 15.4
Rwanda 2.0 91.8 6.1 5.3 89.5 5.3
Overall 1.0 95.0 4.0 6.3 84.4 9.4
Source: Field survey, July-December 2014
On the contrary, Rwandan community respondents who reported no negative changes (91.8%)
also recognised the positive changes of the Sabyinyo Silverback Lodge. Moreover, the few staff
respondents (6.3%), particularly in Botswana who indicated negative changes of the lodges to the
local communities mentioned the ban on hunting and its associated human-wildlife conflict as
major negative effects of the lodges on the local communities.
Respondents’ Responses to the Lodges’ Contribution to Poverty Reduction
Across the two countries, community respondents in Rwanda (87.8%) believed that Sabyinyo
Silverback Lodge had contributed to poverty reduction in the communities. This might be due to
community recognition of the community development projects introduced by the lodge. In
Botswana however, only 24% of the community respondents reported that the Ngoma Safari
Lodge had contributed to local level poverty reduction (see Table 17).
Table 17 Respondents’ Responses to the Lodges’ Contribution to Poverty
Reduction
Country Community, n (B) = 50, n (R) = 52 Staff, n (B)=13, n(R)=19
Yes
(%)
No
(%)
Don’t know
(%)
For some
(%)
Yes (%) No (%) Don’t know
(%)
Botswana 24.0 48.0 8.0 20.0 84.6 7.7 7.7
Rwanda 87.8 0.0 8.2 4.1 94.7 0.0 5.3
Overall 55.6 24.2 8.1 12.1 90.6 3.1 6.3
Source: Field survey, July-December 2014
This was because, unlike Rwanda, development projects of Ngoma Safari Lodge were not visible
to the Botswana community respondents. Others (20%) believed that in terms of poverty
reduction, the Ngoma Safari Lodge was only benefitting some people particularly the employees.

60
Thus, it was difficult for the community respondents in Botswana to relate the projects of the
lodge to poverty reduction. It was however, understandable that almost all the staff respondents
across the two countries reported that the lodges had contributed to poverty reduction. The
opportunities and benefits the lodges provided the staff might be the reason for the high response
rate among the staff regarding the lodges’ contribution to poverty reduction.
Lodge Area
Respondents’ Responses to Whether any of their Family Member is Employed in Tourism or
Conservation-Related Business
In understanding the importance of tourism and conservation-related businesses to the
communities within the vicinity of the lodges, respondents were asked to indicate whether any
member of their household was engaged in tourism or conservation oriented business. As
demonstrated in Figure 24, about 36% of Botswana community respondents and 76.9% of staff
respondents had their relations working with or for tourism or conservation related
Figure 24 Respondents’ Responses to Whether Any of their Family Member is
Employed in Tourism or Conservation-Related Business
Source: Based on Field Survey Data, July-December 2014.
0
10
20
30
40
50
60
70
80
Botswana Rwanda Overall
Pro
po
rtio
n o
f R
esp
on
den
ts
Countries
Community
Staff

61
However, the majority of the Botswana staff respondents had their relations working in tourism
or conservation businesses compared to the community respondents. Discussions with the
Botswana staff respondents revealed that, given the benefits the Ngoma Safari Lodge provided
them, they encouraged their household members to enter into tourism and conservation
businesses. According to the Botswana respondents, their household members were staff of
CECT, Chilvea lodge, Game Lodge, Kasane Project Guides/Game Scout, Kwalape Lodge,
Ngoma Safari Lodge, Marina Lodge, Mobile Safari, and Partner-Lodge (Zimbabwe).
In Rwanda, 28.8% and 36.8% of community and staff respondents respectively had their relations
engaged in tourism or conservation businesses. These household members were worked for
Sabyinyo Silverback Lodge, and the National Park. Comparatively, there was a smaller
proportion of Rwandan respondents with relations working in tourism or conservation related
businesses than that of Botswana, suggesting that in addition to the staff employment, a
considerable number of local people in Botswana were engaged in tourism or conservation
businesses.
Respondents’ Responses to Sector Providing the Most Jobs
In Table 18 below, summary of responses on the sector providing the most jobs is presented. At
the community level, tourism was reported by many Botswana (34%) and Rwandan (42.3%)
community respondents as the sector providing the most jobs. Similarly, the majority of staff
respondents in Botswana (73.2%) and Rwanda (75.4%) considered tourism as the sector
providing the most jobs.
Table 18 Respondents’ Responses to the Sector Providing the Most Jobs
Sector Botswana, n (C) = 50, n
(S)=13
Rwanda, n(C) = 52
n(S)=19
Overall (%)
Comm (%) Staff (%) Comm (%) Staff(%) Comm Staff
Agriculture 22.0 14.3 25.0 10.1 23.5 12.2
Cattle/Goat farming 6.0 0.0 0.0 0.0 2.9 0.0
Crafts 0.0 0.0 9.6 5.6 4.9 2.8
Fishing 10.0 0.0 0.0 0.0 4.9 0.0
Government 26.0 6.4 17.3 8.9 21.6 7.7
Tourism 34.0 73.2 42.3 75.4 38.2 74.3
Don’t know 2.0 6.1 5.8 0.0 3.9 3.1
Source: Field survey, July-December 2014

62
In addition to tourism, agriculture was mentioned as the second sector providing the most jobs by
the respondents except Botswana community respondents who identified the government as the
second largest job provider.
Respondents’ Responses to the Sector Providing Most Community Benefits
Given that tourism remained dominant in terms of the sector providing the most jobs, findings on
the sector providing most community benefits further showed that tourism was dominant among
all the respondents’ responses except Botswana community respondents, who identified
agriculture as the sector providing the most community benefits.
Table 19 shows that while 61.5% and 79% of Botswana and Rwandan staff respectively and
38.5% of Rwandan community respondents mentioned tourism as the sector providing the most
community benefits, only 6% of Botswana community respondents considered tourism as such,
with the majority of them (56%) mentioning agriculture as the most dominant sector
Table 19 Respondents’ Responses to the Sector Providing Most Community
Benefits
Sector Botswana, n (C) = 50, n
(S)=13
Rwanda, n(C) = 52
n(S)=19
Overall (%)
Comm (%) Staff (%) Comm (%) Staff(%) Comm Staff
Agriculture 56.0 7.7 36.5 10.5 46.1 9.4
Cattle/Goat farming 6.0 0.0 1.9 0.0 3.9 0.0
Crafts 2.0 15.4 5.8 0.0 3.9 6.3
Fishing 26.0 7.7 0.0 0.0 12.7 3.1
Government 4.0 7.7 11.5 5.3 7.8 6.3
Tourism 6.0 61.5 38.5 79.0 22.6 71.9
Don’t know 0.0 0.0 5.8 5.3 2.9 3.1
Source: Field survey, July-December 2014
Source/Place of Collection of Plants/Wood by Respondents
As a measure of local communities’ dependence on the natural environment, respondents were
asked to indicate the source/place of collection of their plants/wood. Interestingly, despite the
benefits tourism provided Botswana communities, the majority of the Botswana respondents,
both community and staff, extracted plants/wood from the conservation area (see Table 20).

63
Table 20 Source/Place of Collection of Plants/Wood by Respondents
Source/Place Botswana, n (C) = 50, n
(S)=13
Rwanda, n(C) = 52
n(S)=19
Overall (%)
Comm (%) Staff (%) Comm (%) Staff(%) Comm Staff
Conservation Area 92.9 61.5 48.9 46.7 69.7 53.6
Purchase (Buy) 7.1 38.5 48.9 53.3 29.2 46.4
Own Garden/Forest 0.0 0.0 2.1 0.0 1.1 0.0
Source: Field survey, July-December 2014
In Rwanda, a considerable proportion of both the community and staff respondents purchased
their plants/wood. Unfortunately, discussions with the Rwandan respondents further revealed that
those who indicated ‘purchase’ either bought charcoal or firewood from people who extracted
them from the conservation area. Thus, the challenge of reducing local communities’ dependence
on the natural environment remains in Rwanda.
Respondents’ Responses to Importance of Conservation of Plants/Animals
Given that tourism in both countries is based on natural areas and wildlife, and both staff and
community respondents relied heavily on the natural environment for their plants/wood, the
survey explored the attitude of respondents regarding the importance of conservation. Table 21
demonstrates that the majority of respondents across the two countries regarded conservation of
plants/animals as important.
Table 21 Respondents’ Responses to Importance of Conservation of Plants/Animals
Source: Field survey, July-December 2014
Community respondents across the two countries identified the following as reasons why
conservation was important; tourist attraction (58.1%), environmental protection (74.1%), forest
providing habitat for wildlife (39.6%), availability of non timber forest products (29.3%), source
of fresh air (81%), source of clean water (73.3%), source of rainfall (42.1%), community benefits
through tourism (43.0%), and jobs for local people (59.3%).
Country Community, n (B) = 50, n (R) = 52 Staff, n (B)=13, n(R)=19
Yes (%) No (%) Not sure (%) Yes (%) No (%)
Botswana 90.0 4.0 6.0 92.3 7.7
Rwanda 98.0 0.0 2.0 100.0 0.0
Overall 94.1 2.0 3.9 96.9 3.1

64
However, those community respondents across the two countries (2%) who thought conservation
of plants/animals as unnecessary and those who were unsure (3.9%) mentioned the following as
reasons; farm raids by wildlife (70.4%), death resulting from wildlife attack (56.8%), and lack of
income due to ban on hunting (24.2%).
The majority of the staff respondents in the two countries reported that conservation of
plants/animals was important due to tourist attraction (89.2%), jobs (74.7%), access to non timber
forest products (38.2%), and protection of the natural environment for future generation (61.7%).
However in Botswana, some staff respondents (7.7%) regarded conservation of plants/animals as
unnecessary because they perceived government prioritising animals over humans. Considering
that a hunting ban was recently imposed on conservation areas in Botswana (January, 2014), field
observations revealed that its impacts remain fresh in the memories of the respondents. This
situation may have caused some respondents to express negative attitudes towards conservation.
Respondents’ Responses to Human Wildlife Conflicts
Across the two countries, the majority of respondents reported cases of human wildlife conflicts.
In Botswana, 98% and 92.3% of community and staff respondents respectively reported cases of
human wildlife conflicts. On the other hand, 21.1% and 73.7% of Rwandan community and staff
respondents respectively reported cases of human wildlife conflict. As shown in Figure 25, it
appeared that human wildlife conflict was less of a problem amongst Rwandan community
respondents compared to the other respondents across the two countries.
Figure 25 Respondents’ Responses to Human Wildlife Conflicts
Source: Based on Field Survey Data, July-December 2014.
0
20
40
60
80
100
Botswana Rwanda OverallPro
po
rtio
n o
f R
esp
on
den
ts
Countries
CommunityStaff

65
In Botswana, 59.2% and 28.1% of community and staff respondents mentioned elephants as the
most common animal involved in human wildlife conflict. On the other hand, Rwandan
community (81.8%) and staff (91.8%) identified buffalo, monkeys and gorillas as common type
of animals involved in human wildlife conflict (see Appendix 4 for details on the other animals
involved in human wildlife conflict). Thus, as the local community strived to support
environmental conservation and tourism development, human wildlife conflicts appeared to be a
major issue, particularly in Botswana.
Respondents’ Responses to the State of Human Wildlife Conflicts and Wildlife Population
Table 22 shows that, across the two countries, the incidence of human wildlife conflicts had
increased in Botswana while it had declined in Rwanda. For example, about 77.6% and 41.7% of
Botswana community and staff respondents reported an increase in human wildlife conflicts. In
contrast, 54.6% and 92.9% of Rwandan community and staff respondents reported a decrease in
the cases of human wildlife conflicts.
Table 22 Respondents’ Responses to the State to Human Wildlife Conflicts in Home
Villages
State Botswana, n (C) = 49, n
(S)=12
Rwanda, n(C) = 42
n(S)=14
Overall (%)
Comm (%) Staff (%) Comm (%) Staff(%) Comm Staff
Decreased 10.2 8.3 54.6 92.9 18.33 53.8
Increased 77.6 41.7 0.0 0.0 63.3 19.2
Same 0.0 41.7 9.1 7.1 15.0 23.1
Don’t know 2.0 8.3 9.1 0.0 3.3 3.9
Source: Field survey, July-December 2014
Given the contrasting cases of human wildlife conflicts, respondents were further asked to report
on wildlife population levels since the lodges were opened. Findings, as presented in Table 23
below, revealed that 89.8% and 100% of Botswana community and staff respondents respectively
believed that wildlife population had increased. This might explain the reason behind increasing
cases of human wildlife conflicts in Botswana.
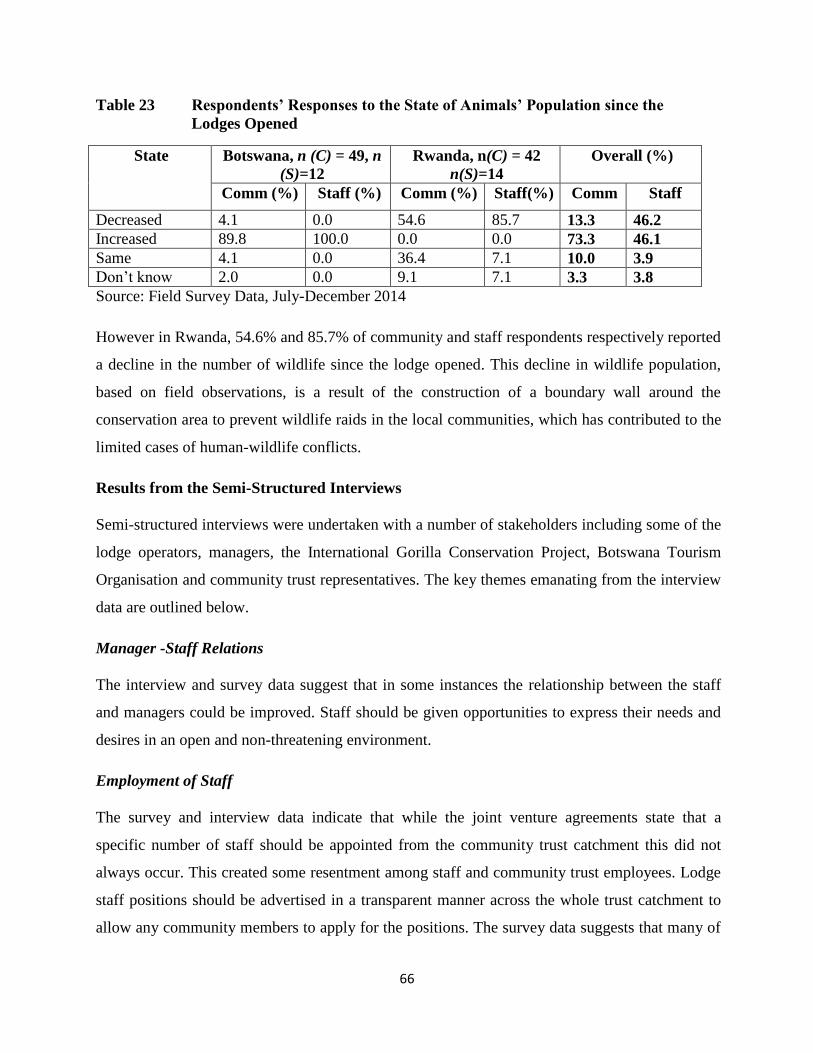
66
Table 23 Respondents’ Responses to the State of Animals’ Population since the
Lodges Opened
State Botswana, n (C) = 49, n
(S)=12
Rwanda, n(C) = 42
n(S)=14
Overall (%)
Comm (%) Staff (%) Comm (%) Staff(%) Comm Staff
Decreased 4.1 0.0 54.6 85.7 13.3 46.2
Increased 89.8 100.0 0.0 0.0 73.3 46.1
Same 4.1 0.0 36.4 7.1 10.0 3.9
Don’t know 2.0 0.0 9.1 7.1 3.3 3.8
Source: Field Survey Data, July-December 2014
However in Rwanda, 54.6% and 85.7% of community and staff respondents respectively reported
a decline in the number of wildlife since the lodge opened. This decline in wildlife population,
based on field observations, is a result of the construction of a boundary wall around the
conservation area to prevent wildlife raids in the local communities, which has contributed to the
limited cases of human-wildlife conflicts.
Results from the Semi-Structured Interviews
Semi-structured interviews were undertaken with a number of stakeholders including some of the
lodge operators, managers, the International Gorilla Conservation Project, Botswana Tourism
Organisation and community trust representatives. The key themes emanating from the interview
data are outlined below.
Manager -Staff Relations
The interview and survey data suggest that in some instances the relationship between the staff
and managers could be improved. Staff should be given opportunities to express their needs and
desires in an open and non-threatening environment.
Employment of Staff
The survey and interview data indicate that while the joint venture agreements state that a
specific number of staff should be appointed from the community trust catchment this did not
always occur. This created some resentment among staff and community trust employees. Lodge
staff positions should be advertised in a transparent manner across the whole trust catchment to
allow any community members to apply for the positions. The survey data suggests that many of

67
the staff were employed from villages nearby the lodge and tended not to include those living in
villages further afield. The lodge operators should promote the fact that a large percentage of
their staff are from the local community and that the community is benefitting from the lodge
revenue. The lodge operators must be committed to capacity building and succession planning to
ensure a handover of the lodge to local managers. Clear career paths must be established for
lodge staff supported by appropriate training.
Establishment of the Community Trusts
Holistically the survey and interview data suggest that a key factor in the effectiveness of
delivering social and economic benefits to the local community from the joint venture partnership
appears to be the process used to set up and establish the community trust and its governance
structure and operational framework. In the case of Sabyinyo Silverback Lodge the IGCP
provided substantial and long term support, capacity building and training to SACOLA members.
The on-going support of an NGO or other organisation is needed for the community trust. The
time commitment of the NGO to the community trust needs to be clearly stated at the beginning
of the establishment process and an exit strategy developed. The NGO should assist the
community trust in developing sound, logical and transparent processes to prioritise and allocate
lodge revenue to community projects. There should be on-going monitoring of the community
trust on the allocation of lodge revenue. Careful consideration should be given to the most
appropriate, effective and fair mechanism to distribute the lodge revenue. For example SACOLA
used the National Poverty Alleviation Framework to make decisions on revenue allocation.
The interview data indicates the value of developing partnerships with other NGOs, government
and local organisations to increase the social and economic benefits to local communities and
support the community trusts.
Communication between Partners
Communication between all partners is critical to the effectiveness of the joint venture
partnership. Some of the interviewees suggested that communication between the private tourism
operator, community trust and lodge managers were not satisfactory in terms of transparency,
regular meetings and inclusion of face-to-face meetings. It appears that the more partners
involved the more complicated the arrangement and communication. While the partnership
68
agreements state the requirement for regular and formal communication this did not appear to be
happening in all cases. In some instances there were suggestions that not all the partners felt the
relationship was equal, they did not feel they were being involved in the decision making and
there was a lack of trust.
Some interviewees also indicated that in some cases clauses in the written agreement were not
being adhered to and had been forgotten over time. This suggests that there is a need for all the
parties to regularly monitor and consult the agreement to ensure that all the clauses are being met
for example in relation to staff training, communication between the parties, opportunities for
further commercial activities. A review of the joint venture agreement is required on a regular
basis by all parties as well as a review of the community trust and its activities.
Opportunities for the Community
One interviewee suggested that during the establishment phase of the lodge the managers should
tap into local products and services for example purchasing eggs, milk, honey, vegetables from
the local community, using local dance and handicraft groups. They suggested that it was
important to cement these relationships early as lodge purchasing behaviours become entrenched
over time. These types of arrangements have the capacity to provide further benefits to the local
community and also cost savings to the lodge.
The survey and interview data suggest that the lodges could do more in terms of community
projects and support. One interviewee suggested that lodges should develop a social
responsibility policy and community development objectives. One of the roles of the lodge
manager could be to liaise with the community trust to ensure good communication and identify
commercial opportunities for the community.
DISCUSSION
This study provided evidence of socio-economic benefits from high-end tourism lodges to, and
behaviour patterns of, communities adjacent to local conservation areas in Botswana and
Rwanda. Both quantitative and qualitative data from structured face-to-face questionnaires and
interviews were used. Recent research has focused on lodges owned and operated by private
individuals (Snyman 2012, 2013), however in contrast to these studies, this study focused a
69
different type of joint venture involving community ownership of lodges. As such this study was
able to assess and understand the social and economic impacts of community owned lodges on
local residents and staff, and how the activities of the lodges were influencing attitudes and
behaviour modifications of these groups towards conservation and tourism. It should be noted
that owing to different levels of national development attained by Botswana and Rwanda,
comparison of certain economic indicators, such as income was inappropriate between the
respondents, and were therefore discussed separately based on country specific conditions.
Although agriculture is a major contributor to rural economies in these countries, the study found
that many staff and community residents perceived tourism as both the sector providing the most
jobs and the sector providing the most community benefits. This finding was particularly
emphasised in Rwanda where about 40% and 80% of community and staff respondents
respectively mentioned and discussed it. Despite this recognition, the study revealed that the
majority (52%) of community residents in Botswana were unaware of the existence of the Ngoma
Safari Lodge compared to nearly all community residents in Rwanda (94.2%) regarding their
knowledge of the Sabyinyo Silverback Lodge. Although the limited recognition of the lodge in
Botswana could be attributed to its recent establishment compared to the one in Rwanda, findings
indicated that the activities of Sabyinyo Silverback Lodge were more visible to Rwandan
community residents compared to Ngoma Safari Lodge in Botswana ( such as sign boards
promoting community projects supported by SACOLA). In addition, Sabyinyo Silverback Lodge
had completed more community projects in Rwanda, compared to few community projects by the
Ngoma Safari Lodge. This situation is believed to have also contributed to the limited recognition
of Ngoma Safari Lodge by the community.
Socio-economic Impacts
Overall, there was evidence of social and economic benefits from the two lodges in the local
communities. Both staff and community respondents in Rwanda received relatively more socio-
economic benefits from the lodge compared to those in Botswana, although there were
considerable differences between staff and community respondents. Amongst the majority of
Rwandan community respondents (72.3%), major socio-economic benefits identified from the
lodge mentioned by the respondents were largely community-based development projects such as
building of houses for the poor, piggery and poultry farms, cattle donations, provision of water
70
tanks and scholarship for high achieving children. These types of socio-economic benefits were
echoed by only a few (12.2%) community respondents in Botswana. The limited community
recognition of the activities of Ngoma Safari Lodge could perhaps have contributed to the
perceived limited benefits.
Amongst the staff, as expected job creation was the most important socio-economic benefit from
the lodges, which according to them had provided certainty and regularity of income. For
example while the average monthly staff incomes in Botswana and Rwanda were US $322.3 and
US $59.6 respectively, community residents in Botswana and Rwanda had US $103.9 and US
$29.3 respectively. Additionally, all Botswana staff and some (85.4%) Rwandan staff identified
other socio-economic benefits provided by the lodge management such as food, accommodation,
medical support, bonuses, uniforms and pensions, which they believed had boosted their capacity
to save and acquire more assets. For example, responses to the capacity to save by the staff
(93.1% in Botswana and 79% in Rwanda) were several times higher and more favourable than
community respondents (36.4% in Botswana and 13.7% in Rwanda). The staff also owned more
assets such as cattle compared to community residents.
Thus, the results demonstrated that staff reported more socio-economic benefits compared to
community residents. This is understandable given the job security and social support the lodges
provide the staff. This result also supports prior research (Mitchell & Ashley, 2010; Spenceley,
2008) indicating that high-end tourism ventures provide effective and sustainable options to share
tourism benefits with local communities. In addition, the study found some indirect socio-
economic and poverty reduction benefits. For instance, findings indicated that the average staff
respondents support four dependents including children. This can contribute to poverty reduction
and local development. It is therefore understandable that the majority of the respondents, both
staff and community, reported the lodges have contributed to poverty reduction.
However, the dynamics of the benefits varied among the staff respondents. While strong
workplace legislation in Botswana might have influenced the numerous work benefits received
compared to Rwanda, the study found that more Rwandan staff (84.2%) had also received more
skills training provided by the lodge compared to those in Botswana (69.2%). Permanent staff
mostly mentioned and extensively discussed socio-economic benefits compared to contract and
temporary staff across the two countries, as they were better off in terms of additional training

71
provided by the lodges than contract and temporary staff. It should be noted that many permanent
staff respondents (34.4%) across the two countries reported on the job training and formal
training (43.8%). It was observed that Rwandan staff (57.9%) had received more formal training
than those in Botswana (23.1%).
Lodge Area
The study also provided evidence that socio-economic benefits provided by the lodges do not
translate into community knowledge of their existence and community projects. Findings showed
that community respondents in both countries had limited knowledge about the relationship
between the community trusts and the lodges. The majority (52%) of Botswana community
respondents reported no knowledge of the relationship between Ngoma Safari Lodge and CECT.
This situation could possibly be linked to the limited recognition of Ngoma Safari Lodge
amongst the community residents and the relatively recent establishment of the lodge. However
in Rwanda where the Sabyinyo Silverback Lodge is well established and its activities visible to
the community residents, findings indicated that the majority (78.9%) of the residents did not
know the relationship between SACOLA and the lodge, rather they perceived SACOLA as the
lodge, and thus the same entity.
Despite the limited local knowledge on the relationship between the community trusts and the
lodges, findings showed that the majority (over 60%) of the community residents across the two
countries recognised the contribution of the lodges to job creation, environmental conservation
and poverty reduction. The lodges’ role in attracting tourists, creating local employment,
generating revenue for local development and conserving wildlife were key issues mentioned,
emphasised and discussed by the community respondents especially in Rwanda. In terms of the
lodges’ contribution to community development, few (14%) Botswana community residents
acknowledged that compared to the majority (83.7%) of Rwandan community respondents.
Surprisingly, some (38.7%) Rwandan staff disagreed with the idea that Sabyinyo Silverback
Lodge had contributed to job creation. According to them, the lack of commitment on the part of
management to expand the lodge to employ more locals, in the face of increasing demand, is
evidence that the lodge is not contributing to job creation, although they are beneficiaries.
72
Most (51.9%) of the staff in Rwanda acknowledged the role of the lodge to their personal growth
and empowerment compared to those in Botswana (21.4%). This was further reflected in staff
respondents perceptions of job satisfaction in the lodges provide. Only 44.8% of Botswana staff
reported job satisfaction with the lodge, compared with 85.1% of those in Rwanda. Although
Botswana staff identified several reasons affecting job satisfaction including performance of
other duties in addition to their primary duties, the high response rate of poor job satisfaction is of
concern.
The study found that community residents in both countries identified few changes in their
communities following the construction of the lodges. While 86% of Botswana community
respondents reported no changes, 36.7% and 20.4% of Rwandan community respondents also
reported no changes and did not know of any changes since the construction of the lodges
respectively. Perhaps, it could be argued that the recent establishment of the Ngoma Safari Lodge
and limited community recognition of its activities might have contributed to residents’
perception of lack of community change in Botswana. Yet, in Rwanda that the activities of
Sabyinyo Silverback Lodge are visible, the majority of the community respondents were also
unsure and unaware of any community changes as a result of the lodge. It is thus unsurprising
that the majority of the community residents (81%) across the two countries indicated that the
lodges could do more in terms of job creation and local community development for the local
communities.
Tourism and Conservation Attitudes
Across the two countries both staff and community respondents expressed positive attitudes
towards conservation and tourism. Over 94% and 96% of community and staff respondents
across the two countries mentioned that conservation of plants/animals is important. The
respondents acknowledged that conserving the environment leads to tourist attraction, creates
jobs for locals through tourism, generates community benefits through tourism, protects habitat
for wildlife, provides non-timber forest products, serves as sources of fresh air and clean water,
and further induces rainfall. The study found that the community and staff respondents’
recognition of the importance of conservation was partly due to the activities of the lodges and
the community trusts. For instance, Rwandan community and staff respondents recognised that
the local conservation area was the reason for the construction of the lodge, and that without the

73
conservation area (and gorillas), the lodge would not have been constructed. In Botswana,
respondents positive attitude towards conservation was also influenced by national legislation
banning hunting and declaring all wildlife protected.
Unfortunately, the majority (over 90%) of staff and community respondents depend on firewood
for cooking, with 69.7% and 53.2% of community and staff respondents respectively, extracting
their firewood from the conservation areas. Although the use of firewood is considered cheap and
easily accessible by the communities, it remains a major conservation and tourism development
concern given its implications on the environment and wildlife. The promotion of alternative
sources of energy for cooking may help reduce communities’ dependence on the conservation
areas.
Local support towards conservation and tourism is also hampered by human-wildlife conflicts.
This situation is particularly widespread in Botswana where 98% and 92.3% of community and
staff respondents mentioned and discussed it. According to the respondents, the number of
wildlife has increased following the ban on hunting and the construction of the Ngoma Safari
Lodge. As a result, regular human-wildlife conflict has become prevalent in the communities,
with elephants being the most common animal involved. On the other hand, although human-
wildlife conflict is a challenge in Rwanda, only few (21.1%) community respondents reported it
compared to 73.7% of staff, with buffalo, monkeys and gorillas identified as those frequently
involved. However, both staff (92.9%) and community (54.6%) respondents reported a decrease
in human-wildlife cases since the construction of the Sabyinyo Silverback Lodge. This reduction,
according to the respondents, is a result of a decrease in the population of wildlife. Field
observations show that the construction of a boundary wall around the Volcanoes National Park
in Rwanda had contributed to a decline in the cases of human-wildlife conflicts. Thus,
conservation initiatives and the construction of the lodges are yielding positive conservation
results in both countries in terms of wildlife conservation. However, unlike Rwanda, Botswana
residents are experiencing more negative impacts in the form of human-wildlife conflicts, due to
lack of boundary walls or fences and other wildlife management strategies. Therefore, it is
important and urgent to put in place mechanisms to deal with human-wildlife conflicts
particularly in Botswana.

74
CONCLUSION
This project had two primary objectives: to investigate the social and economic impacts of
lodges, and local community attitudes towards conservation and tourism. The quantitative and
qualitative data both show that high-end tourism lodges can make a considerable contribution to
local development and poverty reduction. The study found evidence of socio-economic benefits
and behaviour modification towards conservation and tourism in Botswana and Rwanda. It was
observed that staff received more socio-economic benefits compared to community residents.
Nevertheless, both staff and community residents generally expressed positive attitudes towards
conservation, and further emphasised the contribution of the lodges to local development, tourism
development and environmental conservation.
Key socio-economic impacts of the lodges amongst the staff were jobs, skills training, bonuses,
pensions, accommodation, food, transport and medical aid. Community-based development
projects were also identified by the community residents and included piggery and poultry
farming, construction of school blocks and houses for the poor, scholarship for high achieving
children, provision of water tanks, electrification projects, seed multiplications project, and
supply of computers to local schools. These benefits had considerable impacts on poverty
reduction and community development. Between the two countries, community residents in
Rwanda were shown to have greater positive socio-economic impacts from the lodges compared
to those in Botswana, as the activities of the lodges were visible and known to the local
community.
Not only are there many direct socio-economic impacts of the lodges activities on both the
community residents and the staff, there are indirect benefits which had positive implications on
poverty reduction. For example, the average staff member earns more than the average
community residents, supports four people, owns more assets, and spends more in the local
community compared to average community residents. This has far reaching implications on
poverty reduction. This would explain why the majority of the community respondents who are
not lodge employees still reported and emphasised the contribution of the lodges to poverty
reduction in the local communities, despite not directly benefiting.
75
Across the two countries, it is often the vulnerability of the local communities and the risks they
experience that result in less positive attitudes towards conservation and tourism. As discussed,
despite the overall positive attitudes towards conservation and tourism, the costs, in terms of
human-wildlife conflicts, that the communities have to bear are considerable. This situation is
mostly widespread in Botswana where the majority of the respondents reported cases of human-
wildlife conflicts, and limited benefits associated with the lodge. In this case, it is not surprising
that some (14%) respondents in Botswana held negative attitudes towards conservation, and
argued that the government prioritises wildlife over humans.
Overall, the project demonstrated that high-end lodges can contribute to socio-economic
development and poverty reduction in rural communities in Africa. Moreover, the lodges were a
factor that was shown to affect attitudes towards conservation. Thus, with little improvement in
the management of the lodges, sustainable future positive attitudes towards conservation and
tourism can be ensured in the local communities.
RECOMMENDATIONS
The findings of this study have highlighted some important issues that need to be considered to
ensure widespread benefits of the lodges for the local communities, and further stimulate local
communities support for conservation and tourism. These issues are discussed in the following
paragraphs
1. The purpose of establishing the lodges and the community trusts and their relationship
should be promoted, as well as their roles to the local community and lodge guests.
Community awareness programmes directed towards improving the visibility of the
community trusts’ projects in the local community should be undertaken. For example,
the employment of a Community Education Officer by the community trust or lodge or
the use of community signboards.
2. To stimulate continued community support for conservation, public education on the use
of alternative sources of energy, particularly for cooking would go a long way towards
change of behaviour regarding the use of firewood from the conservation area.

76
3. The survey results indicate that although the lodges have provided the staff with certainty
of employment and reliability of income, some staff were unhappy with issues relating to
job satisfaction (such as lack of increment in salaries), personal growth and empowerment
(such as limited formal training for staff particularly contract and temporary staff), and
lack of involvement in management decisions making. Working conditions should
therefore be regularly assessed and staff involved in decisions affecting their welfare,
providing adequate training for staff, and reassessing the salary structure of the staff.
4. Lodge staff positions should be advertised in a transparent manner to allow any
community members to apply for the positions, particularly if the joint venture agreement
states that a certain number of staff must be employed from the community trust area. The
lodge operators should promote to guests that a large percentage of their staff are from the
local community and that the community is benefitting from the lodge revenue.
5. Key factors in the success of the private lodge operator and community trust partnership
appear to be the process used to set up and establish the community trust and its
governance structure and operational framework. It is recommended that for future
partnerships supported by AWF significant financial and human resources are allocated to
establish, support and train community trust boards and members to ensure a strong,
sound and sustainable trust. Capacity building should also be incorporated into such a
support program. This support may be provided by a local NGO such as the International
Gorilla Conservation Project as in the case of SACOLA. It is also important that the trust
develops a logical, systematic and informed decision making framework to prioritise and
allocate revenue to benefit the community and environment. For example gaining advice
from local social workers on families in need, local government, using poverty indices
and poverty alleviation reports, surveying the community on community needs.
6. Opportunities for the community trusts to work in collaboration with other government or
NGO initiatives should be investigated by the trusts.
7. There should also be on-going support and monitoring for community trusts by
independent parties such as a NGO.
8. Regular communication channels and methods need to be established and formally agreed
between the private operator and the community trust to ensure transparency, effective
and genuine discussion and joint decision making. Face-to-face meetings should be part

77
of the communication process. It is also important that both parties monitor and regularly
consult the written agreement to ensure that all the clauses in the agreement are being
adhered to and followed such as staff training and communication between the parties. A
review of the joint venture agreement is required on a regular basis by all parties as well
as a review of the community trust and its activities.
9. During the establishment phase of the lodge opportunities to benefit the local community
should be investigated and agreements made for example purchasing supplies such as
eggs, milk, honey, vegetables from the local community. These types of arrangements
have the capacity to provide benefits to the local community and also cost savings to the
lodge.
10. It must be clear to all parties especially the community trust the time commitment of the
AWF and other parties in relation to their involvement and establishment of the trust. An
exit strategy is needed when AWF or other parties remove their resources and/or support.
11. The lodges should develop a social responsibility policy and community development
objectives. One of the roles of the lodge manager could be to liaise with the community
trust to ensure good communication and identify commercial opportunities for the
community.
Proposed Methodologies for Future Assessment of Socio-Economic Impacts of
Conservation Enterprises
A number of possible options exist for future assessment of social and economic impacts of
AWF conservation enterprises. The methodologies discussed below can be used individually or
in combination. If a number of research methods are used the results can be triangulated to
develop a picture of the socio-economic impacts of an enterprise. Triangulation is often used to
indicate that two (or more) research methods are used in a study in order to check the results.
Triangulation is a powerful technique that facilitates validation of data through cross verification
from two or more sources. In particular, it refers to the application and combination of several

78
research methods in the study of the same phenomenon. In the case of the current study the
results can be used as baseline data for comparison with future studies on tourist lodges.
Social media particularly Facebook could be used as a survey instrument in assessing the socio-
economic impacts of enterprises amongst staff. For example, findings from the present study
revealed that all the staff respondents across the two countries are literate, and have a social
media (Facebook) account. This approach could be a cost-effective and easy method to evaluate
staff’s perceptions and experiences regarding AWF enterprises using social media. Such an
approach would involve first, creating a group name (e.g., AWF staff) Facebook. Second, staff
members would be added/ invited to the group. Third, questions regarding AWF enterprises
could be posted on the group’s page and staff members asked to share their experiences and
views, usually in a period of one to three weeks. Finally, responses could be collated and
analysed, in addition to probing for further clarifications. Findings from such surveys could also
be shared with the staff members on the same group platform. Opportunities also exist to conduct
a staff meeting or focus group with a random sample of staff.
At the community level, community meetings, focus groups or workshops could be used to
evaluate socio-economic impacts. In order to ensure that data collected reflects the perspectives
of different groups of community residents, community meetings could be held in each
community with three different groups: for example a group including community leaders, youth
leaders, and opinion leaders; another with females in the community; and lastly with male
community members. This approach would ensure a cross-sectional representation of community
views, and also prevent a particular group or individuals from being dominant or excluded. It
would also considerably reduce the cost of, and time spent on individual face-to-face interviews.
In addition, in communities where groups such as community-based organisations (CBOs) exist,
they can be important source of data on AWF projects. In using the community meetings
approach, a checklist of the key that AWF is seeking to answer could be used as an interview
guide to stimulate the conversation. The meetings should be recorded either with notes or audio
recorded and the data analysed. Interviews with selected key informants could also be undertaken
including community leaders, government representatives, enterprise managers and owners, local
government representatives and community trust representatives.

79
Quantitative data could also be accessed from national and/or local government statistics such as
existing census and socio-economic reports for demographic, economic, employment, income,
public services data that would provide information on broader socio-economic conditions in the
communities. Other secondary sources of information may be available from research reports and
papers, project reports, marketing bodies and government reports.
A methodology similar to the current study could also be applied. Face-to-face structured surveys
are an effective data collection method in a developing country situation and are easy to analyse
using SPSS. It is recommended that closed and open ended questions are used. Translators must
be used during the survey work to assist researchers. Appropriate human ethics approvals are
required to undertake any social research and research permits must be gained from each country
well in advance of the project commencement. Information sheets and informed consent forms
must be translated into the national language and given to all study participants. Translators must
sign a confidentially agreement. A revised survey is provided in Appendix 5. This survey would
need modifying depending on the type of conservation enterprise being studied. Semi-structured
interviews with relevant stakeholders are optional but can provide rich and detailed data to follow
up specific topics or issues identified in the survey data. An interview guide should be developed
prior to commencing the interview to guide the interview.

80
REFERENCES
African Development Bank (2009). Botswana: 2009-2013 Country Strategy Paper. Regional
Department-South Region A, Botswana.
Bennett, N. J. & Dearden, P. (2014). Why local people do not support conservation: Community
perceptions of marine protected area livelihood impacts, governance and management in
Thailand. Marine Policy, 44, 107-116.
Elliott, J. & Sumba, D. (2010). Conservation enterprise: What works, where and for whom?
London: International Institute for Environment and Development.
Kiss, A. (2004). Is community-based ecotourism a good use of biodiversity funds? Trends in
Ecology and Evolution, 19(5), 232-237.
Maipose, G.S. (2008). Institutional dynamics of sustained rapid economic growth with limited
impact on poverty reduction. A report prepared for the UNRISD project on Poverty
Reduction and Policy Regimes, January, 2008, Geneva. Accessed 09/03/2015.
http://www.unrisd.org/80256B3C005BCCF9/(httpAuxPages)/4365C57157F8EF16C1257A
EF00525641/$file/Botswana%20Maipose%20web.pdf
Mitchell, J. & Ashley, C. (2010). Tourism and poverty reduction: Pathways to prosperity.
London: Earthscan.
National Institute of Statistics Rwanda (2006). Preliminary Poverty Update Report, Integrated
Living Conditions Survey 2005/06, December 2006, Rwanda.
Snyman, S. L. (2012). The role of tourism employment in poverty reduction and community
perceptions of conservation and tourism in southern Africa. Journal of Sustainable
Tourism, 20:3, 395-416.
Snyman, S. L. (2013). High-end ecotourism and rural communities in southern Africa: A
socioeconomic analysis. PhD dissertation, School of Economics, Faculty of Commerce,
University of Cape Town, South Africa.

81
Snyman, S. L. (2013). Household spending patterns and flow of ecotourism income into
communities around Liwonde National Park, Malawi. Development South Africa, 30:4-5,
640-658.
Spenceley, A. (Ed.) (2008). Responsible Tourism: Critical issues for conservation and
development. London: Earthscan.
UNDP, (2007). Turning Vision 2020 into Reality: From Recovery to Sustainable Human
Development. National Human Development Report, Kigali, Rwanda.
Van der Duim, R. (2011). New institutional arrangements for tourism, conservation and
development in sub-Saharan Africa. In V.R. Van der Duim, D. Meyer, J. Saarinen, & K.
Zellmer (Eds.), New alliances for tourism, conservation and development in Eastern and
Southern Africa (pp. 83-106). Delft: Eburon Academic Publishers.
Van Wijk, J., Van der Duim, R., Lamers, M. & Sumba, D. (2014). The emergence of institutional
innovations in tourism: the evolution of the African Wildlife Foundation’s tourism
conservation enterprises. Journal of Sustainable Tourism, DOI:
10.1080/09669582.2014.927878.
WCED (1987). Our Common Future, Report of the Brundtland Commission, U.K: Oxford
University Press.

82
APPENDICES
Appendix 1 Questionnaires
Staff survey for Ngoma Safari Lodge
STAFF SURVEY SURVEY ID.
_____
INTERVIEWER _________
TRANSLATED
I am Rosemary Black, a researcher with Charles Sturt University in Australia and I am doing some research for the African Wildlife Foundation
that is associated with the Ngoma Safari Lodge. You have been chosen to participate in a survey on the social and economic impacts of tourist
lodges on local communities. Your answers will be voluntary and will be kept strictly confidential. You are not obliged to answer any questions
and may ask the interviewer to skip a question should you wish to. Your answers will be put together with many other answers and will be used
at a general level so that no-one will be able to identify individuals from your responses. Thank you for your time.
STAFF SURVEY
PERSONAL INFORMATION
1. Age
2. Gender
3. Ethnic group
4. Home village
5. Home language
6. Other languages (specify)
SPEAK READ WRITE
MALE FEMALE Prefer not to answer
Prefer not to answer
SPEAK READ WRITE

83
7. Marital status
TRADITIONAL MARRIED DIVORCED WIDOWER Long term relationship
SINGLE OTHER (specify)
8. No. of children (incl. deceased, please specify)
9. Number of dependents (incl. Children & others)
10. In what type of dwelling to you live at home?
Brick dwelling with thatch roof
Brick dwelling with iron/asbestos roof
Brick dwelling with tiled roof
10. Traditional dwelling
Thatch roof Iron roof
10 Other (specify)
11. Total no. of people living in household over the period of a year (incl. you)
12. Is the head of the household male or female?
13. What is their occupation/what work do they do?
14. No. of males in the household
15. No of females in the household
16. No. of people in each age category in the household
MALE FEMALE
0-10 years
11-20 years
21-30 years
31-40 years
MALE FEMALE How old are
they?

84
41-50 years
51-60 years
61 years +
17. Access to electricity in your home?
18. What do you use for lighting in your home?
electricity gas paraffin candles solar
firewood nothing generator
19. Access to running water inside your home?
20. If NO, what type of water do you use?
borehole outside tap river Dam/lake rain Public tap well
21. How far do you travel to get water?
22. What form of toilet do you use?
Flush toilet Pit latrine Bush
23. What do you do with your rubbish/refuse/waste?
Council Dump Burn Bury Throw in bush
EDUCATION
24. Highest grade passed
25. If not completed, what is the main reason for not completing schooling?
Money Pregnant Family. Resp. Illness Too far
Marriage N/A Livestock carer Other (specify)
26. Any further education?
27. Any skills training ?
28. What year did your start working for the Ngoma Safari Lodge?
29. Current position?
30. Is the position
YES NO
YES NO
minutes

85
Permanent Seasonal Casual Probation Contract
31. Other positions held with the Ngoma Safari Lodge during employment?
32. Gross monthly salary
33. Benefits received at work e.g. gratuities, uniform etc.
(Please list and give average monthly value, where applicable)
Uniform Food Accommodation Transport home
Pension Medical aid Gratuities – how much/week? Funeral
34. Training provided by employer (formal or on-the-job)
On-the-job training Formal No training
35. How do you intend to support yourself upon retirement?
Don’t know
On a scale of 1-5 where 1 is strongly agree and 5 is strongly disagree (hand prompt card)
36. Do you feel there are job growth opportunities with the Ngoma Safari Lodge?
37. Do you think the Ngoma Safari Lodge promotes personal growth & empowerment?
38. Do you have job satisfaction with the Lodge?
39. If Poor satisfaction, why?
40. Is this your first permanent (formal) job?
HOUSEHOLD INFORMATION
41. Do you engage in subsistence farming (i.e. growing food for the household to eat)?
Yes No
42. Other household income sources? (e.g. livestock sales, grants, pension etc) please list & give average monthly value
Value Specify if per day/month/year
Farming – cattle, goats, crops, chickens etc
Fishing
Yes No

86
Crafts/curios
Spouse/family income
Piece work/casual labour
Grants/pension
Other (specify)
43 AVERAGE MONTHLY HOUSEHOLD EXPENSES
Accommodation (rent)
Food
Education/schooling (school fees) specify if per term or month
Electricity
Water (specify if per month or per year)
Telephone/airtime
Alcohol/cigarettes
Childcare/domestic help/casual labour
Paraffin/gas/candles/batteries
Cleaning materials (Omo, floor polish, etc)
Personal items (toothpaste, deodorant etc)
Transport/taxis
Fuel expenses (diesel, petrol etc)
Municipal/service charges
Dependents – over & above food, education etc
Accounts/instalments (name & specify amount)
Loan payments
Savings
Medical or life insurance
Medical expenses/medial aid – clinic, medicines etc (annual)
Clothes (annual)
Other expenses (list) e.g. pension etc
43. Does your household own any of the following:
Motor vehicle/car
Motorbike
Television
Mobile phone
Bicycle
Radio
Computer
Cattle
Goats/chickens
Stove
Fridge
HEALTH AND SAFETY
44. Would you say your health is:
A C
YES NO If YES Number
G E S
G E S

87
Excellent Good Average Poor Very poor
45. Do you feel safe from crime where you live at home?
Very Moderately Not very Not at all
CONSERVATION AREA
46. On a scale of 1-5 where 1 is strongly agree and 5 is strongly disagree (hand prompt card) how much do you agree with the following statement? (Hand prompt card)
The Lodge is good for jobs?
47. Are any of your family employed in any tourism or conservation related businesses?
Yes No
48. Who are they employed by? e.g. National parks, private etc -
________________________________________________________________________
49. Do you think the Ngoma Safari Lodge has helped to reduce poverty in the area (made local people less poor?)
Yes No Don’t know
5 0 . H a v e y o u n o t i c e d a n y c h a n g e s i n t h e v i l l a g e s i n c e N g o m a S a f a r i L o d g e w a s b u i l t ?
Yes No Don’t know
51. Has there been any positive change (anything good) in the villages s i n c e Ngoma Safari Lodge was built and other tourism?
Yes No Don’t know
52 Which of the following do you think currently provides the most jobs in this area? (Hand prompt card)
Tourism Fishing Agriculture Hunting Crafts
Government Cattle/goat farming Don’t know Other (specify)
52. Which of the following do you think benefits/helps the local people/community the most? (Hand prompt card)
Tourism Fishing Agriculture Hunting Crafts
Government Cattle/goat farming Don’t know Other (specify)
53. Has there been any negative changes (anything bad) in the surrounding villages as a result of the Ngoma safari Lodge and other
tourism?
Yes No Don’t know

88
54. Do you or any of your family collect wood/plants or get food from the conservation area?
55. Do you know if any community projects or work that the Ngoma Safari Lodge does that helps the local
children or people?
56. If YES, please list ________________________________________________________________________
57. Do you think it is important to conserve/look after animals, water, plants etc
Yes No Don’t know
58. Why? ____________________________________________________________________
59. Do you have any problems with wild animals in your home village ?
Yes No
60. If YES, what animals ?
Lion Elephant Hyena Crocodile Baboon Hippo
Buffalo Monkeys Jackal Other (specify)
61. Have the problems increased or decreased since the lodge opened?
62. Have the number of animals you’ve seen increased or decreased since the lodge opened?
63. Have you been in the conservation area other than for work ?
Yes No If yes, why
64. Would you like to visit the conservation area with your family ?
Yes No
65. Why? __________________________________________________________________
66. Do you have any other comments on Ngoma Lodge and tourism in this area?
______________________________________________________________________________________________________________________
______________________________________________________________________________________________________________________
_____________________________________________________________
Thank you for your time
Yes No
Yes No
Increased Decreased
Increased Decreased

89
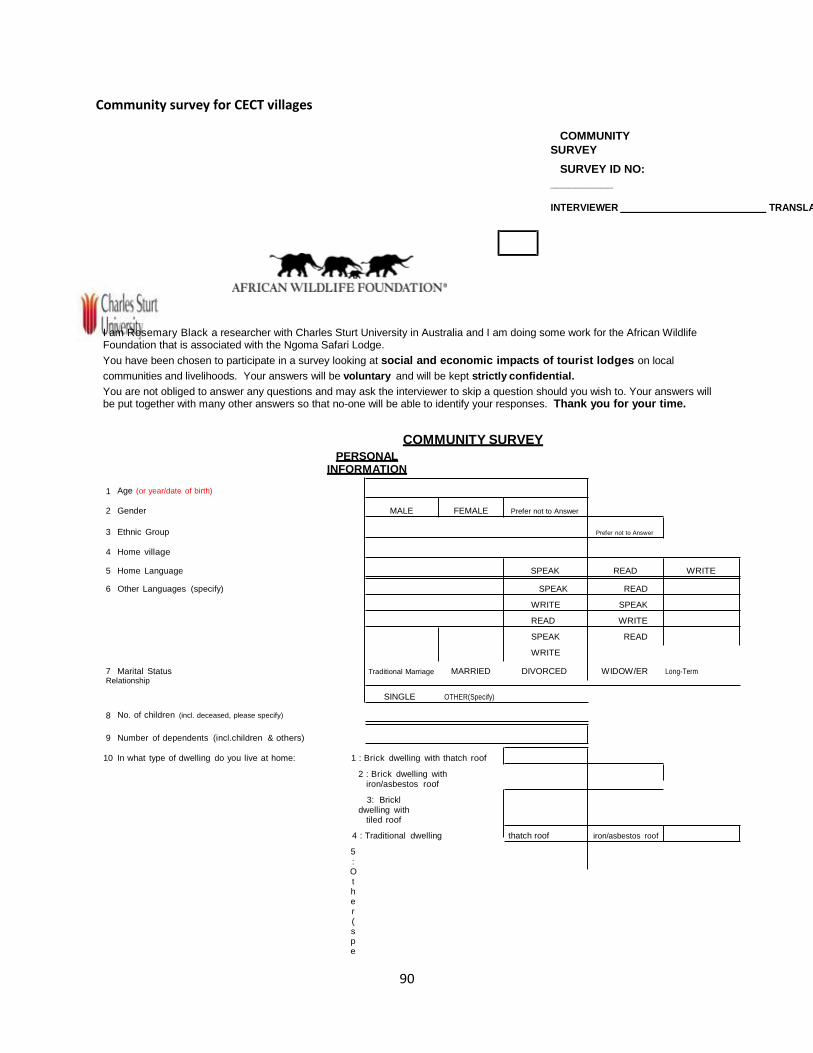
90
Community survey for CECT villages
COMMUNITY
SURVEY
SURVEY ID NO:
__________
INTERVIEWER TRANSLATED
I am Rosemary Black a researcher with Charles Sturt University in Australia and I am doing some work for the African Wildlife Foundation that is associated with the Ngoma Safari Lodge.
You have been chosen to participate in a survey looking at social and economic impacts of tourist lodges on local
communities and livelihoods. Your answers will be voluntary and will be kept strictly confidential.
You are not obliged to answer any questions and may ask the interviewer to skip a question should you wish to. Your answers will be put together with many other answers so that no-one will be able to identify your responses. Thank you for your time.
COMMUNITY SURVEY
PERSONAL INFORMATION
1 Age (or year/date of birth)
2 Gender MALE FEMALE Prefer not to Answer
3 Ethnic Group Prefer not to Answer
4 Home village
5 Home Language SPEAK READ WRITE
6 Other Languages (specify) SPEAK READ
WRITE SPEAK
READ WRITE
SPEAK READ
WRITE
7 Marital Status Traditional Marriage MARRIED DIVORCED WIDOW/ER Long-Term Relationship
SINGLE OTHER(Specify)
8 No. of children (incl. deceased, please specify)
9 Number of dependents (incl.children & others)
10 In what type of dwelling do you live at home: 1 : Brick dwelling with thatch roof
2 : Brick dwelling with iron/asbestos roof
3: Brickl dwelling with
tiled roof
4 : Traditional dwelling thatch roof iron/asbestos roof
5 : Other (spe
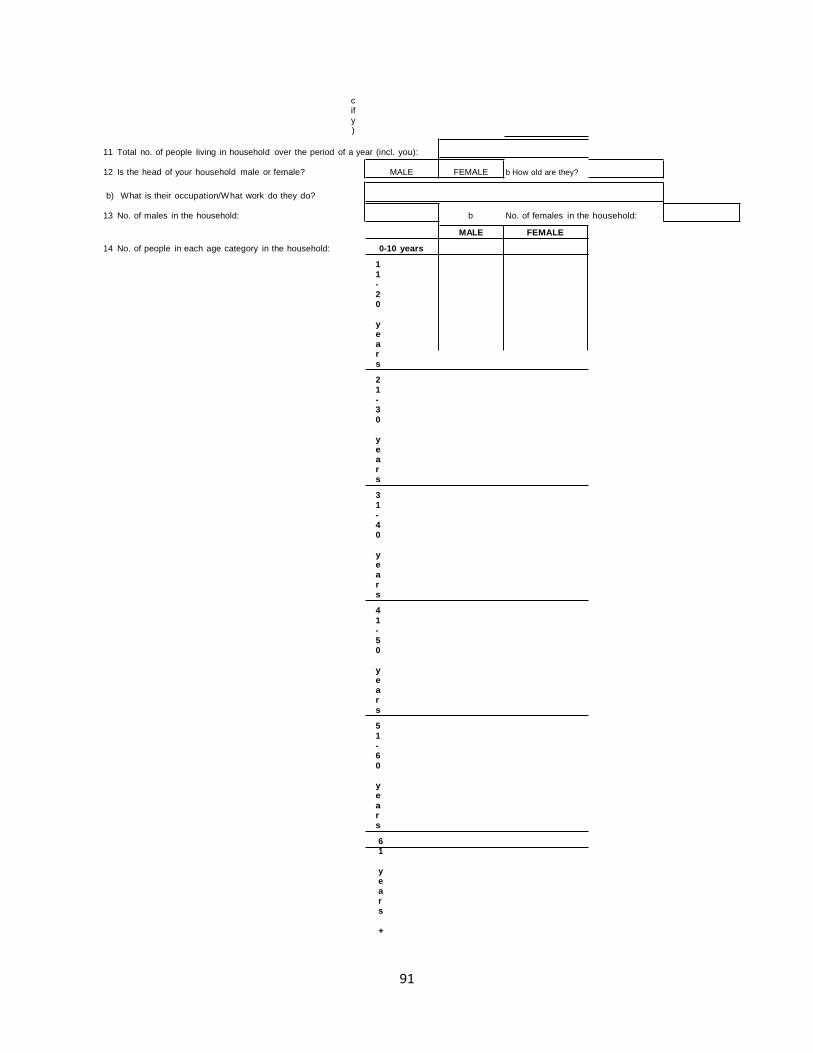
91
cify)
11 Total no. of people living in household over the period of a year (incl. you):
12 Is the head of your household male or female? MALE FEMALE b How old are they?
b) What is their occupation/What work do they do?
13 No. of males in the household: b No. of females in the household:
MALE FEMALE
14 No. of people in each age category in the household: 0-10 years
11-20 years
21-30 years
31-40 years
41-50 years
51-60 years
61 years +

92
schooling?
MONEY
PREGNANT
FAM RESP.
ILLNESS
TOO FAR
MARRIAGE
NOT APPLICABLE LIVESTOCK CARER
Permanent Seasonal Casual Probation Contract
Nett Monthly Salary
Uniform Food Accommodation Transport home Pension Medical Aid Gratuities (give amt.)
On-the-job Formal No training
Don't Know
YES
NO
Would like to work, but you can't find a job?
Can't work (give reason) -e.g. sick, too old, looking after family
Don't want to work
Self-employed
Other (specify)
15 Access to electricity in your home? YES NO
16 What do you use for lighting in your home? ELECTRICITY GAS PARAFFIN CANDLES SOLAR FIREWOOD NOTHING GENERATOR
17 What do you use to cook food? FIREWOOD GAS STOVE SOLAR CHARCOAL
18 Access to running water inside your home? YES NO
b If NO, what type of water do you use? BOREHOLE OUTSIDE TAP RIVER DAM/LAKE RAIN
19 How far do you travel to get water? (in minutes) minutes PUBLIC
TAP WELL
20 What form of toilet do you use? FLUSH TOILET PIT LATRINE BUSH
21 What do you do with your rubbish/refuse/waste? COUNCIL DUMP BURN BURY Throw in the BUSH
EDUCATION
22 Highest Grade/Standard Passed
23 If not completed, what is the main reason for not completing
24 Any Further Education
25 Any Skills or Skills Training
26 Current employer (if unemployed go to No. 34)
27 Current Position
28 When did you start?
29 Is the position? (if not permanent, include Q 33)
30 Gross Monthly Salary
31 Benefits received at work e.g. gratuities, uniform, etc.
Av. Monthly value
32 Training provided by employer
33 How do you intend to support yourself upon retirement?
34 Have you ever had a permanent job before?
35 If unemployed, how long have you been unemployed?
36 If unemployed, why are you unemployed?
WORK EXPERIENCE (if employed then complete Q 26 - Q 34 & then skip to Q 37)

93
Farming - cattle, goats, crops, chickens Fishing Crafts/Curios Spouse/Family Income Piece work/Casual Labour Grants/Pension - disability, child grant, pension Other (Specify)
YES
NO
Excellent
Good
Average
Poor
Very Poor
VERY
MODERATELY
NOT VERY
NOT AT ALL
HOUSEHOLD INFORMATION
37 Other Household Income Sources? Value (in Pula) Specify if per day/month/year
38 Do you engage in subsistence farming (i.e. grow food at home to eat)?
39 AVERAGE MONTHLY HOUSEHOLD EXPENSES Local currency
Accommodation (Rent) per month Food
per month Education/Schooling (School fees) - specify if per term or month
Electricity per month
Water (specify if per month or per year)
Telephone/Airtime per month
Alcohol/Cigarettes A: C: per month
Childcare/Domestic Help/Casual Labour per month
Paraffin/Gas/Candles/Batteries per month
Cleaning Materials (e.g. Omo, Floor Polish (Cobra), etc.) per month
Personal Items (Toothpaste, deodrant, Vaseline, Dawn, etc.) per month
Transport/Taxis per month Fuel
expenses (diesel, petrol, etc.) per month
Municipal/Service Charges per month
Dependents - over & above food, education, etc. per month Pula
Accounts/Instalments (name and specify amount)
Loan payments For? Savings per month Medical or Life Insurance per month Medical Expenses - clinic, medicines, etc. (annual amt.) per year Clothes (annual amount) per year Other Expenses (list) per month
40 Does your household own any of the following: If YES, Number Motor Vehicle/Car
Motor bike
YES NO Motor bike YES NO Television
Television
YES NO Mobile Phone YES NO Bicycle YES NO Radio YES NO Computer YES NO Cattle YES NO Goats/Chickens YES NO G: C: Stove YES NO GAS ELECTRIC SOLAR
Fridge YES NO GAS ELECTRIC SOLAR
HEALTH AND SAFETY
41 Would you say your health is?
43 Do you feel safe from crime where you live at home?
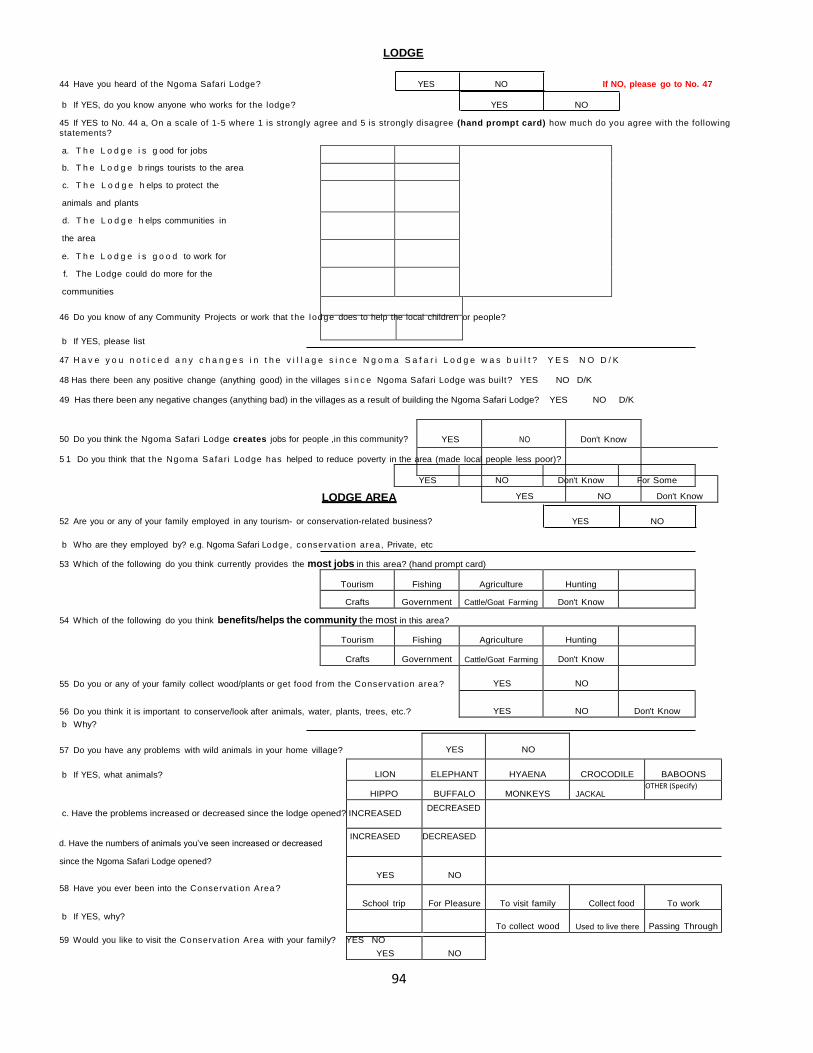
94
YES
NO
Don't Know
YES
NO
Don't Know
Tourism
Fishing
Agriculture
Hunting
Crafts
Government
Cattle/Goat Farming
Don't Know
YES
NO
YES
NO
Don't Know
YES
NO
LION
ELEPHANT
HYAENA
CROCODILE
BABOONS
HIPPO
BUFFALO
MONKEYS
JACKAL OTHER (Specify)
DECREASED
INCREASED DECREASED
YES
NO
School trip
For Pleasure
To visit family
Collect food Snare
To work
To collect wood
Used to live there
Passing Through
YES
NO
LODGE 44 Have you heard of the Ngoma Safari Lodge? YES NO If NO, please go to No. 47
b If YES, do you know anyone who works for the lodge? YES NO
45 If YES to No. 44 a, On a scale of 1-5 where 1 is strongly agree and 5 is strongly disagree (hand prompt card) how much do you agree with the following statements?
a. T h e L o d g e i s g ood for jobs
b. T h e L o d g e b rings tourists to the area
c. T h e L o d g e h elps to protect the
animals and plants
d. T h e L o d g e h elps communities in
the area
e. T h e L o d g e i s g o o d to work for
f. The Lodge could do more for the
communities
46 Do you know of any Community Projects or work that the l odge does to help the local children or people?
b If YES, please list
47 H a v e y o u n o t i c e d a n y c h a n g e s i n t h e v i l l a g e s i n c e N g o m a S a f a r i L o d g e w a s b u i l t ? Y E S N O D / K 48 Has there been any positive change (anything good) in the villages s i n c e Ngoma Safari Lodge was built? YES NO D/K 49 Has there been any negative changes (anything bad) in the villages as a result of building the Ngoma Safari Lodge? YES NO D/K
50 Do you think the Ngoma Safari Lodge creates jobs for people ,in this community?
5 1 Do you think that the Ngoma Safar i Lodge has helped to reduce poverty in the area (made local people less poor)?
YES
NO
Don't Know
For Some
LODGE AREA
52 Are you or any of your family employed in any tourism- or conservation-related business? YES NO
b Who are they employed by? e.g. Ngoma Safari Lodge, conservat i on area, Private, etc
53 Which of the following do you think currently provides the most jobs in this area? (hand prompt card)
Tourism
Fishing
Agriculture
Hunting
Crafts Government
Cattle/Goat Farming Don't Know
54 Which of the following do you think benefits/helps the community the most in this area?
55 Do you or any of your family collect wood/plants or get food from the Conservation area?
56 Do you think it is important to conserve/look after animals, water, plants, trees, etc.?
b Why?
57 Do you have any problems with wild animals in your home village?
b If YES, what animals?
c. Have the problems increased or decreased since the lodge opened? INCREASED
d. Have the numbers of animals you’ve seen increased or decreased
since the Ngoma Safari Lodge opened?
58 Have you ever been into the Conservation Area?
b If YES, why?
59 Would you like to visit the Conservation Area with your family? YES NO

95
b Why?
60. Do you have any other comments about Ngoma Lodge and tourism in this area?
_____________________________________________________________________________________________________________________
_____________________________________________________________________________________________________________________
_____________________________________________________________________________________________________________________
Thank you for your time

96
Staff survey for Sabyinyo Silverback Lodge
STAFF SURVEY SURVEY ID. _____
INTERVIEWER _________
TRANSLATED
I am Rosemary Black, a researcher with Charles Sturt University in Australia and I am doing some research for the African Wildlife Foundation that is associated
with the Sabyinyo Silverback Lodge. You have been chosen to participate in a survey on the social and economic impacts of tourist lodges on local
communities. Your answers will be voluntary and will be kept strictly confidential. You are not obliged to answer any questions and may ask the interviewer to
skip a question should you wish to. Your answers will be put together with many other answers and will be used at a general level so that no-one will be able to
identify individuals from your responses. Thank you for your time.
STAFF SURVEY
PERSONAL INFORMATION
1. Age
2. Gender
3. Home village
4. Home language
5. Other languages (specify)
SPEAK READ WRITE
6. Marital status
TRADITIONAL MARRIED DIVORCED WIDOWER Long term
relationship
SINGLE OTHER (specify)
7. No. of children (incl. deceased, please specify)
MALE FEMALE Prefer not to answer
SPEAK READ WRITE

97
8. Number of dependents (incl. Children & others)
9. In what type of dwelling to you live at home?
Brick dwelling with thatch roof
Brick dwelling with iron/asbestos roof
Brick dwelling with tiled roof
10. Traditional dwelling
Thatch roof Iron roof
Other (specify)
11. Total no. of people living in household over the period of a year (incl. you)
12. Is the head of the household male or female?
13. What is their occupation/what work do they do?
14. No. of males in the household
15. No of females in the household
16. No. of people in each age category in the household
MALE FEMALE
0-10 years
11-20 years
21-30 years
31-40 years
41-50 years
51-60 years
61 years +
Access to electricity in your home?
17. What do you use for lighting in your home?
electricity gas paraffin candles solar
firewood nothing generator
MALE FEMALE How old are they?
YES NO

98
18. What do you use for cooking?
FIREWOOD GAS STOVE SOLAR CHARCOAL
19. Access to running water inside your home?
20. If NO, what type of water do you use?
borehole outside tap river Dam/lake rain Public tap well
21. How far do you travel to get water?
22. What form of toilet do you use?
Flush toilet Pit latrine Bush
23. What do you do with your rubbish/refuse/waste?
Council Dump Burn Bury Throw in bush
EDUCATION
24. Highest grade passed
25. If not completed, what is the main reason for not completing schooling?
Money Pregnant Family. Resp. Illness Too far
Marriage N/A Livestock carer Other (specify)
26. Any further education?
27. Any skills training ?
28. What year did your start working for the Lodge?
29. Current position?
30. Is the position
Permanent Seasonal Casual Probation Contract
31. Other positions held with the Lodge during employment?
32. Gross monthly salary
33. Benefits received at work e.g. gratuities, uniform etc.
YES NO
minutes

99
(Please list and give average monthly value, where applicable)
Uniform Food Accommodation Transport home
Pension Medical aid Gratuities – how much/week? Funeral
34. Training provided by employer (formal or on-the-job)
On-the-job training Formal No training
35. How do you intend to support yourself upon retirement?
Don’t know
On a scale of 1-5 where 1 is strongly agree and 5 is strongly disagree (hand prompt card)
36. Do you feel there are job growth opportunities with the Sabyinyo Silverback Lodge?
37. Do you think the Sabyinyo Silverback Lodge promotes personal growth & empowerment?
38. Do you have job satisfaction with the Lodge?
39. If Poor satisfaction, why?
40. Is this your first permanent (formal) job?
HOUSEHOLD INFORMATION
41. Do you engage in subsistence farming (i.e. growing food for the household to eat)?
42. Other household income sources? (e.g. livestock sales, grants, pension etc) please list & give average monthly value
Value Specify if per day/month/year
Farming – cattle, goats, crops, chickens etc
Fishing
Crafts/curios
Spouse/family income
Piece work/casual labour
Grants/pension
Other (specify)
Yes No
Yes No
100
43. AVERAGE MONTHLY HOUSEHOLD EXPENSES
Accommodation (rent)
Food
Education/schooling (school fees) specify if per term or month
Electricity
Water (specify if per month or per year)
Telephone/airtime
Alcohol/cigarettes
Childcare/domestic help/casual labour
Paraffin/gas/candles/batteries
Cleaning materials (Omo, floor polish, etc)
Personal items (toothpaste, deodorant etc)
Transport/taxis
Fuel expenses (diesel, petrol etc)
Municipal/service charges
Dependents – over & above food, education etc
Accounts/instalments (name & specify amount)
Loan payments
Savings
Medical or life insurance
Medical expenses/medial aid – clinic, medicines etc (annual)
Clothes (annual)
Other expenses (list) e.g. pension etc
44. Does your household own any of the following:
Motor vehicle/car
Motorbike
Television
Mobile phone
Bicycle
Radio
Computer
Cattle
Goats/chickens
Stove
Fridge
HEALTH AND SAFETY
45. Would you say your health is:
Excellent Good Average Poor Very poor
46. Do you feel safe from crime where you live at home?
Very Moderately Not very Not at all
CONSERVATION AREA
47. On a scale of 1-5 where 1 is strongly agree and 5 is strongly disagree (hand prompt card) how much do you agree with the following statement? (Hand prompt card)
The Lodge is good for jobs?
48. Are any of your family employed in any tourism or conservation related businesses?
A C
Per year
Per year
YES NO If YES Number
G E S
G E S
Yes No

101
49. Who are they employed by? e.g. National parks, private etc ________________________________________________________________________
50. Do you think the Sabyinyo Silverback Lodge has helped to reduce poverty in the area (made local people less poor?)
Yes No Don’t know
5 1 . H a v e y o u n o t i c e d a n y c h a n g e s i n t h e v i l l a g e s i n c e t h e S a b y i n y o S i l v e r b a c k L o d g e w a s b u i l t ?
Yes No Don’t know
52. Has there been any positive change (anything good) in the villages s i n c e t h e S a b y i n y o S i l v e r b a c k Lodge was built and other tourism?
Yes No Don’t know
52 Which of the following do you think currently provides the most jobs in this area? (Hand prompt card)
Tourism Fishing Agriculture Hunting Crafts
Government Cattle/goat
farming
Don’t know Other (specify)
53. Which of the following do you think benefits/helps the local people/community the most? (Hand prompt card)
Tourism Fishing Agriculture Hunting Crafts
Government Cattle/goat
farming
Don’t know Other (specify)
54. Has there been any negative changes (anything bad) in the surrounding villages as a result of the Sabyinyo Silverback Lodge and other tourism?
Yes No Don’t know
55. Do you or any of your family collect wood/plants or get food from the conservation area?
56. Do you know if any community projects or work that the Sabyinyo Silverback Lodge does that helps the local children or people?
57. If YES, please list ________________________________________________________________________
58. Do you think it is important to conserve/look after animals, water, plants etc
Yes No Don’t know
59. Why? ____________________________________________________________________
Yes No
Yes No

102
61. Do you have any problems with wild animals in your home village ?
Yes No
62. If YES, what animals ?
Lion Elephant Hyena Crocodile Baboon Hippo
Buffalo Monkeys Jackal Other
(specify)
63. Have the problems increased or decreased since the lodge opened?
64. Have the number of animals you’ve seen increased or decreased since the lodge opened?
65. Have you been in the conservation area other than for work ?
Yes No If yes, why
66. Would you like to visit the conservation area with your family ?
Yes No
67. Why? __________________________________________________________________
68. Do you have any other comments on Sabyinyo Silverback Lodge and tourism in this area?
_____________________________________________________________________________________________________________________
_____________________________________________________________________________________________________________________
_______________________________________________________________
Thank you for your time
Increased Decreased
Increased Decreased

103
Community survey for SACOLA villages
COMMUNITY SURVEY
SURVEY ID NO: __________
INTERVIEWER
TRANSLATED
I am Rosemary Black a researcher with Charles Sturt University in Australia and I am doing some work for the African Wildlife Foundation that is associated with the Sabyinyo Silverback Lodge.
You have been chosen to participate in a survey looking at social and economic impacts of tourist lodges on local communities and
livelihoods. Your answers will be voluntary and will be kept strictly confidential.
You are not obliged to answer any questions and may ask the interviewer to skip a question should you wish to. Your answers will be put together with many other answers so that no-one will be able to identify your responses. Thank you for your time.
COMMUNITY SURVEY
PERSONAL INFORMATION
1 Age (or year/date of birth)
2 Gender MALE FEMALE Prefer not to Answer
4 Home village
5 Home Language SPEAK READ WRITE
6 Other Languages (specify) SPEAK READ WRITE
SPEAK READ WRITE
SPEAK READ WRITE
7 Marital Status Traditional Marriage MARRIED DIVORCED WIDOW/ER Long-Term Relationship
SINGLE OTHER(Specify)
8 No. of children (incl. deceased, please specify)
9 Number of dependents (incl.children & others)
10 In what type of dwelling do you live at home: 1 : Brick dwelling with thatch roof
2 : Brick dwelling with iron/asbestos roof
3: Brick dwelling with tiled roof
4 : Traditional dwelling thatch roof iron/asbestos roof
5 : Other (specify)
11 Total no. of people living in household over the period of a year (incl. you):
12 Is the head of your household male or female? MALE FEMALE b How old are they?
b) What is their occupation/What work do they do?
13 No. of males in the household: b No. of females in the household:
MALE FEMALE
14 No. of people in each age category in the household: 0-10 years
11-20 years
21-30 years
31-40 years
41-50 years
51-60 years
61 years +
15 Access to electricity in your home? YES NO

104
schooling?
MONEY
PREGNANT
FAM RESP.
ILLNESS
TOO FAR
MARRIAGE
NOT APPLICABLE LIVESTOCK CARER
Permanent Seasonal Casual Probation Contract
Nett Monthly Salary
Uniform Food Accommodation Transport home Pension Medical Aid Gratuities (amt/week.)
On-the-job Formal No training
Don't Know
YES
NO
Would like to work, but you can't find a job?
Can't work (give reason) -e.g. sick, too old, looking after family
Don't want to work
Self-employed
Other (specify)
16 What do you use for lighting in your home? ELECTRICITY GAS PARAFFIN CANDLES SOLAR
FIREWOOD NOTHING GENERATOR
17 What do you use to cook food? FIREWOOD GAS STOVE SOLAR CHARCOAL
18 Access to running water inside your home? YES NO b If NO, what type of water do you use? BOREHOLE OUTSIDE TAP RIVER DAM/LAKE RAIN
19 How far do you travel to get water? (in minutes) minutes PUBLIC TAP WELL
20 What form of toilet do you use? FLUSH TOILET PIT LATRINE BUSH
21 What do you do with your rubbish/refuse/waste? COUNCIL DUMP BURN BURY Throw in the BUSH
EDUCATION
22 Highest Grade/Standard Passed
23 If not completed, what is the main reason for not completing
24 Any Further Education
25 Any Skills or Skills Training
26 Current employer (if unemployed go to No. 34)
27 Current Position
28 When did you start?
29 Is the position? (if not permanent, include Q 33)
30 Gross Monthly Salary
31 Benefits received at work e.g. gratuities, uniform, etc.
Av. Monthly value.
32 Training provided by employer
33 How do you intend to support yourself upon retirement?
34 Have you ever had a permanent job before?
35 If unemployed, how long have you been unemployed?
36 If unemployed, why are you unemployed?
WORK EXPERIENCE (if employed then complete Q 26 - Q 34 & then skip to Q
37)
105
Farming - cattle, goats, crops, chickens Fishing Crafts/Curios Spouse/Family Income Piece work/Casual Labour Grants/Pension - disability, child grant, pension Other (Specify)
YES
NO
Excellent
Good
Average
Poor
Very Poor
VERY
MODERATELY
NOT VERY
NOT AT ALL
HOUSEHOLD INFORMATION
37 Other Household Income Sources? Value (in Pula) Specify if per day/month/year
38 Do you engage in subsistence farming (i.e. grow food at home to eat)?
39 AVERAGE MONTHLY HOUSEHOLD EXPENSES Local currency
Accommodation (Rent) per month Food
per month Education/Schooling (School fees) - specify if per term or month
Electricity per month
Water (specify if per month or per year)
Telephone/Airtime per month
Alcohol/Cigarettes A: C: per month
Childcare/Domestic Help/Casual Labour per month
Paraffin/Gas/Candles/Batteries per month
Cleaning Materials (e.g. Omo, Floor Polish (Cobra), etc.) per month
Personal Items (Toothpaste, deodrant, Vaseline, Dawn, etc.) per month
Transport/Taxis per month Fuel
expenses (diesel, petrol, etc.) per month
Municipal/Service Charges per month
Dependents - over & above food, education, etc. per month Pula
Accounts/Instalments (name and specify amount)
Loan payments For? Savings per month Medical or Life Insurance per month Medical Expenses - clinic, medicines, etc. (annual amt.) per year Clothes (annual amount) per year Other Expenses (list) per month
40 Does your household own any of the following: If YES, Number Motor Vehicle/Car
Motor bike
YES NO Motor bike YES NO Television
Television
YES NO Mobile Phone YES NO Bicycle YES NO Radio YES NO Computer YES NO Cattle YES NO Goats/Chickens YES NO G: C: Stove YES NO GAS ELECTRIC SOLAR
Fridge YES NO GAS ELECTRIC SOLAR
HEALTH AND SAFETY
41 Would you say your health is?
43 Do you feel safe from crime where you live at home?

106
YES
NO
Don't Know
YES
NO
Don't Know
Tourism
Fishing
Agriculture
Hunting
Crafts
Government
Cattle/Goat Farming
Don't Know
YES
NO
YES
NO
Don't Know
YES
NO
LION
ELEPHANT
HYAENA
CROCODILE
BABOONS
HIPPO
BUFFALO
MONKEYS
JACKAL OTHER (Specify)
DECREASED
INCREASED DECREASED
YES
NO
School trip
For Pleasure
To visit family
Collect food Snare
To work
To collect wood
Used to live there
Passing Through
YES
NO
LODGE 44 Have you heard of the Sabyinyo Silverback Lodge? YES NO If NO, please go to No. 47
b If YES, do you know anyone who works for the lodge? YES NO
45 If YES to No. 44 a, On a scale of 1-5 where 1 is strongly agree and 5 is strongly disagree (hand prompt card) how much do you agree with the following
statements?
a. T h e L o d g e i s g ood for jobs
b. T h e L o d g e b rings tourists to the area
c. T h e L o d g e h elps to protect the
animals and plants
d. T h e L o d g e h elps communities in
the area
e. T h e L o d g e i s g o o d to work for
f. The Lodge could do more for the
communities
46 Do you know of any Community Projects or work that the l odge does to help the local children or people?
b If YES, please list
47 H a v e y o u n o t i c e d a n y c h a n g e s i n t h e v i l l a g e s i n c e S a b y i n y o S i k l v e r b a c k L o d g e w a s b u i l t ? Y E S N O D / K 48 Has there been any positive change (anything good) in the villages s i n c e S a b y i n y o S i l v e r b a c k Lodge was built? YES NO D/K 49 Has there been any negative changes (anything bad) in the villages as a result of building the Sabyinyo Silverback Lodge? YES NO D/K
50 Do you think the Sabyinyo Silverback Lodge creates jobs for people ,in this community?
5 1 Do you think that the Sabyinyo Si l verback Lodge has helped to reduce poverty in the area (made local people less poor)?
YES
NO
Don't Know
For Some
LODGE AREA
52 Are you or any of your family employed in any tourism- or conservation-related business? YES NO
b Who are they employed by? e.g.Sabyinyo Lodge, conservat i on area, Private, etc
53 Which of the following do you think currently provides the most jobs in this area? (hand prompt card)
Tourism
Fishing
Agriculture
Hunting
Crafts Government
Cattle/Goat Farming Don't Know
54 Which of the following do you think benefits/helps the community the most in this area?
55 Do you or any of your family collect wood/plants or get food from the Conservation area?
56 Do you think it is important to conserve/look after animals, water, plants, trees, etc.?
b Why?
57 Do you have any problems with wild animals in your home village?
b If YES, what animals?
c. Have the problems increased or decreased since the lodge opened? INCREASED
d. Have the numbers of animals you’ve seen increased or decreased
since the lodge opened?
58 Have you ever been into the Conservation Area?
b If YES, why?

107
59 Would you like to visit the Conservation Area with your family? YES NO
b Why?
60 Do you have any other comments about Sabyinyo Silverback Lodge and tourism in this area?
_____________________________________________________________________________________________________________________
_____________________________________________________________________________________________________________________
_____________________________________________________________________________________________________________________
Thank you for your time

108
Appendix 2 Proportion of Average Annual Income from Various Sources (US $)
Income
Sources
Botswana, n (C) = 50, n (S)=13 Rwanda, n(C) = 52, n(S)=19 Overall
Comm Staff % Comm Staff Comm Staff
Av. % Av. % Av. % Av. % Av. % Av. %
Farming 1556.2 83.3 468.0 10.7 271.4 38.6 216.9 21.0 913.8 60.6 342.5 11.9
Fishing 25.0 1.3 7.5 0.2 0.0 0.0 0.0 0.0 12.5 0.1 3.8 0.1
Crafts/Curios 57.4 3.1 158.1 3.4 7.7 1.1 0.0 0.0 32.6 2.1 79.1 2.7
Spouse/Family
income
103.6 5.5 158.0 3.4 179.3 25.5 76.4 7.4 141.5 15.3 117.2 4.0
Piece work
/Casual labour
25.4 1.4 10.4 0.2 61.9 8.8 24.8 2.4 43.7 4.9 17.6 1.2
Grants/Pension 53.9 2.9 0.0 0.0 7.7 1.1 0.0 0.0 30.8 3.8 0.0 0.0
Others (e.g.,
personal business) 47.9 2.5 10.4 0.2 7.7 1.1 0.0 0.0 27.8 1.7 5.2 0.1
Lodge 0.0 0.0 3868.1 81.9 167.4 23.8 714.6 69.2 83.7 11.5 2291.4 80.0
Total Av./ % 1868.4 100 4680.5 100 703.2 100 1032.7 100 1286.4 100 2856.8 100
Source: Field survey, July-December 2014. Note: US $1 = BWP 9.6; US $1= RWF 688.9 (February 2015
exchange rate).
Appendix 3 Average Monthly Expenditure Patterns of Respondents
Expenditure
Item
Botswana, n (C) = 50, n (S)=13 Rwanda, n(C) = 52, n(S)=19 Overall
Comm Staff % Comm Staff Comm Staff
Av. % Av. % Av. % Av. % Av. % Av. %
Accommodation 0.1 0.1 0.0 0.0 0.0 0.0 0.1 0.2 0.1 0.1 0.1 0.1
Groceries/Food 52.9 50.8 161.4 54.1 16.3 52.8 26.3 51.8 34.6 51.7 93.8 53.6
Education 6.7 6.4 6.8 2.3 1.1 3.5 1.6 3.1 3.9 5.0 4.2 2.4
Electricity 6.4 6.1 30.6 10.2 0.3 1.1 6.5 12.8 3.4 3.6 18.6 10.7
Water 7.8 7.5 22.9 7.6 1.6 5.2 2.5 4.9 4.7 6.4 12.7 7.3
Telephone 5.6 5.4 20.0 6.7 2.1 6.8 5.0 9.8 3.9 6.1 13.5 7.7
Alcohol/Ciga. 0.0 0.0 0.0 0.0 0.03 0.1 0.0 0.0 0.02 0.1 0.0 0.0
Paraffin/Gas 4.2 4.0 9.2 3.1 3.37 10.9 2.4 4.8 3.9 7.4 5.8 4.2
Transport 11.6 11.2 17.4 5.8 3.8 12.2 2.7 5.4 7.7 11.7 10.1 5.9
Childcare 2.2 2.1 5.4 1.8 0.7 2.3 2.3 4.7 1.5 2.2 3.9 2.2
Loan payment 1.7 1.6 0.0 0.0 0.0 0.0 0.0 0.0 0.9 0.8 0.0 0.0
Medical/Life Ins 0.0 0.0 0.3 0.1 0.0 0.0 0.0 0.0 0.0 0.0 0.2 0.1
Clothes 4.9 4.8 24.5 8.2 1.6 5.1 1.3 2.5 3.3 4.9 11.7 6.7
Total 104.1 100 298.2 100 30.9 100 50.7 67.9 100 174.6 100
Source: Field survey, July-December 2014

109
Appendix 4 Respondents’ Responses to the Type of Animals Involved in Human
Wildlife Conflicts
Animal Type Botswana, n (C) = 49, n
(S)=12
Rwanda, n(C) = 11
n(S)=14
Overall (%)
Comm (%) Staff (%) Comm (%) Staff(%) Comm Staff
Elephants 59.2 28.1 0.0 3.7 29.6 15.9
Elephants & lion 8.2 2.8 0.0 0.0 4.1 1.4
Elephants, lion,
hippo & hyaena
23.9 65.4 0.0 0.0 11.9 32.7
Jackal, monkeys,
hippo
21.9 3.7 0.0 0.0 10.9 1.9
Elephant &buffalo 0.0 0.0 9.1 4.5 4.0 2.3
Buffalo, monkeys &
gorilla
0.0 0.0 81.8 91.8 40.9 45.9
Buffalo & Monkeys 0.0 0.0 0.1 0.0 0.1 0.0
Baboons, lion,
elephant & hyaena
2.0 0.0 0.0 0.0 1.7 0.0
Source: Field survey, July-December 2014

110
Appendix 5 Recommended survey for future AWF research
COMMUNITY SURVEY
SURVEY ID NO: __________
INTERVIEWER
TRANSLATOR
I am Rosemary Black a researcher with Charles Sturt University in Australia and I am doing some work for the African Wildlife Foundation that is associated with the Ngoma Safari Lodge.
You have been chosen to participate in a survey looking at social and economic impacts of tourist lodges on local communities and
livelihoods. Your answers will be voluntary and will be kept strictly confidential.
You are not obliged to answer any questions and may ask the interviewer to skip a question should you wish to. Your answers will be put together with many other answers so that no-one will be able to identify your responses. Thank you for your time.
COMMUNITY SURVEY
PERSONAL INFORMATION
1 Age
2 Gender MALE FEMALE Prefer not to Answer
3 Ethnic Group (OPTIONAL) Prefer not to Answer
4 Home village
5 Home Language SPEAK READ WRITE
6 Other Languages (specify) SPEAK READ WRITE
SPEAK READ WRITE
SPEAK READ WRITE
7 Marital Status Traditional Marriage MARRIED DIVORCED WIDOW/ER Long-Term Relationship
SINGLE OTHER(Specify)
8 No. of children
9 Number of dependents (incl.children & others)
10 In what type of dwelling do you live at home: 1 : Brick dwelling with thatch roof
2 : Brick dwelling with iron/asbestos roof
3: Brickl dwelling with tiled roof
4 : Traditional dwelling thatch roof iron/asbestos roof
5 : Other (specify)
11 Total no. of people living in household over the period of a year (incl. you):
12 Is the head of your household male or female? (OPTIONAL) MALE FEMALE b How old are they?
b) What is their occupation/What work do they do?(OPTIONAL)
13 No. of males in the household: b No. of females in the household:
15 Access to electricity in your home? YES NO
16 What do you use for lighting in your home? ELECTRICITY GAS PARAFFIN CANDLES SOLAR
FIREWOOD NOTHING GENERATOR
17 What do you use to cook food? FIREWOOD GAS STOVE SOLAR CHARCOAL
18 Access to running water inside your home? YES NO
b If NO, what type of water do you use? BOREHOLE OUTSIDE TAP RIVER DAM/LAKE RAIN
19

111
schooling?
MONEY
PREGNANT
FAM RESP.
ILLNESS OTHER
TOO FAR
MARRIAGE
NOT APPLICABLE
LIVESTOCK CARER
OTHER
Permanent Seasonal Casual Probation Contract
Nett Monthly Salary
Uniform Food Accommodation Transport home Pension Medical Aid Gratuities (give amt.)
On-the-job Formal No training
YES
NO
Would like to work, but you can't find a job?
Can't work (give reason) -e.g. sick, too old, looking after family
Don't want to work
Self-employed
Other (specify)
1 9
1 9 How far do you travel to get water? (in minutes) minutes PUBLIC TAP WELL
20 What form of toilet do you use? FLUSH TOILET PIT LATRINE BUSH
21 What do you do with your rubbish/refuse/waste? COUNCIL DUMP BURN BURY Throw in the BUSH
EDUCATION
22 Highest Grade/Standard Passed
23 If not completed, what is the main reason for not completing
24 Any Further Education
25 Any Skills or Skills Training
26 Current employer (if unemployed go to No. 34)
27 Current Position
28 When did you start?
29 Is the position? (if not permanent, include Q 33)
30 Gross Monthly Salary
31 Benefits received at work e.g. gratuities, uniform, etc.
Av. Monthly value
32 Training provided by employer
34 Have you ever had a permanent job before?
35 If unemployed, how long have you been unemployed? 36 If unemployed, why are you unemployed?
WORK EXPERIENCE (if employed then complete Q 26 - Q 34 & then skip to
Q 37)

112
Farming - cattle, goats, crops, chickens Fishing Crafts/Curios Spouse/Family Income Piece work/Casual Labour Grants/Pension - disability, child grant, pension Other (Specify)
YES
NO
Excellent
Good
Average
Poor
Very Poor
VERY
MODERATELY
NOT VERY
NOT AT ALL
HOUSEHOLD INFORMATION
37 Other Household Income Sources? Value (in Pula) Specify if per day/month/year
38 Do you engage in subsistence farming (i.e. grow food at home to eat)?
39 AVERAGE MONTHLY HOUSEHOLD EXPENSES Local currency
Accommodation (Rent) per month Food
per month Education/Schooling (School fees) - specify if per term or month
Electricity per month
Water (specify if per month or per year)
Telephone/Airtime per month Childcare/Domestic
Help/Casual Labour per month
Paraffin/Gas/Candles/Batteries per month
Transport/taxis per month
Fuel expenses (diesel, petrol, etc.) per month
Loan payments Savings per month Medical or Life Insurance per month Medical Expenses - clinic, medicines, etc. (annual amt.) per year Clothes (annual amount) per year
40 Does your household own any of the following: If YES, Number Motor Vehicle/Car
Motor bike
YES NO Motor bike YES NO Television
Television
YES NO Mobile Phone YES NO Bicycle YES NO Radio YES NO Computer YES NO Cattle YES NO Goats/Chickens YES NO G: C: Stove YES NO GAS ELECTRIC SOLAR
Fridge YES NO GAS ELECTRIC SOLAR
HEALTH AND SAFETY
41 Would you say your health is?
42 Do you feel safe from crime where you live at home?

113
A B
C
D
E
Tourism
Fishing
Agriculture
Hunting
Crafts
Government
Cattle/Goat Farming
Don't Know
YES
NO
YES
NO
Don't Know
YES
NO
LION
ELEPHANT
HYAENA
CROCODILE
BABOONS
HIPPO
BUFFALO
MONKEYS
JACKAL OTHER (Specify)
DECREASED INCREASED
LODGE
43 Have you heard of the Ngoma Safari Lodge? YES NO If NO, please go to No. 51
44 If YES to No. 44 a, On a scale of 1-5 where 1 is strongly agree and 5 is strongly disagree (hand prompt card) how much do you
agree with the following statements?
a. T h e L o d g e c r e a t e s jobs
b. T h e L o d g e b rings tourists to the area
c. T h e
L o d g e h elps to
protect the
animals and
plants
d. T h e L o d g e
h elps
communities in
the area
e. The
Lodge could
do more for
the
communities
45 Do you know of any Community Projects or work that the l odge does to help the local children or people?
b If YES, please list
46 Has there been any positive change (anything good) in the villages s i n c e Ngoma Safari Lodge was built? YES NO D/K 47 What positive changes have you seen? __________________________________________________________________________________________________________________________________________________________________________________________________________________________________________ 48 Has there been any negative changes (anything bad) in the villages as a result of building the Ngoma Safari Lodge? YES NO D/K 49 What negative changes have you seen? __________________________________________________________________________________________________________________________________________________________________________________________________________________________________________
50 Do you know about the relationship between Ngoma Safari Lodge and CECT? Yes No 5 0 Do you think that the Ngoma Safar i Lodge has helped to reduce poverty in the area (made local people less poor)?
YES
NO
Don't Know
For Some
LODGE AREA
51 Which of the following do you think currently provides the most jobs in this area? (hand prompt card)
Tourism
Fishing
Agriculture
Hunting
Crafts Government
Cattle/Goat Farming Don't Know
52 Which of the following do you think benefits/helps the community the most in this area?
53 Do you or any of your family collect wood/plants or get food from the Conservation area?
54 Do you think it is important to conserve/look after animals, water, plants, trees, etc.?
b Why?
55 Do you have any problems with wild animals in your home village?
b If YES, what animals?
114
c. Have the problems increased or decreased since the lodge opened?
d. Have the numbers of animals you’ve seen increased or decreased
since the Ngoma Safari Lodge opened?
56 Have you ever been into the Conservation Area?
b If YES, why? ______________________________________________________________________________________________________________________________________________________________________________________________________________________________________
57. Do you have any other comments about Ngoma Safari Lodge?
__________________________________________________________________________________________________
__________________________________________________________________________________________________
__________________________________________________________________________________________________
_________________________________________________________
Thank you for your time

research for a sustainable future
Institute for Land, Water and Society
PO Box 789Elizabeth Mitchell Drive
Albury NSW 2640Australia
Tel: +61 2 6051 9992 Fax: +61 2 6051 9992
Email: [email protected] www.csu.edu.au/research/ilws