social actors and key policy levers for mitigating the - hud user
TRANSCRIPT

209Cityscape: A Journal of Policy Development and Research • Volume 15, Number 1 • 2013U.S. Department of Housing and Urban Development • Office of Policy Development and Research
Cityscape
Social Actors and Key Policy Levers for Mitigating the Greenhouse Gas Footprint of U.S. CitiesAnu RamaswamiUniversity of Minnesota
Introduction: Greenhouse Gas Footprints of Cities and Mitigation PlansCities are hubs of human activity; the everyday actions of myriad households, businesses, and industries located within a city’s geopolitical boundary. Measuring greenhouse gas (GHG) emis-sions associated with cities is confounded by the relatively small spatial scale of cities compared with the large-scale engineered infrastructures in which they are embedded; that is, the electricity grid, transportation networks, water-supply lines, and wastewater treatment networks that serve cities. As a result, human activities in cities are highly dependent on transboundary infrastructure provisions, defined formally as the provision of water, energy, food, shelter (building materials), sanitation/waste management, mobility, connectivity, and public spaces to homes, businesses,
Abstract
This article links policy outputs in city climate action plans with environmental outcomes. This task is challenging because different human activities in cities vary in terms of their contributions to greenhouse gas (GHG) emissions and because the engineered infrastructures that support these activities extend well beyond the city scale. I present a generalizable quantitative approach that uses the transboundary infrastructure supply chain GHG emission footprints of cities to identify key actors and policy levers most effective in reducing the global GHG impact of cities. This infrastructure supply chain GHG emission footprint represents the life-cycle energy associated with provisioning key infrastructure services—water, energy, food, shelter, sanitation, mobility, connectivity, and public spaces—to support the activities of households, businesses, and industries in cities.

210
Ramaswami
Climate Change and City Hall
and industries located within the city (Chavez and Ramaswami, 2013; Ramaswami, in press). In addition to infrastructures, there is also the movement of other goods and services between cities resulting in the flow of embodied GHG between cities. To address these confounding factors, cities have started measuring not only direct energy use and GHG emissions within city boundaries (called a source-based GHG emissions inventory), but also transboundary, life-cycle-based GHG emission foot-prints of cities that are based upon human activities. First developed for the city of Denver in 2006, infrastructure supply chain GHG emissions footprints combine the life-cycle energy (inboundary and transboundary) associated with provisioning key infrastructure services with communitywide collective use of these infrastructures by homes, businesses, and industries colocated in cities (Ramaswami et al., 2008). Consider for example, water or electricity supply to a city that supports communitywide use of water and energy, respectively.
The resulting transboundary infrastructure supply chain footprints have since been tested in more than 20 U.S. cities and show that direct inboundary GHG emissions can contribute less than one- half of a city’s overall infrastructure-related GHG emissions footprint, particularly in cities that im-port a significant percentage of their electricity, such as Denver (shown in exhibit 1a). Environmental Protection Agency (EPA) statistics (EPA, 2011) indicate that less than 5 percent of U.S. counties have significant electric power generation infrastructure within their geopolitical boundaries; thus, about 95 percent of U.S. cities import electricity similar to the case of Denver in exhibit 1a. Even after transboundary GHG emissions associated with imported electric power are allocated to cities, transboundary contributions from the provision of other infrastructures—such as energy supply (fuel) for transportation, fuel supply for the built environment, food supply, construction materials (for example, cement), water supply, and sanitation (wastewater treatment)—can be significant. See exhibit 1a, in which all the infrastructure sectors are mapped to human activities; for example, the use of cars in a city results in direct inboundary tailpipe emission (shown solid), whereas the transboundary energy to produce fuel used by the vehicles is shown hatched. All transportation-sector GHGs (that is, GHGs associated with cars, trucks, SUVs, and airlines and the fuel processed to supply them) are shown grouped together (labeled as Trucks and SUVs and as Cars in exhibit 1a). Likewise, energy supply to buildings, inclusive of electricity and fossil fuels, are separated out as commercial-industrial (Comm/Ind), Residential, and Government in exhibit 1a, and they are col-lectively called the buildings-energy sector in the text. The transboundary impacts of infrastructure provision (hatched) are clearly significant, and comparable with inboundary GHGs (solid).
Indeed, as seen in exhibit 1b, the production of food, transport fuels, water, and building materials can add a significant 48 percent to the GHG emissions traditionally being accounted for by cities that focused only on the use of electricity and the burning of fossil fuels within city boundaries (Hillman and Ramaswami, 2010). (See exhibit 1b.) The additional consideration of these materials flowing to cities is sometimes also referred to as the materials sector, differentiating it from the energy sector.
The proportions of GHG emissions from the different infrastructures mapped to human activities (for example, cars, residential buildings, and air travel are sectors) shown exhibit 1 have been observed by Hillman and Ramaswami (2010) to be similar across large U.S. cities, when the U.S. average electricity generation is applied to all the cities. Furthermore, when transboundary

Social Actors and Key Policy Levers for Mitigating the Greenhouse Gas Footprint of U.S. Cities
211Cityscape
Exhibit 1
An Infrastructure Supply Chain GHG Emissions Footprint for Denver (a); GHG Emissions From Different Infrastructure Sectors for Seven U.S. Cities (b)
Sources: (a) Ramaswami et al. (2008); (b) Hillman and Ramaswami (2010)
(a)
(b)
infrastructure contributions are included, the per capita GHG emissions of U.S. cities with popula-tions greater than 100,000 are consistent with U.S. per capita GHG emission (within ±10 percent of ~25 metric tonnes of carbon-dioxide equivalents released to the atmosphere per person). This finding suggests that the challenge of artificial truncation of infrastructures at city geopolitical boundaries may have been overcome. (See exhibit 1b.)

212
Ramaswami
Climate Change and City Hall
Recent research has also compared the communitywide infrastructure supply-chain GHG footprint of cities with consumption-based footprints that address lifecycle GHGs from the use of all goods and services (for example, infrastructure plus noninfrastructure goods like furniture and clothing) by a subset of the community—its final consumers, which are predominantly the households (Chavez and Ramaswami, 2013, 2011; Ramaswami et al., 2011). In consumption-based footprints, the activities of local businesses and industries that export goods and services elsewhere are excluded. There is increasing consensus that a communitywide infrastructure GHG footprint and a separate consumption-based GHG footprint offer complementary views of the city, addressing infrastructure/economic production activities and consumption, respectively (Baynes et al., 2011; Chavez and Ramaswami, 2013; Ramaswami, Chavez, and Chertow, 2013).
Several cities now report inboundary plus transboundary GHG emissions, together reported as communitywide supply-chain footprints (Ramaswami, Chavez, and Chertow, 2013; Ramaswami et al., 2011). This method is also becoming standardized in city GHG reporting protocols. For ex-ample, ICLEI—Local Governments for Sustainability recently released for public comment a draft community GHG emissions-accounting protocol intended for use by its more than 500 member cities. The protocol includes several infrastructure supply chain emissions discussed previously; for example, transboundary GHG emissions from producing fuel, producing electricity, provisioning commuter travel, and providing water, wastewater, and waste treatment services in cities (Chavez and Ramaswami, 2011; ICLEI, 2010). In Europe, the Greater London Authority and the British Standards Institution are developing a publicly available standard for GHG accounting for cities, which addresses both direct-plus-supply-chain GHG emissions, with a focus on infrastructures serving the whole community, and consumption-based GHGs that are associated predominantly with households (BSI, 2012). The infrastructure supply chain method is expected to stimulate more creative cross-scale and cross-sector urban planning strategies for mitigating GHG emissions, addressing the supply chain that connects energy and materials users in cities with the producers of key infrastructure services; that is, water, energy, mobility and transportation, food, and key urban construction materials. The construction of such footprints enables actions that reduce demand for energy and material use in key infrastructures within cities to be coupled with actions that focus on cleaner production of these infrastructures and often transcend the city scale.
Denver, for example, is considering several strategies to mitigate its communitywide infrastructure supply chain GHG emissions footprint (exhibit 1a), which are described in its climate action plan (CAP) (Greenprint, 2007). These strategies can be organized broadly as—
• Reducing demand for energy use in buildings-energy sector through local voluntary or regulatory programs that target local homes and businesses.
• Promoting cleaner electricity generation by working with the state’s public utilities commission (PUC) and legislators, reflecting cross-scale linkage with state-scale policies.
• Reducing demand for transportation through coordination with regional metropolitan planning organizations (MPOs) that implement mass transit and shape the overall regional commuter shed. Reducing demand for transport requires cross-scale coordination between individual cities and with entities such as regional councils of governments representing multiple cities in metropolitan areas.

Social Actors and Key Policy Levers for Mitigating the Greenhouse Gas Footprint of U.S. Cities
213Cityscape
• Promoting the production and penetration of alternative transportation fuels, such as natural gas and biofuels, in conjunction and across scale with state-scale policies.
• Working on supply chain strategies in the production of key infrastructure materials and their disposal in waste; for example, substituting recycled materials for cement in concrete, promoting waste-to-energy projects, recycling, and so on.
• Working on cross-sector substitutions; for example, substituting telepresence for air travel, which will require coordination with regional MPOs and businesses that provide information and communications technology services, to promote dematerialization in the transportation sector.
The focus of this article is on the first two strategies that shape both inboundary and transbound-ary GHG from the buildings-energy sector. Note, the right-hand side of the pie chart in exhibit 1a shows the GHG contributions from the buildings-energy sector.
The objective of this article is to identify most important actor categories and the key levers to mitigate the GHG emissions footprint of the buildings-energy sector, using Denver as a case study. We achieve our objective in three steps.
• We first describe broad strategies and related program designs—classified as voluntary versus regulatory—for reducing the GHG emissions in the buildings-energy sector in Denver. We identify key actor categories associated with the different program designs.
• We conduct quantitative analysis of different GHG mitigation programs being implemented in Denver, and those proposed for implementation in Denver, modeled after successful programs tested in other cities nationwide. Such quantitative analysis identifies programs and actor categories, that is, key levers that have highest impact in shaping environmental outcomes (that is, GHG emissions).
• We discuss the implications of this work for future research on city CAPs and their implementa-tion for mitigating the GHG emissions associated with cities.
The article makes an important contribution in linking policy outputs in city CAPs with environ-mental outcomes. For example, studies that evaluate the effectiveness of city CAPs often check off the presence or absence of policies in different sectors: buildings, energy supply, waste management, local government, transportation and tree planting (Krause, 2011; Tang et al., 2010). However, as seen in exhibit 1, not all sectors are the same in terms of contributions to GHG emissions— for example, waste management and local government operations are often small contributors particularly when the government does not own or operate energy utilities for the larger community. Furthermore, the impact of different program designs—whether voluntary, regulatory, or behavioral—on environmental outcomes is rarely addressed. This article presents a generalizable quantitative approach to connect policy outputs, that is, different program designs, with corresponding environ - mental outcomes.
Quantifying environmental outcomes arising from city CAPs or sustainability plans is relatively new. A few studies have conducted a qualitative analysis of CAPs based on assessment of content items, and concluded that they have largely been ineffective in reducing energy use and GHG emissions (Bassett and Shandas, 2010; Boswell, Greve, and Seale, 2010; Wheeler, 2008). Studies
214
Ramaswami
Climate Change and City Hall
at the national scale have developed the concept of climate wedges to quantify six key strategies that can reduce U.S. GHG emissions with current technologies (Pacala and Socolow, 2006)— however, no specific city-level policies are explored. Dietz et al. (2009) conduct top-down analysis to evaluate the impact of behavioral interventions on U.S. household energy use. They address the impact of program design both on the adoption of energy efficiency retrofits and on energy conservation behaviors in the context of reducing household energy use. They apply “behavioral plasticity” to get a more realistic assessment of the percentage of homes that would adopt more energy efficient retrofits among the existing housing stock requiring such upgrades. However, this national-scale analysis does not address how specific city policies may shape adoption rates, nor how local features such as urban form or the building rental stock or home sales trend in different cities may affect outcomes from specific city-scale policies. For example, the effectiveness of a time-of-sale policy that would upgrade homes at their time of sale would depend on local trends in the sale of residential and commercial properties; the effectiveness of smart growth measures depends on current local spatial feature of cities. Ramaswami et al. (2012a) conducted a first such bottom-up study that compared participation rates in different program designs used in city CAPs, incorporating city-specific features and comparing voluntary versus regulatory pro gram designs. Details of the quantitative analysis are found in Ramaswami et al. (2012a), along with a detailed appendix that describes the calculations (Ramaswami et al., 2012b). Results for the buildings-energy sector are presented here to illustrate how key actors and policy levers associated with the buildings-energy sector of cities can be identified in a unified analysis that addresses both the production of energy and its use in city buildings.
Building Sector Strategies and Actors in a SEIS FrameworkBroad strategies that are used to reduce GHG emissions from the buildings-energy sector of cities are shown in exhibit 2, column 1. The same strategy can be implemented in different ways yield-ing different program designs denoted in exhibit 2 (A–C, columns 3–4), based upon the spatial scale they are implemented at (city-scale or linked with the state), and the voluntary or regulatory/mandatory nature of the program design.
City-Scale Voluntary Programs for Building Upgrades (A1). Voluntary program designs are used most often by a vast majority of cities in implementing their CAPs. For example, a review of 55 city CAPs indicated that more than 98 percent included voluntary programs such as the ones shown in exhibit 2–A1 (Ramaswami et al., 2012a). These programs use financial incentives to promote the increased adoption of energy efficiency upgrades by homes and businesses both in the existing building stock and in new construction. The programs may include free mail-in programs for compact florescent lamps (CFLs), door-to-door outreach for low-cost weatherization, free basic whole-home upgrades for low-income homes, and loan programs for higher cost home energy up-grades. Many low-cost items such as CFLs are given away for free (to the community), and rebates are provided by local governments for higher cost items such as attic insulation and whole-home upgrades. Local governments often raise one-time funds to run these campaigns or tap into state, federal, or electric utility grants to institutionalize these programs. See state-scale and utility programs described subsequently (B2). However, the major onus for implementing these voluntary building upgrades falls upon the individual home or business, an actor category we refer to as the individual user.

Social Actors and Key Policy Levers for Mitigating the Greenhouse Gas Footprint of U.S. Cities
215Cityscape
Exhibit 2
Strategy/Nudge(participating unit)
Strategy Effectiveness
per Unit
Five-Year Participation Rates in Various Programs
1. Voluntary 2. Policy/Regulatory
Broad Strategies for Reducing Energy Use and GHG Emissions Associated With the Buildings-Energy Sector in Cities in the Next 5 Years (1 of 2)
A. City-Scale Programs for Building Upgrades: Voluntary and Regulatory
Installing two CFLs (per home)
~1.5% reduction in household electricity (Tachibana and Brattesani, 2003)
50% homes participate in a free mail-in program (Tachibana and Brattesani, 2003)
8–10% homes participate in free door-to-door outreach (Marshall, 2009)
Various proposed state or federal phase-out policies for incandescent bulbs will result in 100% of homes installing at least 2 CFLs. [None in effect 2007–12]
Low-cost weatherization (per home)
5% reduction in household natural gas (Blasnik, 2006)
2–4% homes take the additional step to weatherize in door-to-door outreach (Marshall, 2009)
See below for ToS/Date Certain Ordinances
Basic whole home energy upgrades—medium cost (per home)
2.8% reductions in household electricity &
13.6% decrease in natural gas (Blasnik, 2006)
0.4% of homes participate after which budget is expended in a low-income free home upgrade program
20% of homes would partici-pate with a hypothetical time-of-sale (ToS) ordinance (City of Berkeley, 2010), and ~35% in a date-certain ordinance for rentals (City of Boulder, 2010), modeled after similar city regulations in Berkeley, CA & Boulder, CO
Higher cost home energy upgrades (per home)
1.7 mt-CO2e/HH (diverse upgrades: windows, solar heaters, attic fans, and so on [CSLP, 2010])
<<0.1% participate (ENERGY STAR, 2007) in numerous national energy efficiency loan programs
2.6% of homes would partici - pate in an opt-in bond program, as tested in Boulder (CSLP, 2010).
New “green” buildings (per unit commercial & res. square feet)
20–30% energy savings per square foot (ENERGY STAR, n.d.; Turner and Frankel, 2008).
5% of new construction is voluntarily built green (Simons, Choi, and Simons, 2009); the annual new construction in Denver is ~1% of the total stock
76% of new construction participates in a hypothetical green buildings mandate for properties >20,000 sf, modeled after San Francisco (Buchanan, 2008)
B. Green Energy Purchase and Production: Utility and State-Scale Programs
Commercial-industrial DSM
Utility programs reduce electricity demand: 0 mt-CO2e per kWh saved
NA Voluntary DSM program in Denver (Xcel Energy, 2009) targets 1.5% electricity savings in 5 years
Green electricity production or purchase (utility kWh)
Windpower or other renewables emit: 0 mt-CO2e/kWh
Up to 5% electricity is voluntarily purchased green—per national data (Bird and Brown, 2006)
Colorado’s renewable portfolio standard (RPS) requires 30% electricity from renewables by 2030 (State of Colorado, 2010)

216
Ramaswami
Climate Change and City Hall
C. Innovative Behavioral Interventions: Voluntary and Regulatory
Behavioral feedback (home)
2%–4% reduction in electricity use via bill feedback (Allcott and Mul-lainathan, 2010; Opower, n.d.)
NA 100% of homes would partici-pate in monthly bill feedback provided by electric utilities
6%–12% reduc - tion using real- time displays (Darby, 2006; Fischer, 2008)
4% homes are assumed to participate using a door-to-door outreach model (Marshall, 2009) to install the displays
100% of homes participate in a hypothetical mandated energy meters policy (similar to laws requiring carbon monoxide detectors in all homes)
Price feedback: carbon tax
0.15%–0.35% reduction in electricity use per % increase in cost (Bernstein and Griffin, 2005)
NA 1.6% weighted average local carbon tax applies to all users, modeled after Boulder, CO (Brouillard and Van Pelt, 2007)
CFL = compact florescent lamp. DSM = demand-side management. NA = not applicable.
Note: Specific program designs are characterized by different participation rates computed over a 5-year period from 2007 through 2012 for near-term analysis.
Source: Adapted from Ramaswami et al. (2012a)
City-Scale Regulations for Building Upgrades (A2). A few cities have started experimenting with local regulations including both mandates and opt-in programs to upgrade the current building stock. Examples include the residential and commercial energy conservation ordinances pioneered in Berkeley and San Francisco, California, that require properties be upgraded to basic energy-efficiency standards at the time-of-sale (City of Berkeley, 2010), and the date-certain smart regulations that require energy upgrades of rental properties by a fixed date, presently being tested in Boulder, Colorado (City of Boulder, 2010). Such policies mandate the installation of basic energy efficiency upgrades either at the time of sale or within a fixed time period (for date-certain). A new innovative opt-in bond program in Boulder institutionalizes the financing of high-cost build - ing energy upgrades wherein loans for these upgrades are linked with the property and repaid via special property taxes assessments rather than by the individual homeowner who makes the initial investment (CSLP, 2010). This removes an important barrier that often inhibits individual owners (residential or commercial) to invest in high-cost upgrades when they may sell the property prior to recouping the energy savings. In the case of new construction, cities such as San Francisco re-quire Leadership in Energy and Environmental Design (LEED) certification for all new commercial construction projects larger than 20,000 square feet (Buchanan, 2008). In all these examples, the policy actor category becomes very important wherein policy actors include not only elected and government officials, but also nongovernmental organizations, the media, advocacy groups, and others involved with policy development.
Exhibit 2
Strategy/Nudge(participating unit)
Strategy Effectiveness
per Unit
Five-Year Participation Rates in Various Programs
1. Voluntary 2. Policy/Regulatory
Broad Strategies for Reducing Energy Use and GHG Emissions Associated With the Buildings-Energy Sector in Cities in the Next 5 Years (2 of 2)

Social Actors and Key Policy Levers for Mitigating the Greenhouse Gas Footprint of U.S. Cities
217Cityscape
Voluntary Green Energy Purchase Programs (B1). While strategies A1–A2 focus on upgrading buildings in a community to become more energy efficient, several programs initiated by energy utilities promote green electricity purchases by their customers. Local governments sometimes work with utilities to publicize these green-purchasing programs. For example, Xcel Energy in Colorado is one of the largest carriers of third party-provided and green-e-certified wind energy. Its WindSourceTM program makes certified green energy purchases available to its customers at a small incremental cost of about 2 cents/kWh (Xcel Energy, 2011). Denver’s CAP includes a partnership that promotes information about this program in the community. National studies show a high level of engagement of individual homes and businesses in making these green purchases with as much as 15 percent energy use purchased green on a voluntary basis (Bird and Brown, 2006). While the individual user makes the green energy purchase, the electric utility plays a critical role in designing and offering such programs, reflecting the important role of another actor category—the infrastructure designer-operator.
Green Energy Production: State-Scale and Utility Regulation (B2). While electric utilities may offer voluntary green purchasing programs, regulations at the state-scale impact the penetration of clean energy generation technologies into the utility’s grid mix. Colorado has passed the landmark renewable portfolio standard (RPS) requiring 30 percent renewables in the electricity generation portfolio of investor-owned utilities by the year 2020, including carveouts for wind and solar energy (State of Colorado, 2010). Utility demand-side management (DSM) programs are an im-portant complement for renewable energy resource planning in utilities. Electric utilities and state PUCs institutionalize the recovery of DSM funds via utility bills, which are subsequently applied to provide rebates and incentives to enhance adoption of energy efficiency upgrades by industrial, commercial, and residential sectors. Utility DSM programs typically focus on the commercial-industrial sector. Policy actors at the state scale play an important role in the design of both RPS and DSM programs. Likewise, policy actors at the federal scale may shape other policies governing electric utilities including pollution regulations addressing GHGs.
Innovative Behavioral Interventions (C). In addition to addressing energy demand via efficiency upgrades and energy supply via renewables in the electricity portfolio, a few cities and electric utilities are also working together to implement innovative behavioral interventions that promote energy conservation practices using pricing signals and/or feedback on energy use. The feedback may be provided on monthly bills that show monthly energy use compared to peers with suitable social norming messages (Opower, n.d.), or, via real-time energy feedback devices (that is, energy meters) that show the user their instantaneous energy use. Some of these feedback devices cost less that $100 to install and have yielded an average of 6 to 12 percent energy use reduction in pilot studies (Darby, 2006; Fischer, 2008). While some cities/utilities are providing these meters to homes on a voluntary basis (Mendyk, Kihm, and Pigg, 2010), others such as Southern California Edison are requiring real-time energy feedback and time-of-use pricing communitywide (SCE, 2012). Policies that require energy information meters in all homes can be particularly impactful and such proposals are being explored in numerous countries/states. A few cities, for example, Boulder, have developed programs with their investor-owned utilities to apply carbon taxes on electricity use to provide modest price signals to promote energy conservation and to raise funds for efficiency programs. Energy feedback, social norming, and price signals are all expected to shape the energy use behaviors of individuals, and as such involve all three actor categories— individual users, infrastructure designer-operator, and policy actors.
218
Ramaswami
Climate Change and City Hall
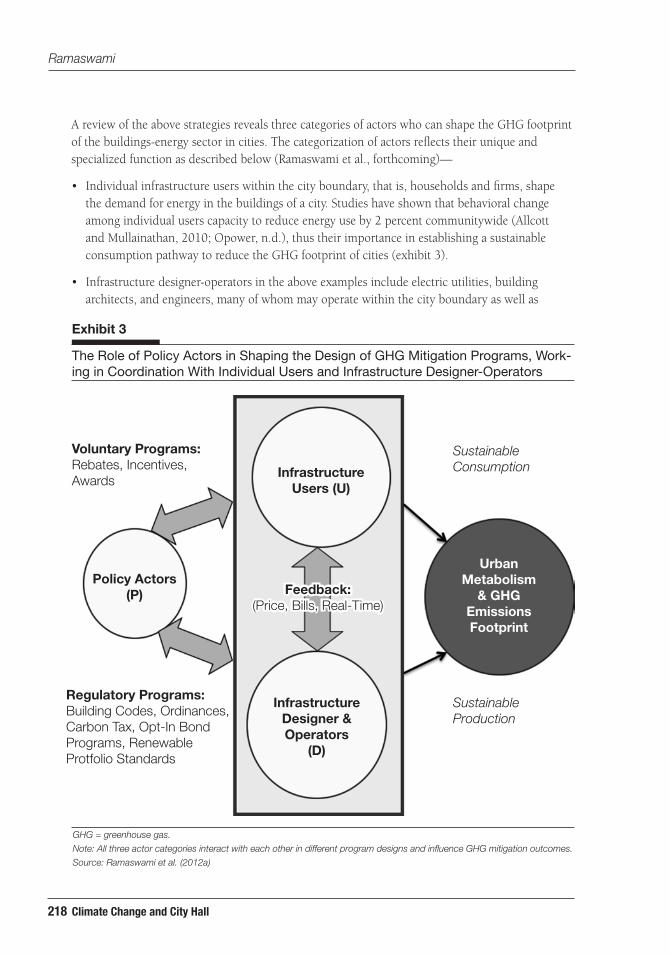
A review of the above strategies reveals three categories of actors who can shape the GHG footprint of the buildings-energy sector in cities. The categorization of actors reflects their unique and specialized function as described below (Ramaswami et al., forthcoming)—
• Individual infrastructure users within the city boundary, that is, households and firms, shape the demand for energy in the buildings of a city. Studies have shown that behavioral change among individual users capacity to reduce energy use by 2 percent communitywide (Allcott and Mullainathan, 2010; Opower, n.d.), thus their importance in establishing a sustainable consumption pathway to reduce the GHG footprint of cities (exhibit 3).
• Infrastructure designer-operators in the above examples include electric utilities, building architects, and engineers, many of whom may operate within the city boundary as well as
Exhibit 3
The Role of Policy Actors in Shaping the Design of GHG Mitigation Programs, Work-ing in Coordination With Individual Users and Infrastructure Designer-Operators
GHG = greenhouse gas.
Note: All three actor categories interact with each other in different program designs and influence GHG mitigation outcomes.
Source: Ramaswami et al. (2012a)
Voluntary Programs: Rebates, Incentives, Awards
Sustainable Consumption
Sustainable Production
Policy Actors(P)
Infrastructure Users (U)
Feedback: (Price, Bills, Real-Time)
Infrastructure Designer & Operators
(D)
Urban Metabolism
& GHG Emissions Footprint
Regulatory Programs:Building Codes, Ordinances, Carbon Tax, Opt-In Bond Programs, Renewable Protfolio Standards

Social Actors and Key Policy Levers for Mitigating the Greenhouse Gas Footprint of U.S. Cities
219Cityscape
Exhibit 4
Three Categories of Actors Shown in the Social Subsystem Shape the Pollution (GHG) Footprint of Cities
GHG = greenhouse gas.
Source: Reproduced from Ramaswami et al. (2012a)
CROSS-SCALE POLLUTION AND RESOURCE FOOTPRINT
Social System
Policy Actors; Infrastructure Designers and Operators
CROSS-SCALE INFRASTRUCTURES
CROSS-SCALE INSTITUTIONS
Extraction
Global Scale
Natural SystemIndustrial Ecology
Urban Metabolism
Urban Ecology
A CITY'S POROUS BOUNDARYElectricity petroleum
gas etc.
Urban Form and Stock
End-use
Home Scale
Individual users
transcend the city scale. This category can shape both energy use via efficiency upgrades and new green building designs, as well as sustainable energy production in utilities and distributed generation facilities.
• Policy actors shape the policy process both within the city scale and across scale, thus operating at local, state, national, and global scales, generating city regulations, state electricity portfolio standards, federal energy efficiency tax credits, and global carbon trading programs, respectively, as examples of outputs from this actor category across spatial scale.
Exhibit 3 illustrates the interactions among the different actor categories. Policy actors shape the behavior of individual users and of infrastructure designer-operators in voluntary or regulatory program designs. The infrastructure designer-operators (for example, electric utilities) and the individual users also interact with each other, particularly in the context of price and behavioral feedback programs. Understanding such interactions among actor categories can be important in the design of effective GHG mitigation programs.
The three actor categories can be also visualized to interact with each other across spatial scale, shaping infrastructures and their associated footprints toward sustainability goals. These interac-tions are illustrated in a social-ecological-infrastructural systems (SEIS) framework for developing sustainable city systems (Ramaswami et al., forthcoming)—see exhibit 4. The SEIS framework builds upon the social-ecological systems framework by explicitly incorporating transboundary

220
Ramaswami
Climate Change and City Hall
infrastructures serving cities. The SEIS framework recognizes that natural resources (such as water and fossil fuels) are transformed and conveyed over large distances to people in cities via engineered infrastructures such as the electric power grid, water pipelines, and transportation networks. The transboundary infrastructures can contribute a significant portion to the GHG foot-print of cities, as seen in exhibit 1a–b. Thus mapping and understanding social actors associated with these footprints—both within and across the city boundary—is important.
Several theories and frameworks drawn from the social sciences can lead to a better understanding of the actors and their interactions. For example, theories around social norming (Schultz et al., 2007) are helping design energy conservation outreach programs aimed at individual users (Allcott and Mullainathan, 2010; Opower, n.d.). Club theory describes interactions between infrastructure designer-operators and policy actors as they shape the designs and outcomes from voluntary envi-ronmental programs (Prakash and Potoski, 2007), while frameworks such as those of institutional analysis and development (Ostrom, 2005), institutional collective action (Feiock, 2007), and advocacy coalition (Weible and Nohrstedt, in press) describe policy actor interactions with other actors and with resource systems in a general context. Integrating the social actors (and associated theories) into the SEIS framework explicitly addresses the physically based context of material-energy flows in cities conveyed by transboundary infrastructures, connecting actors within the city boundary who typically shape energy efficiency and demand reduction with actors across scale, for example, the producers of energy (electric utilities) and associated cross-scale policy actors such as state and federal regulators who guide their actions. While the framework itself is not the topic of this article, a conceptual and theoretical understanding of actors in the SEIS framework promotes an improved understanding on both cross-scale and cross-actor interactions that are important in GHG footprint mitigation, discussed in the concluding section of this article.
The next section identifies most important program designs and the actors and the spatial scale that yield significant GHG mitigation.
Program Designs and GHG ImpactExhibit 2 shows broad strategies (column 1) for GHG mitigation in the buildings-energy sector described in the previous section. Each strategy is associated with a strategy effectiveness per unit (shown in column 2), for example, the average measured reduction in energy use per home, which does not vary very much in a given city or climate zone. Data gathered from more than 1,500 low-income homes retrofitted in Colorado shows an average net natural gas savings of 13.6 percent with a 90-percent confidence interval around the mean of about 10 percent (Blasnik, 2006).
Depending on how each strategy is implemented in a program—particularly whether is designed to be voluntary or regulatory—yields a number of alternate program designs (columns 3–4). Different program designs are seen to be associated with widely varying participation rates, where the participation rate in exhibit 2 represents the percentage of homes or businesses adopting that particular strategy in a particular program configuration in a 5-year period. The participation rates can vary by a factor of 2 to 5 (200 to 500 percent) and even over a few orders of magnitude when comparing a voluntary city-scale program with its regulatory counterpart. These aspects are detailed in the following sections.

Social Actors and Key Policy Levers for Mitigating the Greenhouse Gas Footprint of U.S. Cities
221Cityscape
Lower Participation Rates in City-Scale Voluntary Building Upgrade ProgramsParticipation rates in voluntary programs vary widely based not only on the level of financial incentives offered but also on the modality of outreach. Typically, the participation rates are higher (as high as 50 percent) when low-cost items are offered for free as in the case of the free CFLs provided in the mail-in program (Tachibana and Brattesani, 2003). However, uptake of the same two free CFLs decreases to about 8 to 10 percent of homes knocked on in door-to-door outreach programs that handed free CFLs in three neighborhoods in Denver (Marshall, 2009). The voluntary participation rate decreased further as the cost of the retrofits increases even modestly and is typi-cally as low as 2 to 4 percent in door-to-door weatherization programs that require a small monetary commitment from homes and/or followup by the home dwellers after the first visit by volunteers (Marshall, 2009). Even if all neighborhoods in Denver were to be reached via neighborhood knock-on-door programs over a 5-year period from 2007 to 2012 (the period for our short-term analysis) we expect at best 4 percent participation for adopting lower cost upgrades such as pipe and attic insulation. The rates seen in Denver are similar to those seen in energy efficiency pro-grams tracked in many other U.S. states, wherein the homeowner must make a modest financial commitment (Hirst, 1984; Stern, 2002); only a select few communities in the United States report higher participation rates (Stern et al., 1985). Indeed, federal EPA’s guidelines for deployment of weatherization programs consider outreach to 4 percent of homes over 5 years an aggressive goal (EPA, 2009), reflecting the reality observed on the ground. Participation rates are lower still at <<1 percent when homes seek to make voluntary higher cost investments for home upgrades such a solar hot water heaters, new windows, and so on, as reported in national studies (ENERGY STAR, 2007). See exhibit 2, column 3 (A1).
It is important to note that participation rates in voluntary programs are linked with the level of financial incentives offered. When whole-home upgrades are offered free of cost to low-income homes the program gets saturated and hence becomes funding limited and is able to retrofit only a small percentage (0.4 percent) of low-income homes per year (Arapahoe County, 2009). Because large financial incentives cannot be offered to the whole population, participation rates in voluntary energy upgrade programs generally tend to be low, overall. However, as noted previously, these typical city-scale voluntary programs are very popular and feature in almost all of the 55 city CAPs analyzed by Ramaswami et al. (2012a). Although popular, few cities are tracking the participation rates explicitly as shown in exhibit 2, identifying how many homes were targeted and how many participated (or not), which would provide important information on the program’s overall impact.
Higher Participation Rates in City Regulations for Building UpgradesCompared to the voluntary program design, the corresponding policy approaches can significantly increase participation rates by many orders of magnitude for the same strategy. See exhibit 2—column 4 (A2). For example in time-of-sale (ToS) ordinances that have been tried and tested in Berkeley and San Francisco, homes are required to have basic energy efficiency features such as weatherstripping, pipe and attic insulation at the time of their sale, or they pay into an escrow fund that finances these upgrades shortly after the sale of the home. Using home sales data for Denver, a similar program in Denver is estimated to reach 20 percent of homes over a 5-year period (versus only 4 percent in a neighborhood voluntary outreach program). Likewise a date-certain ordinance

222
Ramaswami
Climate Change and City Hall
that requires rental properties be upgraded to basic energy efficiency standards by a fixed future date, is an innovative policy that addresses the rental buildings market where there are little incentives (absent the policy) for landlords to upgrade their rental units. Modeled after a smart regulations policy recently adopted in Boulder, a date-certain ordinance for rentals would directly transform the 30 percent of the building stock in Denver identified as rental. An opt-in bond pro-gram provides investment capital for those homes wishing to invest in higher end upgrades such as solar hot water heaters, new windows, geothermal systems, and so on, with a special property tax assessment linked with the home (rather than the homeowner) used for repayment of the loans.
The previously described approaches address the old (existing building stock in cities). Similar differences in voluntary and regulatory city-scale programs are seen also for the case of new con-struction—with about 1 percent of the total built area in Denver added as new construction over 5 years. Voluntary adoption of green building codes in Denver is estimated to be among the highest in the nation at 5 percent of new construction (Simons, Choi, and Simons, 2009), which means only 0.005 percent of Denver’s total building stock is likely to be impacted annually using a voluntary penetration model. In contrast, green building mandates that require all new construction (or large commercial projects) meet LEED or ENERGY STAR will impact almost all of the new building stock added to a city, at about 1 percent over 5 years. Such mandates are already operational in a few cities such as San Francisco (Buchanan, 2008). Thus, orders of magnitude differences in participation rates are seen between voluntary city-scale programs (A1) versus city regulation (A2).
Broadest Impact of State-Scale or Utilitywide PoliciesWhile the above city-scale voluntary and regulatory programs address building upgrades in separate sectors—for example, homes versus commercial buildings, and new versus old construc-tion—state regulations on utilities (for example, Colorado’s RPS) impact all of the electricity used in a community. Likewise, an electricity carbon tax (such as one instituted in Boulder) impacts all users of electricity. Such systemwide regulations effectively foster a 100-percent participation rate.
Promise of Innovative Behavioral Intervention ProgramsBehavioral interventions that combine social norming and feedback devices show potential for high impact. The unit strategy effectiveness of using feedback devices is among the highest of all strate-gies in exhibit 2 yielding 6- to 12-percent electricity savings per home in pilot tests. However, the impact on GHG is much reduced when only a few homes voluntarily adopt the meters, assuming a 4-percent participation rate in a program wherein the meters are distributed in door-to-door outreach mode. In contrast, 100-percent participation may be fostered in a hypothetical regulatory scenario if such devices are required to be installed in all homes, similar to recent mandates re-quiring carbon monoxide detectors in all Colorado homes. The GHG impact can also vary widely based on the program design, even when a lower 6-percent electricity savings are assumed for communitywide meters use.
Social Actors and Key Policy Levers for Mitigating the Greenhouse Gas Footprint of U.S. Cities
223Cityscape
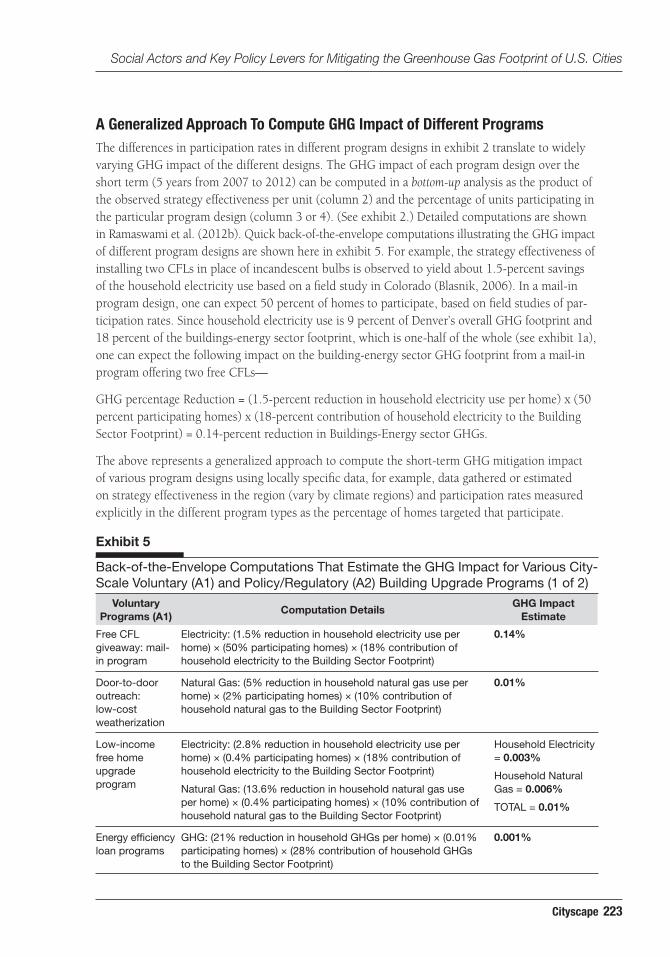
A Generalized Approach To Compute GHG Impact of Different ProgramsThe differences in participation rates in different program designs in exhibit 2 translate to widely varying GHG impact of the different designs. The GHG impact of each program design over the short term (5 years from 2007 to 2012) can be computed in a bottom-up analysis as the product of the observed strategy effectiveness per unit (column 2) and the percentage of units participating in the particular program design (column 3 or 4). (See exhibit 2.) Detailed computations are shown in Ramaswami et al. (2012b). Quick back-of-the-envelope computations illustrating the GHG impact of different program designs are shown here in exhibit 5. For example, the strategy effectiveness of installing two CFLs in place of incandescent bulbs is observed to yield about 1.5-percent savings of the household electricity use based on a field study in Colorado (Blasnik, 2006). In a mail-in program design, one can expect 50 percent of homes to participate, based on field studies of par-ticipation rates. Since household electricity use is 9 percent of Denver’s overall GHG footprint and 18 percent of the buildings-energy sector footprint, which is one-half of the whole (see exhibit 1a), one can expect the following impact on the building-energy sector GHG footprint from a mail-in program offering two free CFLs—
GHG percentage Reduction = (1.5-percent reduction in household electricity use per home) x (50 percent participating homes) x (18-percent contribution of household electricity to the Building Sector Footprint) = 0.14-percent reduction in Buildings-Energy sector GHGs.
The above represents a generalized approach to compute the short-term GHG mitigation impact of various program designs using locally specific data, for example, data gathered or estimated on strategy effectiveness in the region (vary by climate regions) and participation rates measured explicitly in the different program types as the percentage of homes targeted that participate.
Voluntary Programs (A1)
Computation DetailsGHG Impact
Estimate
Exhibit 5
Back-of-the-Envelope Computations That Estimate the GHG Impact for Various City-Scale Voluntary (A1) and Policy/Regulatory (A2) Building Upgrade Programs (1 of 2)
Free CFL giveaway: mail-in program
Electricity: (1.5% reduction in household electricity use per home) × (50% participating homes) × (18% contribution of household electricity to the Building Sector Footprint)
0.14%
Door-to-door outreach: low-cost weatherization
Natural Gas: (5% reduction in household natural gas use per home) × (2% participating homes) × (10% contribution of household natural gas to the Building Sector Footprint)
0.01%
Low-income free home upgrade program
Electricity: (2.8% reduction in household electricity use per home) × (0.4% participating homes) × (18% contribution of household electricity to the Building Sector Footprint)
Natural Gas: (13.6% reduction in household natural gas use per home) × (0.4% participating homes) × (10% contribution of household natural gas to the Building Sector Footprint)
Household Electricity = 0.003%
Household Natural Gas = 0.006%
TOTAL = 0.01%
Energy efficiency loan programs
GHG: (21% reduction in household GHGs per home) × (0.01% participating homes) × (28% contribution of household GHGs to the Building Sector Footprint)
0.001%
224
Ramaswami
Climate Change and City Hall
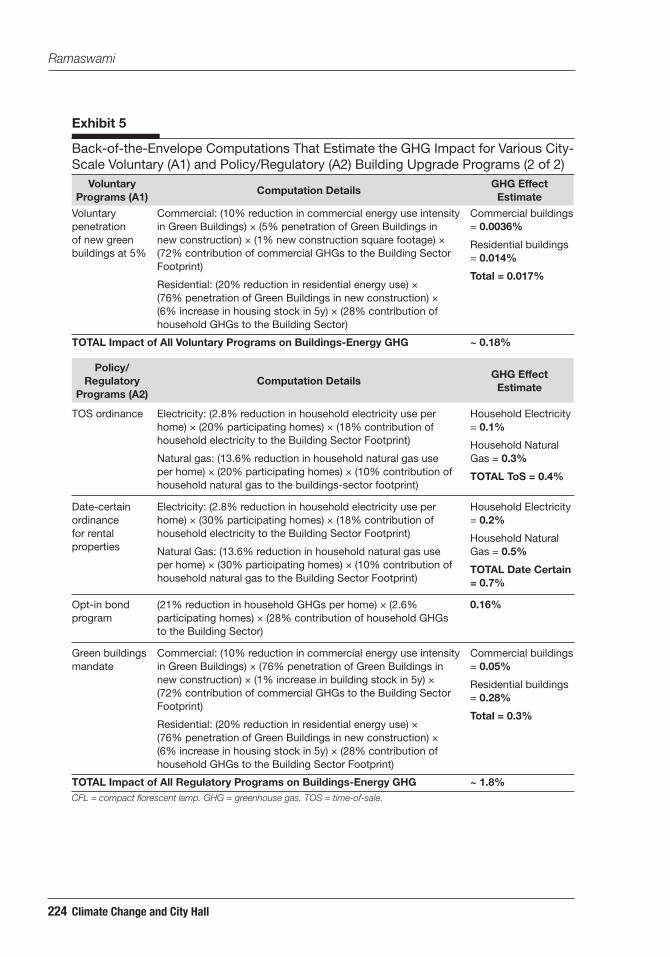
Voluntary Programs (A1)
Computation DetailsGHG Effect
Estimate
Policy/Regulatory
Programs (A2)Computation Details
GHG Effect Estimate
Voluntary penetration of new green buildings at 5%
Commercial: (10% reduction in commercial energy use intensity in Green Buildings) × (5% penetration of Green Buildings in new construction) × (1% new construction square footage) × (72% contribution of commercial GHGs to the Building Sector Footprint)
Residential: (20% reduction in residential energy use) × (76% penetration of Green Buildings in new construction) × (6% increase in housing stock in 5y) × (28% contribution of household GHGs to the Building Sector)
Commercial buildings = 0.0036%
Residential buildings = 0.014%
Total = 0.017%
TOTAL Impact of All Voluntary Programs on Buildings-Energy GHG ~ 0.18%
CFL = compact florescent lamp. GHG = greenhouse gas. TOS = time-of-sale.
TOS ordinance Electricity: (2.8% reduction in household electricity use per home) × (20% participating homes) × (18% contribution of household electricity to the Building Sector Footprint)
Natural gas: (13.6% reduction in household natural gas use per home) × (20% participating homes) × (10% contribution of household natural gas to the buildings-sector footprint)
Household Electricity = 0.1%
Household Natural Gas = 0.3%
TOTAL ToS = 0.4%
Date-certain ordinance for rental properties
Electricity: (2.8% reduction in household electricity use per home) × (30% participating homes) × (18% contribution of household electricity to the Building Sector Footprint)
Natural Gas: (13.6% reduction in household natural gas use per home) × (30% participating homes) × (10% contribution of household natural gas to the Building Sector Footprint)
Household Electricity = 0.2%
Household Natural Gas = 0.5%
TOTAL Date Certain = 0.7%
Opt-in bond program
(21% reduction in household GHGs per home) × (2.6% participating homes) × (28% contribution of household GHGs to the Building Sector)
0.16%
Green buildings mandate
Commercial: (10% reduction in commercial energy use intensity in Green Buildings) × (76% penetration of Green Buildings in new construction) × (1% increase in building stock in 5y) × (72% contribution of commercial GHGs to the Building Sector Footprint)
Residential: (20% reduction in residential energy use) × (76% penetration of Green Buildings in new construction) × (6% increase in housing stock in 5y) × (28% contribution of household GHGs to the Building Sector Footprint)
Commercial buildings = 0.05%
Residential buildings = 0.28%
Total = 0.3%
TOTAL Impact of All Regulatory Programs on Buildings-Energy GHG ~ 1.8%
Exhibit 5
Back-of-the-Envelope Computations That Estimate the GHG Impact for Various City- Scale Voluntary (A1) and Policy/Regulatory (A2) Building Upgrade Programs (2 of 2)

Social Actors and Key Policy Levers for Mitigating the Greenhouse Gas Footprint of U.S. Cities
225Cityscape
Note that a long-term analysis will need to carefully address when participation rates reach the maximum possible penetration rates in a community. The near-term analysis is conducted careful-ly to ensure there is no double counting across programs, for example, CFLs are not counted again in a neighborhood weatherization program. Similarly, the impact of policy/regulatory approaches shows the additional impact beyond what may be achieved in voluntary programs. Lastly, energy use reductions from efficiency, conservation, and taxation programs are computed first, before computing the GHG impact of programs that address electricity generation such as the RPS. The overall results—combining the impact of voluntary energy efficiency and conservation programs, policy approaches toward the same, taxation polices, and energy generation regulations—are shown in a near-term GHG mitigation wedge (exhibit 6) for Denver.
Exhibit 6
GHG Mitigation Impact in Buildings-Energy Sector Simulated for Denver, for Various Program Designs
* The impact of behavioral feedback devices when energy display meters are assumed to be installed in all homes.
Source: Adapted from Ramaswami et al. (2012a)
A1. Typical City-Scale Programs for Building Upgrades
1990 Level
2007 2012
B2. State Programs: Renewable Portfolio Standard (RPS) Demand-Side Management (DSM)
C. Behavioral Feedback*
B1. Voluntary Green Energy Purchases
A2. City Regulations
7,500,000
mt-
CO
2e
7,300,000
7,100,000
6,900,000
6,700,000
6,500,000
6,300,000
6,100,000
Identifying Key Actors and LeversSo, which program designs and which actor categories are most important in their ability to reduce GHG impact of Denver’s buildings-energy sector? Exhibit 6 shows the following—
• Efficacy of typical city-scale building upgrade programs (A1). All of voluntary building-sector outreach programs that cities engage in, together, yield less than 0.2-percent GHG

226
Ramaswami
Climate Change and City Hall
mitigation over 5 years in the buildings-energy sector, barely visible in exhibit 6. With annual GHG emissions increasing at 1.2 percent each year in a business-as-usual scenario (BAU in exhibit 6), these voluntary programs have virtually no impact.
• Impact of a few city-scale regulations for building upgrades (A2). In contrast, a few strategic city regulatory programs such as ToS ordinances, date-certain regulations for rentals, mandated green buildings, and local carbon taxes can have a much higher impact at ~1.8 percent over 5 years but have not diffused beyond a few cities.
• Voluntary programs to stimulate purchases of green energy (B1). Both among homes and businesses, this is an underutilized strategy that has high impact potential for GHG mitigation, yielding as much as 2.4-percent GHG mitigation over 5 years. A combination of A2 and B1 can yield GHG stabilization; that is, a bending of the curve so that 2012 GHG levels are level with 2007 levels.
• Cross-scale linkage to state regulation and utility programs (B2). State regulations that require clean electricity generation have the largest impact on GHG mitigation at 9.5 percent, as seen in exhibit 6, demonstrating the importance of cross-scale linkages. In conjunction with the city actions, measureable reductions in GHG can now be seen generating a downward curve in exhibit 6.
• New voluntary energy conservation programs that employ behavioral feedback. Such programs can also have a significant impact, but more study is needed to assess the long-term field performance of feedback devices to evaluate persistence in energy savings.
• A portfolio approach combining a few effective voluntary programs. A few key local city-scale regulations combined with supportive state-level policies can yield significant reduction in building-sector GHG in the near term in as little as 5 years, as shown in exhibit 6.
Implication for Assessing, Implementing, and Reporting On Community CAPsThis article draws useful insights for assessing, implementing, and reporting on communitywide CAPs with focus on GHG mitigation strategies.
Content analysis of CAPs. Exhibits 1a–b show that GHG contributions from different infra-structure sectors are not the same. Thus, when conducting a content analysis of CAPs, policies in the different sectors should not be given equal consideration in GHG mitigation. In general, buildings-energy and transportation sectors dominate the communitywide GHG footprints of cities and policies in these sectors should have greater weight when evaluating CAPs compared to say waste and recycling in U.S. cities.
Program design for implementing CAPs. Further, this article has shown that not all programs have the same GHG impact, even though they may address the same broad GHG mitigation strategy. Thus, when implementing CAPs, local governments must carefully consider the impact of program design on GHG mitigation potential using data from other cities customized to the local context, such as described in this article.

Social Actors and Key Policy Levers for Mitigating the Greenhouse Gas Footprint of U.S. Cities
227Cityscape
A portfolio approach. Such an approach is recommended wherein a few voluntary programs found to be most effective are combined with a few strategic city-scale regulations. Such an approach is essential because few cities would have the resources to pursue all the strategies listed in exhibit 2. Most important are cross-scale linkages with state programs and regulations that can have broad impact, such as Colorado’s RPS. A strategic portfolio mix of high-impact voluntary programs, a few key local city-scale regulations, combined with supportive state-level policies can yield significant reduction in building-sector GHG in the near term in as little as 5 years, as shown in exhibit 6.
A generalized quantitative approach. An approach to estimate the GHG impact of alternative program designs provided in this article can assist in selecting the portfolio components based on local physical and social context.
Program evaluation post implementation. This article suggests that cities must evaluate their energy outreach programs post implementation using data on actual participation rates achieved in different program designers, and if possible record actual energy savings in target and control populations.
Redesign. Based on program evaluation outcomes, cities may consider new approaches to increase participation in voluntary programs using opinion leaders and social networks. For example, Denver is testing a new approach wherein opinion leaders are identified a priori in a community and trained to distribute information on energy feedback devices. Participation rates in this experimental program will be compared with the same when the feedback devices are distributed at random in a comparable control neighborhood. Cities may also consider new regulations as they are piloted in other cities, for example, rental properties addressed in Boulder’s smart regulations. Finally, fostering linkages across the city scale, the regional scale, and state-scale programs is important as seen in exhibit 6.
Theoretical understanding facilitated by the SEIS framework. Theories around social norming and planned behavior (Schultz et al., 2007) are helping design messaging to promote conservation behaviors in response to various feedback devices (Allcott and Mullainathan, 2010; Opower, n.d.). Field studies of social networks in communities (Valente and Schuster, 2002) combined with theories of diffusion of innovation (Rogers, 2003) may inform the diffusion of energy efficiency upgrades among individual users, while network studies across cities may inform how innovative policies and programs diffuse across cities. Club theory (Prakash and Potoski, 2007) may help explain the inter - actions between policy actors and infrastructure designer-operator groups in designing utility-led programs such as green purchasing. Policy actors play a pivotal role in the design of all the programs and in coordinating all three actor categories. Frameworks such as those of institutional collective action (Feiock, 2007) and advocacy coalition (Weible and Nohrstedt, in press) can help promote a better understanding of how policy actors’ interactions with the other actors and across spatial scale shape the design and implementation of various GHG mitigation strategies shown in exhibit 2.
Thus, linking actors (exhibits 3 and 4) with footprints (exhibit 1) and with associated policies/ programs (exhibit 2), connects policy outputs with the environmental outcomes shown in exhibit 6. Integrating such data-driven quantitative analysis with social actor theories in the SEIS framework provides a platform to assess and redesign GHG mitigation programs in cities taking a holistic approach that connects numerous social actors who shape both energy use and energy generation within and across the city scale.

228
Ramaswami
Climate Change and City Hall
Acknowledgments
The author thanks Abel Chavez for his assistance in formatting the article and its exhibits and thanks anonymous reviewers for suggesting the restructuring this article for a broader audience. This article provides a synthesis of studies sponsored by the U.S. Department of Education GAANN Program, the U.S. National Science Foundation IGERT Program, and a contract with the city and county of Denver.
Author
Anu Ramaswami is the Charles M. Denny Chair Professor of Science, Technology and Public Policy at the University of Minnesota’s Humphrey School of Public Affairs.
References
Allcott, Hunt, and Sendhil Mullainathan. 2010. “Behavior and Energy Policy,” Science 327 (5970): 1204–1205.
Arapahoe County. 2009. Personal communication with county’s Energy $avings Partner director.
Bassett, Ellen, and Vivek Shandas. 2010. “Innovation and Climate Action Planning,” Journal of the American Planning Association 76 (4): 435–450.
Bernstein, Mark A., and James Griffin. 2005. Regional Differences in the Price-Elasticity of Demand for Energy. Santa Monica, CA: RAND Corporation.
Bird, Lori, and Marshall Kaiser. 2006. Trends in Utility Green Pricing Programs. NREL/TP-640-40777. Golden, CO: National Renewable Energy Laboratory.
Blasnik, Michael. 2006. Colorado Energy $avings Partners Impact Evaluation Report. Boston: M. Blasnik and Associates.
Boswell, Michael R., Adrienne I. Greve, and Tammy L. Seale. 2010. “An Assessment of the Link Between Greenhouse Gas Emissions Inventories and Climate Action Plans,” Journal of the American Planning Association 76 (4): 451–462.
British Standards Institution (BSI). 2013. Specification for the Assessment of Greenhouse Gas Emissions of a City by Direct Plus Supply Chain, and Consumption-Based Approaches—Draft. London, United Kingdom: British Standards Institution. In Press.
Brouillard, Carolyn, and Sarah Van Pelt. 2007. “A Community Takes Charge: Boulder’s Carbon Tax.” Report prepared for the City of Boulder. Boulder, CO: City of Boulder.
Buchanan, Wyatt. 2008. “Newsom Signs Strict Green Building Codes Into Law,” San Francisco Chronicle, August 5.
Chavez, Abel, and Anu Ramaswami. 2013. “Articulating a Trans-Boundary Infrastructure Supply Chain Greenhouse Gas Emission Footprint for Cities: Mathematical Relationships and Policy Relevance,” Energy Policy 54: 376–384.

Social Actors and Key Policy Levers for Mitigating the Greenhouse Gas Footprint of U.S. Cities
229Cityscape
———. 2011. “Progress Toward Low-Carbon: Approaches for Trans-Boundary Greenhouse Gas Emissions Footprinting for Cities,” Carbon Management 2 (4): 471–482.
City of Berkeley. 2010. “Residential Energy Conservation Ordinance (RECO).” Available at http://www.ci.berkeley.ca.us/ContentDisplay.aspx?id=16030 (accessed January 2010).
City of Boulder. 2010. “Smart Regs: Smart Regulation for Sustainable Places.” Available at http://www.bouldercolorado.gov/files/PDS/rentalhousing/Energy_Efficiency_Project/SR_factsheet.pdf (accessed March 1, 2013).
ClimateSmart Loan Program (CSLP). 2010. “The Commercial ClimateSmart Loan Program is Currently Not Accepting Applications.” Available at http://www.climatesmartloanprogram.com/cslp_commercial.html (accessed Febrary 28, 2013).
Darby, Sarah. 2006. The Effectiveness of Feedback on Energy Consumption. Oxford, United Kingdom: University of Oxford, Environmental Change Institute.
Dietz, Thomas, Gerald T. Gardner, Jonathan Gillian, Paul C. Stern, and Michael P. Vandenbergh. 2009. “Household Actions Can Provide a Behavioral Wedge To Rapidly Reduce U.S. Carbon Emissions,” Proceedings of the National Academy of Sciences of the United States of America 106 (44): 18452–18456.
ENERGY STAR. 2007. “Financing Guidebook for Energy Efficiency Program Sponsors, December 2007.” Available at http://www.energystar.gov/ia/home_improvement/downloads/FinancingGuidebook.pdf (accessed February 28, 2013).
———. n.d. “Qualified New Homes.” Available at http://www.energystar.gov/index.cfm?c=new_homes.hm_index (accessed October 15, 2010).
Environmental Protection Agency (EPA). 2011. “The Emissions & Generation Resource Integrated Database (eGRID),” eGRID website: http://www.epa.gov/cleanenergy/energy-resources/egrid/index.html (accessed April 2011).
———. 2009. “Rapid Deployment Energy Efficiency Toolkit (RDEE): Planning & Implementation.” Available at http://www.epa.gov/cleanenergy/documents/suca/rdee_toolkit.pdf (accessed February 2013).
Feiock, Richard C. 2007. “Rational Choice and Regional Governance,” Journal of Urban Affairs 29 (1): 47–63.
Fischer, Corinna. 2008. “Feedback on Household Electricity Consumption: A Tool for Saving Energy?” Energy Efficiency 1 (1): 79–104.
Greenprint. 2007. City of Denver Climate Action Plan: Recommendations to Mayor Hickenlooper. Denver: Mayor’s Greenprint Denver Advisory Council.
Hillman, Tim, and Anu Ramaswami. 2010. “Greenhouse Gas Emission Footprints and Energy Use Metrics for Eight US Cities,” Environmental Science & Technology 44: 1902–1910.
Hirst, Eric. 1984. “Household Energy Conservation: A Review of the Federal Residential Conservation Service,” Public Administration Review 44 (5): 421–430.
230
Ramaswami
Climate Change and City Hall
ICLEI – Local Governments for Sustainability. 2012. U.S. Community Protocol for Accounting and Reporting of Greenhouse Gas Emissions. ICLEIUSA website: http://www.icleiusa.org/tools/ghg-protocol/community-protocol/us-community-protocol-for-accounting-and-reporting-of-greenhouse-gas-emissions (accessed February 28, 2013).
Krause, Rachel M. 2011. “Policy Innovation, Intergovernmental Relations, and the Adoption of Climate Protection Initiatives by U.S. Cities,” Journal of Urban Affairs 33 (1): 45–60.
Marshall, Matthew. 2009. Personal communication (e-mail). Department of Environmental Health, City & County of Denver, Colorado.
Mendyk, Andrew, Steve Kihm, and Scott Pigg. 2010. A Reflection of Ourselves … How Households Interact With In-Home Feedback Devices: Results From a Treatment/Control Experiment. Washington, DC: American Council for an Energy-Efficient Economy.
Opower. n.d. Opower website homepage: http://www.opower.com/ (accessed October 15, 2010).
Ostrom, Elinor. 2005. Understanding Institutional Diversity. Princeton, NJ: Princeton University Press.
Pacala, Ste, and Robert Socolow. 2006. “Stabilization Wedges: Solving the Climate Problem for the Next Fifty Years with Current Technologies,” Science 305: 968−972.
Prakash, Aseem, and Matthew Potoski. 2007. “Collective Action Through Voluntary Environmental Programs: A Club Theory Perspective,” Policy Studies Journal 35 (4): 773–792.
Ramaswami, Anu. In press. Understanding Urban Infrastructure-Related Greenhouse Gas Emissions and Key Mitigation Strategies. Cambridge, MA: Lincoln Institute of Land Policy.
Ramaswami, Anu, Meghan Bernard, Abel Chavez, Tim Hillman, Michael Whitaker, Gregg Thomas, and Matthew Marshall. 2012a. “Quantifying Carbon Mitigation Wedges in U.S. Cities: Near-Term Strategy Analysis and Critical Review,” Environmental Science & Technology 46 (7): 3629–3642.
———. 2012b. “Supporting Information—Quantifying Carbon Mitigation Wedges in U.S. Cities: Near-Term Strategy Analysis and Critical Review,” Environmental Science & Technology 46 (7): S1–S14.
Ramaswami, Anu, Abel Chavez, and Marian Chertow. 2013. “Carbon Footprinting of Cities and Implications for Analysis of Urban Material and Energy Flows,” Journal of Industrial Ecology 16 (6): 783–785.
Ramaswami, Anu, Abel Chavez, Jennifer Ewing-Thiel, and Kara Reeve. 2011. “Two Approaches to Greenhouse Gas Emissions Accounting at the City-Scale,” Environmental Science & Technology 45 (10): 4205–4206.
Ramaswami, Anu, Tim Hillman, Bruce Janson, Mark Reiner, and Gregg Thomas. 2008. “A Demand-Centered Hybrid Life Cycle Methodology for City-Scale Greenhouse Gas Inventories,” Environmental Science & Technology 42 (17): 6456–6461.

Social Actors and Key Policy Levers for Mitigating the Greenhouse Gas Footprint of U.S. Cities
231Cityscape
Ramaswami, Anu, Christopher Weible, Deborah Main, Tanya Heikkila, Saba Siddiki, Andrew Duvall, Andrew Pattison, and Meghan Bernard. Forthcoming. “A Social-Ecological Infrastructural Systems (SEIS) Framework for Inter-Disciplinary Study of Sustainable City-Systems: An Integrative Curriculum Across Seven Major Disciplines,” Journal of Industrial Ecology.
Rogers, Everett M. 2003. Diffusion of Innovations, 5th ed. New York: Free Press.
Schultz, P. Wesley, Jessica M. Nolan, Robert B. Cialdini, Noah J. Goldstein, and Vladas Griskevicius. 2007. “The Constructive, Destructive, and Reconstructive Power of Social Norms,” Psychological Science 18 (5): 429–434.
Simons, Robert A., Eugene Choi, and Donna M. Simons. 2009. “The Effect of State and City Green Policies on the Market Penetration of Green Commercial Buildings,” Journal of Sustainable Real Estate 1 (1): 139–166.
Southern California Edison (SCE). 2012. “Special Time-Of-Use Rates.” Available at http://www.sce.com/residential/rates/special-time-of-use.htm (accessed February 28, 2013).
State of Colorado. 2010. “Governor Ritter Signs Historic Renewable Energy Bill.” Available at http://www.metrodenver.org/metro-denver-news/gov--ritter-signs-historic-renewable-energy-bill.html (accessed February 28, 2013).
Stern, Paul C., Elliot Aronson, John M. Darley, Daniel H. Hill, Eric Hirst, Willett Kempton, and Thomas J. Wilbanks. 1985. “The Effectiveness of Incentives for Residential Energy Conservation,” Evaluation Review 10 (2): 147–176.
Stern, Paul C. 2002. “Changing Behavior in Households and Communities: What Have We Learned?” In New Tools for Environmental Protection: Education, Information, and Voluntary Measures, edited by Thomas Dietz and Paul C. Stern. Washington, DC: National Academy Press: 201–212.
Tachibana, Debra.L.O., and Karen A. Brattesani. 2003. “Seattle’s Conservation Kit Program—Transforming the Residential Use of Compact Fluorescent Lighting.” Available at http://www.seattle.gov/light/Conserve/Reports/paper_2.pdf (accessed February 28, 2013).
Tang, Zhengtong, Samuel D. Brody, Courtney E. Quinn, Liang Chang, and Ting Wei. 2010. “Moving From Agenda to Action: Evaluating Local Climate Change Action Plans,” Journal of Environmental Planning and Management 53 (1): 41–62.
Turner, Kathy, and Mark Frankel. 2008. Energy Performance of LEED for New Construction Buildings. Washington, DC: U.S. Green Buildings Council, New Buildings Institute.
Valente, Thomas W., and Darleen V. Schuster. 2002. “The Public Health Perspective for Commun-icating Environmental Issues,” In New Tools for Environmental Protection: Education, Information, and Voluntary Measures, edited by Thomas Dietz and Paul C. Stern. Washington, DC: National Academy Press: 105–124.
Weible, Christopher M., and Daniel Nohrstedt. In press. “The Advocacy Coalition Framework: Coalitions, Learning, and Policy Change.” In Routledge Handbook of Public Policy, edited by Eduardo Araral, Scott Fritzen, Michael Howlett, M Ramesh, and Xun Wu. New York: Routledge.

232
Ramaswami
Climate Change and City Hall
Wheeler, Stephen M. 2008. “State and Municipal Climate Change Plans: The First Generation,” Journal of the American Planning Association 74 (4): 481–496.
Xcel Energy. 2011. “Windsource® for Residences—Pricing Terms and Conditions for Resi-dential Customers in Colorado, Minnesota, New Mexico and Wisconson.” Available at http://responsiblebynature.com/sites/default/files/WindsourcePricingTermsandConditions.pdf (accessed February 28, 2013).
———. 2009. “2009/2010 Demand-Side Management Biennial Plan.” Report prepared for the Public Service Company of Colorado. Denver: Public Service Company of Colorado.