social activity measure august 10th- 17th
TRANSCRIPT
Social Activity MeasureAugust 10th- 17th
ABOUT THE RESEARCH
The Social Activity Measure (SAM) is a behavioural study that records the public response to the risk of COVID-19 infection over time. Designed by the ESRI’s Behavioural Research Unit (BRU), SAM is an anonymous, interactive, online study that surveys people about their recent activity. The study offers insight into where and how risks of COVID-19 transmission arise. SAM aims to inform policy regarding the opening of parts of the economy and society, while keeping COVID-19 under control. The research was designed by the BRU in consultation with the Department of the Taoiseach, which funds the work. The survey is completely anonymous. Where comparisons between survey rounds are highlighted, they are statistically significant.
TIMING
This slide deck presents results from a nationally representative sample of 1,000 people aged 18 and over who participated in the study between August 10th and 17th. The maximum number of guests permitted to attend weddings rose from 50 to 100 on August 5th. A clarification that up to 200 people are permitted at organised outdoor events and gatherings was also issued on August 5th.Vaccine registration for children aged 12-15 opened on Thursday 12th August.
2Source: ESRI Social Activity Measure for the Department of the Taoiseach

Source: ESRI Social Activity Measure for the Department of the Taoiseach 3
Over the past month of peak holiday season there has been a slight decline in the average number of locations visited outside the home during the previous week and over the previous day.
Total locations visited
0
0.5
1
1.5
2
2.5
3
3.5
4
4.5
5
20
/1-3
1/1
2/2
-15
/2
16
/2-1
/3
2/3
-15
/3
16
/3-2
9/3
30
/3-1
2/4
13
/4-2
6/4
27
/4-1
0/5
18
/5-2
5/5
1/6
-7/6
15
/6-2
2-6
29
/6-6
/7
13
/7-2
0/7
27
/7-3
/8
10
/8-1
7/8
Loca
tio
ns
week
yesterday

Locations visited (previous week)
Source: ESRI Social Activity Measure for the Department of the Taoiseach3
The charts show the proportion of the population who had visited each location at some point during the previous week. Note the different scales on the vertical axis. There was little change from the previous round.
0
10
20
30
40
50
60
70
80
9020
/1-3
1/1
2/2-
15
/2
16/2
-1/3
2/3-
15
/3
16/3
-29
/3
30/3
-12
/4
13/4
-26
/4
27/4
-10
/5
18/5
-25
/5
1/6-
7/6
15/6
-22
-6
29/6
-6/7
13/7
-20
/7
27/7
-3/8
10/8
-17
/8
%
Shop/business
Transport
Outdoor
Work
Other home
0
10
20
30
40
50
60
20
/1-3
1/1
2/2-
15
/2
16/2
-1/3
2/3-
15
/3
16
/3-2
9/3
30
/3-1
2/4
13
/4-2
6/4
27
/4-1
0/5
18
/5-2
5/5
1/6-
7/6
15/6
-22
-6
29/6
-6/7
13
/7-2
0/7
27/7
-3/8
10
/8-1
7/8
%
Medical
Café/pub/restaurant
Exercise
Indoor
Event
School/College
Hotel/B&B

Locations visited (yesterday)
Source: ESRI Social Activity Measure for the Department of the Taoiseach4
The charts show the proportion of the population who had visited each location at some point the previous day. Note the different scales on the vertical axis. The frequency of visits to the majority of locations fell slightly. Although indoor dining and drinking had been possible for the increasing proportion of vaccinated individuals for over two weeks, visits to cafés, pubs and restaurants did not increase.
0
5
10
15
20
25
30
35
40
45
26
/1-3
1/1
8/2
-15
/22
2/2
-1/3
8/3
-15
/32
2/3
-29
/35
/4-1
2/4
19
/4-2
6/4
3/5
-10
/51
8/5
-25
/51
/6-7
/61
5/6
-22
-62
9/6
-6/7
13
/7-2
0/7
27
/7-3
/81
0/8
-17
/8
%
Shop/business
Transport (all)
Outdoor
Work
Other home
0
2
4
6
8
10
12
14
16
18
20
26
/1-3
1/1
8/2
-15
/2
22
/2-1
/3
8/3
-15
/3
22
/3-2
9/3
5/4
-12
/4
19
/4-2
6/4
3/5
-10
/5
18
/5-2
5/5
1/6
-7/6
15
/6-2
2-6
29
/6-6
/7
13
/7-2
0/7
27
/7-3
/8
10
/8-1
7/8
Medical
Café/pub/restaurant
Exercise
Indoor
Transport (public)
0
0.5
1
1.5
2
2.5
3
3.5
4
4.5
5
26
/1-3
1/1
8/2
-15
/2
22
/2-1
/3
8/3
-15
/3
22
/3-2
9/3
5/4
-12
/4
19
/4-2
6/4
3/5
-10
/5
18
/5-2
5/5
1/6
-7/6
15
/6-2
2-6
29
/6-6
/7
13
/7-2
0/7
27
/7-3
/8
10
/8-1
7/8
Event
School/College
Hotel/B&B

Meeting people outside the household
Source: ESRI Social Activity Measure for the Department of the Taoiseach 6
The number of people individuals met up with from other households during the previous 48 hours remained the same.
0
10
20
30
40
50
60
25/1
-31
/1
7/2
-15
/2
21
/2-1
/3
7/3
-15
/3
21/3
-29
/3
4/4
-12
/4
18/4
-26
/4
2/5
-10
/5
18/5
-25
/5
1/6-
7/6
15/6
-22
-6
29/6
-6/7
13/7
-20
/7
27
/7-3
/8
10/8
-17
/8
%
Number of people met (previous 48h)
0
1-2
3-6
7+
0.0
0.5
1.0
1.5
2.0
2.5
3.0
3.5
4.0
4.5
25
/1-3
1/1
7/2
-15
/2
21/2
-1/3
7/3
-15
/3
21
/3-2
9/3
4/4
-12
/4
18
/4-2
6/4
2/5
-10
/5
18
/5-2
5/5
1/6-
7/6
15
/6-2
2-6
29/6
-6/7
13
/7-2
0/7
27/7
-3/8
10
/8-1
7/8
Mean number of people met
All
Not vaccinated
Close contacts* (previous day)
Source: ESRI Social Activity Measure for the Department of the Taoiseach 7
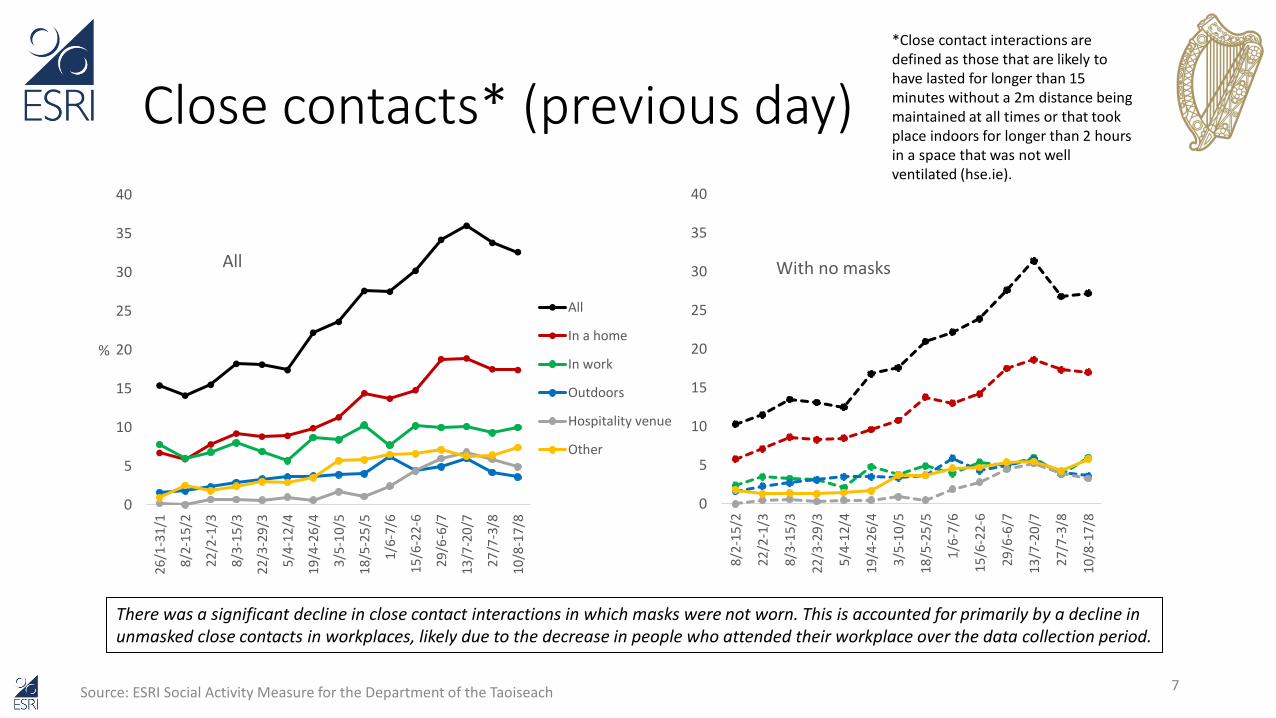
*Close contact interactions are defined as those that are likely to have lasted for longer than 15 minutes without a 2m distance being maintained at all times or that took place indoors for longer than 2 hours in a space that was not well ventilated (hse.ie).
There was a significant decline in close contact interactions in which masks were not worn. This is accounted for primarily by a decline in unmasked close contacts in workplaces, likely due to the decrease in people who attended their workplace over the data collection period.
0
5
10
15
20
25
30
35
40
26/1
-31
/1
8/2
-15
/2
22
/2-1
/3
8/3
-15
/3
22/3
-29
/3
5/4
-12
/4
19/4
-26
/4
3/5
-10
/5
18/5
-25
/5
1/6
-7/6
15/6
-22
-6
29
/6-6
/7
13/7
-20
/7
27
/7-3
/8
10/8
-17
/8
%
All
All
In a home
In work
Outdoors
Hospitality venue
Other
0
5
10
15
20
25
30
35
40
8/2-
15
/2
22/2
-1/3
8/3-
15
/3
22/3
-29
/3
5/4-
12
/4
19/4
-26
/4
3/5-
10
/5
18/5
-25
/5
1/6
-7/6
15
/6-2
2-6
29/6
-6/7
13/7
-20
/7
27/7
-3/8
10/8
-17
/8
With no masks

Visits to homes
Source: ESRI Social Activity Measure for the Department of the Taoiseach 8
The decline in visits to other homes observed in the previous round sustained, although it was not accompanied by a reduction in close contacts during social visits.
0
5
10
15
20
25
30
352
6/1
-31
/1
8/2
-15
/2
22
/2-1
/3
8/3
-15
/3
22
/3-2
9/3
5/4
-12
/4
19
/4-2
6/4
3/5
-10
/5
18
/5-2
5/5
1/6
-7/6
15
/6-2
2-6
29
/6-6
/7
13
/7-2
0/7
27
/7-3
/8
10
/8-1
7/8
% o
f re
spo
nd
ents
Proportion who had visitors or visited another household (previous day)
Any visit
Non-social (e.g. care,professional)Social visit
Social visit (closecontact)

Close contacts and social home visits by vaccine status
Source: ESRI Social Activity Measure for the Department of the Taoiseach 9
Individuals who are fully vaccinated now account for the large proportion of both close contacts and social visits to homes.
0
5
10
15
20
25
30
35
40
26
/1-3
1/1
8/2
-15
/2
22
/2-1
/3
8/3
-15
/3
22
/3-2
9/3
5/4
-12
/4
19
/4-2
6/4
3/5
-10
/5
18
/5-2
5/5
1/6
-7/6
15
/6-2
2-6
29
/6-6
/7
13
/7-2
0/7
27
/7-3
/8
10
/8-1
7/8
% o
f p
op
ula
tio
n
Close contacts by vaccine status
Total
No doses received
One dose received
Both doses received
At least one dose received
0
5
10
15
20
25
30
26
/1-3
1/1
8/2
-15
/2
22
/2-1
/3
8/3
-15
/3
22
/3-2
9/3
5/4
-12
/4
19
/4-2
6/4
3/5
-10
/5
18
/5-2
5/5
1/6
-7/6
15
/6-2
2-6
29
/6-6
/7
13
/7-2
0/7
27
/7-3
/8
10
/8-1
7/8
Social visits to homes by vaccination status

“Socialisers”
Source: ESRI Social Activity Measure for the Department of the Taoiseach 10
“Socialisers”
Broadly speaking, people risk transmission in two ways: (i) deciding where they go, (ii) how they behave once there. The chart relates to (i) and shows the histogram of an index that captures how often people visited various settings and events, while also accounting for the riskiness of the settings. Points are added to the index based on how many people were present in settings attended, the number of close contacts, the number of people met who were not vaccinated, and whether the individual travelled beyond the county, into Northern Ireland or abroad. The density units on the vertical axis reflect the proportion of the population at each score. Hence, the higher bars at the lower end show that most people have a low score on this socialising index. However, a minority form the long tail beyond the red line. Thus, these “socialisers” sit apart from the majority, as they are much more active and expose themselves to greater risk. The proportion of socialisers has increased over successive rounds of SAM and is now approximately 1-in-6.

“Mitigators”
Source: ESRI Social Activity Measure for the Department of the Taoiseach 11
0
10
20
30
40
50
606
/4-1
3/4
20
/4-2
7/4
4/5
-11
/5
18
/5-2
5/5
1/6
-7/6
15
/6-2
2-6
29
/6-6
/7
13
/7-2
0/7
27
/7-3
/8
10
/8-1
7/8
% o
f sa
mp
le
Trends in levels of risk mitigation over time
Rarely/Never (0-49%)
Sometimes (50-66%)
Regularly (67-82%)
Very often/Always (83-100%)
“Non-mitigators”This chart shows how much people mitigated risk when they visited locations outside their home. The four groups are defined based on how often people reported keeping 2m distance, wearing a mask, and cleaning their hands in each location they visited. The red line shows an increase in “non-mitigators” – those who undertake these behaviours less than 50% of the time. They now account for almost one quarter of the population.

Non-mitigating socialisers
Source: ESRI Social Activity Measure for the Department of the Taoiseach 12
0
2
4
6
8
10
122
7/1
-1/2
9/2
-16
/2
23
/2-2
/3
9/3
-16
/3
23
/3-3
0/3
6/4
-13
/4
20
/4-2
7/4
4/5
-11
/5
18
/5-2
5/5
1/6
-7/6
15
/6-2
2-6
29
/6-6
/7
13
/7-2
0/7
27
/7-3
/8
10
/8-1
7/8
%
Non-mitigating socialisers
0
10
20
30
40
50
60
1 2 3 4 5 6 7
%
Score (1=not at all risky; 7=very risky)
Perceived risk of own behaviour
Rest of sample
Non-mitigatingsocialisers
As described in Slides 10 and 11, socialisers visit more locations with more people and close contacts, while non-mitigators engage in behaviours that reduce risk (maintaining social distance, wearing a mask, cleaning their hands) less than half the time when outside their home. The left-hand chart concerns the overlap between those two minority groups, as it shows the proportion of people who classify both as a “socialiser” and a non-mitigator. The proportion of these “non-mitigating socialisers” has doubled since January and now stands at 11%. Vaccination rates are somewhat lower in this group. The right-hand chart shows how risky people in this group perceive their own behaviour to be, compared with the rest of the population. While they do, on average, perceive their behaviour to be riskier than that of others, people in this group nevertheless view their behaviour as not being very risky.

Psychology of non-mitigating socialisers
Source: ESRI Social Activity Measure for the Department of the Taoiseach 13
-0.4
-0.3
-0.2
-0.1
0
0.1
0.2
0.3
0.4
Stan
dar
dis
ed c
oef
fici
ent
Non-mitigating socialisers (August data)
Being a non-mitigating socialiser is not strongly linked to socio-demographic background (e.g. age and gender), but is associated with certain beliefs and perceptions. The chart displays differences in the beliefs and perceptions of people in this high-risk group compared to the rest of the population, based on a statistical model. The points reflect the size of the differences: the further away from 0, the bigger the difference between non-mitigating socialisers and everyone else. The data show that members of this group are more likely to view the burden of restrictions as more important than preventing the spread of COVID-19, and less inclined to believe that others follow public health guidance. However, the strongest factor is the belief that restrictions are unfair. Perceived unfairness is measured by the average response to a series of questions about X specific restrictions (the full list was supplied in SAM Wave 14). For each respondents were asked to think about the purpose (to allow some things to go ahead while limiting the potential spread of the virus among people who could be infectious), before rating the fairness of the restriction on a 1-to-7 scale.

Workplace mitigation
Source: ESRI Social Activity Measure for the Department of the Taoiseach 14
30
40
50
60
70
80
90
100
8/2
-1/3
8/3
-29
/3
5/4
-25
/4
3/5
-25
/5
1/6
-22
/6
29
/6-2
0/7
27
/7-1
7/8
%
Masks, distance, ventilation
mask (self)
mask (others)
keep 2m
well ventilated
80
82
84
86
88
90
92
94
96
98
100
8/2
-1/3
8/3
-29
/3
5/4
-25
/4
3/5
-25
/5
1/6
-22
/6
29
/6-2
0/7
27
/7-1
7/8
%
Hand hygeine
sanitiser/soap
cleaned hands
The left-hand chart shows declining trends in workers wearing masks, reporting that other in the work place wear masks, and keeping 2m from others, but not in the proportion of workers reporting that their workplace is well ventilated. Although still high, the proportion of workplaces providing sanitiser and soap for hand hygiene also displays a downward trend, as does the proportion of workers who report cleaning their hands.
Mitigation in shops
Source: ESRI Social Activity Measure for the Department of the Taoiseach 15
30
40
50
60
70
80
90
100
8/2
-1/3
8/3
-29
/3
5/4
-25
/4
3/5
-25
/5
1/6
-22
/6
29
/6-2
0/7
27
/7-1
7/8
%
Masks, distance, ventilation
mask (self)
mask (staff)
mask (customers)
keep 2m
well ventilated
70
75
80
85
90
95
100
8/2
-1/3
8/3
-29
/3
5/4
-25
/4
3/5
-25
/5
1/6
-22
/6
29
/6-2
0/7
27
/7-1
7/8
%
Hand hygeine
sanitiser/soap
cleaned hands
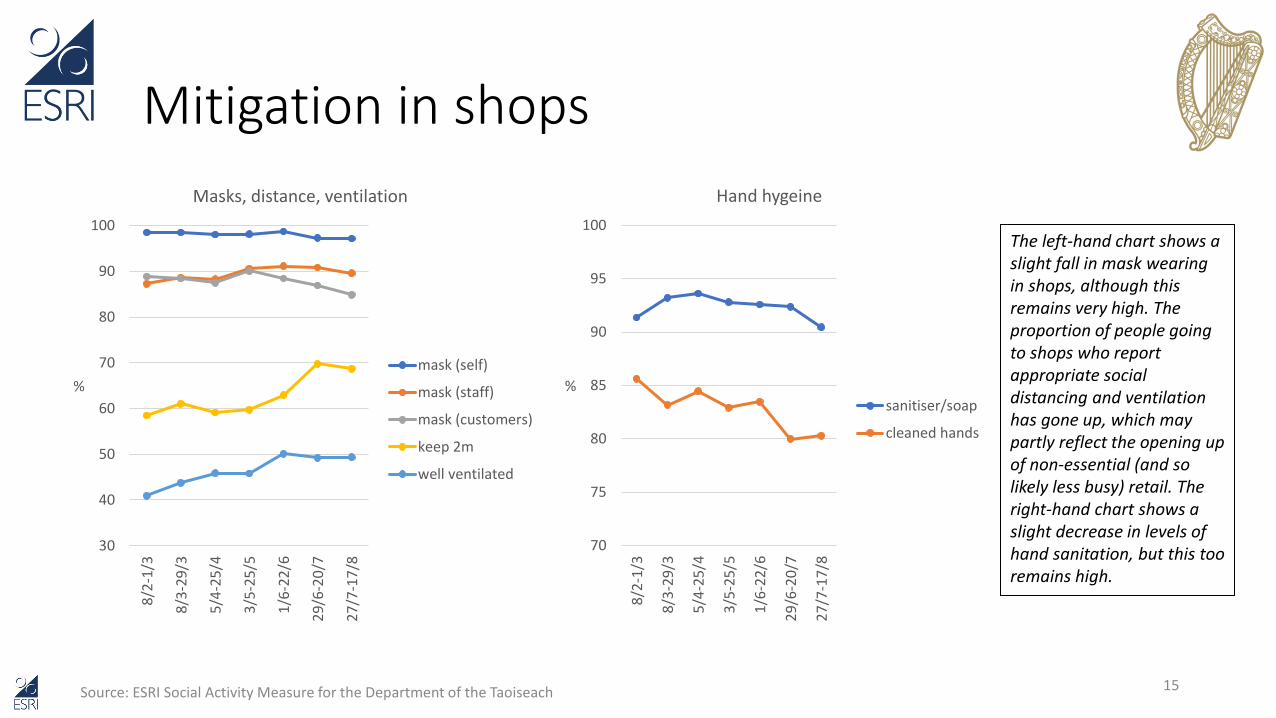
The left-hand chart shows a slight fall in mask wearing in shops, although this remains very high. The proportion of people going to shops who report appropriate social distancing and ventilation has gone up, which may partly reflect the opening up of non-essential (and so likely less busy) retail. The right-hand chart shows a slight decrease in levels of hand sanitation, but this too remains high.
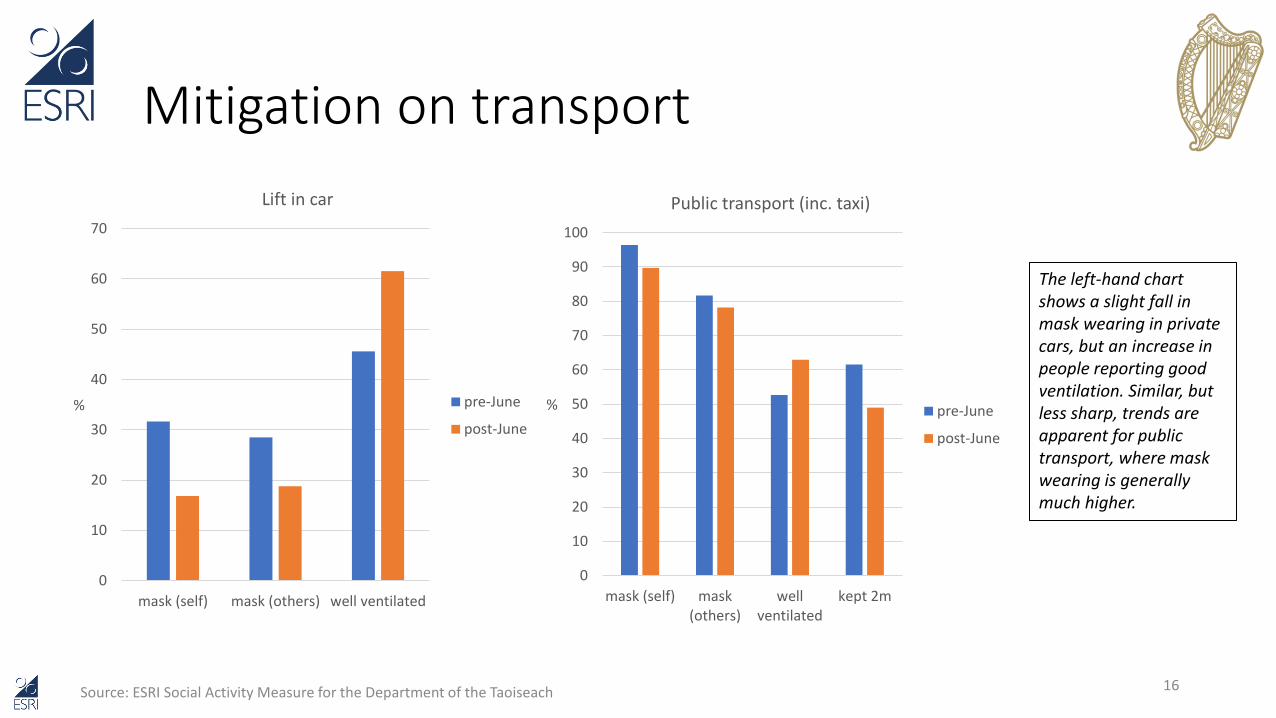
Mitigation on transport
Source: ESRI Social Activity Measure for the Department of the Taoiseach 16
0
10
20
30
40
50
60
70
mask (self) mask (others) well ventilated
%
Lift in car
pre-June
post-June
0
10
20
30
40
50
60
70
80
90
100
mask (self) mask(others)
wellventilated
kept 2m
%
Public transport (inc. taxi)
pre-June
post-June
The left-hand chart shows a slight fall in mask wearing in private cars, but an increase in people reporting good ventilation. Similar, but less sharp, trends are apparent for public transport, where mask wearing is generally much higher.
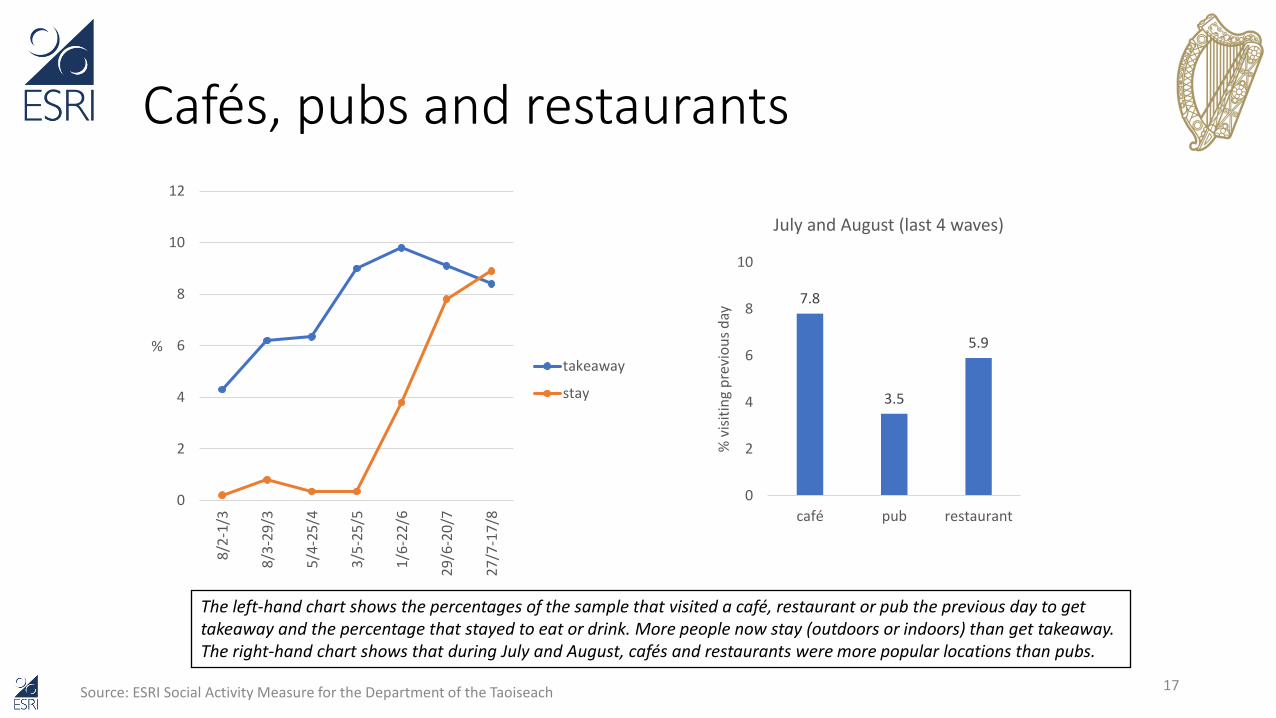
Cafés, pubs and restaurants
Source: ESRI Social Activity Measure for the Department of the Taoiseach 17
0
2
4
6
8
10
12
8/2
-1/3
8/3
-29
/3
5/4
-25
/4
3/5
-25
/5
1/6
-22
/6
29
/6-2
0/7
27
/7-1
7/8
%takeaway
stay
7.8
3.5
5.9
0
2
4
6
8
10
café pub restaurant
% v
isit
ing
pre
vio
us
day
July and August (last 4 waves)
The left-hand chart shows the percentages of the sample that visited a café, restaurant or pub the previous day to get takeaway and the percentage that stayed to eat or drink. More people now stay (outdoors or indoors) than get takeaway. The right-hand chart shows that during July and August, cafés and restaurants were more popular locations than pubs.

Comparing locations
Source: ESRI Social Activity Measure for the Department of the Taoiseach 18
1.0
2.7
1.2
0
0.5
1
1.5
2
2.5
3
café pub restaurant
Mea
n
People met (>15 mins) from outside household
0
10
20
30
40
50
60
70
café pub restaurant
%
Context
inside
outside
takeaway
0
5
10
15
20
25
30
35
40
45
café pub restaurant
%
Duration of visit
<15 mins
15-60 mins
1-2 hrs
> 2hrs
Compared to customers going to cafés and restaurants, pubgoers met more people from outside their household, and were more likely to stay, to be indoors and to stay for longer.
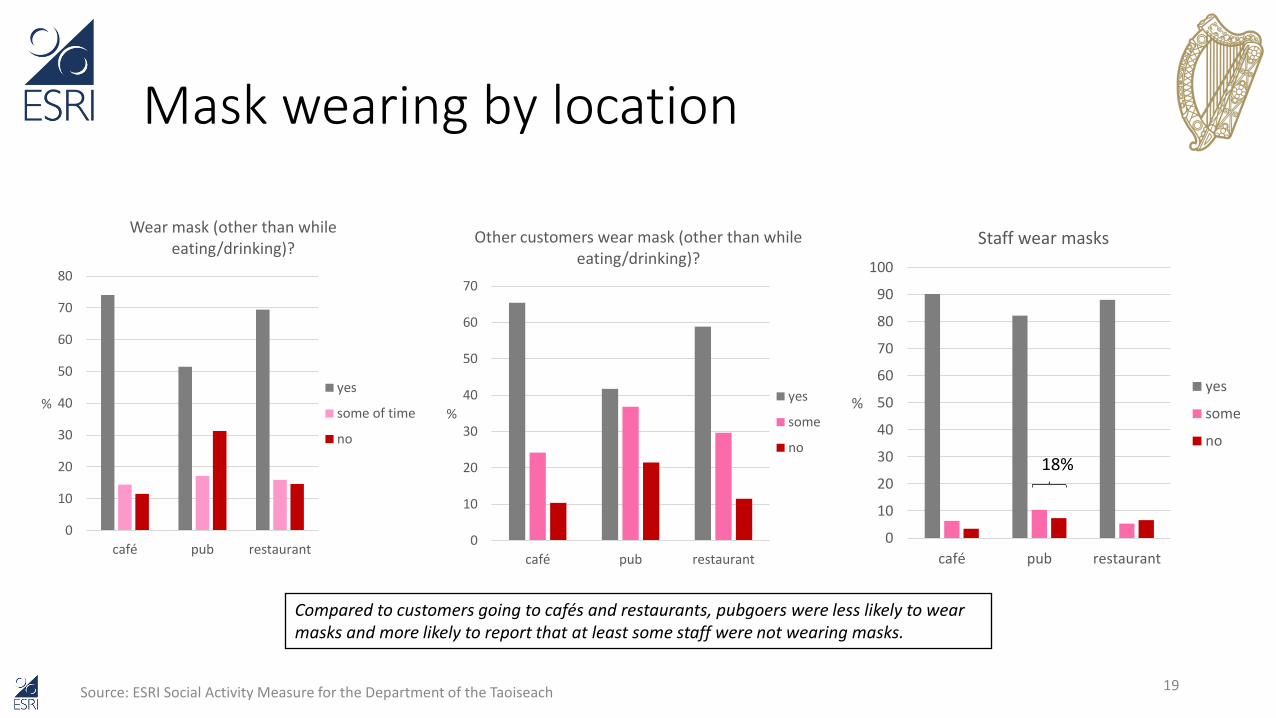
Mask wearing by location
Source: ESRI Social Activity Measure for the Department of the Taoiseach 19
0
10
20
30
40
50
60
70
80
café pub restaurant
%
Wear mask (other than while eating/drinking)?
yes
some of time
no
0
10
20
30
40
50
60
70
80
90
100
café pub restaurant
%
Staff wear masks
yes
some
no
18%
0
10
20
30
40
50
60
70
café pub restaurant
%
Other customers wear mask (other than while eating/drinking)?
yes
some
no
Compared to customers going to cafés and restaurants, pubgoers were less likely to wear masks and more likely to report that at least some staff were not wearing masks.

EU Digital Covid Certificate
Source: ESRI Social Activity Measure for the Department of the Taoiseach 20
Almost three-quarters of adults have received their EU Digital Covid Certificate (DCC). In approximately one-third of cases, individuals who ate or drank at an inside table reported that their DCC was not checked.
73.1
0.6 0.5
9.3
16.6
0
10
20
30
40
50
60
70
80
Has Cert -Vaccine
Has Cert -Test
Has Cert -Recovered
Waiting No
%
EU Digital COVID Certificate
2.3 2.7 2.7
1.3 1.2
1.6
0
1
2
3
4
5
Café Pub Restaurant
% r
esp
on
den
ts
Indoor Dining/Drinking - DCC Checked?
Checked Not Checked
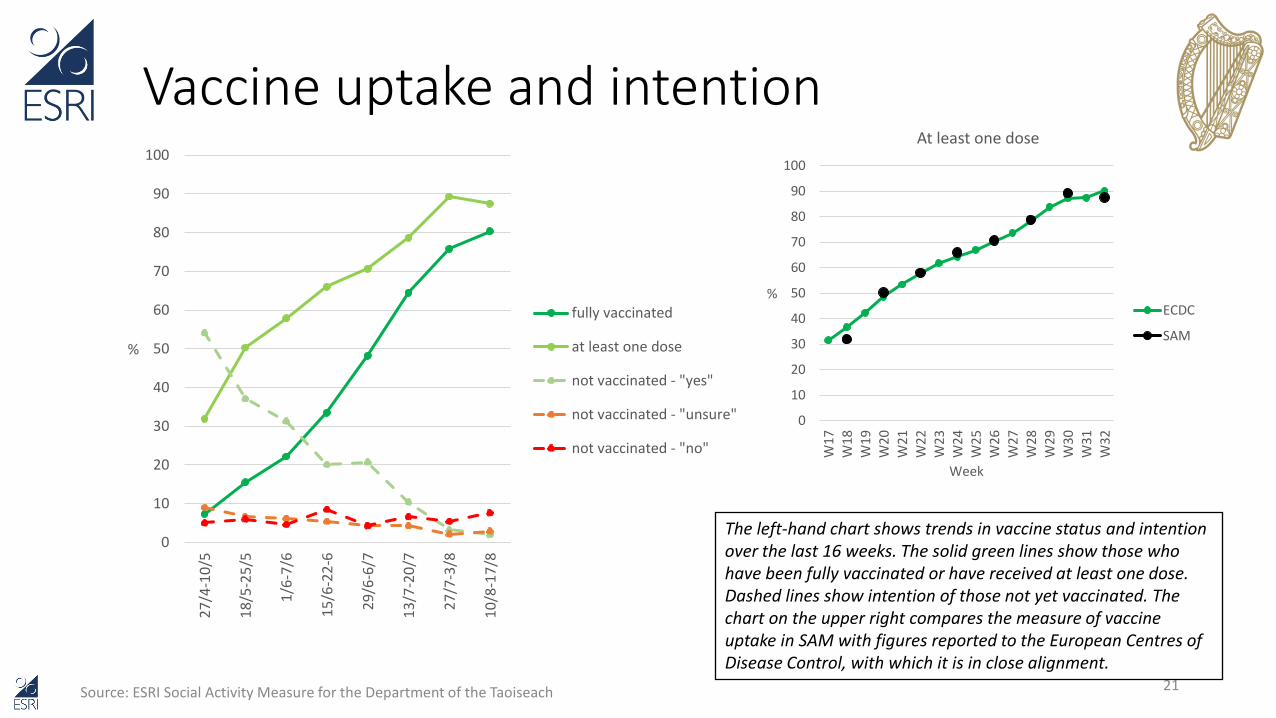
Vaccine uptake and intention
Source: ESRI Social Activity Measure for the Department of the Taoiseach 21
The left-hand chart shows trends in vaccine status and intention over the last 16 weeks. The solid green lines show those who have been fully vaccinated or have received at least one dose. Dashed lines show intention of those not yet vaccinated. The chart on the upper right compares the measure of vaccine uptake in SAM with figures reported to the European Centres of Disease Control, with which it is in close alignment.
0
10
20
30
40
50
60
70
80
90
100
27
/4-1
0/5
18
/5-2
5/5
1/6
-7/6
15
/6-2
2-6
29
/6-6
/7
13
/7-2
0/7
27
/7-3
/8
10
/8-1
7/8
%
fully vaccinated
at least one dose
not vaccinated - "yes"
not vaccinated - "unsure"
not vaccinated - "no"
0
10
20
30
40
50
60
70
80
90
100
W1
7
W1
8
W1
9
W20
W2
1
W2
2
W2
3
W2
4
W2
5
W2
6
W2
7
W2
8
W2
9
W3
0
W3
1
W3
2
%
Week
At least one dose
ECDC
SAM
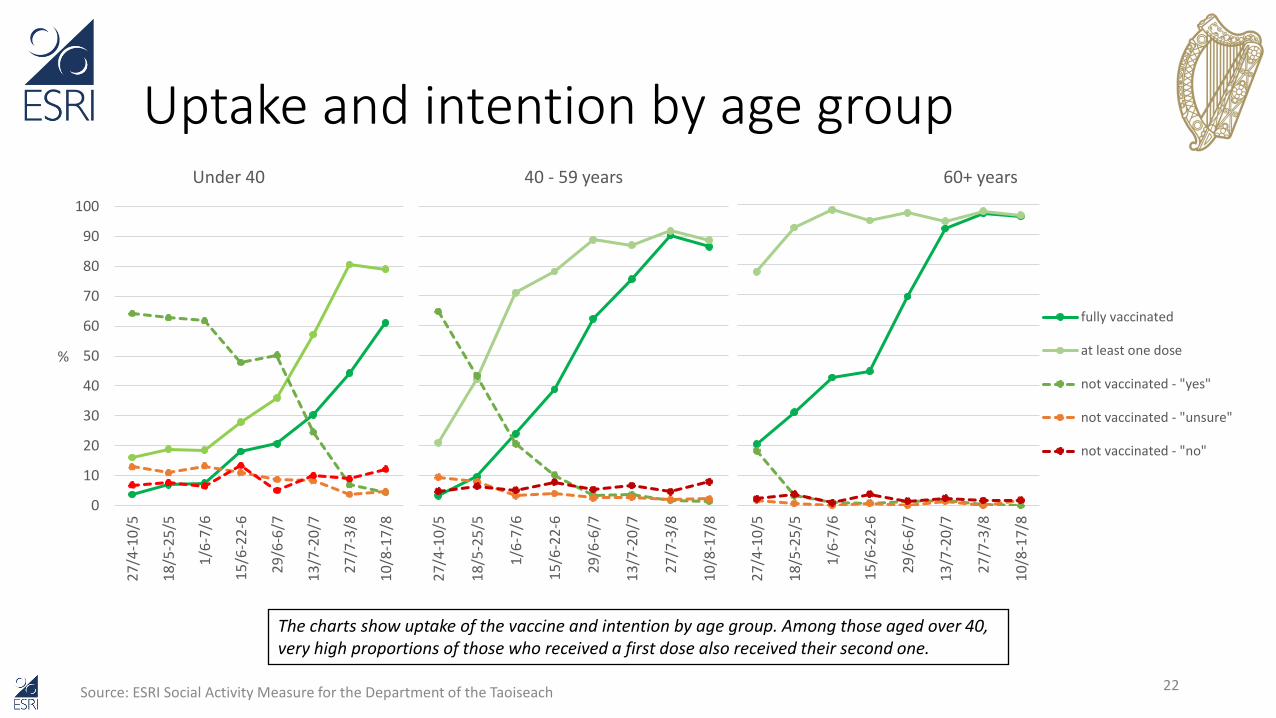
Uptake and intention by age group
Source: ESRI Social Activity Measure for the Department of the Taoiseach 22
The charts show uptake of the vaccine and intention by age group. Among those aged over 40, very high proportions of those who received a first dose also received their second one.
0
10
20
30
40
50
60
70
80
90
100
27
/4-1
0/5
18
/5-2
5/5
1/6
-7/6
15
/6-2
2-6
29
/6-6
/7
13
/7-2
0/7
27
/7-3
/8
10
/8-1
7/8
%
Under 40
27
/4-1
0/5
18
/5-2
5/5
1/6
-7/6
15
/6-2
2-6
29
/6-6
/7
13
/7-2
0/7
27
/7-3
/8
10
/8-1
7/8
40 - 59 years
27
/4-1
0/5
18
/5-2
5/5
1/6
-7/6
15
/6-2
2-6
29
/6-6
/7
13
/7-2
0/7
27
/7-3
/8
10
/8-1
7/8
60+ years
fully vaccinated
at least one dose
not vaccinated - "yes"
not vaccinated - "unsure"
not vaccinated - "no"
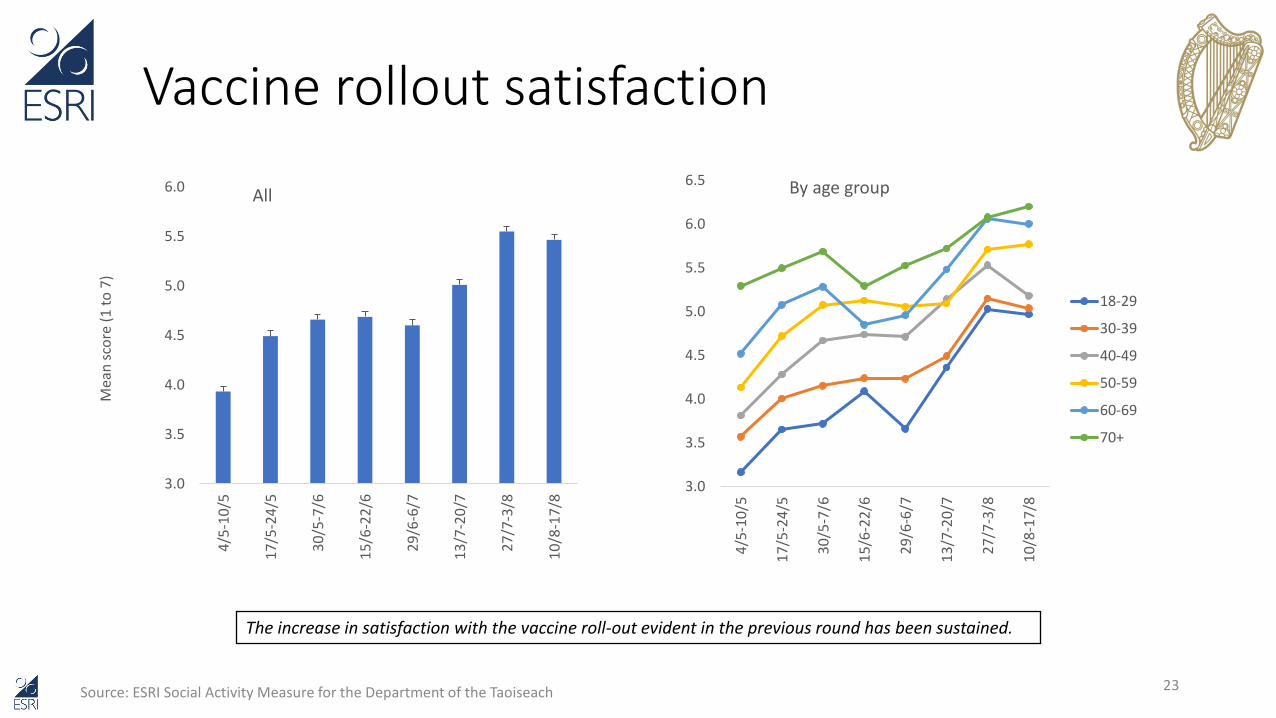
Vaccine rollout satisfaction
Source: ESRI Social Activity Measure for the Department of the Taoiseach 23
The increase in satisfaction with the vaccine roll-out evident in the previous round has been sustained.
3.0
3.5
4.0
4.5
5.0
5.5
6.0
6.5
4/5
-10
/5
17
/5-2
4/5
30
/5-7
/6
15
/6-2
2/6
29
/6-6
/7
13
/7-2
0/7
27
/7-3
/8
10
/8-1
7/8
By age group
18-29
30-39
40-49
50-59
60-69
70+
3.0
3.5
4.0
4.5
5.0
5.5
6.0
4/5
-10
/5
17
/5-2
4/5
30
/5-7
/6
15
/6-2
2/6
29
/6-6
/7
13
/7-2
0/7
27
/7-3
/8
10
/8-1
7/8
Mea
n s
core
(1
to
7)
All
0
2
4
6
8
10
12
14
16
18
202
6/1
-31
/1
8/2
-15
/2
22
/2-1
/3
8/3
-15
/3
22
/3-2
9/3
5/4
-12
/4
19
/4-2
6/4
3/5
-10
/5
18
/5-2
5/5
1/6
-7/6
15
/6-2
2-6
29
/6-6
/7
13
/7-2
0/7
27
/7-3
/8
10
/8-1
7/8
% Inter-county Travel (24hrs)
NI Travel (past week)
Travel Off Island (past week)
Source: ESRI Social Activity Measure for the Department of the Taoiseach 24
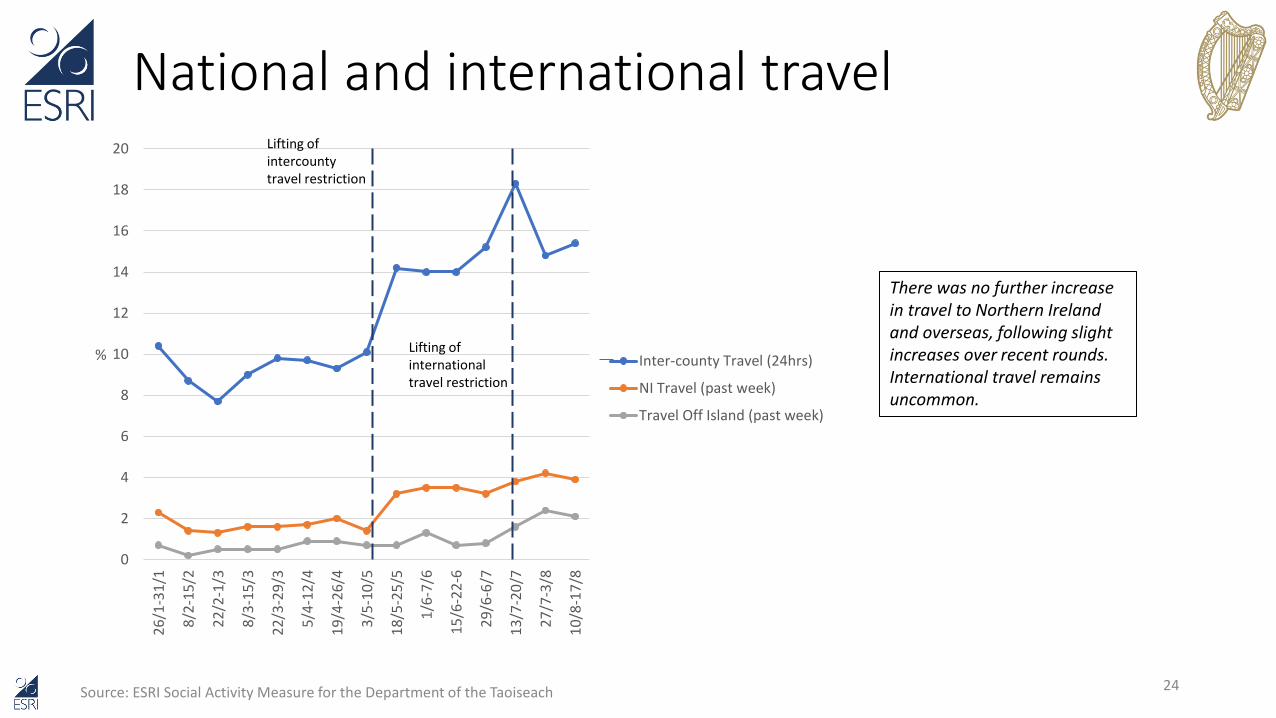
National and international travel
There was no further increase in travel to Northern Ireland and overseas, following slight increases over recent rounds. International travel remains uncommon.
Lifting of intercounty travel restriction
Lifting of international travel restriction

Wellbeing and Fatigue
Source: ESRI Social Activity Measure for the Department of the Taoiseach 25
There was a drop in self-reported wellbeing, but no change in how tiresome people are finding it to stick to restrictions.
4.0
4.2
4.4
4.6
4.8
5.0
5.2
5.4
5.6
27
/1-1
/2
9/2
-16
/2
23
/2-2
/3
9/3
-16
/3
23
/3-3
0/3
6/4
-13
/4
20
/4-2
7/4
4/5
-11
/5
18
/5-2
5/5
1/6
-7/6
15
/6-2
2-6
29
/6-6
/7
13
/7-2
0/7
27
/7-3
/8
10
/8-1
7/8
Sco
re (
1 t
o 7
)
Wellbeing
4.0
4.2
4.4
4.6
4.8
5.0
5.2
5.4
5.6
27
/1-1
/2
9/2
-16
/2
23
/2-2
/3
9/3
-16
/3
23
/3-3
0/3
6/4
-13
/4
20
/4-2
7/4
4/5
-11
/5
18
/5-2
5/5
1/6
-7/6
15
/6-2
2-6
29
/6-6
/7
13
/7-2
0/7
27
/7-3
/8
10
/8-1
7/8
Sco
re (
1 t
o 7
)
Restrictions "tiresome"?
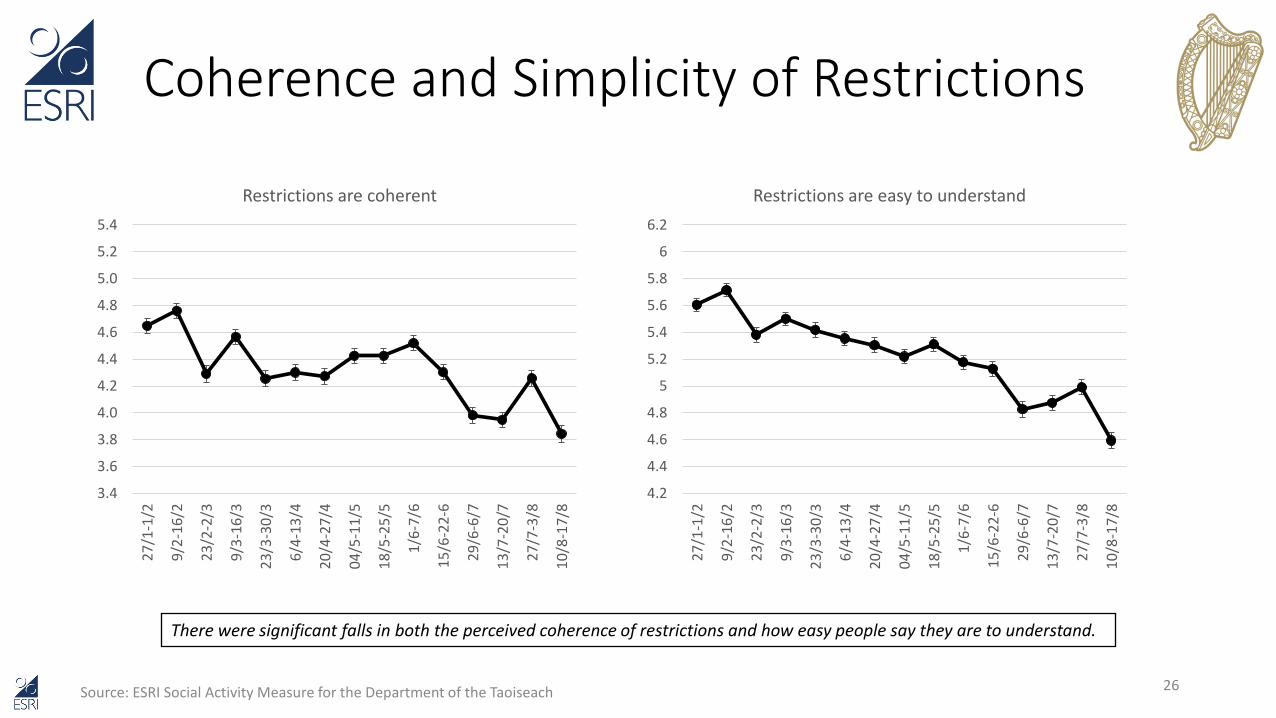
Coherence and Simplicity of Restrictions
There were significant falls in both the perceived coherence of restrictions and how easy people say they are to understand.
26Source: ESRI Social Activity Measure for the Department of the Taoiseach
3.4
3.6
3.8
4.0
4.2
4.4
4.6
4.8
5.0
5.2
5.4
27
/1-1
/2
9/2
-16
/2
23
/2-2
/3
9/3
-16
/3
23
/3-3
0/3
6/4
-13
/4
20
/4-2
7/4
04
/5-1
1/5
18
/5-2
5/5
1/6
-7/6
15
/6-2
2-6
29
/6-6
/7
13
/7-2
0/7
27
/7-3
/8
10
/8-1
7/8
Restrictions are coherent
4.2
4.4
4.6
4.8
5
5.2
5.4
5.6
5.8
6
6.2
27
/1-1
/2
9/2
-16
/2
23
/2-2
/3
9/3
-16
/3
23
/3-3
0/3
6/4
-13
/4
20
/4-2
7/4
04
/5-1
1/5
18
/5-2
5/5
1/6
-7/6
15
/6-2
2-6
29
/6-6
/7
13
/7-2
0/7
27
/7-3
/8
10
/8-1
7/8
Restrictions are easy to understand
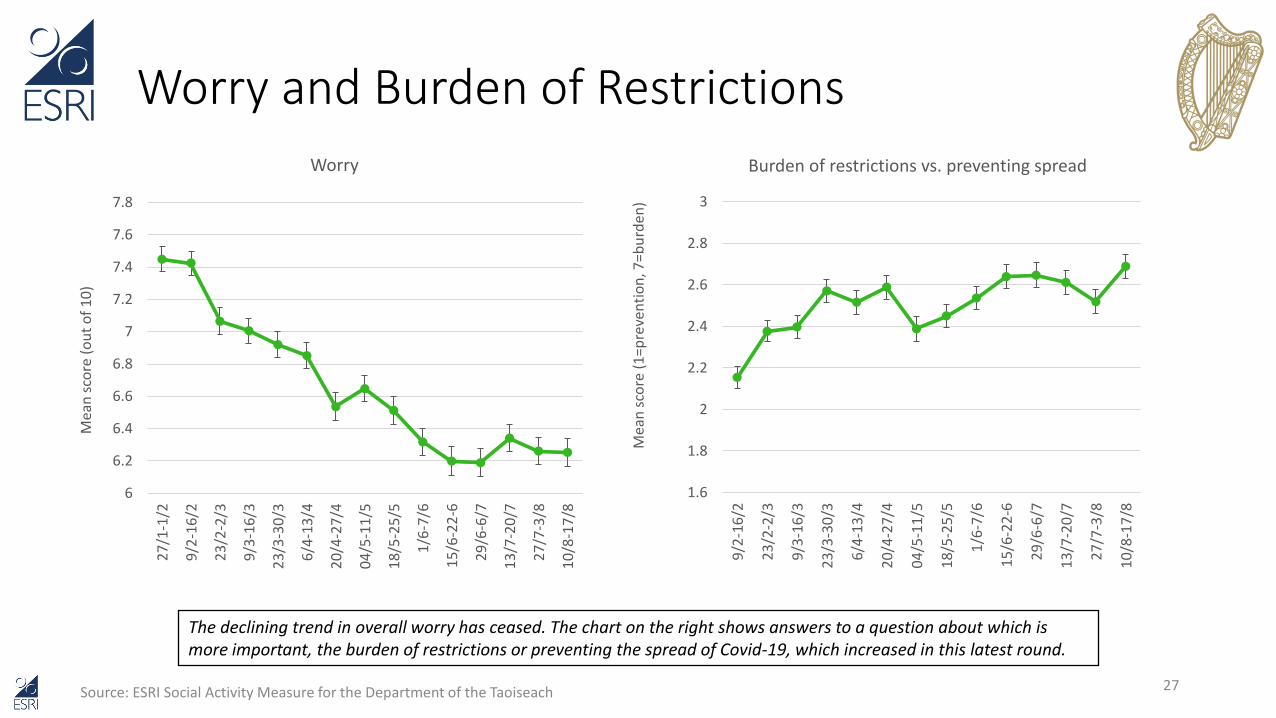
Worry and Burden of Restrictions
The declining trend in overall worry has ceased. The chart on the right shows answers to a question about which is more important, the burden of restrictions or preventing the spread of Covid-19, which increased in this latest round.
27Source: ESRI Social Activity Measure for the Department of the Taoiseach
6
6.2
6.4
6.6
6.8
7
7.2
7.4
7.6
7.8
27
/1-1
/2
9/2
-16
/2
23
/2-2
/3
9/3
-16
/3
23
/3-3
0/3
6/4
-13
/4
20
/4-2
7/4
04
/5-1
1/5
18
/5-2
5/5
1/6
-7/6
15
/6-2
2-6
29
/6-6
/7
13
/7-2
0/7
27
/7-3
/8
10
/8-1
7/8
Mea
n s
core
(o
ut
of
10
)
Worry
1.6
1.8
2
2.2
2.4
2.6
2.8
3
9/2
-16
/2
23
/2-2
/3
9/3
-16
/3
23
/3-3
0/3
6/4
-13
/4
20
/4-2
7/4
04
/5-1
1/5
18
/5-2
5/5
1/6
-7/6
15
/6-2
2-6
29
/6-6
/7
13
/7-2
0/7
27
/7-3
/8
10
/8-1
7/8
Mea
n s
core
(1
=pre
ven
tio
n, 7
=b
urd
en)
Burden of restrictions vs. preventing spread
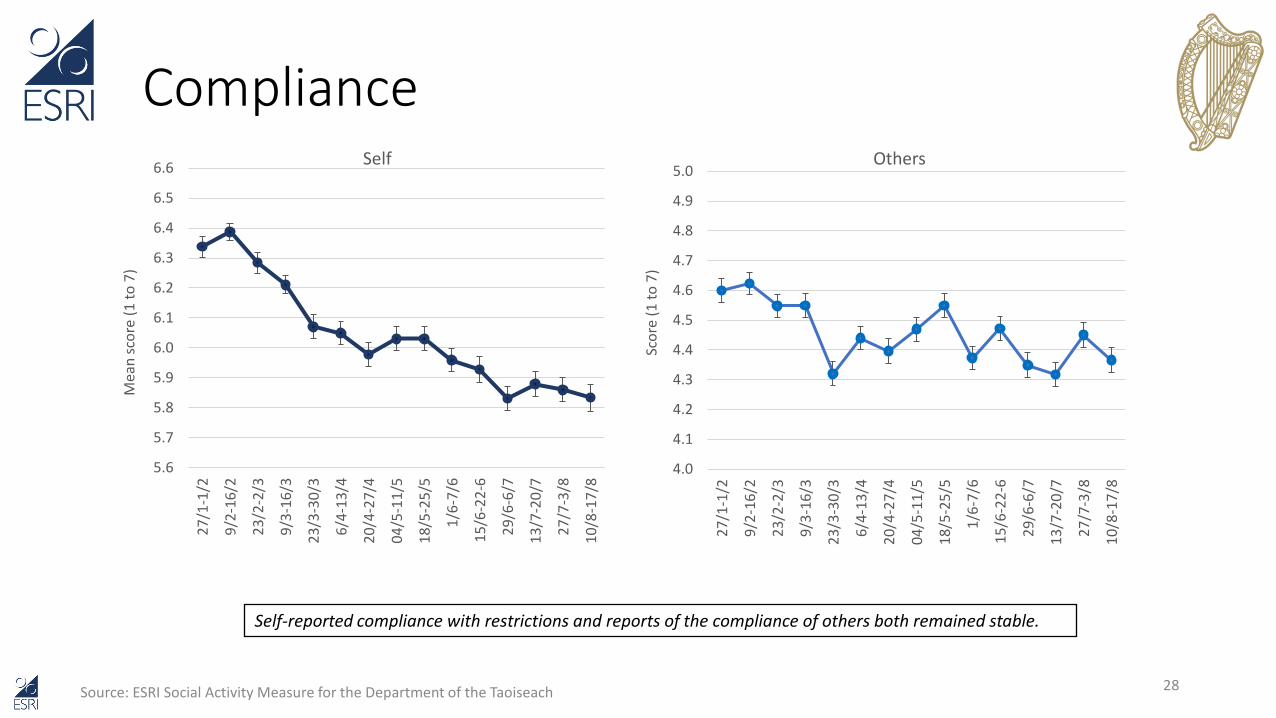
Compliance
Source: ESRI Social Activity Measure for the Department of the Taoiseach 28
Self-reported compliance with restrictions and reports of the compliance of others both remained stable.
5.6
5.7
5.8
5.9
6.0
6.1
6.2
6.3
6.4
6.5
6.6
27
/1-1
/2
9/2
-16
/2
23
/2-2
/3
9/3
-16
/3
23
/3-3
0/3
6/4
-13
/4
20
/4-2
7/4
04
/5-1
1/5
18
/5-2
5/5
1/6
-7/6
15
/6-2
2-6
29
/6-6
/7
13
/7-2
0/7
27
/7-3
/8
10
/8-1
7/8
Mea
n s
core
(1
to
7)
Self
4.0
4.1
4.2
4.3
4.4
4.5
4.6
4.7
4.8
4.9
5.0
27
/1-1
/2
9/2
-16
/2
23
/2-2
/3
9/3
-16
/3
23
/3-3
0/3
6/4
-13
/4
20
/4-2
7/4
04
/5-1
1/5
18
/5-2
5/5
1/6
-7/6
15
/6-2
2-6
29
/6-6
/7
13
/7-2
0/7
27
/7-3
/8
10
/8-1
7/8
Sco
re (
1 t
o 7
)
Others

Expectations for further easing
Source: ESRI Social Activity Measure for the Department of the Taoiseach 29
0
10
20
30
40
50
60
70
80
90
100
27/1-1/2(looking to
Feb)
23/2-2/3(looking to
Mar)
23/3-30/3(looking to
Apr)
20/4-27/4(looking to
May)
18/5-25/5(looking to
June)
15/6-22/6(looking to
July)
13/7-20/7(looking to
August)
10/8-17/8(looking toSeptember)
%Tightened a lot
Tightened a little
No change
Eased
Expectations for further lifting of restrictions were relatively stable, having become more pessimistic during the previous round.