soas department of economics working paper …€¦ · department of economics ... (lin et al....
TRANSCRIPT

Please cite this paper as:
No. 196
Understanding the Recent Trend of
Income Inequality in China
by
Juzhong Zhuang and Shi Li
(June, 2016)
Department of Economics
School of Oriental and African Studies
London
WC1H 0XG
Phone: + 44 (0)20 7898 4730 Fax: 020 7898 4759
E-mail: [email protected]
http://www.soas.ac.uk/economics/
Dep
art
men
t of
Eco
nom
ics Working Paper Series
ISSN 1753 - 5816
Zhuang, J. and Shi Li. (2016), ―Understanding the Recent Trend of Income Inequality in
China‖, SOAS Department of Economics Working Paper Series, No. 196, The School of
Oriental and African Studies.

The SOAS Department of Economics Working Paper Series is published electronically by
The School of Oriental and African Studies-University of London.
©Copyright is held by the author or authors of each working paper. SOAS DoEc Working
Papers cannot be republished, reprinted or reproduced in any format without the permission of
the paper‘s author or authors.
This and other papers can be downloaded without charge from:
SOAS Department of Economics Working Paper Series at
http://www.soas.ac.uk/economics/research/workingpapers/
Research Papers in Economics (RePEc) electronic library at
http://econpapers.repec.org/paper/
Design and layout: O.G. Dávila

SOAS Department of Economics Working Paper Series No 196 - 2016
1
Understanding the Recent Trend of Income Inequality in China
Juzhong Zhuang and Shi Li*
Abstract
This paper examines underlying factors that could explain the decline in income inequality in
China since 2008 and inquires whether the decline indicates China‘s income inequality has
peaked following the Kuznets hypothesis. The paper first identifies four key drivers of rising
income inequality in China since the mid-1980: rising skill premium, declining share of labor
income, increasing spatial inequality, and widening inequality in the distribution of wealth. It
then provides evidence that the reversal of these drivers, with the exception of wealth
inequality, could partly explains the decline in income inequality since 2008. The paper
argues that since part of the reversal of these drivers is policy-induced, it is important that the
policy actions continue for income inequality to decline further. The paper further argues that
a critical factor underlying the Kuznets hypothesis is that taxation and transfers play a bigger
role in income redistribution as a country becomes more developed, while their role is still
limited in China, the future path of China‘s income inequality may not be one-directional,
and may stay high before personal income tax plays a bigger role.
Keywords: Key words: Income inequality, the Chinese economy, Kuznets hypothesis.
JEL classification: D31, D63, N35
* Juzhong Zhuang, Deputy Chief Economist, Asian Development Bank and Research Associate, Department of
Economics, School of Oriental and African Studies, [email protected]; and Shi Li, Professor, Beijing
Normal University, [email protected]. The views expressed in the paper are those of the authors, not
necessarily reflecting the views of their affiliated institutions.

SOAS Department of Economics Working Paper Series No 196 - 2016
2
1. Introduction
Rapidly rising income inequality in China since economic reform started in the late 1970s has
attracted considerable attention by policy makers and researchers in and outside the country
in recent years (Li, Wan, and Zhuang 2014). While the Chinese economy has managed to
grow at close to 10% annually for more than 3 decades, and the growth has helped lift
hundreds of millions of people out of poverty, the Chinese society has in the process become
less equal. The Gini coefficient of per capita household disposable income1 was below 30 in
the early 1980s (Ravallion and Chen 2007). In 2015, according to the estimate of China
National Bureau of Statistics (CNBS), it stood at 46.2 (CNBS 2016). This is a high level
compared with many countries in Asia (ADB 2012).
However, in more recent years, China‘s Gini coefficient has been on the decline. According
to the estimates released by CNBS in recent years, the Gini coefficient reached a peak at 49.1
in 2008, fell to 48.1 in 2010, 47.7 in 2011, 47.4 in 2012, 47.3 in 2013, 46.9 in 2014, and 46.2
in 2015 (Wan and Zhuang 2015, CNBS 2015, CNBS 2016). These declines have led some to
ask whether China‘s income inequality has peaked, and whether this vindicates the Kuznets-
hypothesis which says that a country‘s income inequality tends to increase at an early stage of
development, and peak and then decline when the income increase to a certain level.2
The purpose of this paper is to examine the underlying factors that could explain the recent
decline in China‘s Gini coefficient and ask whether the decline indicates that the income
inequality has peaked. To answer this question, in Section 2, the paper provides a brief review
of the evolution of income inequality in China during the period of 1978-2015. Section 3
constructs a simple conceptual framework where key drivers of income inequality can be
analyzed. Section 4 presents empirical evidence on the key drivers, and discusses their
relevance to explaining the dynamics of inequality in China in the last 3-4 decades including
the recent decline. Section 5 concludes.
2. China’s Income inequality: 1978−2015
This section pieces together a broad picture of the evolution of income inequality in the PRC
1 The Gini coefficient of per capita household income (or consumption) is a commonly-used measure of income
inequality, and it ranges from 0 indicating perfect equality to 100 (or 1) indicating perfect inequality. 2 Questions have also been raised over the quality of statistical data in China.

SOAS Department of Economics Working Paper Series No 196 - 2016
3
during 1978−2015 using estimates of the Gini coefficient from various sources, updating Wan
and Zhuang (2015). Largely due to the public unavailability of household survey data
covering the entire country, earlier attempts to assess the level of income inequality in China
focused on the measurement of regional or inter-household inequality in specific locations,
such as rural or urban areas, and in specific provinces for specific periods (see Tsui 1993,
Rozelle 1994, Hussain and Zhuang 2000, Kanbur and Zhang 1999). More recently, attempts
to measure income inequality have also used synthetic unit-level data generated from grouped
household income and consumption expenditure data covering most provinces (Lin et al.
2010).
Inequality can be measured using per capita income or consumption expenditure. Inequality
measured by the former is usually higher, in the case of the Gini coefficient, by 5 to 10 points
when measured using the range of 0−100 (ADB 2012). Unless otherwise noted, this paper
focuses on income-based inequality. Table 1 presents six sets of estimates of the Gini
coefficient of per capita household income in the PRC in the post-reform period.3
Among the six sets of estimates, two were obtained by adjusting for spatial cost of living
(COL) differences. If one compares the spatial COL-adjusted with the corresponding
unadjusted estimates, the latter are much larger (by 15%−30%). Since most researchers do
not consider spatial COL differences, we will ignore the two sets of adjusted estimates.
However, the adjusted and unadjusted estimates share the same trends.
Figure 1 plots estimates from the remaining four sources. These are comparable4 and all show
a rising trend of income inequality. In particular, the Ravallion and Chen (2007) estimates
show that income inequality declined at the onset of economic reform until the mid-1980s—
due largely to rising rural incomes following the rural economic reforms including the
introduction of household responsibility system—and since then it has been on the rise amid
some fluctuations.
3 In addition to the six sets, two more sources of estimates are also often cited and used in literature but not
reported. One is the World Income Inequality database maintained by UNU-WIDER, and the other is World
Development Indicators maintained by the World Bank. The World Income Inequality Database set was
collected from different publications and based on different datasets, and it is not clear whether the estimates
are comparable. The Gini coefficients from the World Development Indicators (WDI) database are
inconsistent because post-1989 estimates are consumption-based, while the earlier estimates are income-based. 4 Ravallion and Chen (2007) used data directly provided by the CNBS, while Lin et al. (2010) used CNBS data
in grouped form. The CHIP data are piggy-backed by a CNBS survey. It is clear that the CHIP data estimates
are consistently larger and Lin et al. consistently smaller than all the other estimates. The discrepancies can be
attributed to the approximation method Lin et al. used to obtain unit-record data from grouped data. The CHIP
data have a smaller coverage in sample size than the data used by others

SOAS Department of Economics Working Paper Series No 196 - 2016
4
Table 1: China’s Gini coefficients, 1978−2015
Year
Ravallion and Chen (2007)
Chinese
Household
Income
Project
(CHIP) a
Lin et al. (2010)
China
National
Bureau of
Statistics
(CNBS)
Without
adjustment
for spatial
COL
difference
With
adjustment
for spatial
COL
difference
Without
adjustmen
t for
spatial
COL
difference
With
adjustme
nt for
spatial
COL
difference
1978 … … … … … …
1979 … … … … … …
1980 … … … … … …
1981 31.0 28.0 … … … …
1982 28.5 25.9 … … … …
1983 28.3 26.0 … … … …
1984 29.1 26.9 … … … …
1985 29.0 26.5 … … … …
1986 32.4 29.2 … … … …
1987 32.4 28.9 … … … …
1988 33.0 29.5 39.5 … … …
1989 35.2 31.8 … … … …
1990 34.9 31.6 … 34.5 28.7 …
1991 37.1 33.1 … … … …
1992 39.0 34.2 … … … …
1993 42.0 36.7 … … … …
1994 43.3 37.6 … … … …
1995 41.5 36.5 46.9 39.7 32.9 …
1996 39.8 35.1 … … … …
1997 39.8 35.0 … … … …
1998 40.3 35.4 … … … …
1999 41.6 36.4 … … … …
2000 43.8 38.5 … 41.1 34.7 …
2001 44.7 39.5 … … … …
2002 … … 46.8 … … …
2003 … … … … … 47.9
2004 … … … … … 47.3
2005 … … … 45.7 38.8 48.5
2006 … … … … … 48.7
2007 … … 49.7 … … 48.4
2008 … … … … … 49.1
2009 … … … … … 49.0
2010 … … … … … 48.1
2011 … … … … … 47.7
2012 … … … … … 47.4
2013 47.3
2014 46.9
2015 46.2 … = data not available, COL = cost of living.
a A project of Beijing Normal University.
Sources: Wan and Zhuang (2015), CNBS (2015, 2016).

SOAS Department of Economics Working Paper Series No 196 - 2016
5
Figure 1: Gini coefficients, 1981−2015
CHIPS = Chinese Household Income Project, a project of Beijing Normal University; CNBS = China National
Bureau of Statistics.
Sources: Wan and Zhuang (2015), CNBS (2015, 2016).
Estimates by CNBS—for recent years—show a more stable trend. Inequality peaked in 2008,
with a Gini estimate of 49.1, and has since been on the decline, though marginally, each year,
reaching its lowest recent level at 46.2 in 2015. One can combine the CNBS estimates with
those of Ravallion and Chen to form a more complete time series on China‘s income
inequality. This shows that, over a period of 35 years, inequality as measured by the Gini
coefficient grew by more than 50% from 28.3 in 1983 to 49.1 in 2008, and then dipped to
46.2 in 2015. Whether the recent decline represents the beginning of the end of worsening
income distribution—as suggested by the Kuznets Hypothesis in China—is still a debated
issue.
3. Drivers of income inequality: A conceptual framework
This section presents a simple framework to look at drivers of income inequality. The
framework is based on the definition of total income of a household, Y, as the sum of its
income derived from labor and that derived from capital (or wealth):
𝑌 = 𝑊 𝐿 + 𝑅 𝐾 (1)
Capital income is the product of the different types of capital assets (K) owned by the
household and their respective rates of return (R). For a typical household, capital assets
0
10
20
30
40
50
60
198119831985198719891991199319951997199920012003200520072009201120132015
Ravallion and Chen (2005) CHIPS Lin et al. (2010) CNBS

SOAS Department of Economics Working Paper Series No 196 - 2016
6
consist mostly of housing, land, factories and machinery owned by households, and financial
assets.5 Labor income—which includes returns to human capital—is the product of the
different types of labor assets (L) and their respective wage rates (W). The return to human
capital is reflected in the skill premium, that is, the more educated and skilled labor earns
higher wages.
Income inequality estimates, such as the Gini coefficient, are often based on per capita
household income, that is:
𝑌
𝐻= 𝑊(
𝐿
𝐻) + 𝑅(
𝐾
𝐻) (2)
Therefore, inequality in per capita household income is the result of inequality in per capita
labor income (𝑊𝐿 /𝐻), inequality in per capita capital income (𝑅 𝐾/𝐻), and the relative
importance of labor and capital incomes in total household income.6 Changes in income
inequality can be thought of as resulting from a combination of changes in the distributions of
per capita labor assets and capital assets across households, changes in the relative returns to
labor and capital, and changes in the relative importance of labor and capital incomes in total
household income.
In any society, the distribution of capital assets reflects its ownership structure, while the
distribution of labor assets is determined to a large extent by the inequality in access to
education and health. Over time, many factors shape these distributions, including initial
distributions, household savings behavior and investment decisions, differences in individual
efforts and entrepreneurship, political economy factors (such as pressures for land
redistribution, taxation on labor and capital incomes, and public spending on human capital),
the quality of governance and institutions, and demographics.
Changes in the relative returns to labor and capital reflect demand and supply conditions in
the marketplace, how efficiently the market works—for instance, the presence or absence of
monopoly or discrimination against particular population groups (such as females or rural
residents), and political economy factors (such as labor market institutions and taxation on
5 In this paper we use the terms ―capital‖ and ―wealth‖ interchangeably. Capital includes all real and financial
assets owned by a household, but excludes human capital. A household‘s capital incomes include all the
incomes from owning various capital assets. See discussions in Piketty (2014, pp.36-38). 6 Lerman and Yitzhaki (1985) decompose the Gini coefficient into the contributions by income source. Each
source‘s contribution to overall inequality is the product of its own Gini coefficient, its share in total income,
and its correlation with the rank of total income.

SOAS Department of Economics Working Paper Series No 196 - 2016
7
labor and capital incomes).
Finally, changes in the relative importance of labor and capital incomes in total household
income are determined by the relative changes in returns to labor and capital and in the
capital-labor ratio in production. These are in turn determined by technological advances and
the bias of technical progress, the relative bargaining positions of labor and capital, political
economy factors such as labor market institutions (minimum wages, collective bargaining,
and employment protection), taxation, and the presence or absence of market distortions.
Within this framework, income inequality will increase if changes in relative returns to labor
and to capital, or in the distribution of labor assets and capital assets, or in the relative
importance of labor and capital incomes in total income favor the better-off households.
There are many ways in which this could happen:
First, wage rates could increase faster for the better educated and skilled workers than for the
less educated and skilled. There is a large literature showing that globalization and
technological progress may have increased the demand for skilled workers relative to that for
unskilled workers in many developing countries, leading to an increasing skill premium
(ADB 2012). In the case of China, the market-oriented reforms introduced since the late
1970s dismantled the fixed-wage system that existed under central planning, and have made
wages more reflective of workers‘ skills and educational attainments and of market demand
and supply conditions, and have also contributed to the increase in the skill premium, as
evidenced by rising wage inequality (Knight and Song, 2003; Deng and Li, 2009).
Second, the differentials in the returns to capital and in wage rates between Chinese richer
coastal and urban areas and the poorer interior and rural areas could increase as growth
accelerated, leading to increasing spatial inequality. This is because coastal regions are closer
to trade routes and world markets than interior regions; and because urban cities have better
infrastructure than rural areas, they are more likely to attract investment and new
technologies, especially during the initial phase of growth take-off (Lewis 1954). All these
could lead to greater increases in productivity, wages and returns to capital in the favored
areas. Land and housing prices have increased much faster in coastal areas and urban cities
than in inland provinces and rural areas in China in the last 40 years or so.
Third, capital income could increase faster than labor income. This would lead to a rising
share of capital income in total household income (which tends to be less equally distributed)

SOAS Department of Economics Working Paper Series No 196 - 2016
8
and a declining share of labor income (which tends to be more equally distributed). This
occurs when total income grows faster than labor income (or when per capita income grows
faster than the wage rate), leaving a larger share of value added accruing to capital. It has
been suggested that technological progress especially in information and communications
technology (ICT) and automation may have reduced the demand for labor relative to that for
capital, as shown by a declining employment elasticity of growth in recent decades in many
countries, thus favoring capital (ADB 2012). In the case of China, the large pool of rural
surplus labor has also put downward pressure on wage rates until recently (Knight et al,
2011).
Fourth, increasing inequality in the distribution of human capital (embedded in labor) or
capital (or wealth) can also lead to an increase in income inequality. Inequality in human
capital could increase if wealthier households invest more on or have better access to
education and health than poorer households. Inequality in wealth could increase if wealthier
households save more, if they receive higher returns to capital due to economies of scale or if
they have lower fertility rates than less wealthy households.
4. Empirical evidence
This section provide empirical evidence on the major drivers of rising income inequality in
China in recent decades, focusing on skill premium, share of capital income in national
income, spatial inequality, and wealth distribution. Although distribution of human capital is
also highly relevant in our framework, due to the lack of data, it is not included in the
empirical analysis below.
Skill premium
In many countries, inequality of human capital is often a major contributor to inequality of
income. In Asia, empirical studies find that returns to education increase with educational
attainment and that the relationship has been getting stronger over time in recent years. An
ADB study finds that from the mid-1990s to the mid-2000s, real wages grew much faster for
wage earners with tertiary or higher education than for those with lower educational
attainment in India and the Philippines, leading to wider wage differentials (Zhuang et al,
2014). In India, the Gini coefficient of wages increased from 40.5 in 1993 to 47.2 in 2004 and
about 50% of the increases was accounted for by education. Many studies provide direct
evidence of rising skill and education premiums in Asia (World Bank 2012).

SOAS Department of Economics Working Paper Series No 196 - 2016
9
Returns to education have also risen in the PRC in the post-reform period (Zhang et al. 2005,
Liu 2009). The World Bank (2012) estimates that the tertiary education premium was 60% in
2005 and increased across sectors in recent years. Household survey data show the growing
importance of educational status in explaining inter-household income inequality. Sicular et
al. (2008) find that education can explain more than 25% of the PRC‘s rural−urban income
gap. The ADB (2012) finds that, based on survey data, the share of income inequality
accounted for by differences in educational attainment of heads of households increased from
8.1% in 1995 to 26.5% in 2007 (Figure 2). The study also finds that the importance of
education in explaining household incomes has risen in many other Asian countries as well,
such as Bhutan, India, Pakistan, the Philippines, and Thailand. However, the increase was
most pronounced in the PRC.
Figure 2. Income inequality decomposition by educational attainment of household
head, selected countries
PRC = People‘s Republic of China.
Note: Estimates are based on per capita consumption expenditure in nominal terms except for the PRC, which is
based on income. The decomposition is based on GE(0), which is a special form of the generalized entropy
index.
Source: Asian Development Bank (2012).
More recent empirical evidence, however, suggests that the increase in skill premium may
have slowed down or the level of skill premium may have decreased in China. Assuming that
the wage levels above the national average correspond to jobs requiring high skills, and that
those below the national average correspond to jobs requiring low skills, recent data show
0
10
20
30
40
50
2003
2007
1995
2007
1993
2009
/10
2002
2008
1994
2009
1995
2005
Bhutan PRC India Pakistan Philippines Thailand
Shar
e of
bet
wee
n-gr
oup
ineq
ualit
y (%
)

SOAS Department of Economics Working Paper Series No 196 - 2016
10
that wages in high-skill sectors are now rising at a slower pace than wages in low-skill sectors
(Figure 3). During 2004-2009, with the exception of 2008, the average wage growth was
faster for high-skill sectors than low-skill sectors. Since 2009, however, the average wage
growth has been faster for low-skill sectors than for high-skill sectors. In 2011, for example,
the average wage growth for low-skill sectors was close to 20%, while that for high-skill
sectors was only about 14%.
Figure 3. Nominal wage growth of low-skill and high-skill sectors in China, 2004-2014
Low-skill sectors: Agriculture, forestry, animal husbandry, and fishery; Manufacturing; Construction;
Wholesale and retail trades; Hotels and catering services; Management of water conservancy, environment, and
public facilities; Services to households, repair, and other services.
High-skill sectors: Mining; Production and supply of electricity, heat, gas, and water; Transport, storage, and
post; Information transmission, software, and information technology; Financial intermediation; Real estate;
Leasing and business services; Scientific research and technical services; Education; Health and social service;
Culture, sports, and entertainment; Public management, social security, and social organization.
Source: China National Bureau of Statistics, China Statistic Yearbook, various years, http://www.stats.gov.cn/
(accessed 16 April 2016).
One possible reason for the declining skill premium in China in recent years is a rapid
increase in the investment in tertiary education. The annual university enrolment increased
from 0.93 million in 1995 to 6.62 million in 2010, and it has been reported that many
university graduates find it difficult to find suitable jobs in recent years, leading to high
unemployment among these graduates (Chan 2015, Knight et al. 2016). This may have put
downward pressures on wage rates for the better educated labor. Another possible reason is
rapid increases in the minimum wage rates (Li and Lin 2015). During 2010-2014, the average
monthly minimum wage rate in coastal provinces, applicable mostly to low-skill workers,
12.4 12.1
14.415.8
18.2
9.4
14.5
19.6
13.2 13.2
9.9
14.2 15.5 14.8 20.1 17.5 11.4 12.3 13.6 11.4 10.3 8.60
5
10
15
20
2004 2005 2006 2007 2008 2009 2010 2011 2012 2013 2014
Average wages(% change, year-on-year)
Low-skill sectors High-skill sectors

SOAS Department of Economics Working Paper Series No 196 - 2016
11
grew by 56.2%, and the average wage rate of the urban non-private sector, applicable mostly
to high-skill workers, grew only by 54.2% (CNBS, various years).
Shares of labor and capital incomes
A decline in the share of labor income (with the consequent increase in the share of capital
income) in national income can increase income inequality because, in general, labor income
is more equally distributed than capital income. During the last two decades, many countries,
both developed and developing, saw the income share of labor fall. In the United States (US)
this share declined from 65% in 1992 to 52.4% in 2009 in industry, and, for the entire
economy and during the same period, it fell from 68.7% to 64.2% (ADB 2012). In Germany,
the share increased from the mid-1980s until 1993, when it peaked at 79.5%, but has declined
since then.
Figure 4. Shares of labor and capital incomes in manufacturing value added (% of total)
Labor income share = remuneration of employees / (manufacturing gross value added - net production tax);
Capital income share = (operating surplus + depreciation of fixed asset) / (manufacturing gross value added - net
production tax).
Source: CEIC Data Company Ltd [from China input-output table, accessed 18 April 2016].
In China, Bai and Qian (2009) find that the share of labor income in the manufacturing sector
fell from 48.4% in the mid-1990s to 42.2% in the mid-2000s. An ADB study (2012) shows
that many other Asian economies also experienced a falling share of labor income, including
India, Indonesia, Japan, Republic of Korea, Singapore, and Taipei,China. However, more
recent data suggests that the share of labor income in China‘s manufacturing sector has
51.2
60.8 60.8
55.4
46.4 46.7
53.9 55.3
48.8
39.2 39.244.6
53.6 53.3
46.1 44.7
0
10
20
30
40
50
60
70
1995 1997 2000 2002 2005 2007 2010 2012
Labor Capital

SOAS Department of Economics Working Paper Series No 196 - 2016
12
started rising, from 46.4% in 2005 to 53.9% in 2010 and 55.3% in 2012 (Figure 4).
Many have argued that China is approaching the so-called ―Lewis turning point‖ where the
pool of rural surplus labor has shrunk to the extent that further rural migration to cities would
require greater wage increases, leading to labor market tightening in urban areas. This is
consistent with the fact that Chinese coastal provinces have been experiencing labor
shortages since the mid-2000s (ADB 2012). However, it has also been noted that the increase
in the labor income share was partly due to redefining labor income share by China National
Bureau of Statistics; some implicit subsidies and government spending on welfare programs
have now been reclassified as a part of labor income, which was not in the previous statistics
(Li et al 2014).
Spatial inequality
Increasing spatial inequality, covering both urban–rural income gaps and interprovincial
disparities, has been particularly important as a channel by which technological progress,
integration with the global economy, and market-oriented reform impact income distribution
in China. Just as the distribution of economic activity is structured geographically, so is the
distribution of income. Some locations have natural advantages, such as fertile soil for
agriculture or proximity to a coastline for trade or better infrastructure in cities. Economic
analysis has also highlighted the role of agglomeration benefits (Krugman 2008). According
to an ADB study (2012), in 2007, more than 50% of income inequality in China can be
explained by the spatial inequality, the highest among Asian countries with comparative data
(Figure 5).
The increasing urban-rural income gap is a particularly significant contributor to rising
inequality in China. Using synthetic unit-level data estimated from the grouped household
income and consumption expenditure data covering 85% of the population and updating
estimates of Lin et al. (2010), it is found that the share of between–urban–rural inequality in
total income inequality increased from about 20% in 1990 to 32% in 2008 after adjusting
household income by differences in the cost of living between urban and rural areas. During
the same period, the share of within-rural inequality declined from 66% to 32% and that of
within-urban inequality increased from 14% to 37%. Without adjusting household income by
cost of living differences, ADB (2012) finds that the share of the between-urban-rural
inequality increased from 34% in 1990 to 45% in 2008. The ADB study (2012) shows that

SOAS Department of Economics Working Paper Series No 196 - 2016
13
the PRC is not the only country in Asia that experienced rising urban−rural income gaps in
the last 2 decades.
Figure 5. Contribution of spatial inequality to overall inequality, selected Asian
countries
PRC = People‘s Republic of China.
Note: Spatial inequality covers both between-region and urban–rural inequality. The estimation is arrived at by
dividing all sample households into groups classified by both region and urban−rural. For example, if a country
has 20 provinces, the total groups will be 40 (20 urban and 20 rural). The between-group inequality is the
combined spatial inequality.
Source: Asian Development Bank (2012).
However, recent data suggest that urban-rural income gap in China has started decline in
recent years. The urban-rural ratio of the mean per capita household disposable income was
on the rise consistently from the mid-1990 to mid-2000s. But it has been on the decline more
recently, from 3.33 in 2007 to 2.90 in 2015 (Figure 6). Despite statistical issues related to
these figures that have often been raised (such as the definition of rural and urban households
and the treatment of rural migrants), the trend shows a consistent decrease in the ratio in
recent years.
A number of factors could explain this decline in urban-rural income gap. Large migration
from rural to urban areas reduces rural surplus labor and helps improve labor productivity of
farming. Rapid pace of urbanization also helps reduce rural-urban income gaps. Recent
government policy actions in supporting rural peasants (such as investment in rural
infrastructure, improvement in social security, and anti-poverty programs) have also
contributed to increasing rural income and declining urban-rural income gaps (Li et al. 2013).
13
21 2226
3235
38
54
0
10
20
30
40
50
60
Sri Lanka(2009)
Philippines(2009)
Pakistan(2008)
Indonesia(2009)
India(2008)
Viet Nam(2008)
Bhutan(2007)
PRC (2007)
Perc
ent

SOAS Department of Economics Working Paper Series No 196 - 2016
14
Figure 6: The Ratio of urban-rural per capita household disposable income, 1980-2015
Urban households refer to per capita disposable household income and rural households refer to per capita net
income.
Source: China National Bureau of Statistics , http://www.stats.gov.cn/english/ (accessed 18 April 2016).
Figure 7. Gini coefficient of provincial per capita incomes, 1990−2014
Note: Gini coefficients are weighted by group population.
Source: Authors‘ estimates using CEIC Data, Global Database (accessed 19 April 2016).
The other dimension of spatial inequality is regional inequality, which has also been a key
contributor to rising inequality in China. In 1990–2003, the Gini coefficient of per capita
provincial income increased more or less concurrently with the overall national Gini
coefficient. However, since 2003, regional inequality has been on the decline (Figure 7).
1980, 2.5
1990, 2.2
2007, 3.3
2015, 2.9
0.0
0.5
1.0
1.5
2.0
2.5
3.0
3.519
78
19
80
19
82
19
84
19
86
19
88
19
90
19
92
19
94
19
96
19
98
20
00
20
02
20
04
20
06
20
08
20
10
20
12
20
14
Urban/ruralratio
1990, 20.9
1996, 24.7
2003, 27.3
2014, 20.4
15
17
19
21
23
25
27
29
1990
1991
1992
1993
1994
1995
1996
1997
1998
1999
2000
2001
2002
2003
2004
2005
2006
2007
2008
2009
2010
2011
2012
2013
2014

SOAS Department of Economics Working Paper Series No 196 - 2016
15
Some studies attribute this to the Great Western Development Strategy (Fan, Kanbur, and
Zhang 2011). Decomposition analysis shows that the contribution of between-province
inequality to total inequality remained stable at about 10% in 1990 and in 2008 (ADB 2012).
Wealth distribution
Wealth distribution is usually more unequal than income distribution. Rising wealth
inequality has likely also been a major contributor to the rising income inequality in China,
although it has not been studied as extensively as income inequality because of the data
limitation. A recent study by Li and Wan (2015) find that wealth distribution has become
more and more unequal in China. For China as a while, the wealth Gini coefficient increased
from 34 in 1988 to 73 in 2010 (Figure 8). For urban China, it increased from about 50 in mid-
1990 to 63 in 2010. For rural China, it increased from 31 in 1988 to 71 in 2010. A major
contributing factor to the rising wealth distribution has been rising housing prices.
Figure 8: Gini coefficient of per capita net household wealth, 1988-2012
Source: Li and Wan (2015).
5. Conclusion: Has China’s income inequality peaked?
The previous section shows that rising skill premium, declining share of labor income and
rising share of capital income, widening rural-urban income gap and regional inequality, and
increasing wealth inequality have been among key drivers of rising income inequality in
34.040.0
55.0
68.6
73.9 73.0
52.056.0
50.0
56.0
45.0
58.063.2
31.0 33.0
70.6
0
20
40
60
80
1986 1988 1990 1992 1994 1996 1998 2000 2002 2004 2006 2008 2010 2012
National Urban Rural

SOAS Department of Economics Working Paper Series No 196 - 2016
16
China in recent decades. But many of these drivers appear to have reversed their directions
more recently. Empirical data show that, in recent years, skill-premium has declined, the
share of labor income has been on the rise and capital income on the decline, and urban-urban
income gaps and regional inequality have fallen, and these may have been underlying factors
contributing to the decline in China‘s overall income inequality as measured by the Gini
coefficient since 2008.
Has China‘s income inequality peaked, as suggested by the Kuznets hypothesis? For the
following reasons, we believe that it is premature to think that China‘s inequality has peaked.
First, much of the recent reverse of the drivers of China‘s income inequality is policy-
induced. For instance, falling skill-premium may have been due to the large government
investment in tertiary education in recent years, as well as government measures to increase
minimum wages for low-skill workers. Falling regional inequality is partly due to the
implementation of the Great Western Development Strategy since 2000. Narrowing urban-
rural gaps are also partly related to the government‘s policy actions to promote urbanization
and improve rural incomes and social protection in rural areas. While increasing labor income
share may have been associated with the approaching of the Lewis turning point, it has also
something to do with the rising minimum wages set by many provincial governments. The
fact that there are still more than 200 million people working in the agriculture sector means
that labor market situation could change, especially when China‘s growth slows down. For all
these reasons, policies for reducing inequality should continue if inequality is to be reduced
further.
Second, inequality in wealth distribution has continued to increase in China, and could be a
new major source of rising income inequality in China.
Third, although Kuznets hypothesized that income inequality will first increase, then peak,
and then decline as a country‘s income level increases, empirical testing of the Kuznets
hypothesis has so far yielded mixed results. Recent experiences of the developed countries—
many of which saw rising inequality in the last 2-3 decades have put another shadow over the
validity of the Kuznets hypothesis. More importantly, one of the underlying factors for the
inverted-U hypothesis is that as a country becomes more advanced, the rising middle class
will demand for greater income redistribution through taxation and public sending (Kuznets
1955). This suggests the importance of public policy in containing and reducing income
SOAS Department of Economics Working Paper Series No 196 - 2016
17
inequality.
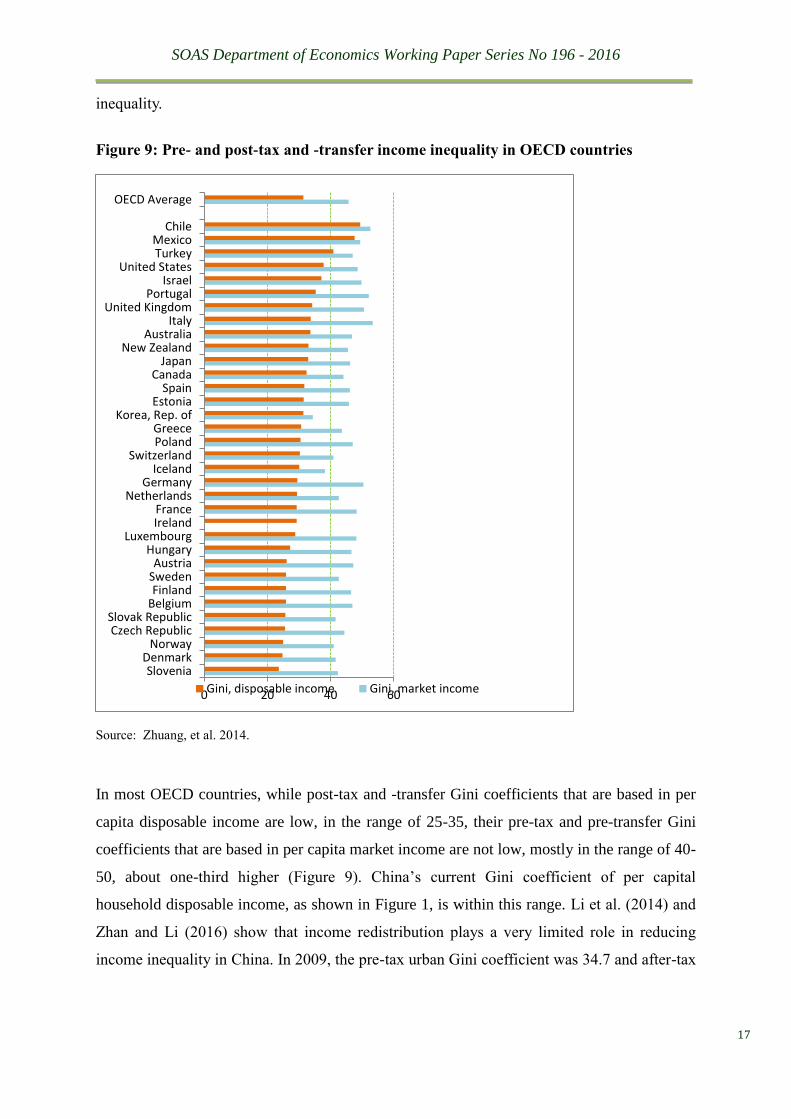
Figure 9: Pre- and post-tax and -transfer income inequality in OECD countries
Source: Zhuang, et al. 2014.
In most OECD countries, while post-tax and -transfer Gini coefficients that are based in per
capita disposable income are low, in the range of 25-35, their pre-tax and pre-transfer Gini
coefficients that are based in per capita market income are not low, mostly in the range of 40-
50, about one-third higher (Figure 9). China‘s current Gini coefficient of per capital
household disposable income, as shown in Figure 1, is within this range. Li et al. (2014) and
Zhan and Li (2016) show that income redistribution plays a very limited role in reducing
income inequality in China. In 2009, the pre-tax urban Gini coefficient was 34.7 and after-tax
0 20 40 60
SloveniaDenmark
NorwayCzech Republic
Slovak RepublicBelgiumFinland
SwedenAustria
HungaryLuxembourg
IrelandFrance
NetherlandsGermany
IcelandSwitzerland
PolandGreece
Korea, Rep. ofEstonia
SpainCanada
JapanNew Zealand
AustraliaItaly
United KingdomPortugal
IsraelUnited States
TurkeyMexico
Chile
OECD Average
Gini, disposable income Gini, market income

SOAS Department of Economics Working Paper Series No 196 - 2016
18
Gini coefficient was 33.5, only slightly lower; in 2013, the two were 38.5 and 37.3,
respectively (Table 2).
The limited role of personal income taxes in reducing income inequality in China is
consistent with the fact that, as recently as 2013, the country‘s total personal income tax
revenue only amounted to about 1.5% of GDP. This suggests that the future path of China‘s
income inequality may not be one-directional, and may stay high, before personal income
taxes play a greater role.
Table 2: Pre-tax and post-tax urban Gini coefficient, China
Year Pre-tax Gini After-tax Gini
1997 30.1 29.6
2002 32.5 31.8
2005 35.2 34.2
2008 36.3 35.1
2009 34.7 33.5
2013 38.5 37.3
Sources: Li et al. (2014), and Zhan and Li (2016).
In sum, the recent decline in income inequality in China as measured by the Gini coefficient
is encouraging. But part of the decline is policy-induced, and there is no guarantee that the
decline will continue in the absence of these policies. It is therefore important for China to
continue its efforts in reducing income inequality by creating more opportunities for a wider
section of population and making a greater use of fiscal policy to equalize access to
opportunities, including greater public spending on education, health care, and social
protection; and more effective and fairer personal income taxes. The government has recently
indicated that personal income tax reform will be a priory under its 13th
Five-Year Plan
during 2016-2020 (China Daily 2016).

SOAS Department of Economics Working Paper Series No 196 - 2016
19
References
ADB (2012). Asian Development Outlook 2012: Confronting Rising Inequality. Manila:
Asian Development Bank.
Bai, C., and Z. Qian (2009). ‗Factor income distribution: the story behind the statistics‘.
Tsinghua, People‘s Republic of China: Tsinghua University.
CEIC Data. Global Database. http://www.ceicdata.com/.
Chan, W. Kit (2015). ‗Higher Education and Graduate Employment in China: Challenges for
Sustainable Development‘. Higher Education Policy, 28, 35-53.
Chen B., L. Ming, and N. Zhong (2010). ‗Resident consumption under hukou restriction‘.
The Economic Research Journal, 1, 62–71.
China Daily (2016). ‗China clarifies new five-year plan at key forum‘, 22 March,
http://www.chinadaily.com.cn/china/2016-03/22/content_24002667.htm.
CNBS (various years). China Statistical Yearbook. China National Bureau of Statistics,
http://www.stats.gov.cn/ (accessed 16 April 2016).
CNBS (2015). ‗China‘s Economic Realized a Stable Growth in 2014 under New Normal‘.
Press Release, 10 January 2016,
http://www.stats.gov.cn/tjsj/zxfb/201502/t20150211_682459.html (accessed 16 April
2016).
CNBS (2016). ‗China‘s Economy Realized a Moderate but Stable and Sound Growth in
2015‘. Press Release, 19 January 2016,
http://www.stats.gov.cn/tjsj/zxfb/201601/t20160119_1306083.html (accessed 16 April
2016).
Deng, Quheng and Li, Shi (2009). ‗What Lies behind Rising Earnings Inequality in Urban
China? Regression-based Decompositions‘. Cesifo Economic Studies, 55(3-4):598-623.
Fan, S., R. Kanbur, and X. Zhang (2011). ‗China‘s regional disparities: experience and
policy‘. Review of Development Finance, 1 (1), 47–56.
Gustafsson, B., S. Li, and T. Sicular (2010). Inequality and Public Policy in China. New
York: Cambridge University Press, pp. 337–53.
Hussain, A., and J. Zhuang (2000). ‗Evolution of inter-provincial inequality in China, 1952–
1996‘. In T. Atkinson, H. Glennerster, and N. Stern (eds), Putting Economics to Work:
Volume in Honor of Michio Morishima, STICERD Occasional Paper No. 22, London:
Suntory and Toyota International Centres for Economics and Related Disciplines.
Kanbur, R., and X. Zhang (1999). ‘Which regional inequality: rural–urban or coast–inland?

SOAS Department of Economics Working Paper Series No 196 - 2016
20
An application to China‘. Journal of Comparative Economics, 27, 686–701.
Knight, John and Lina Song (2003). ‗Increasing urban wage inequality in China‘. Economics
of Transition, 11(4):597–619.
Knight, John, Quheng Deng and Shi Li (2011). ‗The puzzle of migrant labour shortage and
rural labour surplus in China‘. China Economic Review, 2011, 22(4):585-600.
Knight,John. Deng Quheng,Li Shi (2016). ‗China‘s Expansion of Higher Education: the
Labour Market Consequences of a Supply Shock‘. CSAE Working Paper Series.
Krugman, P. (2008). ‗The increasing returns revolution in trade and geography‘.
http://www.nobelprize.org/nobel_prizes/economics/laureates/2008/krugman_lecture.pdf.
Kuznets, S. (1955). ‗Economic growth and income inequality‘. American Economic Review,
45 (1), 1–28.
Lerman, R. I., Yitzhaki, S., (1985). ‗Income Inequality Effects by Income Source: A New
Approach and Applications to the United States‘. The Review of Economics and Statistics
67 (1), 151-156.
Lewis, W.A. (1954). ‗Economic development with unlimited supply of labour‘. The
Manchester School, 22 (2), 139–91.
Li, S., C. Luo, and T. Sicular (2011). ‗Overview: income inequality in China: the
intergenerational dimension‘. CIBC Centre for Human Capital and Productivity Working
Paper No. 201113, Ontario: University of Western Ontario.
Li, S., G. Wan, and J. Zhuang (2014). ‗Income inequality and redistributive policy in the
People‘s Republic of China‘. In R. Kanbur, C. Rhee, and J. Zhuang (eds), Inequality in
Asia and the Pacific, Manila: ADB and New York: Routledge.
Li, S., and H. Wan (2015). ‗Evolution of wealth inequality in China‘. China Economic
Journal, 8(3):264-287.
Li, Shi and Carl Lin (2015). ‗The Impacts of the Minimum Wage Policy in China‘. CIID
Working Paper Series. No. 35.
http://www.ciidbnu.org/news/201511/20151107150350706.html.
Li, Shi, Hiroshi Sato and Terry Sicular (2013). Rising Income Inequality in China.
Cambridge University Press:Cambridge.
Lin, T., J. Zhuang, D. Yarcia, and F. Lin (2010). ‗Decomposing income inequality: People‘s
Republic of China, 1990−2005‘. In J. Zhuang (ed), Poverty, Inequality, and Inclusive
Growth in Asia: Measurement, Policy Issues, and Country Studies, Manila: ADB and
London: Anthem Press.

SOAS Department of Economics Working Paper Series No 196 - 2016
21
Liu, L. (2009). ‗Skill premium and wage differences: the case of China‘. Conference paper
for the Second International Symposium on Knowledge Acquisition and Modeling.
Organisation for Economic Co-operation and Development (OECD), OECD.Stat Extract.
http://stats.oecd.org/index.aspx
Piketty, Thomas (2014). Capital in the Twenty-First Century, Cambridge, Massachusetts and
London, England: The Belknap Press of Harvard University Press.
Ravallion, M., and S. Chen (2007). ‗China‘s (uneven) progress against poverty‘. Journal of
Development Economics, 82, 1–42.
Rozelle, S. (1994). ‗Rural industrialization and increasing inequality: emerging patterns in
China‘s reforming economy‘. Journal of Comparative Economics, 19, 362–391.
Tsui, K. (1993). ‗Decomposition of China's regional inequality‘. Journal of Comparative
Economics, 17, 600–627.
UNU-WIDER. World Income Inequality database,
http://www.wider.unu.edu/research/Database/en_GB/database/.
Wan, G.H. and J. Zhuang (2015). ‗Making growth more inclusive‘. In J. Zhuang, P.
Vandenberg and Y. Huang (eds): Managing the Middle Income Transition – Challenges
Facing the People’s Republic of China, UK: Edward Elgar.
World Bank (2012). ‗Is higher education meeting its promises? Putting higher education to
work: skills and research for growth in East Asia‘. World Bank East Asia and Pacific
Regional Report, Washington, DC: World Bank.
World Bank. World Development Indicators, http://data.worldbank.org/.
Zhan, Peng and Shi Li (2016). ‗The Impact of Personal Income Tax on China's Income
Distribution‘. CIID Working Paper Series.
Zhang, Y., Y. Zhao, A. Park, X. Song (2005). ‗Economic Returns to Schooling in Urban
China, 1998 to 2001‘. Journal of Comparative Economics. 33(4), 730-752.
Zhuang, J., R. Kanbur, and C. Rhee (2014). ‗What drives Asia‘s rising inequality?‘ In R.
Kanbur, C. Rhee, and J. Zhuang (eds), Inequality in Asia and the Pacific, Manila: ADB
and New York: Routledge.