soa 1: geomaterialbehaviour and testinggeosystems.ce.gatech.edu/faculty/mayne/papers/soa1 icsmge...
TRANSCRIPT

10/21/2009
1
SOA‐1: Geomaterial Behaviourand Testing
Mayne Coop Springman HuangMayne, Coop, Springman, Huang, and Zornberg (2009)
SOA‐1: 17th ICSMGE 2009 ‐ Alexandria
SOA‐1: Geomaterial Behaviour & Testing
Paul W. Mayne• Georgia Tech, Atlanta, GA, USAMatthew Coop• Imperial College, London, UKSarah Springman• ETH Swiss Federal Institute Tech, ZurichAn‐Bin Huang
ISSMGEPres. PedroSêco e PintoAn Bin Huang
• National Chiao Tung University, TaiwanJorge Zornberg• University of Texas at Austin, USA
SOA‐1: 17th ICSMGE 2009 ‐ Alexandria
Sêco e Pintoand
MasterOrchestrator
Copyright - Mayne (2009) SOA-1 Geomaterial Behaviour & Testing 17th ICSMGE, Alexandria, Egypt

10/21/2009
2
SOA‐1: Geomaterial Behaviour & Testing
Jorge G. Zornberg• 20 years in geotechnical engineering• Associate Professor – The University of Texas at Austin, USA
• Expertise: geosynthetics, soil reinforcement, environmental geotechnics, unsaturated soils
• Vice‐President of the International Geosynthetics Society (IGS)
• Chair of the International Activities Council (IAC) of Geo‐Institute, ASCE
SOA‐1: 17th ICSMGE 2009 ‐ Alexandria
SOA‐1: Geomaterial Behaviour & Testing
An‐Bin Huang• 30 years in geotechnical engineering
• Professor – National Chiao Tung University, Taiwan
• Expertise: site characterization, in‐situ testing, physical modeling, field instrumentation, liquefaction
• Core Committee Member of TC16• Core Committee Member of TC16 ‐Ground property characterization by in‐situ tests
• Member: ISSMGE, TGS, SEAGS, ASCE, TRB
SOA‐1: 17th ICSMGE 2009 ‐ Alexandria
Copyright - Mayne (2009) SOA-1 Geomaterial Behaviour & Testing 17th ICSMGE, Alexandria, Egypt

10/21/2009
3
SOA‐1: Geomaterial Behaviour & Testing
Sarah M. Springman• Active in geotechnical engineering
i 1974since 1974• Professor – EidgenössischeTechnische Hochschule, Zürich, Switzerland
• Expertise: Soil Structure Interaction, G h d M d lliGeohazards, Modelling
• Chair of TC2 – Physical Modelling in Geotechnics
• FREng, FICE, CEng, MInstRE, SIA SOA‐1: 17th ICSMGE 2009 ‐ Alexandria
SOA‐1: Geomaterial Behaviour & TestingMatthew Coop• 28 years in geotechnical engineering• Professor Imperial College UK• Professor, Imperial College, UK• Expertise: experimental soil mechanics, mechanics of sands, structured soils, weak rocks and transitional soils
• 2003 Géotechnique lecture. B iti h G t h i l S i t P i 1999• British Geotechnical Society Prize 1999
• ICE Geotechnical Research Medal 1990• Telford Prize 2002 • George Stephenson Medal 2005.
SOA‐1: 17th ICSMGE 2009 ‐ Alexandria
Copyright - Mayne (2009) SOA-1 Geomaterial Behaviour & Testing 17th ICSMGE, Alexandria, Egypt

10/21/2009
4
SOA‐1: Geomaterial Behaviour & Testing
Paul W. Mayne• 33 years in geotechnical engineering• Professor ‐ Georgia Institute of Technology, Atlanta, USA
• Expertise: site characterization, soil property evaluation, in‐situ testing, foundation systems
• Chair of TC16 ‐ Ground property characterization by in‐situ tests
• Member: ISSMGE, ASCE, ADSC, ASTM, CGS, DFI, MAEC, TRB, USUCGER
SOA‐1: 17th ICSMGE 2009 ‐ Alexandria
SOA‐1: Geomaterial Behaviour & Testing
SOA‐1 is 100 pages
Total 76,776 words
749 references + 43 equations
5 tables + 228 figures, photos, and graphs
SOA Record - Singapore 2003225 pages + 110 p.
= 335 pages
Define 145 different parameters and symbols
SOA‐1: 17th ICSMGE 2009 ‐ Alexandria
Need 8+ hours for this presentation
Copyright - Mayne (2009) SOA-1 Geomaterial Behaviour & Testing 17th ICSMGE, Alexandria, Egypt

10/21/2009
5
SOA‐1: Geomaterial Behaviour & Testing
Six Sections:
• Introduction
• Soil Behaviour
• Physical Modelling
• In‐Situ Testing
Geosynthetic-reinforced soil in a centrifuge. (Zornberg 1998)
g
• Cyclic Response and Liquefaction
• Soil‐Geosynthetic InterfacesSOA‐1: 17th ICSMGE 2009 ‐ Alexandria
SOA‐1 TOPICS: Geomaterial Behaviour & TestingExperimentation sites
Methods of testing
Interpretative framework
Test modes
Sample disturbance
Local strain measurements
Small‐strain stiffness
Critical‐state soil mechanics
Laboratory testing methods
Yield surfaces
Soil behaviour
Particle behaviour
Influence of fabric
Intermediate grading
Transitional geomaterials
Rate effects
SOA‐1: 17th ICSMGE 2009 ‐ Alexandria
Shaft friction data for field pile tests(Coop, 2005 ‐ IS‐Lyon)
Copyright - Mayne (2009) SOA-1 Geomaterial Behaviour & Testing 17th ICSMGE, Alexandria, Egypt
10/21/2009
6
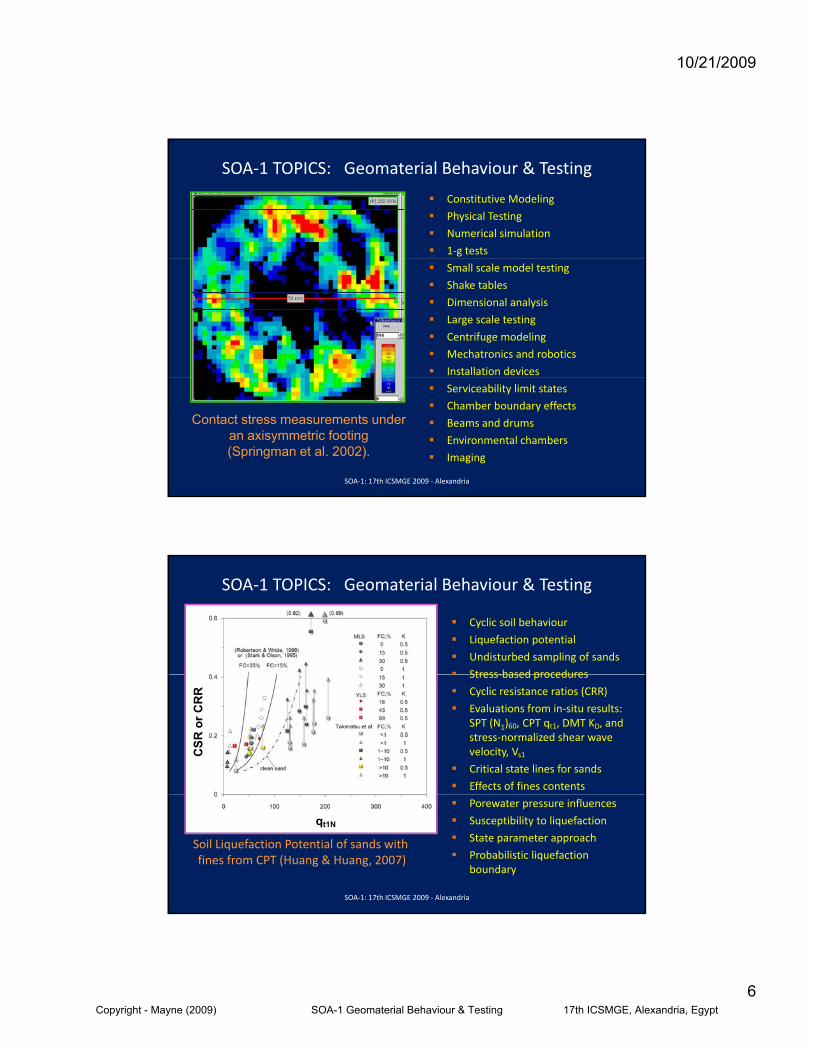
SOA‐1 TOPICS: Geomaterial Behaviour & Testing
Constitutive Modeling
Physical Testing
Numerical simulation
1‐g tests
Small scale model testing
Shake tables
Dimensional analysis
Large scale testing
Centrifuge modeling
Mechatronics and robotics
Installation devices
SOA‐1: 17th ICSMGE 2009 ‐ Alexandria
Serviceability limit states
Chamber boundary effects
Beams and drums
Environmental chambers
Imaging
Contact stress measurements under an axisymmetric footing(Springman et al. 2002).
SOA‐1 TOPICS: Geomaterial Behaviour & Testing
Cyclic soil behaviour
Liquefaction potential
Undisturbed sampling of sands
Stress‐based proceduresStress‐based procedures
Cyclic resistance ratios (CRR)
Evaluations from in‐situ results: SPT (N1)60, CPT qt1, DMT KD, and stress‐normalized shear wave velocity, Vs1Critical state lines for sands
Effects of fines contents
CSR
or C
RR
SOA‐1: 17th ICSMGE 2009 ‐ Alexandria
Porewater pressure influences
Susceptibility to liquefaction
State parameter approach
Probabilistic liquefaction boundary
Soil Liquefaction Potential of sands withfines from CPT (Huang & Huang, 2007)
qt1N
Copyright - Mayne (2009) SOA-1 Geomaterial Behaviour & Testing 17th ICSMGE, Alexandria, Egypt

10/21/2009
7
SOA‐1 TOPICS: Geomaterial Behaviour & TestingIn‐situ testing
Direct‐push site characterization
Interpretation of soil parameters
Soil behavioural type
Identification of cemented soils
Geostatic stress state
Intracorrelative trends
Preconsolidation stresses
Effective stress friction angle
Stiffness of geomaterials
Initial tangent shear modulus
Modulus reduction curves
New and advanced methods
Twitch testing
Full flow penetrometers
Continuous Vs profiling
SOA‐1: 17th ICSMGE 2009 ‐ Alexandria
Schnaid (2009)
SOA‐1 TOPICS: Geomaterial Behaviour & Testing
Geosynthetic materials
Behaviour of interfaces
Soil‐geosynthetic interaction
Geogrids and geotextiles350
400
450
500
a)
χw=0. 4%
g g
Geonets
Geomembranes
Geocomposites
Geopipes
Geocells
Fiber reinforcements
Clay liner interfaces
0
50
100
150
200
250
300
350
0 5 10 15 20 25
Devi
ator
stre
ss (
kP
Axial strain (%)
χw=0%
χw=0. 2%
SOA‐1: 17th ICSMGE 2009 ‐ Alexandria
y
Roughness
Shear displacement rate effects
Resistance mechanisms
Stress‐strain‐strength behaviour
Axial strain (%)
Stress‐strain behavior of fiber‐reinforced sand(Zornberg and Li, 2003)
Copyright - Mayne (2009) SOA-1 Geomaterial Behaviour & Testing 17th ICSMGE, Alexandria, Egypt

10/21/2009
8
1 km
1 mm
3 cm
1 μm
1 m
“...when you can measure what you are
speaking about and express it in
b k thi b t itnumbers, you know something about it;
but when you cannot express it in
numbers, your knowledge is of a meager
and unsatisfactory kind"
SOA‐1: 17th ICSMGE 2009 ‐ Alexandria
and unsatisfactory kind
Lord Kelvin (1883)
Copyright - Mayne (2009) SOA-1 Geomaterial Behaviour & Testing 17th ICSMGE, Alexandria, Egypt

10/21/2009
9
Evolution of Geotechnical Site CharacterizationModified after Lacasse (1985)
SOA‐1: 17th ICSMGE 2009 ‐ Alexandria
INDICESOriginGeologic Age, AGGrain Sizes, D50
STATEVoid Ratio, e0 Unit Weight, γTRelative Density, DR
Zw
Initial Conditions
MineralogyPlasticity, PIShape (fractals)Sphericity, SphRoundness, RnAngularity, AngPacking limits: emax and eminG i P ti t th
y RVertical Stress, σvoHydrostatic, uoSaturation, S (%)Geostatic K0 = σho’/σvo’Stiffness, G0 = GmaxState Parameter, ψCementationFabric void index I
Z
Soil Element A
Grain Properties: strength, stiffness, roughness
Geosynthetics: o resin typeo carbon black
Fabric, void index IvoIntact or FissuredGeosynthetics:
o thicknesso mass per unit areao melt index
Copyright - Mayne (2009) SOA-1 Geomaterial Behaviour & Testing 17th ICSMGE, Alexandria, Egypt

10/21/2009
10
CONDUCTIVITYHydraulic: kv, khThermal: keElectrical: Ω, ζChemical: Df
STIFFNESSStiffness: G0 = GmaxShear Modulus, G' and GuElastic Modulus, E' and EuBulk Modulus, K’
Geomaterial Parameters and Properties
Transmissivity, TmPermittivity, Pm
Constrained Modulus, D’Tensile Stiffness, KTPoisson’s Ratio, νEffects of Anisotropy (Gvh/Ghh)Nonlinearity (G/Gmax vs γs)
COMPRESSIBILITYRecompression index, CrYield Stress, σy' (and YSR)Preconsolidation, σp’ (and OCR)Coefficient of Consolidation, cvVirgin Compression index, Cc
STRENGTHDrained and Undrained, τmaxPeak (s c’ φ’)g p , c
Swelling index, CsPeak (su, c , φ )Post-peak, τ'Remolded/Softened/CS, su (rem)Residual (cr’, φr’)Cyclic Behavior (τcyc/σvo')Geosynthetics: tensile strength,
pullout resistance, interface shear strength.
RHEOLOGICALCoef. secondary comp, CαεStrain rate, δε/δtAge (T)Creep rate, αRTime to creep rupture, tcr
SievesHyd Cup
Oed
FallCone DSB
DSS
Consolidometers
UC TTx PSC PSEHC RCT
CIUC CKoUC CKoUE CIUE
BE
Tv
Grain size analysesHydrometerWater content by oven
Mechanical oedometerConsolidometerConstant rate of shear (CRS)
Triaxial apparatus (iso-consols, CIUC, CKoUC, CAUC, CIUE, CAUE, CKoUE stress path CIDC CKoDC
Ppwn
Vst
RSPermeameters
DSC
Iso Consol
CIUCCIDC
CKoUCCKoDC
CKoUECKoDE
CIUECIDE
Pan
yLiquid limit cupPlastic limit threadFall cone devicePocket penetrometerTorvaneUnconfined compressionMiniature vaneDigital image analysis
( )Falling-head permeameterConstant-head permeameterFlow permeameterDirect shear boxRing shearUnconsolidated undrained TxSimple shearDirectional shear cell
CKoUE, stress path, CIDC, CKoDC, CIDE, CKoDE, constant P’)Plane strain apparatus (PSC, PSE)True triaxial (cuboidal)Hollow cylinderTorsional ShearResonant Column Test deviceNon-resonant columnBender elements
Copyright - Mayne (2009) SOA-1 Geomaterial Behaviour & Testing 17th ICSMGE, Alexandria, Egypt

10/21/2009
11
Methods to Interpret Ground Behavior from Testing
Empirical MethodsCorrelationR i
In-Situ
Full-ScaleStructuralResponse
Interpretative Scheme Simulation Model
RegressionNeural Network
Analytical ModelsStatics/DynamicsElasticity/PlasticityCavity Expansion
Numerical MethodsFinite Differencesi i l
Testing
Empiricale.g., t‐z curves
Analyticale.g., Elastic Pileqt
fsub
Finite ElementsDiscrete Elements
Experimental TestsSmall Lab SpecimensCalibration ChamberCentrifugal ModelsFull‐Scale Load Tests
NumericalFLAC, PLAXIS, ABAQUS, CRISP
State‐of‐the‐Art State‐of‐the‐PracticeThis SOA presentation versus SOA Technical Paper
What can be implemented to improve issues of forecasting, risk economy reliability by geotech community ?
Soil Art: Sand Sculptures
risk, economy, reliability by geotech community ?
How can our professional image be upgraded ?
Directed at 18,000 members of ISSMGE who are not here
SOA‐1: 17th ICSMGE 2009 ‐ Alexandria
Soil Art: Sand Sculptures
Copyright - Mayne (2009) SOA-1 Geomaterial Behaviour & Testing 17th ICSMGE, Alexandria, Egypt

10/21/2009
12
SOA‐1: Selected Topics for Presentation
Bad News Undrained Shear Strength
Sample Disturbance
Good NewsReconstituted vs Undisturbed
Effective Friction Angle, φ'
Critical State Soil Mechanics
SOA‐1: 17th ICSMGE 2009 ‐ Alexandria
ffective Friction Angle, φ
Preconsolidation Stress, σp'
International Geotechnical Test Sites
Comedian defines "redneck" as "a person who gloriously lacks of
Parody on "You might just be a redneck"
Geotech profession not using Critical State Soil Mechanics
If you come home from the garbage dump with more than you went in with.......
Y i ht j t b d k
a person who gloriously lacks of sophistication"
SOA‐1: 17th ICSMGE 2009 ‐ Alexandria
....You might just be a redneck
Parody: Geotech Counterpart - - - - -You might just need critical-state soil mechanics
Copyright - Mayne (2009) SOA-1 Geomaterial Behaviour & Testing 17th ICSMGE, Alexandria, Egypt

10/21/2009
13
If you think it is okay to run 3 lab shear tests and fit a straight line to get your strength parametersτ
shearstress .....then you might just need
φ' = 11°
c' = 188 kPa
Critical State Soil Mechanics
SOA‐1: 17th ICSMGE 2009 ‐ Alexandria
effective stress, σ'
Strength Representationτ
shearstress
Infinite number of paired sets of c' and φ'
φ' = 30°
Yield Surface
φ' = 49°c' = 22
φ' = 33c' = 99
φ' = 13c' = 333
SOA‐1: 17th ICSMGE 2009 ‐ Alexandria
effective stress, σ'
Pc'
Copyright - Mayne (2009) SOA-1 Geomaterial Behaviour & Testing 17th ICSMGE, Alexandria, Egypt

10/21/2009
14
If you think phi = 0 and force a horizontal line to get your undrained strength values....τ
shearstress .....then you might just need
" φ = 0 "c = 69 kPa
y g jCritical State Soil Mechanics
SOA‐1: 17th ICSMGE 2009 ‐ Alexandria
effective stress, σ'
You say "undrained"
I say clay
www.StrangeCosmos.com
I say sand
You say "drained" Sand Art at the Beach
. . . . . . . . then you just might needCritical‐State Soil Mechanics
SOA‐1: 17th ICSMGE 2009 ‐ Alexandria
Copyright - Mayne (2009) SOA-1 Geomaterial Behaviour & Testing 17th ICSMGE, Alexandria, Egypt

10/21/2009
15
If you are using any of the following software
PLAXISFLACTNO Diana
WANFEGEO5
then you just might need CSSMTNO Diana
ABAQUSCRISPADINAGEOSLOPEFLEA
OASYSSIGMA/WSETTLEGFASOpenSees
need CSSM
Numerical Simulations
Finite Elements
Finite Differences
FLEASoilvision3dGeoFEASZSOILSeep3d
Rat
io, e
VCL
CC
Rat
io, e
VCLCSL
Simplified Critical State Soil Mechanics (CSSM)
C
CSSM = Link betweenConsolidation, Swelling,
and Shear
ess
τ
Void
tanφ'CSL
Effective stress σv'
Void
Critical State
CSL
Log σv'
swellingCs
σmax' σmax'
CONSOL
Effective stress σv'
She
ar s
tre
CSLCritical State Soil Mechanics for Dummies
φ′ = effective friction anglec′= 0www.webforum.com/tc16
SHEARING
Copyright - Mayne (2009) SOA-1 Geomaterial Behaviour & Testing 17th ICSMGE, Alexandria, Egypt
10/21/2009
16
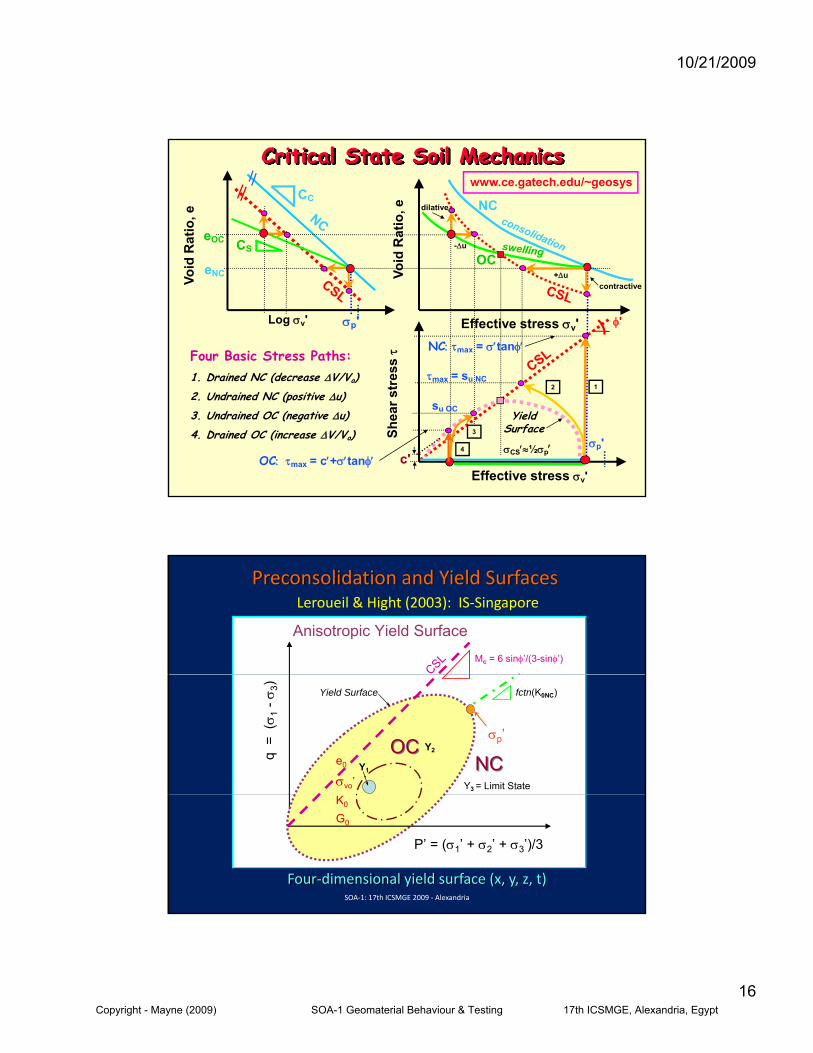
Critical State Soil Mechanicsd
Rat
io, e
d R
atio
, e NCCC
CSOC
eOC
dilative
-Δu
www.ce.gatech.edu/~geosys
Log σv' Effective stress σv'
ess
τ
Voi d
Void
σp'
OC
Four Basic Stress Paths:1 Drained NC (decrease ΔV/V )
φ'
eNCcontractive
+Δu
τmax = su NC
NC: τmax = σ′tanφ′
Effective stress σv'
Shea
r str
e
σp'
1. Drained NC (decrease ΔV/Vo)2. Undrained NC (positive Δu)3. Undrained OC (negative Δu)4. Drained OC (increase ΔV/Vo)
12
3
4
YieldSurface
σCS′≈½σp′
τmax su NC
su OC
OC: τmax = c′+σ′tanφ′ c'
Preconsolidation and Yield SurfacesLeroueil & Hight (2003): IS‐Singapore
Anisotropic Yield SurfaceMc = 6 sinφ’/(3-sinφ’)
CSL
q =
(σ 1
-σ3) fctn(K0NC)
Y3 = Limit State
Yield Surface
e0
σvo’
Y2
C
σp’
Y1
OCOCNCNC
SOA‐1: 17th ICSMGE 2009 ‐ Alexandria
Four‐dimensional yield surface (x, y, z, t)
P’ = (σ1’ + σ2’ + σ3’)/3
K0
G0
Copyright - Mayne (2009) SOA-1 Geomaterial Behaviour & Testing 17th ICSMGE, Alexandria, Egypt

10/21/2009
17
• Undrained Shear Strength of Clays = c = cu = su = τmax
• Classical interpretation of CPT and VST in clays:
T6
Which su ?μvane decreases with PINkCPT ≈15±5
kt
votuCPT N
qs σ−=
3vMobilizedud7T6s
π⋅μ=−
HC CIUC PSC CK0UC DSC DSS DS PSE CK0UE CIUE UU UC
Test Method/Mode su/σvo'NC
Self-boring pressuremeter (SBPMT) 0.42
Undrained Shear Strengths for Boston Blue Clay
S =
Plane strain compression (PSC) 0.34Triaxial compression (CK0UC) 0.33Unconsolidated Undrained (UU) 0.275Field vane shear test (FV) 0.21Direct simple shear (DSS) 0.20
Factorof 3
Plane strain extension (PSE) 0.19Triaxial extension (CK0UE) 0.16Unconfined compression (UC) 0.14
Ref: MIT Reports; Ladd (1991); Ladd, et al. (1980), Whittle (1993)
Copyright - Mayne (2009) SOA-1 Geomaterial Behaviour & Testing 17th ICSMGE, Alexandria, Egypt

10/21/2009
18
Undrained Strength Profiles - Troll, North Sea
0
5
0 10 20 30 40 50 60 70 80 90 100 110 120
Undrained Shear Strength, su (kPa)
CPTLab Triaxial CompressionLab Direct Simple ShearLab Triaxial Extension
Upper TrollClay5
10
15
20
pth
(met
ers)
Lab Triaxial ExtensionField Vane (Borehole)Field Vane (Halibut)Fall ConePocket PenetrometerTorvaneRemoulded Lab StrengthPush-in PressuremeterLab Vanelower boundMean TrendUpper Bound
y
Factor25
30
35
40
Dep
Lower TrollClay
Factorof 3.5
00 10 20 30 40 50 60 70 80
Undrained Shear Strength, su (kPa)
FV (peak)
National Geotechnical Test Site – Bothkennar, UK
5
10
15pth
(met
ers)
CKoUCDSSCKoUEFV remoulded suSBPMT
20
25
De
Bothkennar Clay, Scotland (Hight, et al. 1992)
Factorof 6
Copyright - Mayne (2009) SOA-1 Geomaterial Behaviour & Testing 17th ICSMGE, Alexandria, Egypt

10/21/2009
19
0
2
0 10 20 30 40 50 60 70 80
Undrained Shear Strength, su (kPa)
CPTu Profiles of su in Bothkennar Clay, UK
2
4
6
8
10
12th (m
eter
s)
CKoUC
DSS
CKoUE
TC - CPTu
DSS - CPTu
TE - CPTu12
14
16
18
20
Dep
t
Family of Undrained Shear Strengths
Undrained Shear Strength of Clays1. Critical-state soil mechanics for intact clays (Cambridge and Oxford Universities):
/ ‘ ½ i φ'OCRΛ W th (1984)
where Λ ≈ 1 - Cs/Cc
2. Experimental lab work by MIT:
su/σvo‘DSS = ½ sinφ'OCRΛ
su/σvo‘DSS = 0.23 OCR0.8
Wroth (1984)
Ladd (1991)
3. Vane Shear Tests calibrated with failure case studies of embankments, footings, & excavations:
su Mobilized ≈ 0.22 σp' Mesri (1975)
Copyright - Mayne (2009) SOA-1 Geomaterial Behaviour & Testing 17th ICSMGE, Alexandria, Egypt

10/21/2009
20
Sampling Disturbance
Hvorslev(1949)
Sampler A Sampler B
Issue of Sample Disturbance
I say "Undisturbed Sampling"
You say "Shelby Tube"
SOA-1: 17th ICSMGE 2009
Copyright - Mayne (2009) SOA-1 Geomaterial Behaviour & Testing 17th ICSMGE, Alexandria, Egypt

10/21/2009
21
Sample Disturbance Effects(after Tanaka, 2000)
Sampler O.D.(mm)
I.D.(mm)
Length (mm)
Wall t (mm) Piston
JPN 78 75 1000 1.5 YesJ 8 5 000 5 es
Laval 216 208 660 4.0 No
Shelby 75.3 72 610 1.65 No
NGI-54 80 54 768 13 Yes
ELE100 104.4 101 500 1.7 Yes
Sherbrooke N/A 350 250 N/A No
NGI 95 105 6 95 1000 5 3 Y
SOA-1 (2009)
NGI-95 105.6 95 1000 5.3 Yes
Split-Barrel 51.1 34.9 600 8.1 No
Gel Sampler (Huang 2007) NGI Block SamplerMazier Tube Gus SamplerDames & Moore Osterberg Sampler
Sample Disturbance Effects on su(after Tanaka, 2000)
UC Tests on Ariake Clay (Tanaka 2000)40
kPa)
Shelby (2.8 inch = 72 mm)
10
20
30
Stre
ss, s
= 1
/2( σ
1- σ3)
(k
British ELE (4.0 inch = 100 mm)
su = 18 kPa
su = 15.5 kPa
SOA‐1: 17th ICSMGE 2009 ‐ Alexandria
0
10
0 2 4 6 8 10 12 14
Axial Strain, εa (%)
Shea
r S
Copyright - Mayne (2009) SOA-1 Geomaterial Behaviour & Testing 17th ICSMGE, Alexandria, Egypt

10/21/2009
22
Sample Disturbance Effects on su(after Tanaka, 2000)
UC Tests on Ariake Clay (Tanaka 2000)40
kPa)
Sherbrooke (14 in = 350 mm)
Canadian Laval (8 in = 204 mm)
su = 38 kPa
su = 33 kPa
10
20
30
Stre
ss, s
= 1
/2( σ
1- σ3)
(k Japanese JPN (3 inch = 75 mm)
Norwegian NGI (2.1 in = 54 mm)
Shelby (2.8 inch = 72 mm)
British ELE (4.0 inch = 100 mm)
usu = 32 kPa
su = 28 kPa
su = 18 kPa
su = 15.5 kPa
SOA‐1: 17th ICSMGE 2009 ‐ Alexandria
0
10
0 2 4 6 8 10 12 14
Axial Strain, εa (%)
Shea
r S
Bad News
Sampling Disturbance EffectsLunne et al. (2006, CGJ): Lierstranda Clay 6.1 m
4040
Good News
20
30
40
Block75 mm tube54 mm tube(q/p')f
20
30
40
ess,
q =
( σ1-
σ 3)/2
(kP
a) Depth z = 6.1 metersσvo' = 54 kPa φ’ = 34.4o
0
10
0 10 20 30 40 50 60
p' = (σ1' + σ3')/2 (kPa)
0
10
0 5 10 15
Axial Strain, εa (%)
Shea
r Str
e Block
75 mm tube
54 mm tube
Copyright - Mayne (2009) SOA-1 Geomaterial Behaviour & Testing 17th ICSMGE, Alexandria, Egypt

10/21/2009
23
Quantification of Lab Sample Disturbance
RATE SPECIMEN QUALITY: Ratio of Δe/e0 to attain σvo'
Lunne, et al. (2006, Canadian Geot. Journal)
OCR
Excellent to Very Good
Good to Fair Poor Very Poor
1 to 2 < 0.04 0.04 to 0.07
0.07 to 0.14
> 0.14
2 to 4 < 0.03 0.03 to 0.05
0.05 to 0.10
> 0.10
Friction Angle of Sands CIDC Triaxial Tests
5
6
1)'/'(1)'/'('sin
31
31
+−
=σσσσφ
41.5º
φP' = peak friction angle
2
3
4
Stre
ss R
atio
, σ1'/
σ 3'
DR = 82.6 %DR = 74.5 %DR = 59.3 %
41.0º
38.8º
36.7º35.2º
33.7º φcv'
Data on SaturatedQuartz Sand
Georgia Tech
1
2
0 5 10 15 20 25 30 35
Axial Strain, εa (%)
DR = 38.5 %DR = 22.3 %
(Koerner, 1970)
Copyright - Mayne (2009) SOA-1 Geomaterial Behaviour & Testing 17th ICSMGE, Alexandria, Egypt

10/21/2009
24
UndisturbedFrozen
YoungArtificial
Triaxial Testing
Interpreted Friction Angle: φ′or ψ′, c ′, E′, ν ′, G0, Ψs, λ, κ, Γ, K0, OCR
Preparation MethodsAirPluviation
MoistTamped
Water
CLASS A METHOD METHOD B•freshwater•salt water
SPT SCPTu
SpecimensArtificialSpecimens
In-Situ e0In-place DRFabricOCAnisotropyStructureAge
EstimatedNC e0DRγdwn
Sedimentation
Slurry
Vibration
CompactionCoolantSystem
N60
Vs
fsub
qt
Estimated ?Relative
Density, DR
1-dGroundFreezing
LiquidNitrogen(-20º)Coring
Disturbed SoilAugeringRotary DrillTube SampleDrive Sample
Silty Sand (Høeg, Dyvik, & Sandbækken, 2000)
500
600
σ 3)
Undrained Behaviour: Undisturbed vs. Reconstituted Sands
Undisturbed
200
300
400
500
r Str
ess,
τ =
0.5
(σ1 -
σ
Undisturbed
Pl i t d
e0 (consolidated) = 0.71 σvc' = 500 kPa; σhc' = 250 kPa
Reconstituted
SOA-1: 17 ICSMGE - Egypt 2009
0
100
0 5 10 15 20 25
Axial Strain, εa (%)
Shea
r Pluviated
Slurried
Copyright - Mayne (2009) SOA-1 Geomaterial Behaviour & Testing 17th ICSMGE, Alexandria, Egypt

10/21/2009
25
Silty Sand (Høeg, Dyvik, & Sandbækken, 2000)
Undrained Behaviour: Undisturbed vs. Reconstituted Sands
200
kPa) CAUC Triaxial Tests
-100
0
100
ter P
ress
ure,
Δu
(
Undisturbed
Pluviated
Bad News
SOA-1: 17 ICSMGE - Egypt 2009
-200
-100
0 5 10 15 20 25
Axial Strain, εa (%)
Pore
wa Slurried
Silty Sand (Høeg, Dyvik, & Sandækken, 2000)
Undrained Behaviour: Undisturbed vs. Reconstituted Sands
1000
Undisturbed φ' = 36 5oGood News
400
600
800
r Str
ess,
τ =
0.5
( σ1 -
σ3)
Pluviated
Slurried
(q/p')f
φ 36.5c' = 0 kPa
SOA-1: 17 ICSMGE - Egypt 2009
0
200
0 200 400 600 800 1000 1200
Average Stress, s' = 0.5(σ1' + σ3')
Shea
r
Copyright - Mayne (2009) SOA-1 Geomaterial Behaviour & Testing 17th ICSMGE, Alexandria, Egypt

10/21/2009
26
Undisturbed vs Reconstituted SandDrained Triaxial Compression Tests (Mimura 2003)
400a
Edo River Sand (Mimura 2003)
D 50 = 0.29 mm UC = 2 2
100
200
300
ator
Str
ess
= ( σ
1 - σ
3) k
Pa
Reconstituted (air pluviation)
(Mimura, 2003)CIDC Triaxial TestsDepth = 3.7 to 4.0 mσ c ' = 49 kPa
UC = 2.2e 0 = 1.04 G s = 2.68e max = 1.227 e min = 0.812D R = 45%
SOA‐1: 17th ICSMGE 2009 ‐ Alexandria
0
100
0 2 4 6 8 10 12 14 16
Axial Strain, εa (%)
Dev
ia Reconstituted (air pluviation)
Undisturbed (1-d freezing)
Undisturbed vs Reconstituted SandDrained Triaxial Compression Tests (Mimura 2003)
150
Pa) Edo River Sand
50
100
tres
s, s
= 0
.5( σ
1 - σ
3) (k
P
Undisturbed
Pluviated
(q/p')f
φ' = 41 4o
sinφ' = 0.661
Good News
SOA‐1: 17th ICSMGE 2009 ‐ Alexandria
00 50 100 150 200
Ave Stress, p' = 0.5(σ1' + σ3') (kPa)
Shea
r St φ' = 41.4
c' = 0 kPa
Copyright - Mayne (2009) SOA-1 Geomaterial Behaviour & Testing 17th ICSMGE, Alexandria, Egypt

10/21/2009
27
Friction Angle of Undisturbed Sands
45
50
φ' (d
eg.)
⎟⎟
⎠
⎞
⎜⎜
⎝
⎛
σσ
σ⋅+=φ
)/'()/q(
log116.17(deg)'atmvo
atmt
Sands with mica smectite illite
35
40
axia
l Fric
tion
Ang
le,
Yodo River Natori RiverTone River Edo RiverMildred Lake MasseyKidd J-Pit
Sands with mica, smectite, illite, and other minerals
Duncan
Hibernia
SOA-1 (2009) ICSMGE
300 50 100 150 200 250 300
Normalized Tip Resistance, qt1 = (qt/σatm)/(σvo'/σatm)0.5
Tria LL-Dam Highmont
Holmen W. KowloonGioia Tauro K&M'90
DDam
Geomaterial φ' from CPTU by NTNU Method
100 Bq
Bq = 0 Notes for NTNU Method:
1. Define Cone Resistance
Robertson & Campanella (1983) for Sands
Senneset, Sandven, & Janbu (1989) TRR 1235
10
ance
Num
ber,
Nm
q
0.1 0.2 0.4 0.6 0.8 1.0
Number: Nm = (qt-σvo)/(σvo'+a')
2. Attraction: a' = c'cotφ' where φ' = effective friction angle andc' = effective cohesion intercept.
3. For case where a' = c' = 0: NM = Q = (qt-σvo)/σvo'
4. Define Porewater Pressure
Qt
120 25 30 35 40 45
φ' (degrees)
Res
ista 4. Define Porewater Pressure
Parameter: Bq = Δu2/(qt-σvo)
5. Approximate Expression Given for Ranges: 0.1<Bq < 1.0and 20º < φ' < 45º
Approx: φ' ≈ 29.5º Bq0.121[0.256 + 0.336·Bq + logQ ]
6. Plastification angle, βp = 0
Copyright - Mayne (2009) SOA-1 Geomaterial Behaviour & Testing 17th ICSMGE, Alexandria, Egypt

10/21/2009
28
Profiling Pc' in Clays by Cone Penetrometer10000
Pa)
Fissured
Calcareous
22 Additional Clays by Demers & Leroueil (2002)
Pisa clay by Jamiolkowski and Pepe (2001)
100
1000
Yiel
d St
ress
, σ p
' (k
P Calcareous
Intact
and Pepe (2001)
SOA‐1: 17th ICSMGE 2009 ‐ Alexandria
10100 1000 10000
Net Cone Resistance, qt - σvo (kPa)
Y
Intact Clays: σp' = 0.33 (qt - σvo) qt
Generalized Pc' Profiling by CPT
10000
' (k
Pa)
Intact clays: m = 1.00 Organic clays: m = 0.90Silts: m = 0 85
for clays, silts, sands, and mixtures
100
1000
nt Y
ield
Str
ess, σ
p' Silts: m 0.85 Silty Sands: m = 0.80Clean Sands: m = 0.72
SOA‐1: 17th ICSMGE 2009 ‐ Alexandria
10
10 100 1000 10000 100000
Net Cone Resistance, qt - σvo (kPa)
App
aren
General Trend:σp' = 0.33(qt-σvo)m
Copyright - Mayne (2009) SOA-1 Geomaterial Behaviour & Testing 17th ICSMGE, Alexandria, Egypt

10/21/2009
29
Generalized Pc' Profiling by CPTpp m1
atmm
votp )100/()q(33.0' −σ⋅σ−⋅=σ
Sands Sandy Silty Clays Organic Mix Mix
1 1
0 6
0.7
0.8
0.9
1.0
1.1
P c' E
xpon
ent,
mp
Hibernia SandPentre SiltEuripides SandHolmen SandUpper Troll ClayLower Troll ClayBurswood ClayPiedmont SMBothkennar Clay1650m +=
SOA‐1: 17th ICSMGE 2009 ‐ Alexandria
0.5
0.6
1 1.5 2 2.5 3 3.5 4
CPT Material Index, Ic
Piedmont MLTrend5.210800
65.0mCIp
+⋅+=
−
22qtc }Flog3.15.1{]}1)B1(Qlog[3{I ⋅+++−⋅−=
DR = relative densityγT = unit weightLI = liquefaction index
cu = undrained strengthγT = unit weightIR = rigidity indexφ' f i ti l
Is One Number Enough???
LI liquefaction indexφ' = friction anglec' = cohesion intercepteo = void ratioqa = bearing capacityσp' = preconsolidationVs = shear wave
φ' = friction angleOCR = overconsolidationK0 = lateral stress stateeo = void ratioVs = shear waveE' = Young's modulusC i i d
N
Vs shear waveE' = Young's modulusΨ = dilatancy angleqb = pile end bearingfs = pile skin friction
SAND
Cc = compression indexqb = pile end bearingfs = pile skin frictionk = permeabilityqa = bearing stress CLAY
qc
Copyright - Mayne (2009) SOA-1 Geomaterial Behaviour & Testing 17th ICSMGE, Alexandria, Egypt

10/21/2009
30
Geotechnical Site Characterization
Every Soil Parameter from SPT N-value ?
What is Our Image to the Public ?
from SPT N-value ?
European Foundations - Most Recent 2009 Issue
What the Public Sees and OurImage to Structural Engineers & Architects
View of Geotech Site Investigation View of Construction Operations
Copyright - Mayne (2009) SOA-1 Geomaterial Behaviour & Testing 17th ICSMGE, Alexandria, Egypt

10/21/2009
31
Geotechnical Site Characterization
Need a Variety of Different Methods and Technologies to Ascertain Soil Parameters
Holmen Island in Drammen River (Lunne, et al. 2003)
NGI testing: 1956 to 2009= 53 years
Copyright - Mayne (2009) SOA-1 Geomaterial Behaviour & Testing 17th ICSMGE, Alexandria, Egypt

10/21/2009
32
Geotechnical Experimentation SitesTodate: 65 International Test Sites
SOA‐1: 17th ICSMGE 2009 ‐ Alexandria
(2000) (2002) (2006)
Texas A&M Sand SiteUS National Geotechnical Test Site(Briaud & Gibbens, 1999; Briaud, 2007, ASCE JGGE)
0 10 20
Tip Resistance, qt (MPa)
0 500 1000 1500
Limit Pressure, PL (kPa)
0 10 20 30 40 50 60 70
SPT‐N value, N60 (bpf)
0 10 20 30 40 50
DMT Pressures (bars)
0 100 200 300 400
Velocity, Vs (m/s)
UpperPleistocene Clean Sands (SP)
silty Sands (SP‐SM)
0
1
2
3
4
5
6
pth (m
eters)
CHTDMT
CPT
SOA‐1: 17th ICSMGE 2009 ‐ Alexandria
Silty to Clayey Sands (SC ‐ SM)
Hard Eocene Clay Shale
7
8
9
10
11
12
Dep
p0
p1 Crosshole 2‐1
SPT
PMT
Copyright - Mayne (2009) SOA-1 Geomaterial Behaviour & Testing 17th ICSMGE, Alexandria, Egypt

10/21/2009
33
International Geotechnical Test Sites
Each site required decades of study
Years worth of laboratory testsMany types of field testingConsiderable amount of funds neededBackfigured soil engineering parameters
from full scale load tests
SOA‐1: 17th ICSMGE 2009 ‐ Alexandria
from full-scale load testsNot have enough time !Conclusion: Need multiple measurements
UDtube
Cased
CONVENTIONAL DRILLING & SAMPLING
DIRECT-PUSHTECHNOLOGY
Drop Hammer
SCPTù
Oscilloscope
Lab
CasedBoreholes
SPT: N60
CHT:Vs, Vp
FIRMSAND
SCPTùqt fs u2t50Vs
SDMTSPT: N60
VST: su, St
SOFTCLAY
SDMTp0p1P2tflexVs
PMT: E’Packer: kvh old new
Copyright - Mayne (2009) SOA-1 Geomaterial Behaviour & Testing 17th ICSMGE, Alexandria, Egypt

10/21/2009
34
SCPTU in Burswood Clay, Perth(data from Schneider, 2007, Univ. Western Australia)
00.0 0.5 1.0 1.5 2.0
Cone Resistance, qt (MPa)0 10 20 30
Sleeve Friction, fs (kPa)
0 200 400 600Porewater, ub (kPa)
0 100 200 300 400
Shear Wave, VS (m/s)
2
4
6
8
10
Dep
th (met
ers)
u2
uo
Fctn (qt, fs)
Meas DHT
Vs
fs
u2
12
14
16
18
20
D
qt
SCPTU at Golden Ears BridgeConeTec, Vancouver, BC
0
10
0 5 10 15 20 25
Tip qt (MPa)0.0 0.1 0.2 0.3
Sleeve fs (MPa)0 1 2 3 4
Porewater u2 (MPa)0 100 200 300 400 500
Shear Wave Vs (m/s)
10
20
30
40
50
Dep
th (m
)
60
70
80
90
100
Copyright - Mayne (2009) SOA-1 Geomaterial Behaviour & Testing 17th ICSMGE, Alexandria, Egypt
10/21/2009
35
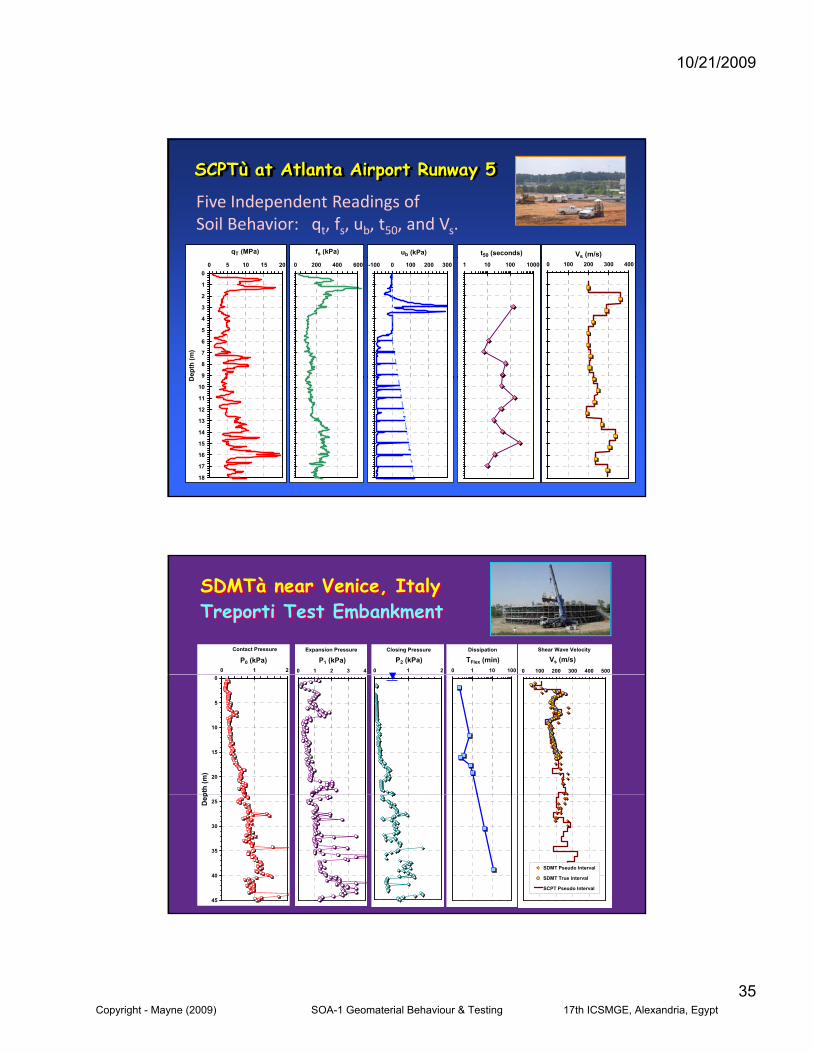
SCPTù at Atlanta Airport Runway 5
qT (MPa) fs (kPa) ub (kPa) Vs (m/s)t50 (seconds)
Five Independent Readings of Soil Behavior: qt, fs, ub, t50, and Vs.
0
1
2
3
4
5
6
7
8
9
0 5 10 15 20
Dep
th (m
)
0 200 400 600 -100 0 100 200 300 0 100 200 300 4001 10 100 1000
10
11
12
13
14
15
16
17
18
D
SDMTà near Venice, ItalyTreporti Test Embankment
Shear Wave Velocity
0 100 200 300 400 500
Vs (m/s)Contact Pressure
0 1 2
P0 (kPa)Expansion Pressure
0 1 2 3 4
P1 (kPa)Closing Pressure
0 1 2
P2 (kPa)Dissipation
0 1 10 100
TFlex (min)
0
5
10
15
20
pth
(m)
SDMT Pseudo Interval
SDMT True interval
SCPT Pseudo Interval
25
30
35
40
45
Dep
Copyright - Mayne (2009) SOA-1 Geomaterial Behaviour & Testing 17th ICSMGE, Alexandria, Egypt
10/21/2009
36
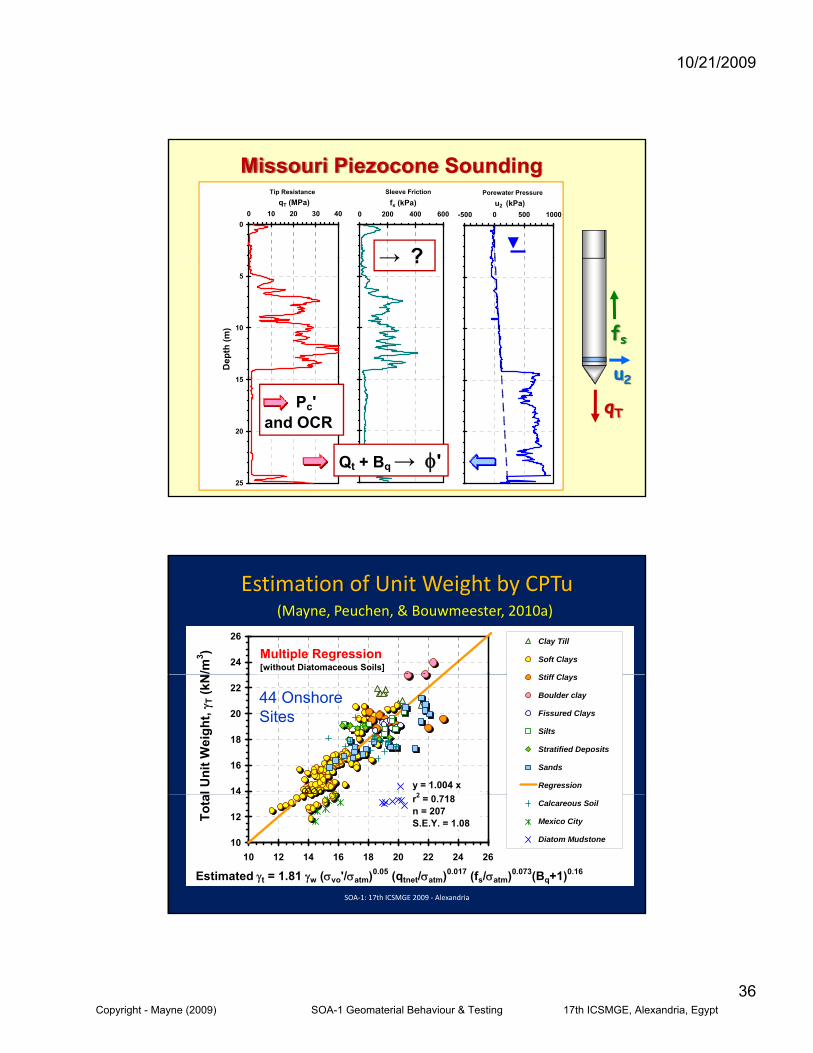
Missouri Piezocone SoundingTip Resistance
00 10 20 30 40
qT (MPa)Sleeve Friction
0 200 400 600fs (kPa)
Porewater Pressure
-500 0 500 1000u2 (kPa)
→ ?5
10
15
Dep
th (m
) fs
u2
→ ?
15
20
25
qT
u2
→ Pc'and OCR
Qt + Bq → φ'
Estimation of Unit Weight by CPTu
24
26
/m3 )
Clay Till
Soft Clays
Stiff Cl
Multiple Regression[without Diatomaceous Soils]
(Mayne, Peuchen, & Bouwmeester, 2010a)
14
16
18
20
22
l Uni
t Wei
ght,
γ T (k
N Stiff Clays
Boulder clay
Fissured Clays
Silts
Stratified Deposits
Sands
Regressiony = 1.004 x2
44 OnshoreSites
SOA‐1: 17th ICSMGE 2009 ‐ Alexandria
10
12
10 12 14 16 18 20 22 24 26
Tota Calcareous Soil
Mexico City
Diatom Mudstone
Estimated γt = 1.81 γw (σvo'/σatm)0.05 (qtnet/σatm)0.017 (fs/σatm)0.073(Bq+1)0.16
r2 = 0.718n = 207S.E.Y. = 1.08
Copyright - Mayne (2009) SOA-1 Geomaterial Behaviour & Testing 17th ICSMGE, Alexandria, Egypt
10/21/2009
37
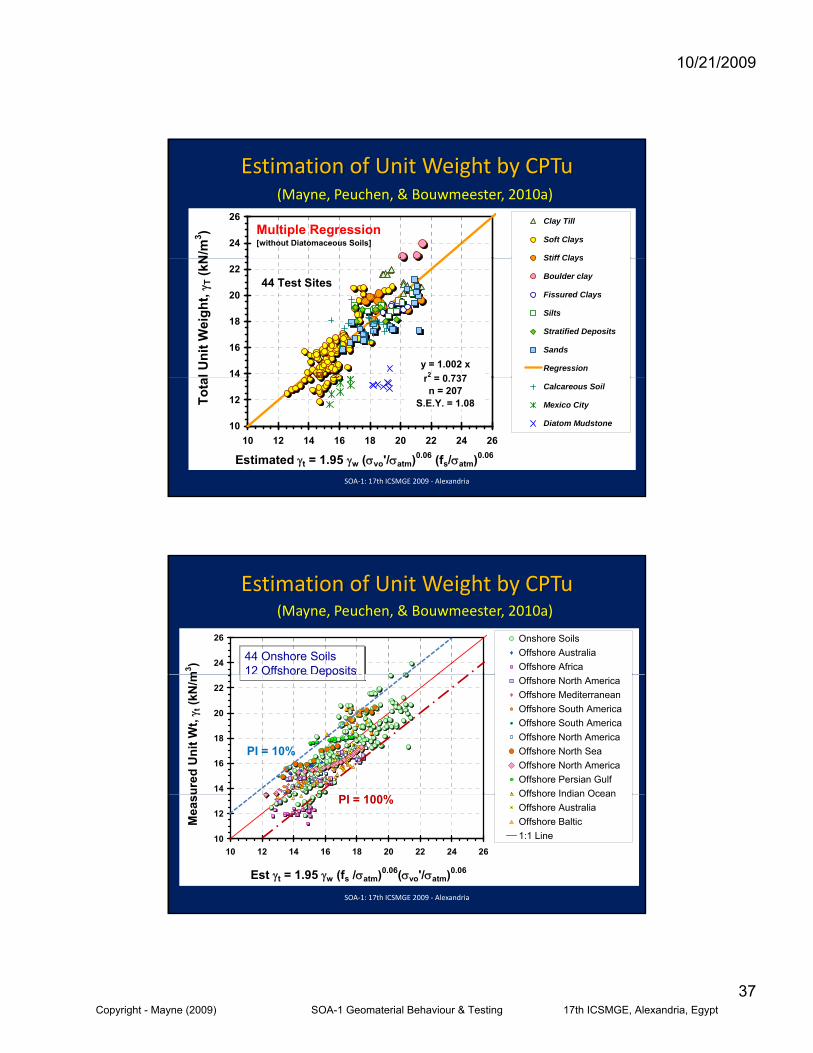
Estimation of Unit Weight by CPTu(Mayne, Peuchen, & Bouwmeester, 2010a)
24
26N
/m3 )
Clay Till
Soft Clays
Stiff Clays
Multiple Regression[without Diatomaceous Soils]
14
16
18
20
22
l Uni
t Wei
ght,
γ T (k
N Stiff Clays
Boulder clay
Fissured Clays
Silts
Stratified Deposits
Sands
Regressiony = 1.002 xr2 = 0 737
44 Test Sites
SOA‐1: 17th ICSMGE 2009 ‐ Alexandria
10
12
10 12 14 16 18 20 22 24 26
Tota Calcareous Soil
Mexico City
Diatom Mudstone
Estimated γt = 1.95 γw (σvo'/σatm)0.06 (fs/σatm)0.06
r = 0.737n = 207
S.E.Y. = 1.08
Estimation of Unit Weight by CPTu(Mayne, Peuchen, & Bouwmeester, 2010a)
24
26
m3 )
Onshore SoilsOffshore AustraliaOffshore Africa
44 Onshore Soils12 Offshore Desposits
44 Onshore Soils12 Offshore Deposits
14
16
18
20
22
ured
Uni
t Wt,
γ t (k
N/m Offshore North America
Offshore MediterraneanOffshore South AmericaOffshore South AmericaOffshore North AmericaOffshore North SeaOffshore North AmericaOffshore Persian GulfOffshore Indian Ocean
O s o e espos ts
PI = 10%
O s o e epos ts
SOA‐1: 17th ICSMGE 2009 ‐ Alexandria
10
12
10 12 14 16 18 20 22 24 26
Est γt = 1.95 γw (fs /σatm)0.06(σvo'/σatm)0.06
Mea
su Offshore Indian OceanOffshore AustraliaOffshore Baltic1:1 Line
PI = 100%
Copyright - Mayne (2009) SOA-1 Geomaterial Behaviour & Testing 17th ICSMGE, Alexandria, Egypt

10/21/2009
38
Seismic Piezocone Tests (SCPTu)
Fast fs
VsγtGmaxE’
Economical
Continuous
Immediate results
Multiple readings
qt
u2 ν’φ’OCRPc'k
suK0
}
t50
Multiple readings
Digital data logged to computer
Post‐process information in real‐time
kvh
SCPTU in Burswood Clay, Perth(Chung, 2005; Schneider, 2007, Univ. Western Australia)
010 12 14 16 18 20 22 24
Unit Weight γT (kN/m3)
0 10 20 30 40 50DSS su (kPa)
0 100 200 300
Preconsolidation, σp' (kPa) 20 25 30 35 40 45 50
Effective φ' (degree)
0
2
4
6
8
10
12
Dep
th (m
eter
s)
fctn(fs, svo')
fctn(Vs, z)
Meas Lab
LaboratoryCAU SS
Tests
Lab CRSC
0.33 qtnet
svo'
CPTu
CAUC
CPTU
12
14
16
18
20
Copyright - Mayne (2009) SOA-1 Geomaterial Behaviour & Testing 17th ICSMGE, Alexandria, Egypt

10/21/2009
39
SCPTU in Burswood Clay, Perth(Chung, 2005 UWA; Langdon, 2007 UMass‐Amherst)
30
35
CAU SS: 12.7 m
10
15
20
25
30
Shear Stress, τ
xy (kPa
) CAU SS: 14.9 m
CAU SS: 10.5 m
CAU SS: 9.4 m
CAU SS: 4.8 m
Mod Hyp: 12.7 m
Mod Hyp: 14.9 m
Mod Hyp: 10 5 m
τ = G · γsG/Gmax = 1 ‐ (τ/τmax)
0.25
0
5
10
0 5 10 15 20 25Shear Strain, γ (%)
S Mod Hyp: 10.5 m
Mod Hyp: 9.4 m
Mod Hyp: 4.8 m
τmax = su = ½sinφ'OCRΛσvo'OCR = 0.33(qt‐σvo)/σvo'
Gmax = ρt Vs2
SPT
TxPT LPT
VST
PMT
CPMT
DMT
SPLT
K0SB
SWS
HF
BST
TSC
FTS
CPTCPTu
RCPTu
SCPTu
SDMT
T-barBall
PlatePenetrometer
SASWMASWCSW
SuspensionLogging
SPTT
SCPMTùPLTPPT
AutoSeis ShakerHPT
CHT
DHTSL
Standard Penetration TestTexas Penetration TestVane Shear TestPressuremeter TestCone PressuremeterDilatometer TestScrew Plate TestK0 Stepped BladeSwedish Weight SoundingHydraulic FractureBorehole Shear Test
Total Stress CellFreestand Torsional ShearCone Penetration TestPiezocone PenetrationResistivity PiezoconeSeismic ConeSeismic Flat DilatometerT-Bar PenetrometerBall PenetrometerPlate PenetrometerPlate Load Test
Suspension LoggerCrosshole Geophysical TestDownhole TestSpectral Analysis of Surface WavesModal Analysis (Rayleigh Waves)Continuous Surface WavesStandard Penetration Test with TorqueLarge Penetration TestPiezoProbe TestSeismic Piezocone PressuremeterHelix Probe Test
Copyright - Mayne (2009) SOA-1 Geomaterial Behaviour & Testing 17th ICSMGE, Alexandria, Egypt

10/21/2009
40
Offshore Continuous Rotating Vane
01
0 5 10 15 20
Undrained Shear Strength, su (kPa)
12345678B
elow
Mud
line
(m)
Helical Vane
T-Bar
House, Randolph, and Watson (ISOPE 2004)
910111213
Dep
th
New Developments: Twitch TestingChung, Randolph & Schneider (2006, JGGE)
3.5
4.0
q/ q
ref
T-barBall
1.5
2.0
2.5
3.0
aliz
ed R
esis
tanc
e, q Ball
PlateConeWatson & Suemasa
0.0
0.5
1.0
0.1 1 10 100 1000
Normalized Velocity: V = vd/cv
Nor
ma
UndrainedPartially-drained
Drained
Copyright - Mayne (2009) SOA-1 Geomaterial Behaviour & Testing 17th ICSMGE, Alexandria, Egypt

10/21/2009
41
Frequent-interval andContinuous Vs profiling Charleston, South Carolina
0
GT AutoSeis
5
10
15
Dep
th (m
)
0 0.1 0.2 0.3 0.4 0.5
20
25
30
Time (sec)
Seismic Resistivity DynamicPenetrometer Test (SRDPT)
for hard ground, saprolites, and cemented geomaterials
Hydraulic Rig
Dynamic Driver Module
SquareRods
Lateral Stress, σL
Shear WaveVelocity, VS
Dynamic Driver Module (Impact, Sonic)
Enlargement
Square Wedge Penetrometer
Tip Stress, qd
Resistivity, Ω
SRDPT designwill provide
4 continuousreadings with
depth
Copyright - Mayne (2009) SOA-1 Geomaterial Behaviour & Testing 17th ICSMGE, Alexandria, Egypt

10/21/2009
42
Fully Integrated Ground Behavior
Drilling & Sampling
Geophysics
In-SituTesting
eo, γT, σvo’, DR, σp’, OCR, Go, D, Ko, ν, φ’, Ψ, Λ, Γ,
c’, k, cv, K’, M’, G’, E’, Cc, Cr, Cs, Cα, su, Eu
Soil Parameters Evaluation
LaboratoryTesting
NumericalSimulationAnalytical
Modeling
r, s, α, u, u
Summary: SOA‐1 ‐ Geomaterial Behaviour
Geomaterial characterization is challenging
Need multiple measurements - One number is insufficient for evaluation of soil parameters
Let us teach critical-state soil mechanics in our colleges and use it in practice.
Adopt seismic piezocone as the minimum level f ff t f ti it i ti ti
SOA‐1: 17th ICSMGE 2009 ‐ Alexandria
of effort for routine site investigation
Continue to develop international geotechnical experimentation sites for calibration & reference
Copyright - Mayne (2009) SOA-1 Geomaterial Behaviour & Testing 17th ICSMGE, Alexandria, Egypt

10/21/2009
43
2nd International Symposium onCone Penetration Testing
Huntington Beach, California
Host: Peter K. Robertson
CPT 2010: www.cpt10.org
4th International Conference on
Site Characterization ‐ 2012
Recife, Brazil (ISC‐4)
• Professor Roberto Quental Coutinho
• Federal University of Pernambuco
• Brazilian Soc. Soil Mechanics & Geotechnical Engrg.
www.geoforum.com/tc16
ISC3
Copyright - Mayne (2009) SOA-1 Geomaterial Behaviour & Testing 17th ICSMGE, Alexandria, Egypt