sniffer university 4-1 analyzing network issues. sniffer university 4-2 troubleshooting flowchart...
TRANSCRIPT

Sn
iffe
r U
niv
ersi
ty
4
-1
Analyzing Network Issues
Sn
iffe
r U
niv
ersi
ty
4
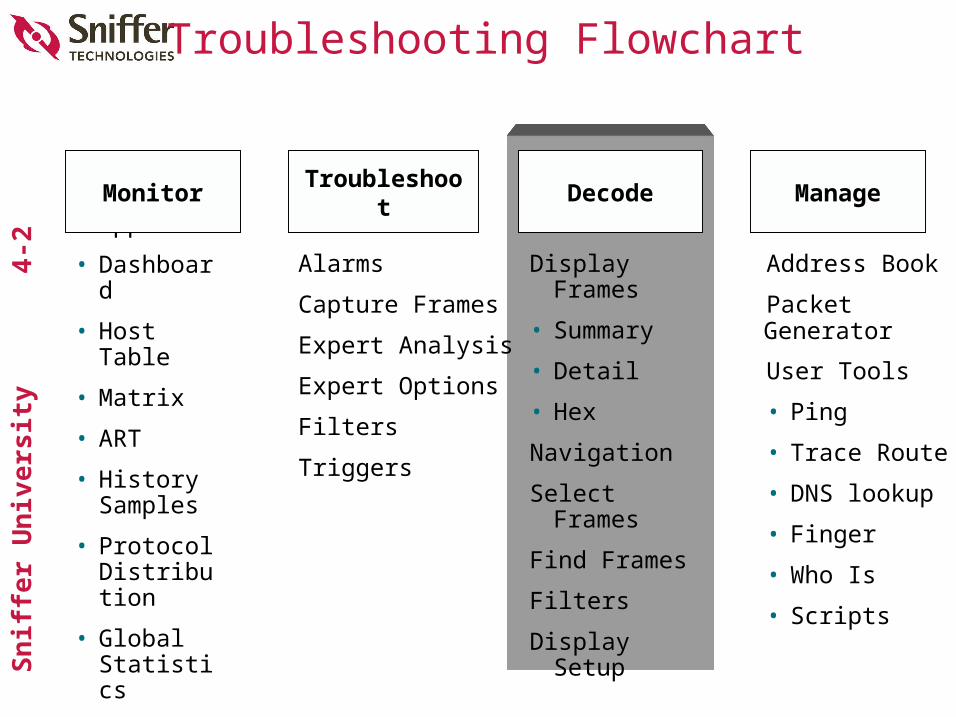
-2Troubleshooting Flowchart
Monitor Apps
• Dashboard
• Host Table
• Matrix
• ART
• History Samples
• Protocol Distribution
• Global Statistics
Alarms
Capture Frames
Expert Analysis
Expert Options
Filters
Triggers
Display Frames
• Summary
• Detail
• Hex
Navigation
Select Frames
Find Frames
Filters
Display Setup
Address Book
Packet
User Tools
• Ping
• Trace Route
• DNS lookup
• Finger
• Who Is
• Scripts
Monitor Decode ManageTroubleshoo
t
Generator
Sn
iffe
r U
niv
ersi
ty
4
-3Section Objectives
After completing this section, you will be able to:
•Use the Summary, Detail, and Hex views of the Decode window to examine frames for potential errors or activity of interest
•Find and select frames in the trace•Set display and capture filters•Work with Filtered (x) window•Use the Address Book•Use Sniffer Portable windows and
functions to do practical measurements
Sn
iffe
r U
niv
ersi
ty
4
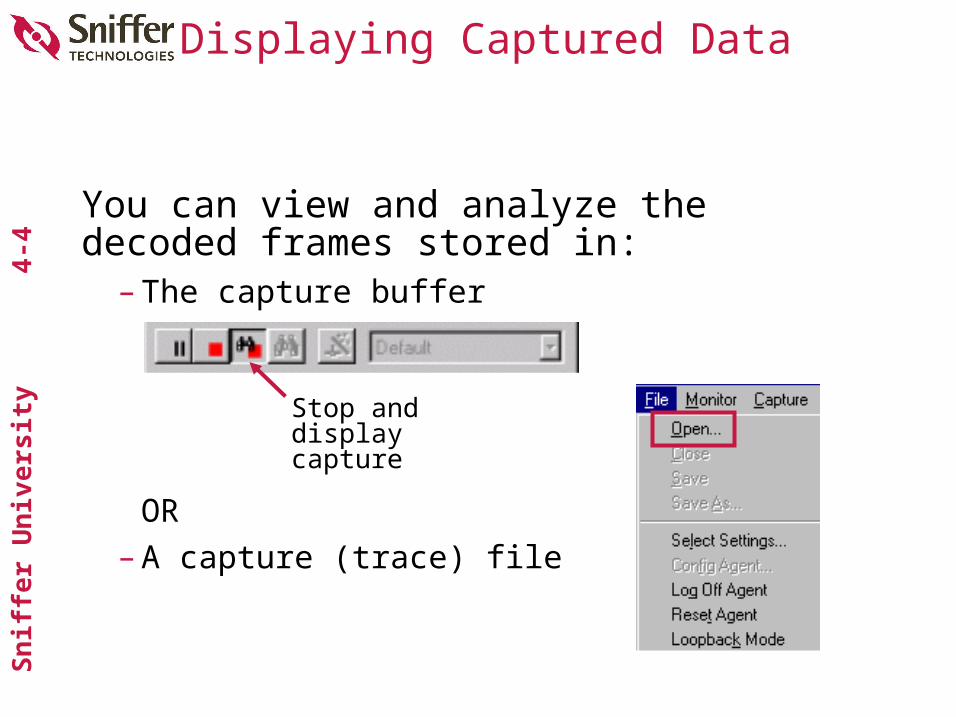
-4Displaying Captured Data
You can view and analyze the decoded frames stored in:
– The capture buffer
OR– A capture (trace) file
Stop and display capture
Sn
iffe
r U
niv
ersi
ty
4
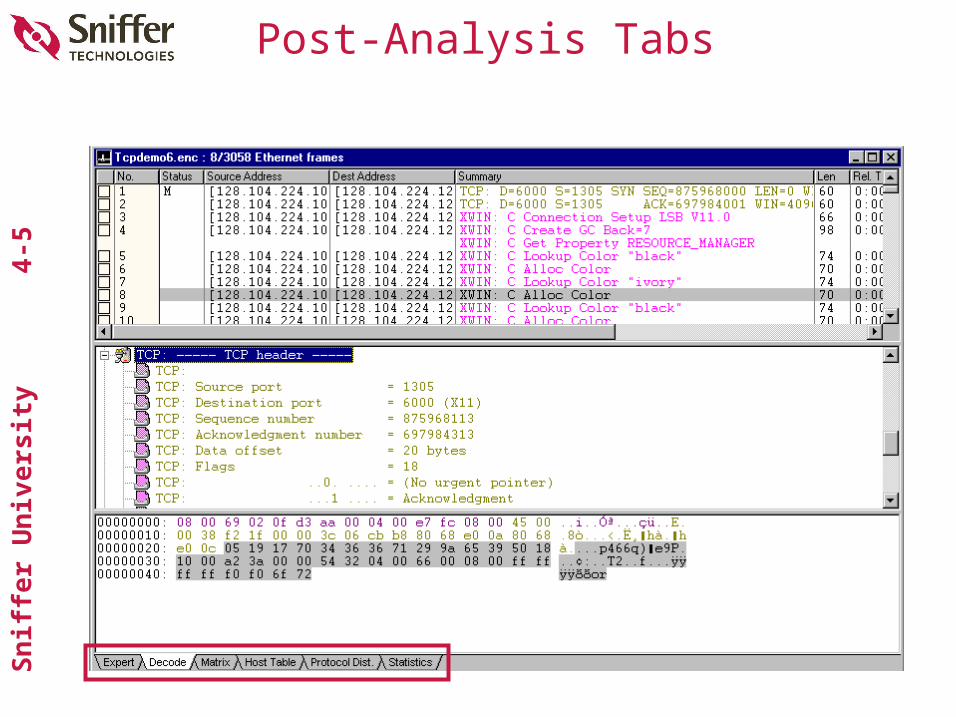
-5Post-Analysis Tabs
Sn
iffe
r U
niv
ersi
ty
4
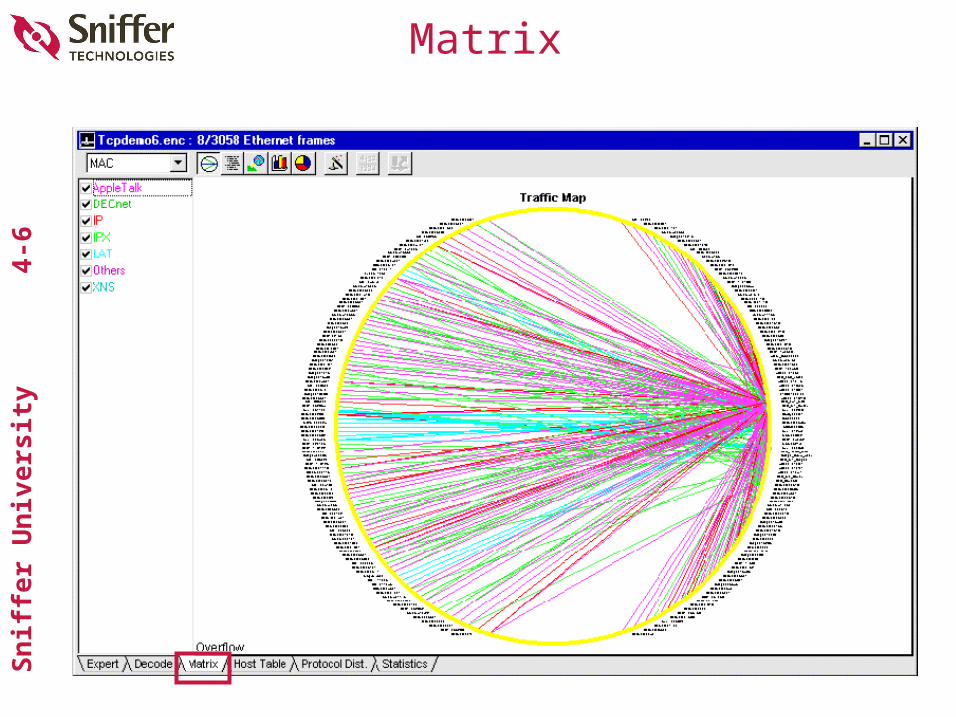
-6Matrix
Sn
iffe
r U
niv
ersi
ty
4
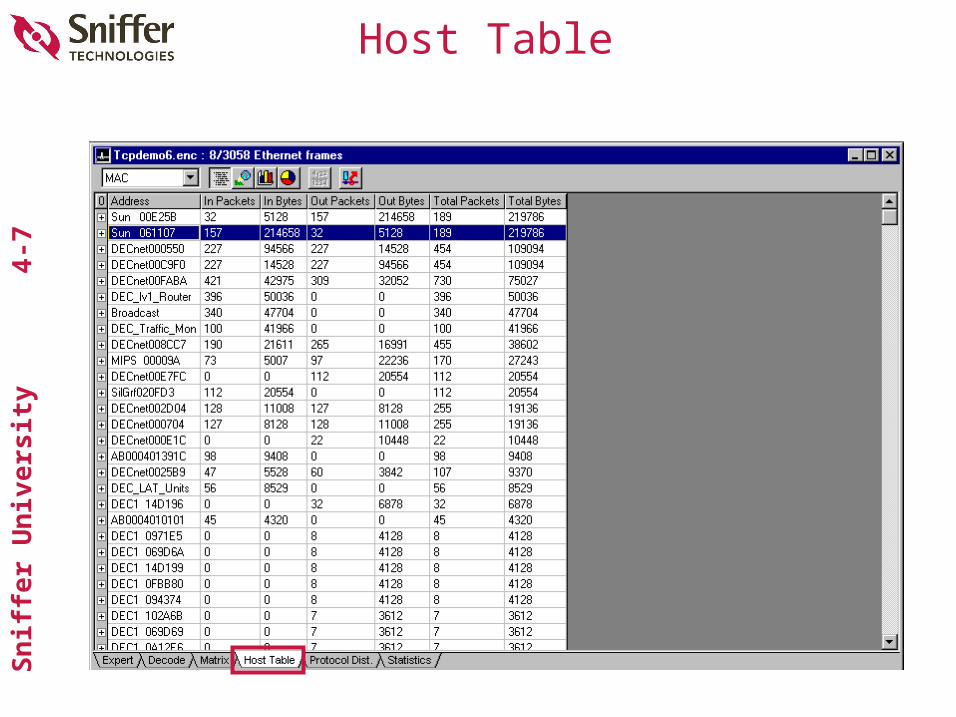
-7Host Table
Sn
iffe
r U
niv
ersi
ty
4
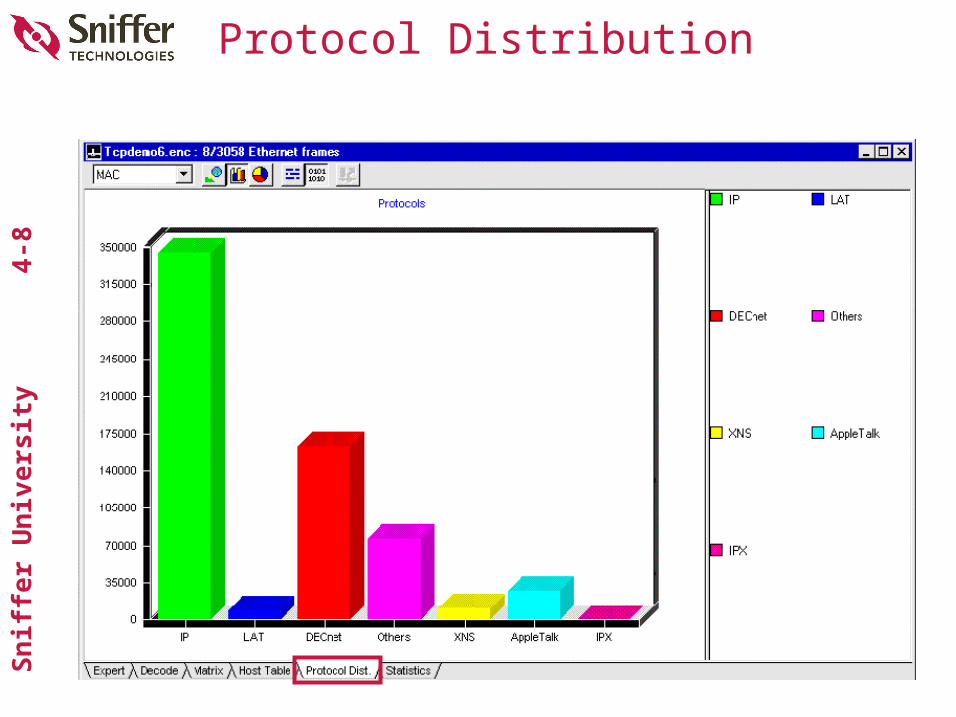
-8Protocol Distribution
Sn
iffe
r U
niv
ersi
ty
4
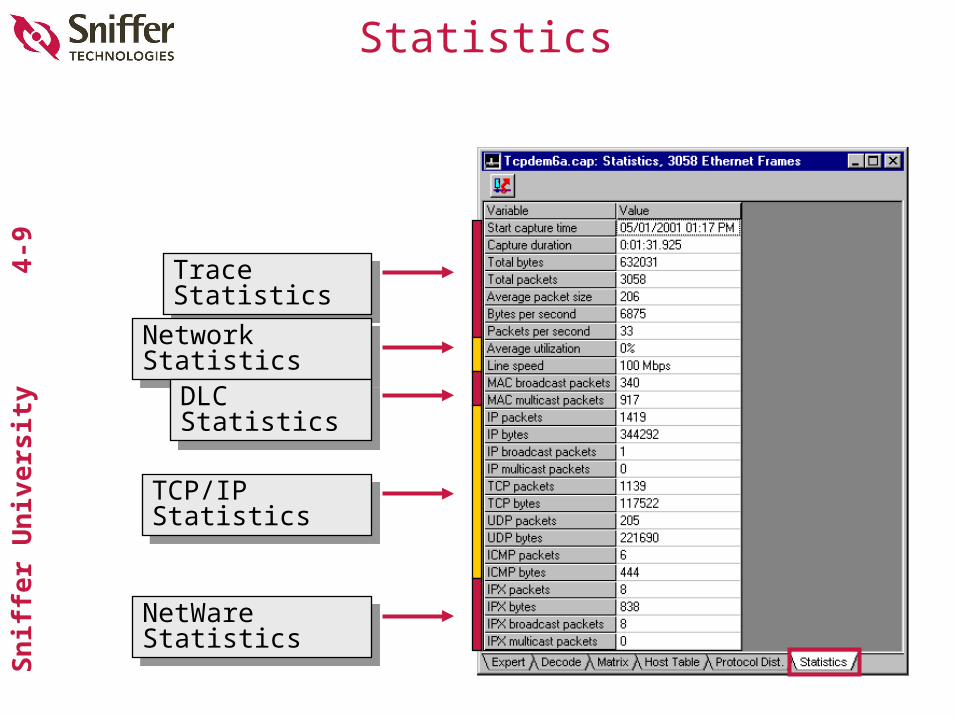
-9Statistics
Trace StatisticsTrace Statistics
Network StatisticsNetwork Statistics
DLC StatisticsDLC Statistics
TCP/IP StatisticsTCP/IP Statistics
NetWare StatisticsNetWare Statistics

Sn
iffe
r U
niv
ersi
ty
4
-10
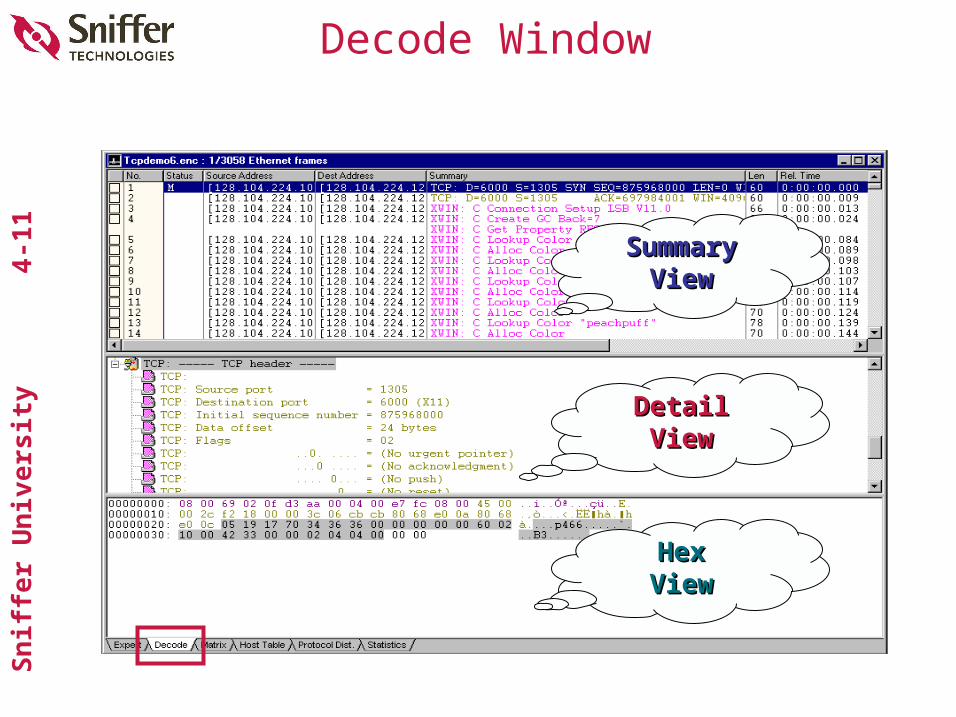
Decode Window
Sn
iffe
r U
niv
ersi
ty
4
-11
Decode Window
SummarySummaryViewView
DetailDetailViewView
HexHexViewView
Sn
iffe
r U
niv
ersi
ty
4
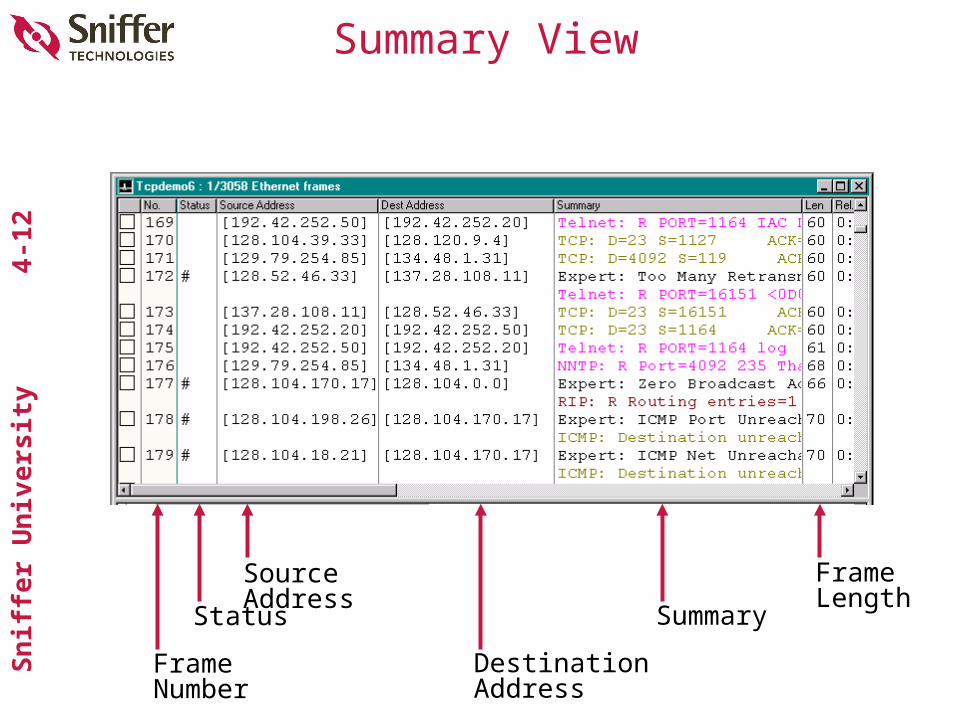
-12Summary View
Frame Length
Summary
Destination Address
Status
Source Address
Frame Number
Sn
iffe
r U
niv
ersi
ty
4
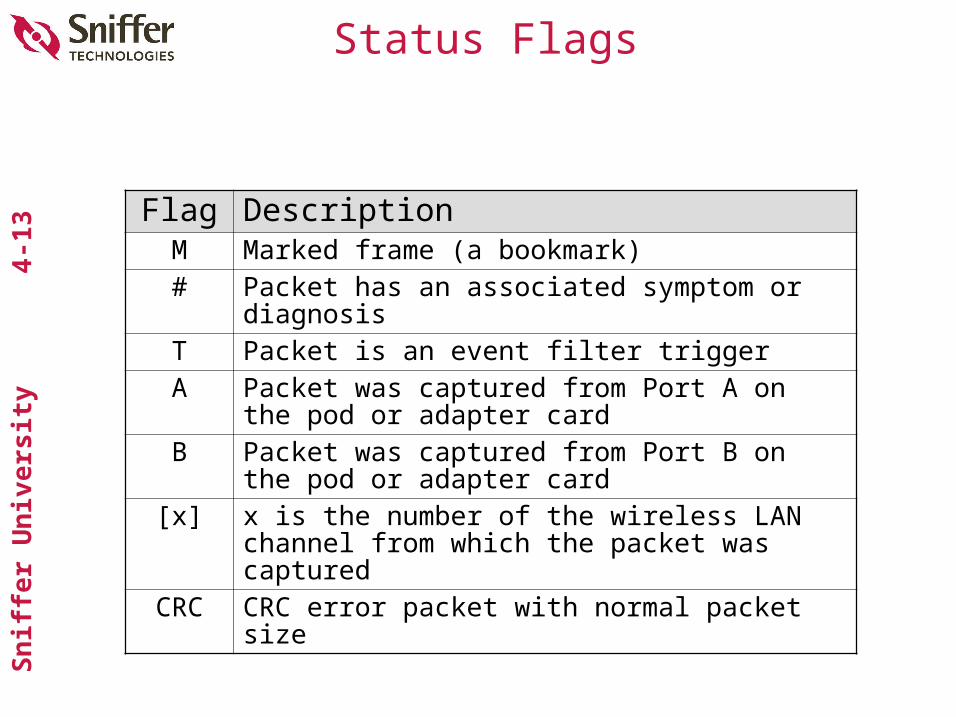
-13Status Flags
Flag DescriptionM Marked frame (a bookmark)# Packet has an associated symptom or
diagnosisT Packet is an event filter triggerA Packet was captured from Port A on the pod
or adapter cardB Packet was captured from Port B on the pod
or adapter card[x] x is the number of the wireless LAN channel
from which the packet was capturedCRC CRC error packet with normal packet size
Sn
iffe
r U
niv
ersi
ty
4
-14
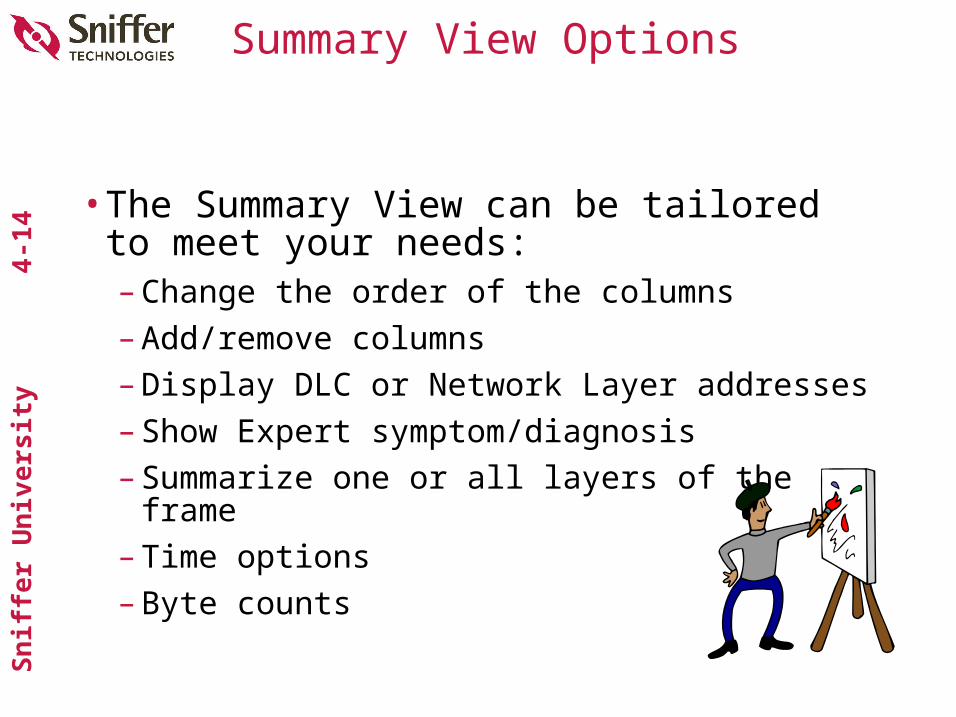
Summary View Options
•The Summary View can be tailored to meet your needs:– Change the order of the columns– Add/remove columns– Display DLC or Network Layer addresses– Show Expert symptom/diagnosis– Summarize one or all layers of the frame– Time options– Byte counts
Sn
iffe
r U
niv
ersi
ty
4
-15
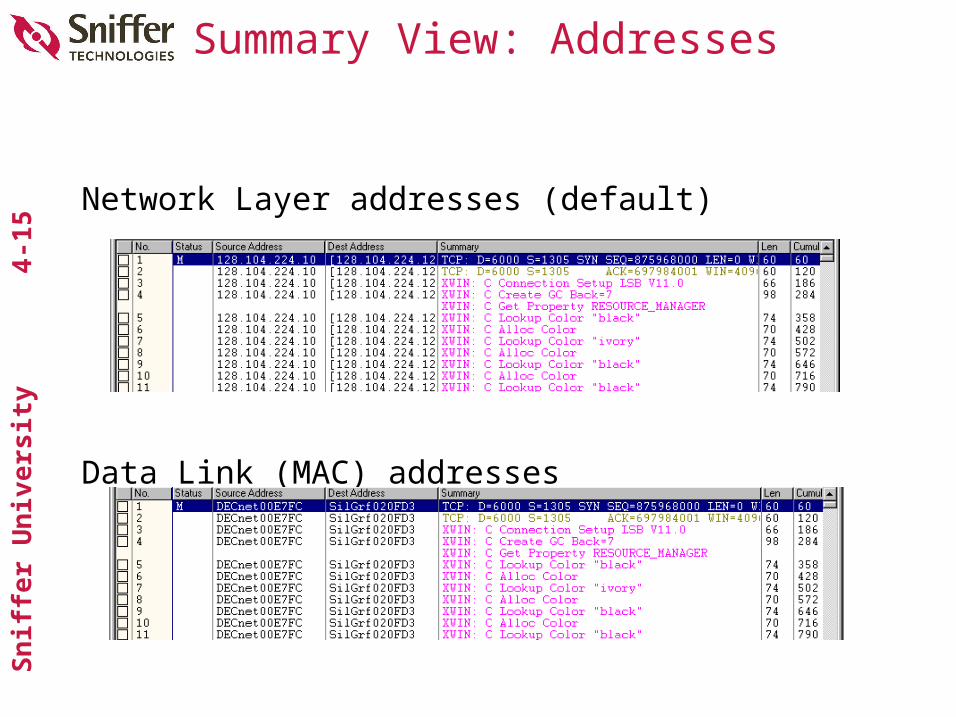
Summary View: Addresses
Network Layer addresses (default)
Data Link (MAC) addresses
Sn
iffe
r U
niv
ersi
ty
4
-16
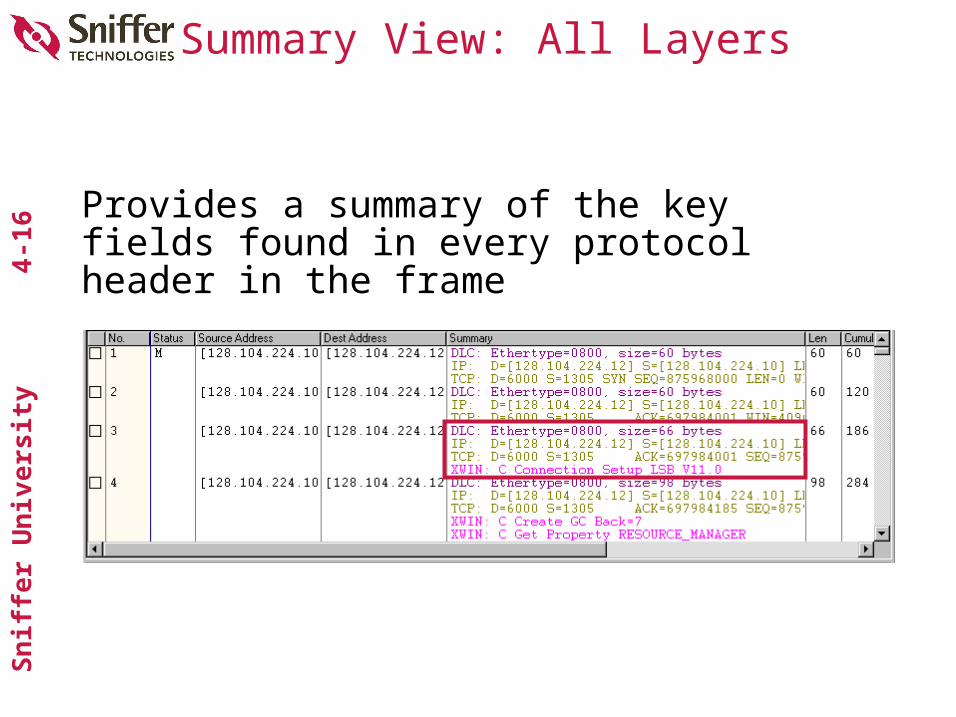
Summary View: All Layers
Provides a summary of the key fields found in every protocol header in the frame
Sn
iffe
r U
niv
ersi
ty
4
-17
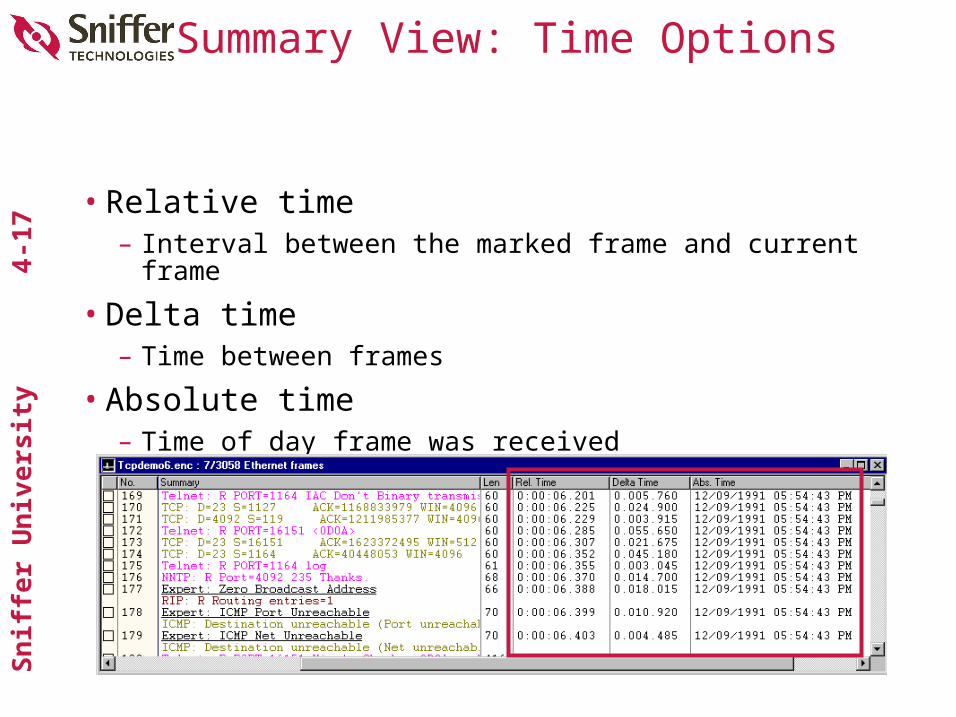
Summary View: Time Options
• Relative time– Interval between the marked frame and current frame
• Delta time– Time between frames
• Absolute time– Time of day frame was received
Sn
iffe
r U
niv
ersi
ty
4
-18
Uses for Time Options
• Relative Time– The time interval between the marked frame and the
current frame– You can find the time span over a number of frames in
order to make response time and throughput measurements
• Delta Time– The time interval (S.000.000) between adjacent displayed
frames– Useful for determining how quickly nodes are transmitting
between frames and for seeing a server’s turnaround time
• Absolute Time– The time of day (HH:MM:SS.0000) at which each
frame was captured– Used when the actual time of day is required
(be sure the correct DATE and TIME are set)
Sn
iffe
r U
niv
ersi
ty
4
-19
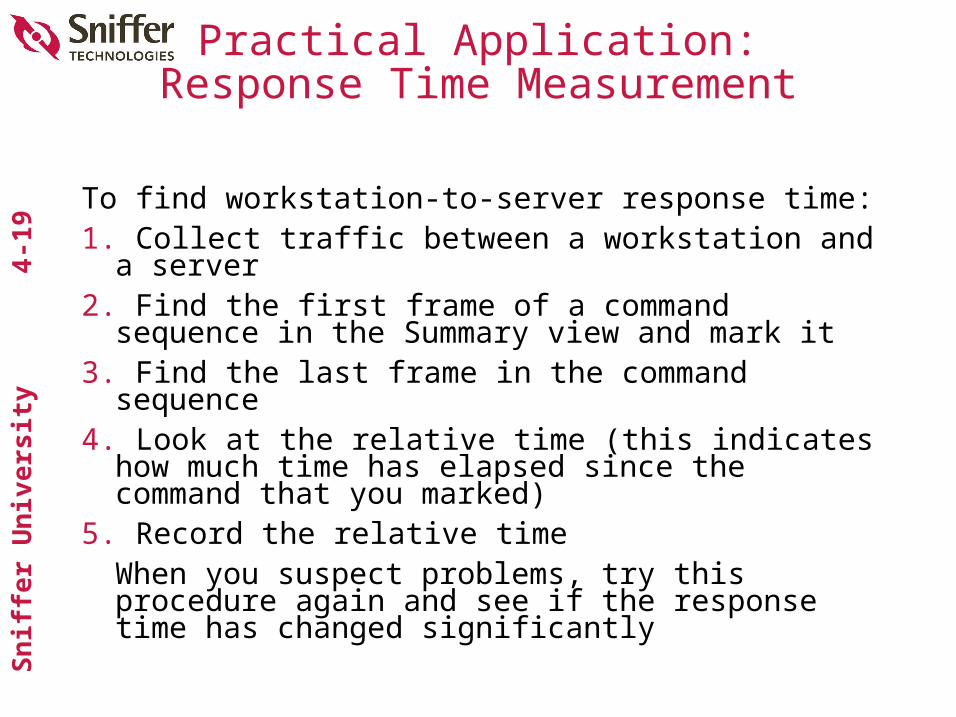
Practical Application:Response Time Measurement
To find workstation-to-server response time:1. Collect traffic between a workstation and a
server2. Find the first frame of a command sequence in
the Summary view and mark it3. Find the last frame in the command sequence4. Look at the relative time (this indicates how
much time has elapsed since the command that you marked)
5. Record the relative timeWhen you suspect problems, try this procedure again and see if the response time has changed significantly
Sn
iffe
r U
niv
ersi
ty
4
-20Exercise 4-1
Response Time Measurement
Sn
iffe
r U
niv
ersi
ty
4
-21
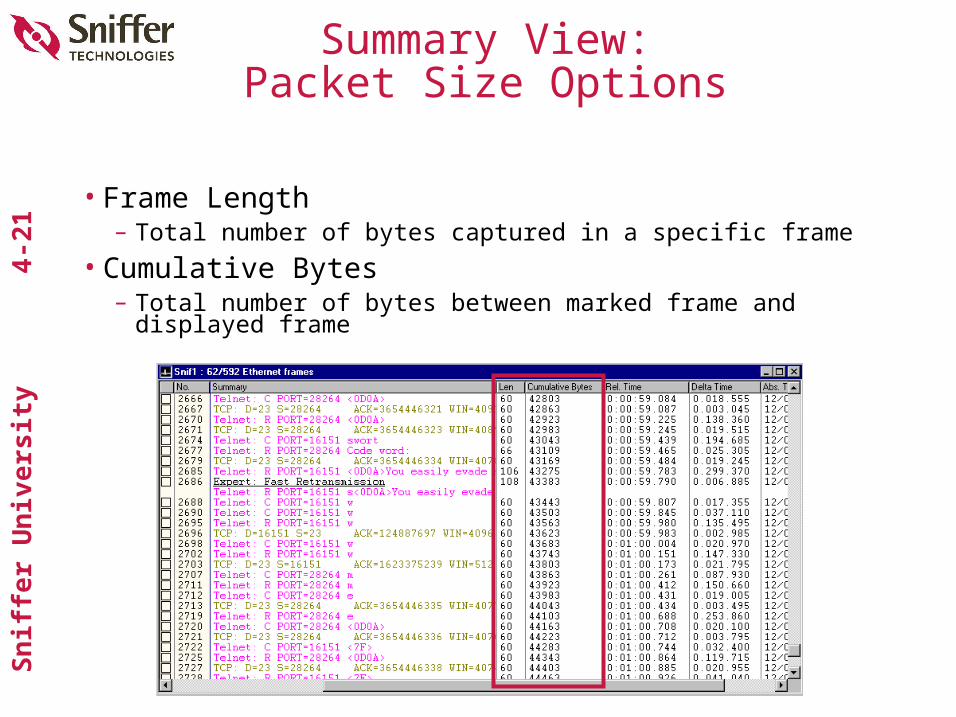
Summary View:Packet Size Options
• Frame Length– Total number of bytes captured in a specific frame
• Cumulative Bytes– Total number of bytes between marked frame and
displayed frame
Sn
iffe
r U
niv
ersi
ty
4
-22
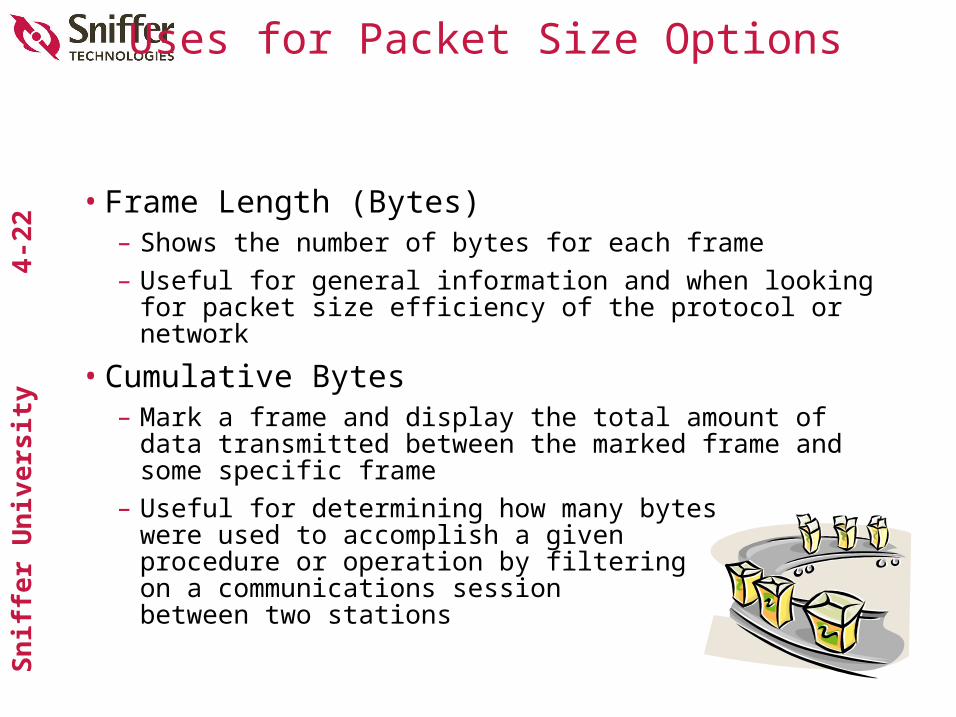
Uses for Packet Size Options
• Frame Length (Bytes)– Shows the number of bytes for each frame– Useful for general information and when looking for
packet size efficiency of the protocol or network
• Cumulative Bytes– Mark a frame and display the total amount of data
transmitted between the marked frame and some specific frame
– Useful for determining how many byteswere used to accomplish a givenprocedure or operation by filteringon a communications sessionbetween two stations
Sn
iffe
r U
niv
ersi
ty
4
-23
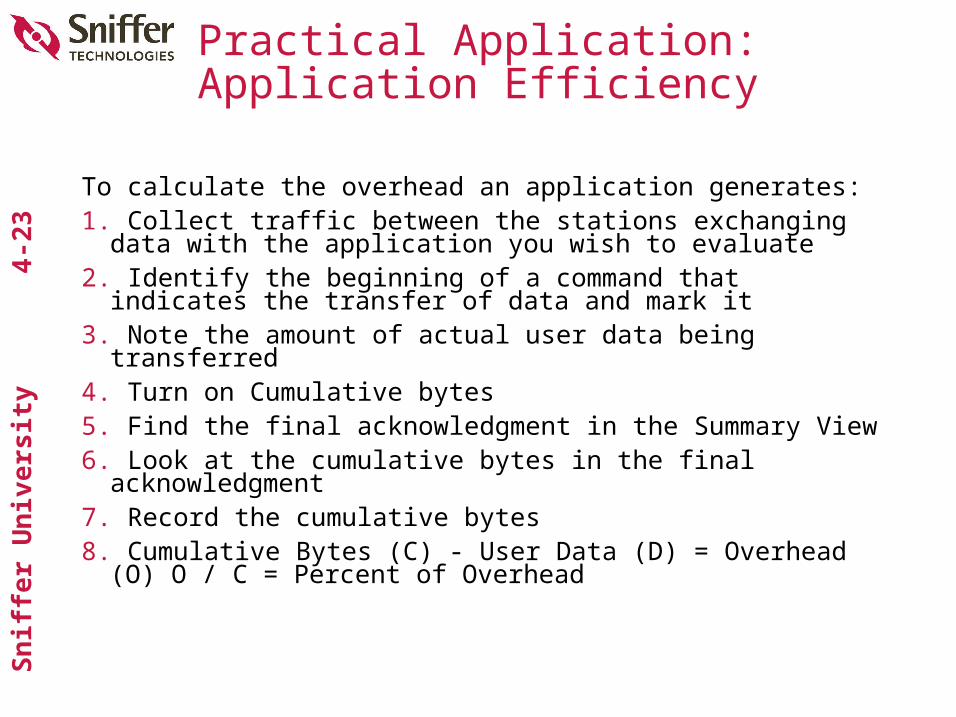
Practical Application:Application Efficiency
To calculate the overhead an application generates:1. Collect traffic between the stations exchanging data
with the application you wish to evaluate2. Identify the beginning of a command that indicates
the transfer of data and mark it3. Note the amount of actual user data being
transferred4. Turn on Cumulative bytes5. Find the final acknowledgment in the Summary View6. Look at the cumulative bytes in the final
acknowledgment7. Record the cumulative bytes8. Cumulative Bytes (C) - User Data (D) = Overhead (O)
O / C = Percent of Overhead
Sn
iffe
r U
niv
ersi
ty
4
-24Exercise 4-2
Application Efficiency
Sn
iffe
r U
niv
ersi
ty
4
-25
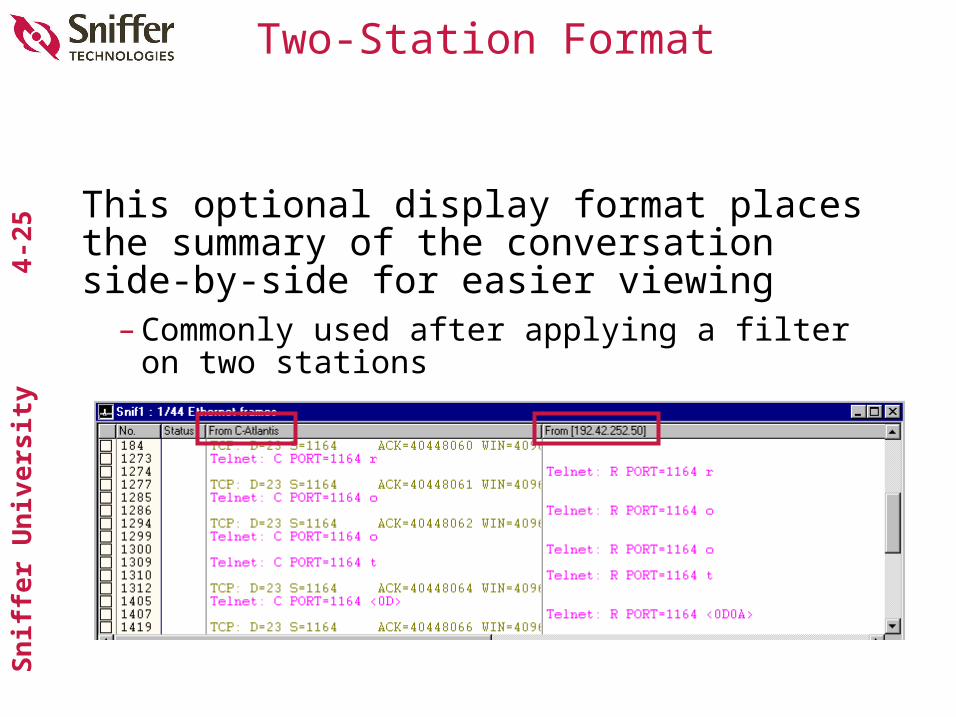
Two-Station Format
This optional display format places the summary of the conversation side-by-side for easier viewing
– Commonly used after applying a filter on two stations
Sn
iffe
r U
niv
ersi
ty
4
-26
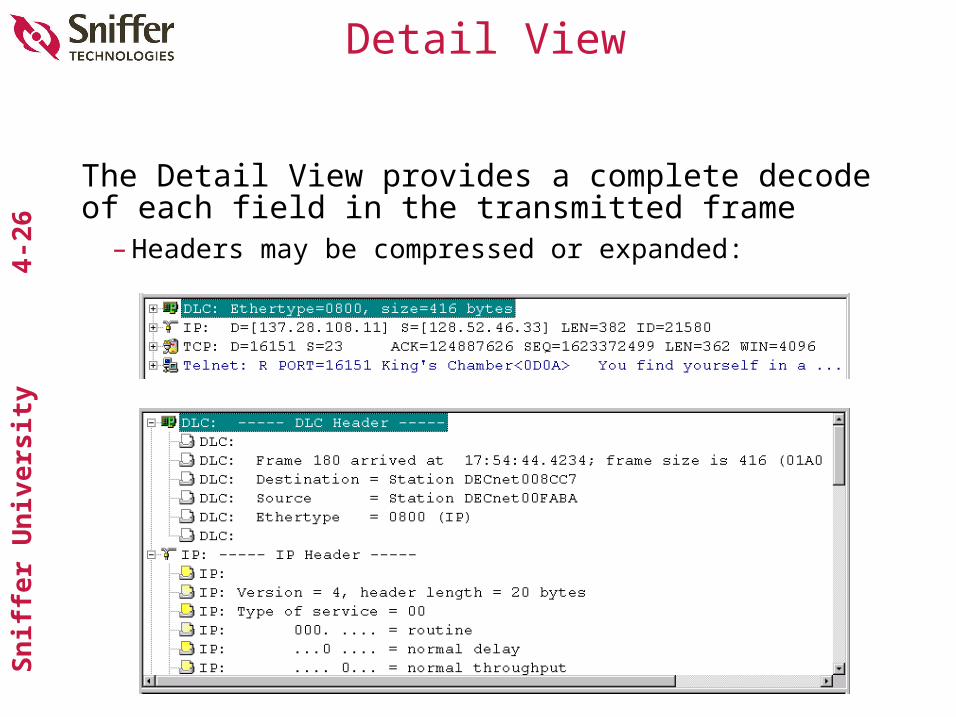
Detail View
The Detail View provides a complete decode of each field in the transmitted frame
– Headers may be compressed or expanded:
Sn
iffe
r U
niv
ersi
ty
4
-27
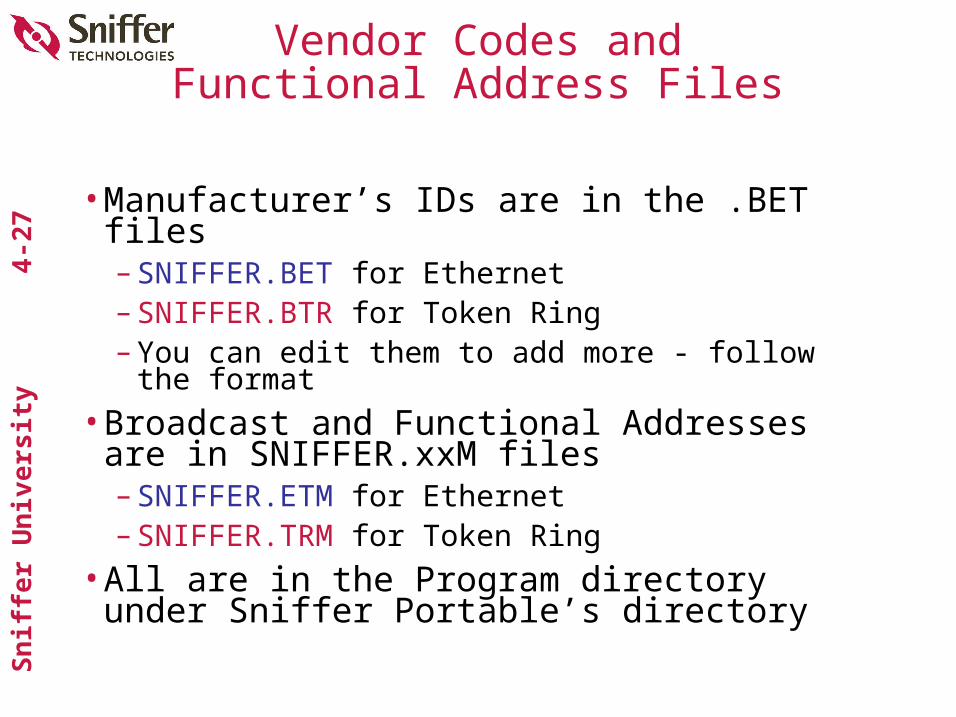
Vendor Codes andFunctional Address Files
•Manufacturer’s IDs are in the .BET files – SNIFFER.BET for Ethernet– SNIFFER.BTR for Token Ring– You can edit them to add more - follow the
format•Broadcast and Functional Addresses are
in SNIFFER.xxM files– SNIFFER.ETM for Ethernet– SNIFFER.TRM for Token Ring
•All are in the Program directory under Sniffer Portable’s directory
Sn
iffe
r U
niv
ersi
ty
4
-28
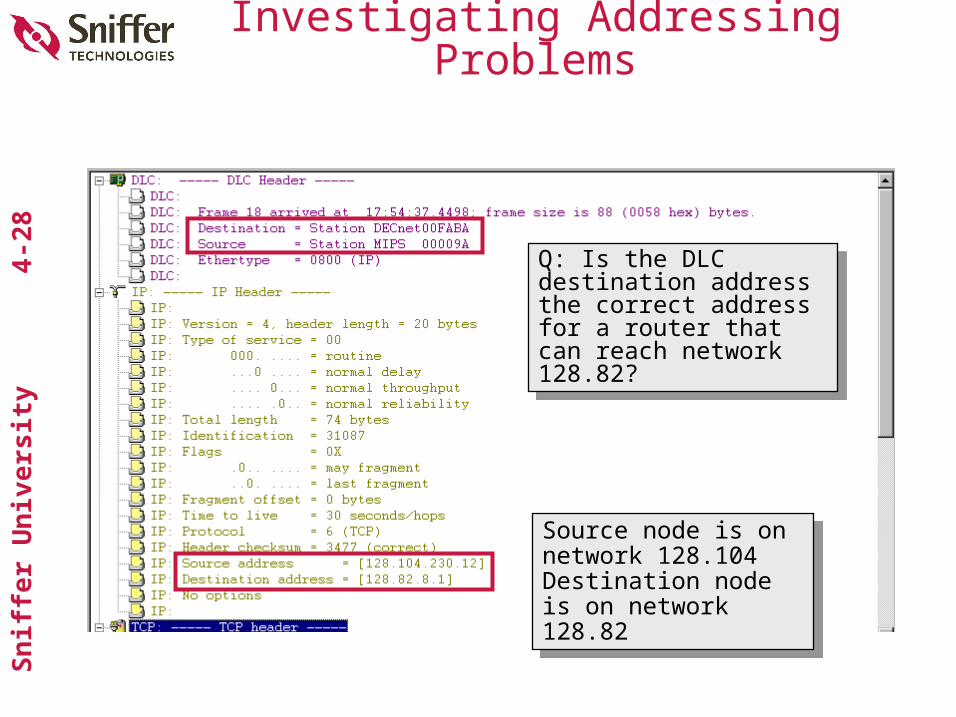
Investigating Addressing Problems
Q: Is the DLC destination address the correct address for a router that can reach network 128.82?
Q: Is the DLC destination address the correct address for a router that can reach network 128.82?
Source node is on network 128.104Destination node is on network 128.82
Source node is on network 128.104Destination node is on network 128.82
Sn
iffe
r U
niv
ersi
ty
4
-29
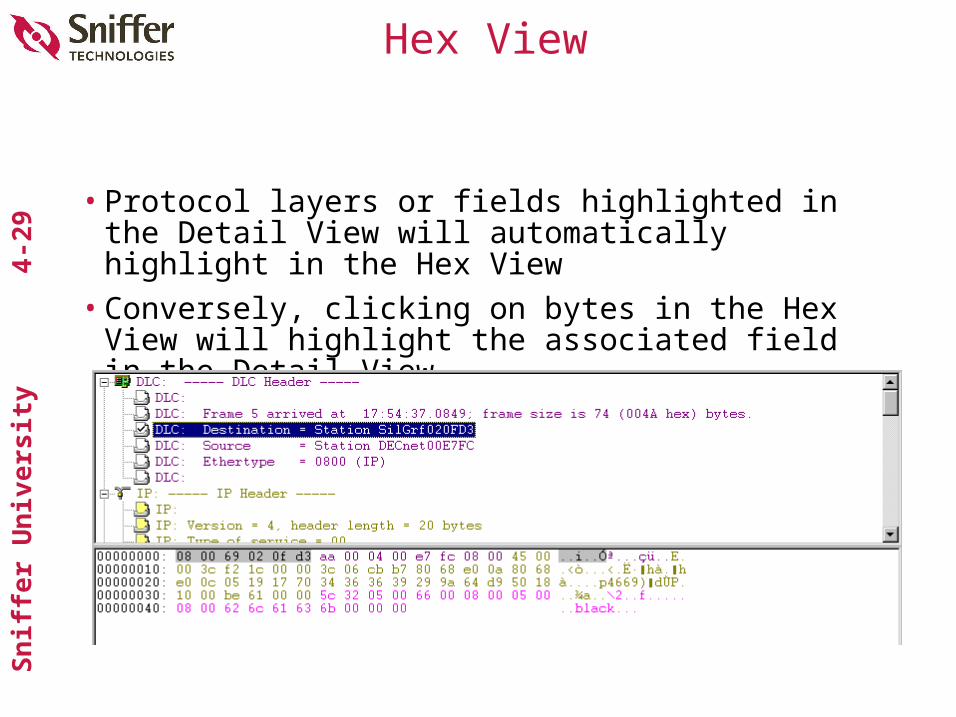
Hex View
• Protocol layers or fields highlighted in the Detail View will automatically highlight in the Hex View
• Conversely, clicking on bytes in the Hex View will highlight the associated field in the Detail View
Sn
iffe
r U
niv
ersi
ty
4
-30
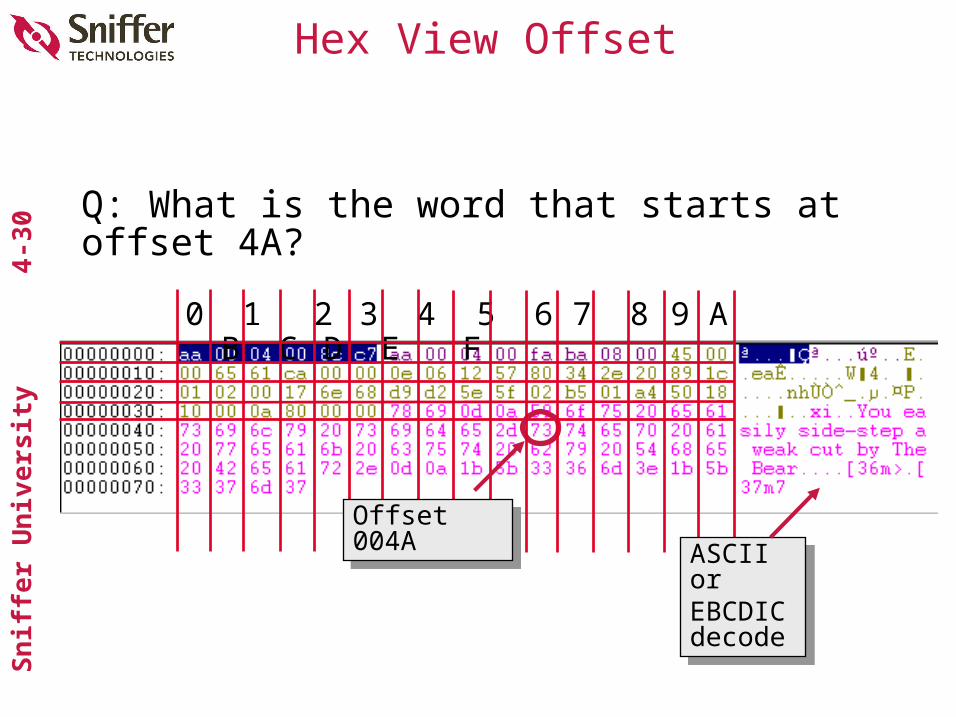
Hex View Offset
Q: What is the word that starts at offset 4A?
0 1 2 3 4 5 6 7 8 9 A B C D E F
ASCII or EBCDIC decode
ASCII or EBCDIC decode
Offset 004AOffset 004A
Sn
iffe
r U
niv
ersi
ty
4
-31
Decode Window Navigation Tips
• Keyboard Shortcuts:– Tab to move between the Summary, Detail, and Hex views– Use the F4 key to zoom in or out of a particular view– Use the Home and End keys to go to the top or bottom of
the view– Use F7 to go to the previous frame, F8 to go to the next
frame in the trace– Use F2 to go to the next selected frame, Shift-F2 to go
back
• Click the square box next to a frame to select it for further analysis
• Right-click over the Summary view for short cut to menu options
Sn
iffe
r U
niv
ersi
ty
4
-32
Display Options
•Right-click on any Decode view to do the following:– Find Frames– Go to Frame– Mark Current Frame– Select Frames– Display Setup– Display Filters– Send Current Frame or Buffer
•These capabilities are also available from the main Display menu
Sn
iffe
r U
niv
ersi
ty
4
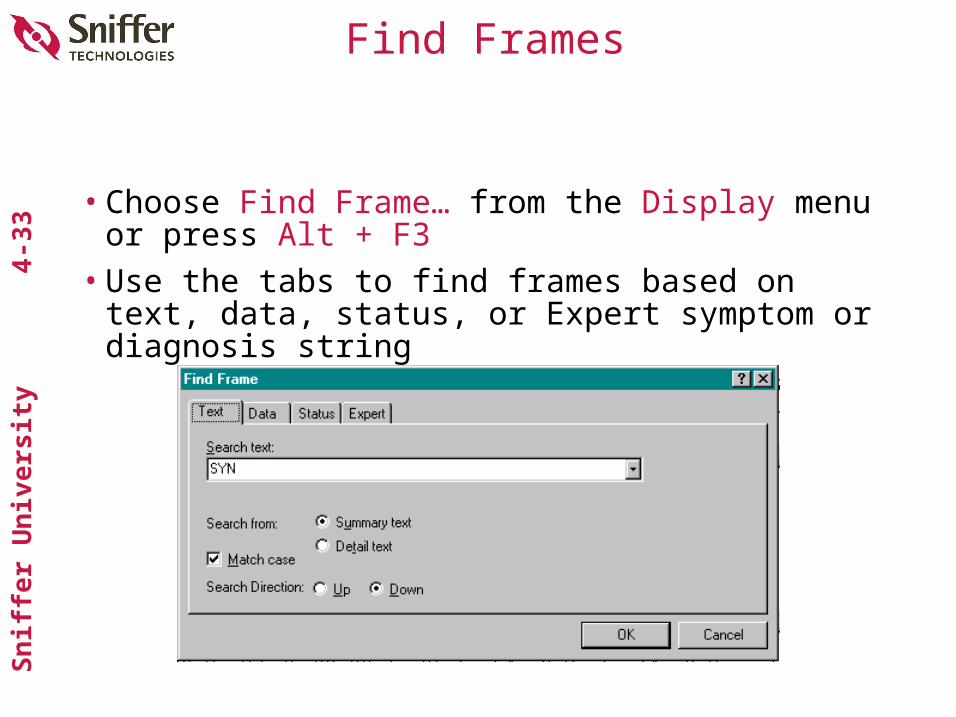
-33Find Frames
• Choose Find Frame… from the Display menu or press Alt + F3
• Use the tabs to find frames based on text, data, status, or Expert symptom or diagnosis string
Sn
iffe
r U
niv
ersi
ty
4
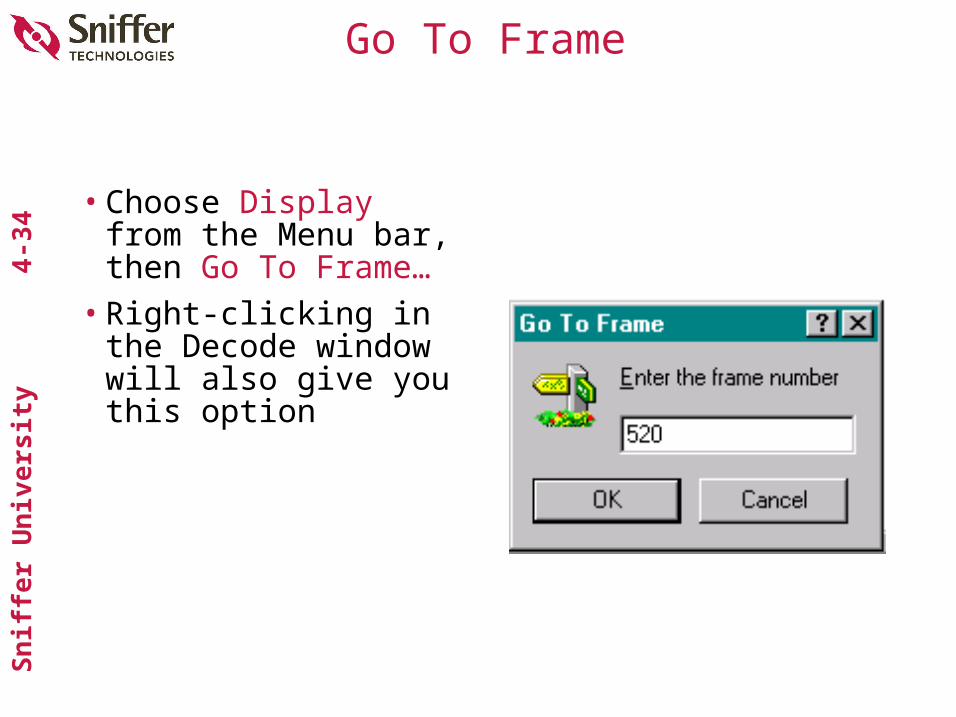
-34Go To Frame
• Choose Display from the Menu bar, then Go To Frame…
• Right-clicking in the Decode window will also give you this option
Sn
iffe
r U
niv
ersi
ty
4
-35
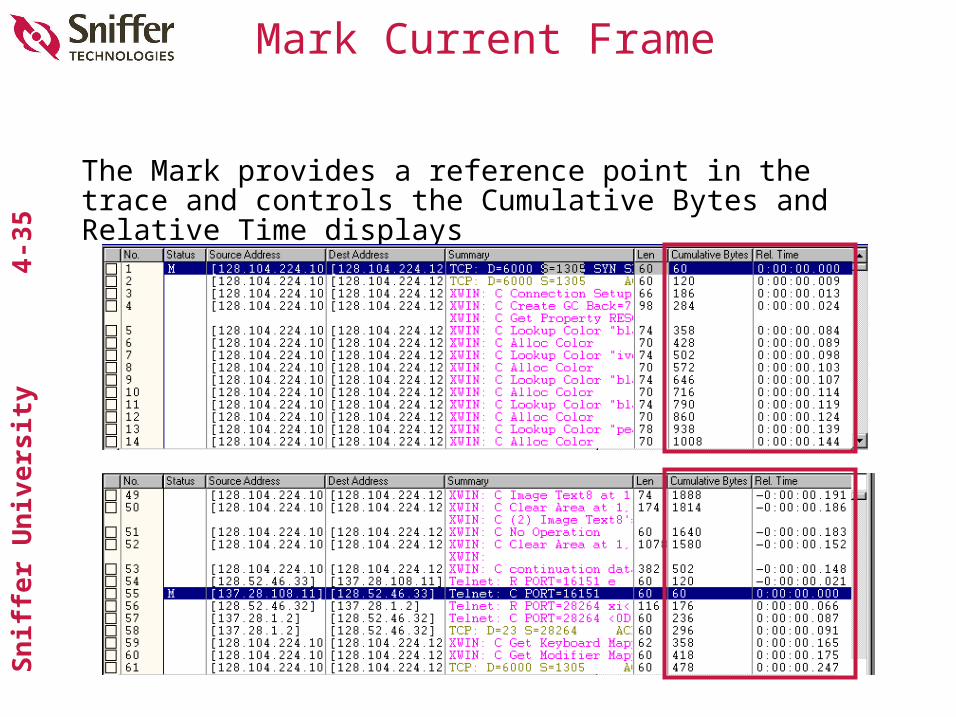
Mark Current Frame
The Mark provides a reference point in the trace and controls the Cumulative Bytes and Relative Time displays
Sn
iffe
r U
niv
ersi
ty
4
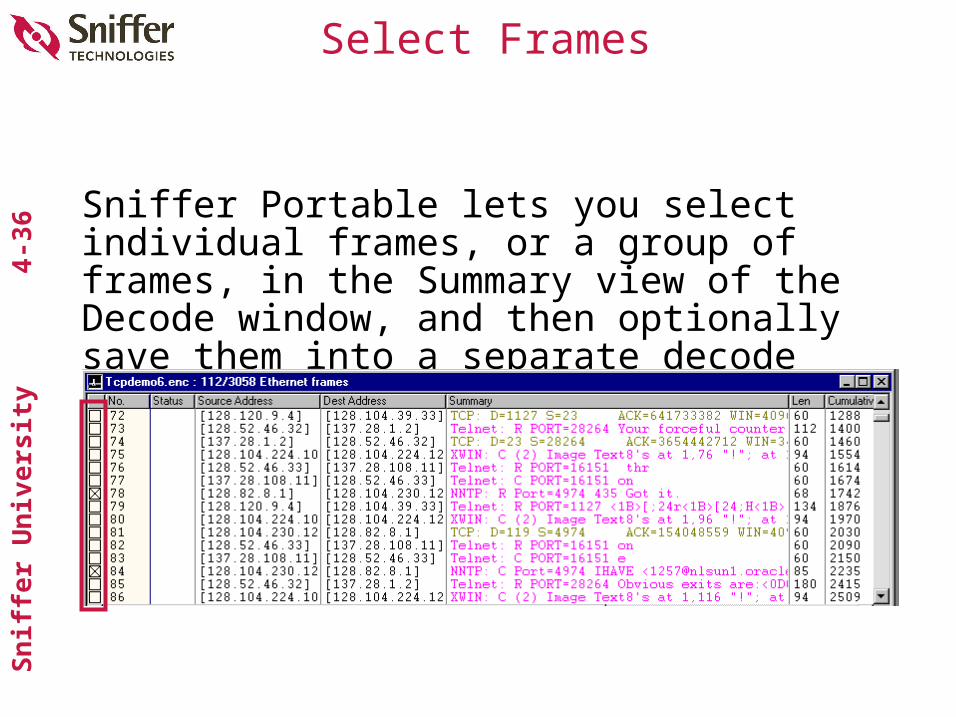
-36Select Frames
Sniffer Portable lets you select individual frames, or a group of frames, in the Summary view of the Decode window, and then optionally save them into a separate decode window
Sn
iffe
r U
niv
ersi
ty
4
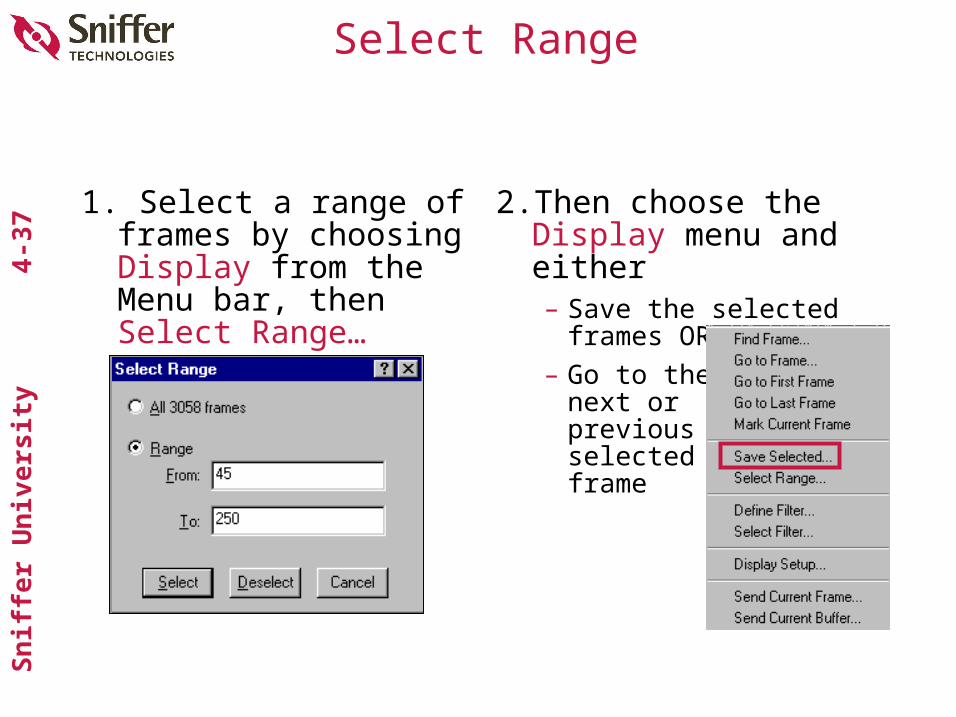
-37Select Range
1. Select a range of frames by choosing Display from the Menu bar, then Select Range…
2.Then choose the Display menu and either– Save the selected
frames OR– Go to the
next orpreviousselectedframe
Sn
iffe
r U
niv
ersi
ty
4
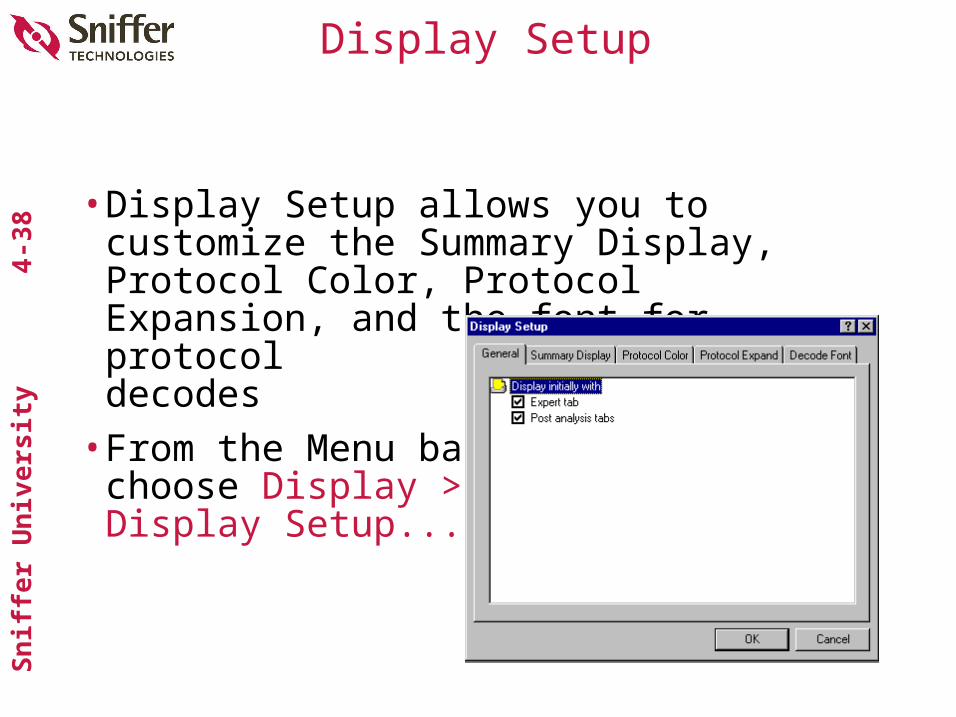
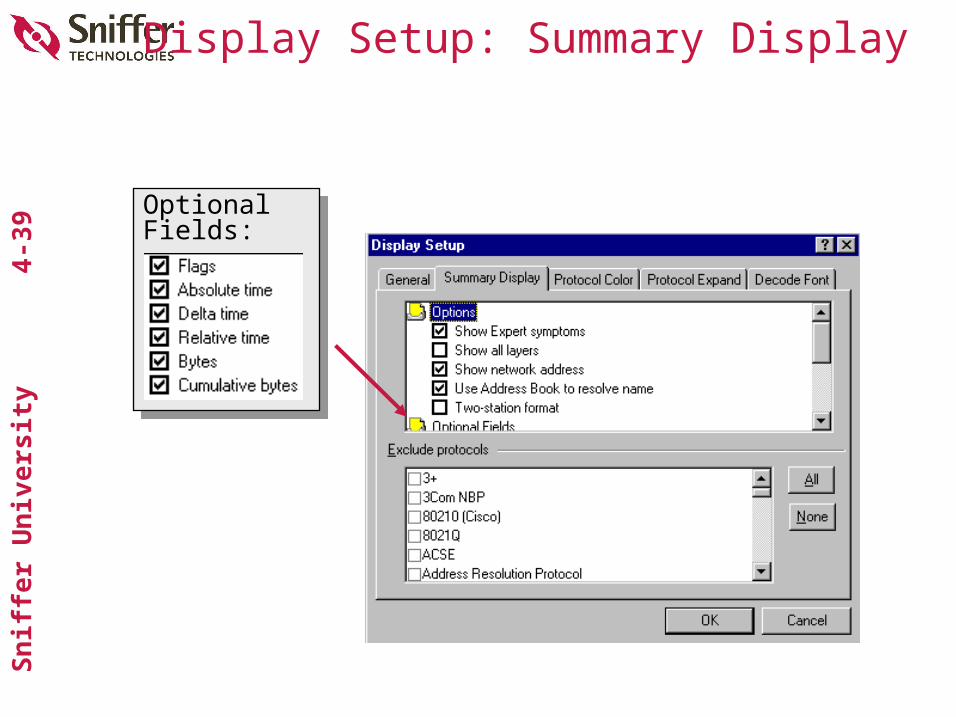
-38Display Setup
•Display Setup allows you to customize the Summary Display, Protocol Color, Protocol Expansion, and the font for protocoldecodes
•From the Menu bar choose Display > Display Setup...
Sn
iffe
r U
niv
ersi
ty
4
-39
Display Setup: Summary Display
Optional Fields:Optional Fields:

Sn
iffe
r U
niv
ersi
ty
4
-40
Using Display Filtersto Narrow the View
Sn
iffe
r U
niv
ersi
ty
4
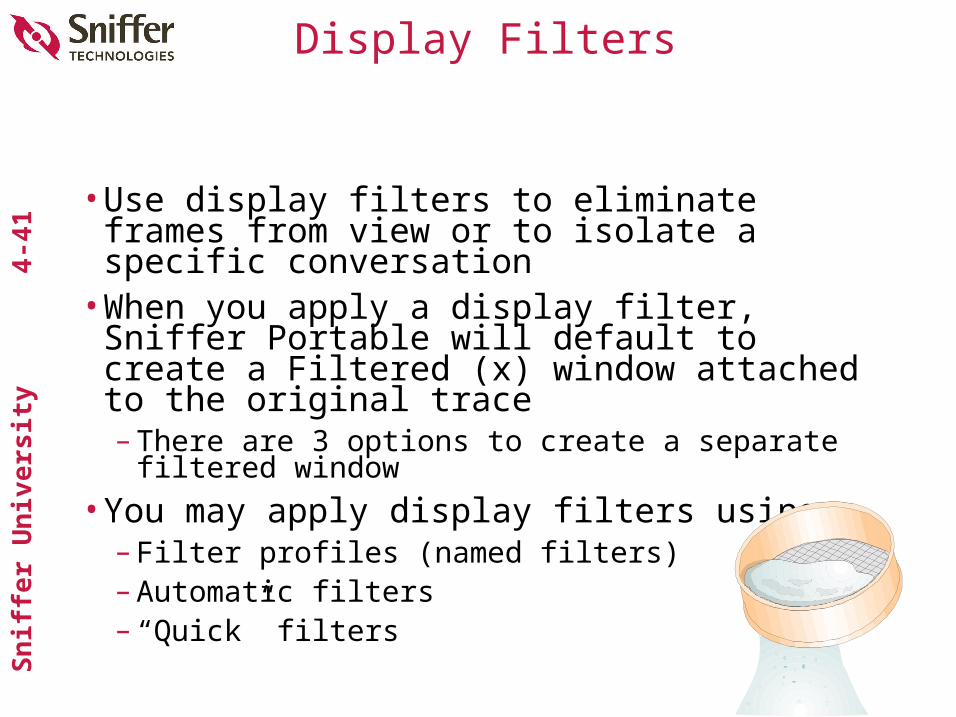
-41Display Filters
•Use display filters to eliminate frames from view or to isolate a specific conversation
•When you apply a display filter, Sniffer Portable will default to create a Filtered (x) window attached to the original trace– There are 3 options to create a separate
filtered window•You may apply display filters using
– Filter profiles (named filters)– Automatic filters– “Quick” filters
Sn
iffe
r U
niv
ersi
ty
4
-42
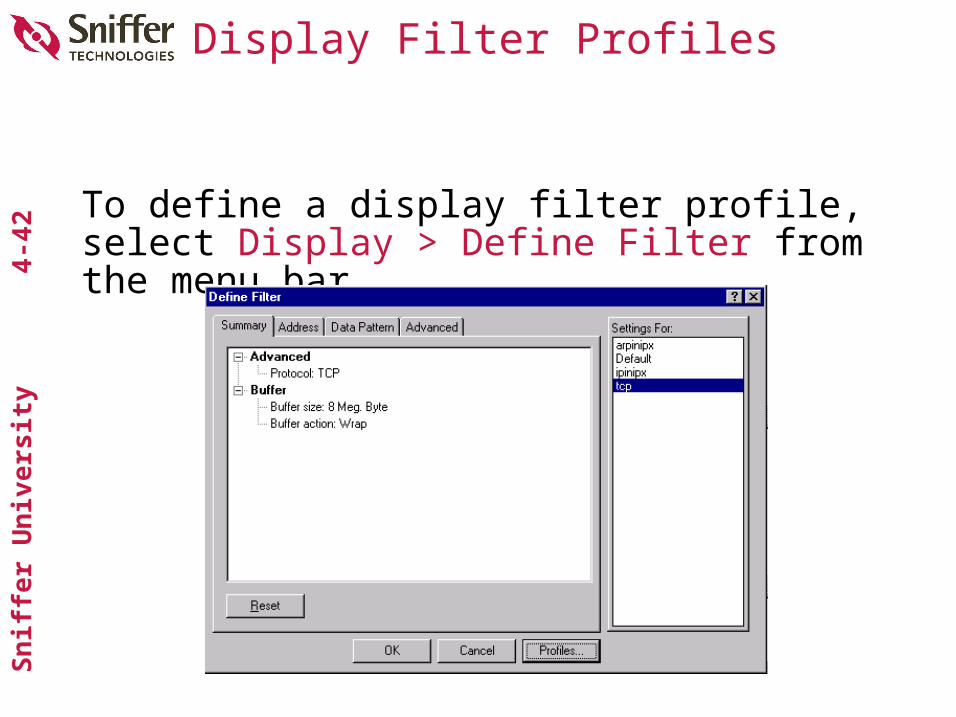
Display Filter Profiles
To define a display filter profile, select Display > Define Filter from the menu bar
Sn
iffe
r U
niv
ersi
ty
4
-43
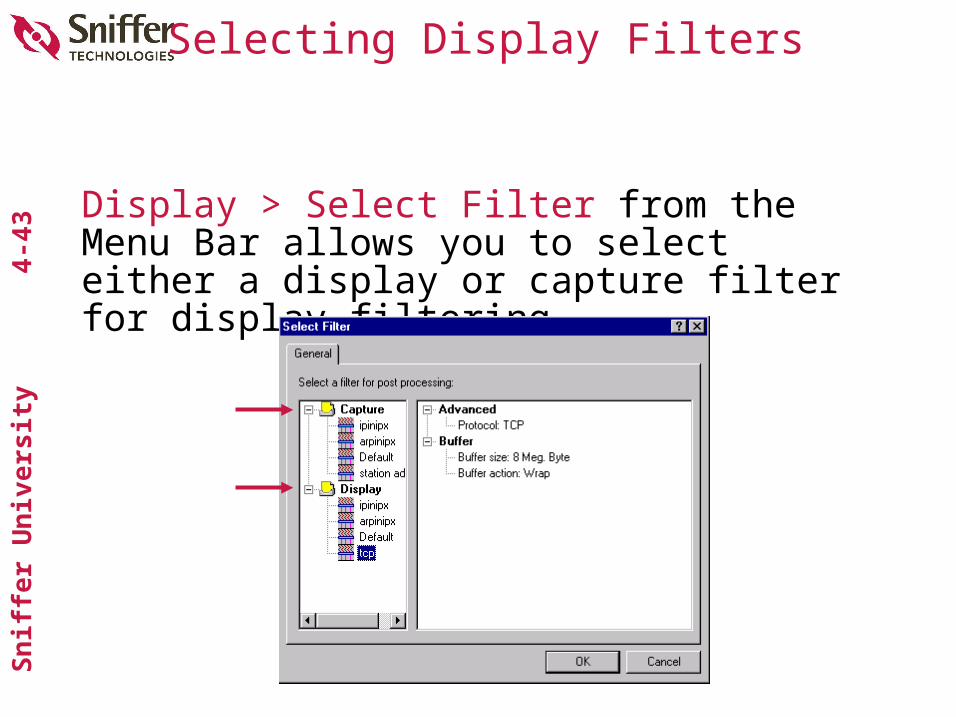
Selecting Display Filters
Display > Select Filter from the Menu Bar allows you to select either a display or capture filter for display filtering
Sn
iffe
r U
niv
ersi
ty
4
-44
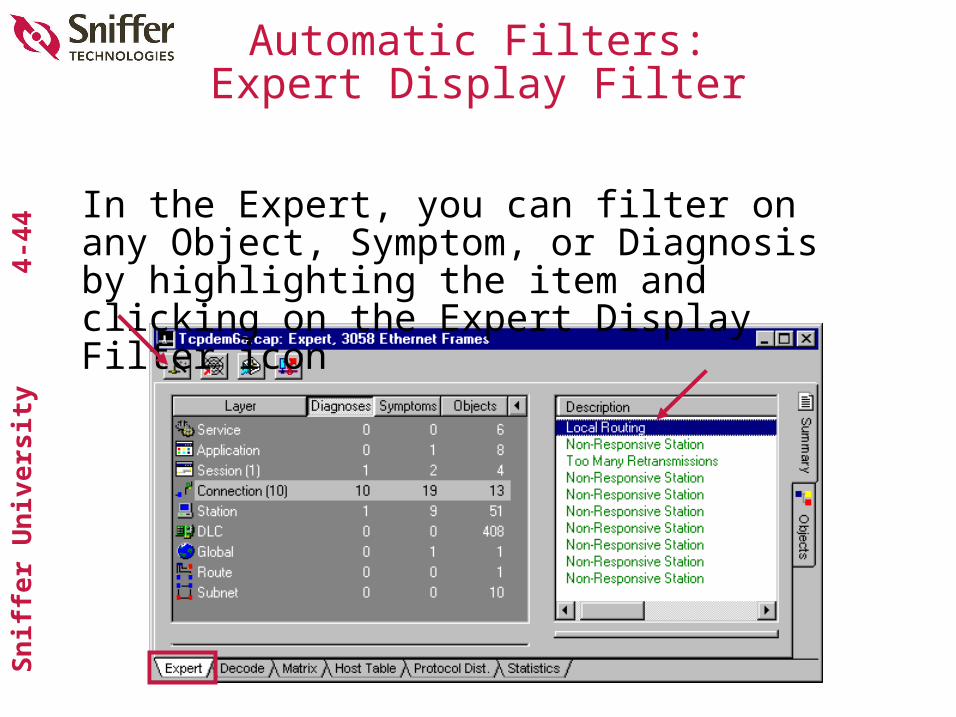
Automatic Filters:Expert Display Filter
In the Expert, you can filter on any Object, Symptom, or Diagnosis by highlighting the item and clicking on the Expert Display Filter icon

Sn
iffe
r U
niv
ersi
ty
4
-45
Automatic Filters:Matrix Visual Filter
In the Matrix, you can select station addresses and filter on them by clicking on the Matrix Visual Filter icon
Sn
iffe
r U
niv
ersi
ty
4
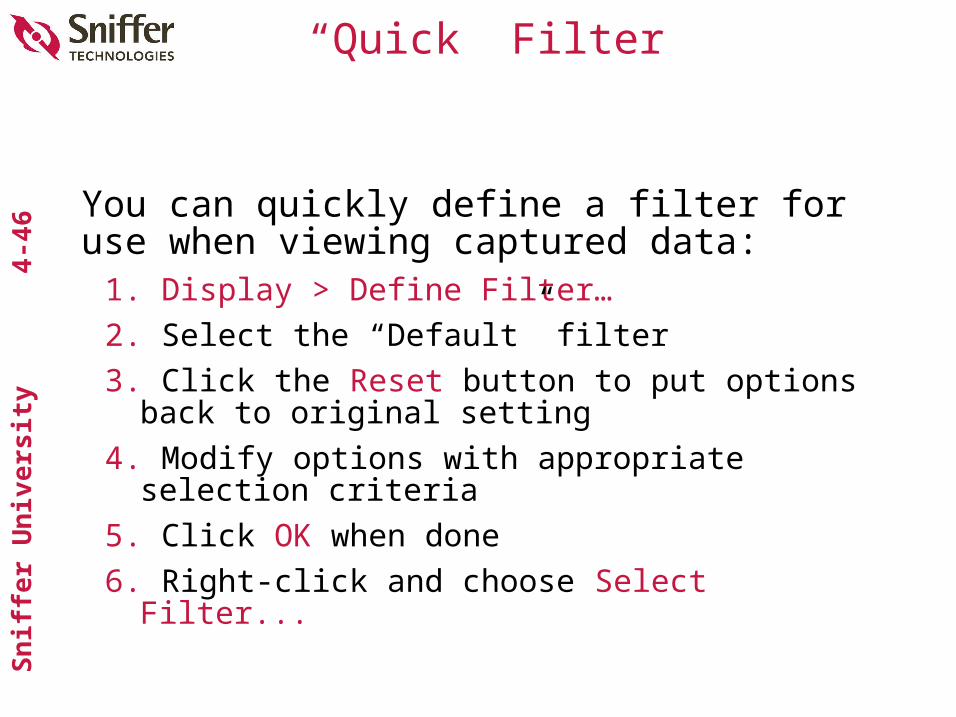
-46“Quick” Filter
You can quickly define a filter for use when viewing captured data:
1. Display > Define Filter…
2. Select the “Default” filter
3. Click the Reset button to put options back to original setting
4. Modify options with appropriate selection criteria
5. Click OK when done
6. Right-click and choose Select Filter...
Sn
iffe
r U
niv
ersi
ty
4
-47
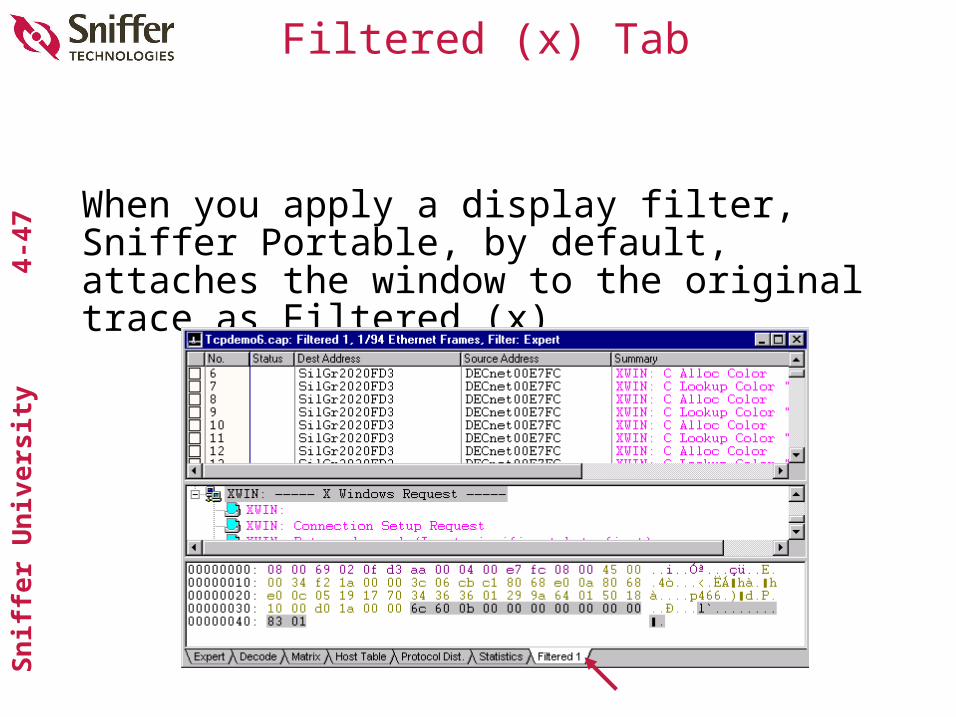
Filtered (x) Tab
When you apply a display filter, Sniffer Portable, by default, attaches the window to the original trace as Filtered (x)
Sn
iffe
r U
niv
ersi
ty
4
-48
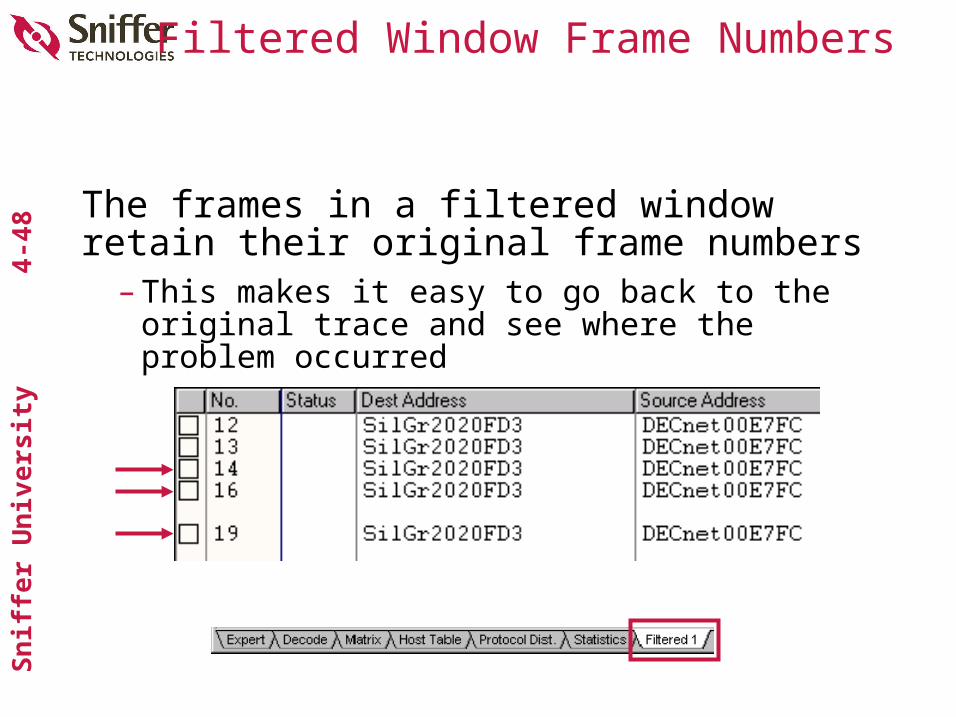
Filtered Window Frame Numbers
The frames in a filtered window retain their original frame numbers
– This makes it easy to go back to the original trace and see where the problem occurred
Sn
iffe
r U
niv
ersi
ty
4
-49
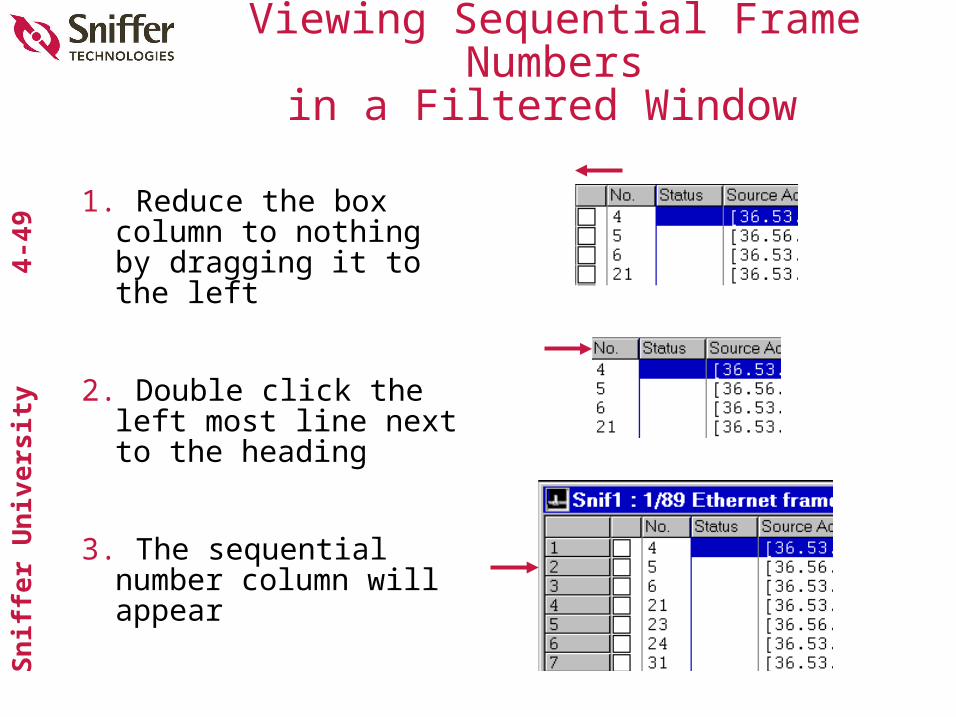
Viewing Sequential Frame Numbersin a Filtered Window
1. Reduce the box column to nothing by dragging it to the left
2. Double click the left most line next to the heading
3. The sequential number column will appear
Sn
iffe
r U
niv
ersi
ty
4
-50
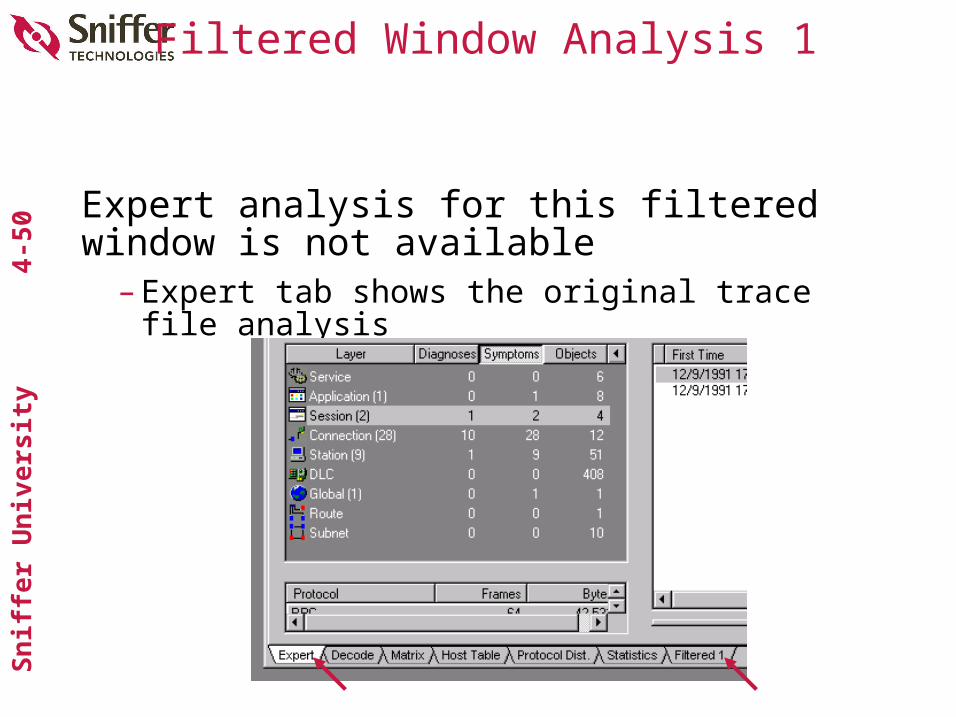
Filtered Window Analysis 1
Expert analysis for this filtered window is not available
– Expert tab shows the original trace file analysis
Sn
iffe
r U
niv
ersi
ty
4
-51
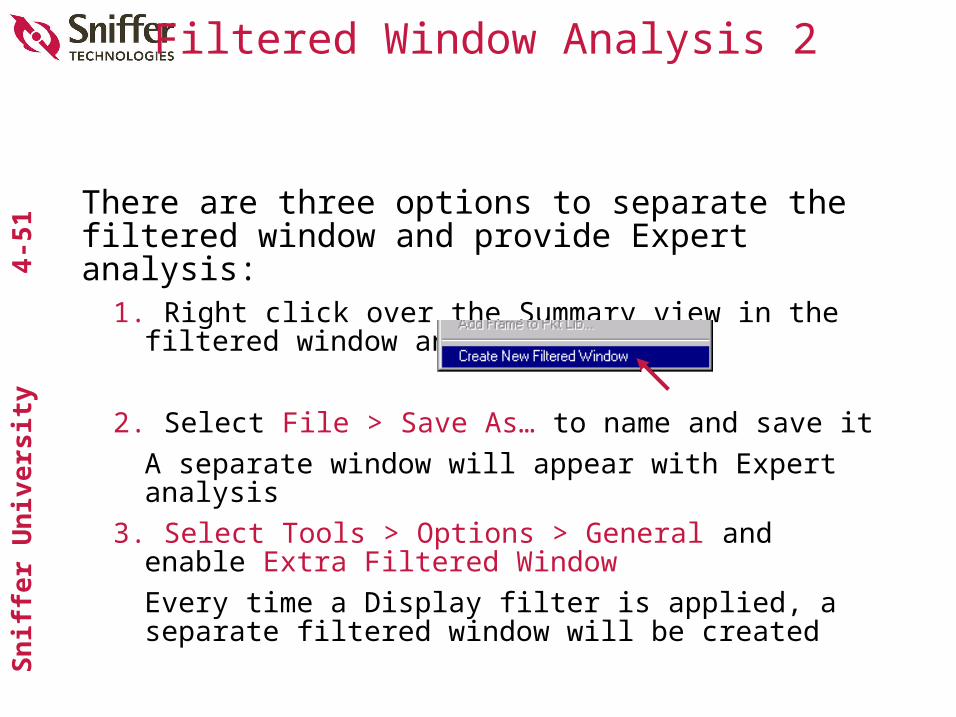
There are three options to separate the filtered window and provide Expert analysis:
1. Right click over the Summary view in the filtered window and select
2. Select File > Save As… to name and save it
A separate window will appear with Expert analysis
3. Select Tools > Options > General and enable Extra Filtered Window
Every time a Display filter is applied, a separate filtered window will be created
Filtered Window Analysis 2
Sn
iffe
r U
niv
ersi
ty
4
-52
Filtered Window Analysis 3
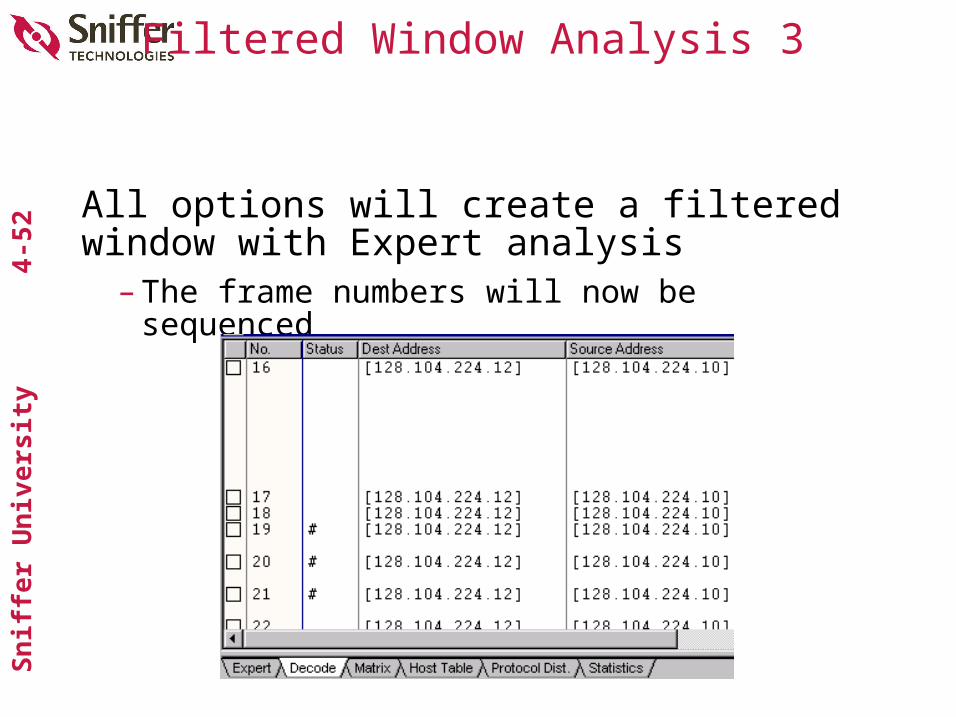
All options will create a filtered window with Expert analysis
– The frame numbers will now be sequenced
Sn
iffe
r U
niv
ersi
ty
4
-53
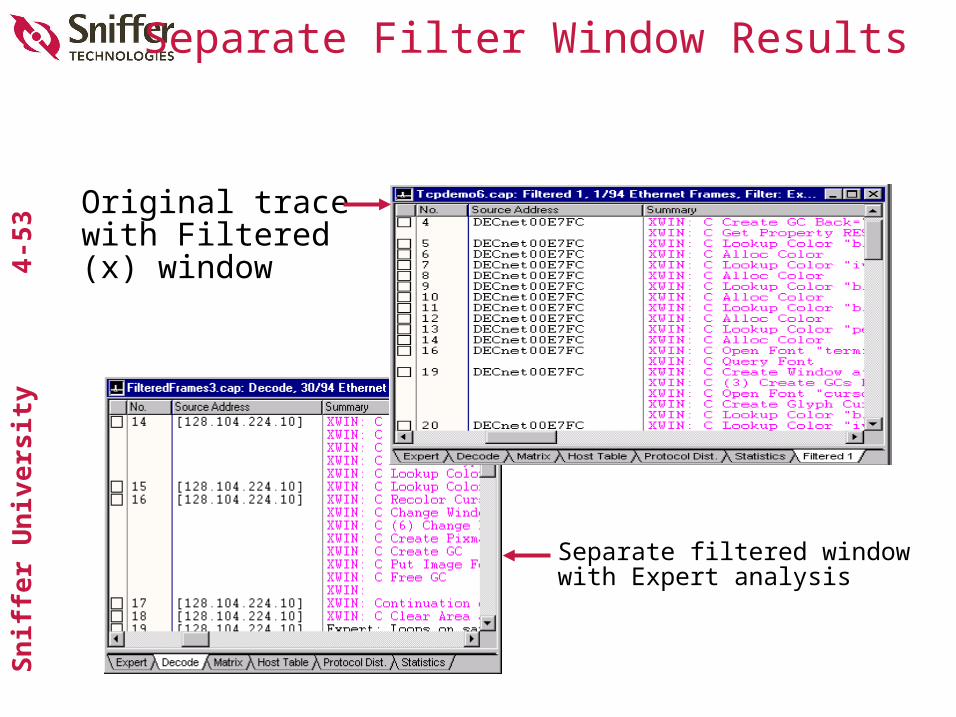
Separate Filter Window Results
Original trace with Filtered (x) window
Separate filtered window with Expert analysis

Sn
iffe
r U
niv
ersi
ty
4
-54
Closing Filtered (x) Window
Right-click on the Filtered (x) tab to display the Close option and remove the filtered window
Sn
iffe
r U
niv
ersi
ty
4
-55
Dave
Exercise 4-3
Sn
iffe
r U
niv
ersi
ty
4
-56
Data Pattern Filter
• Define a data pattern filter to select frames that match data found in a frame at a specific location
• Create from a single data pattern or from multiple patterns that are connected by AND/OR/NOT Boolean operators
• The Data Pattern is defined by:– A particular sequence of bits– The length of the sequence (max. length = 32 bytes)– The offset position of the data in a frame
• The offset position may be specified relative to the beginning of the frame or the beginning of the first protocol header
Sn
iffe
r U
niv
ersi
ty
4
-57
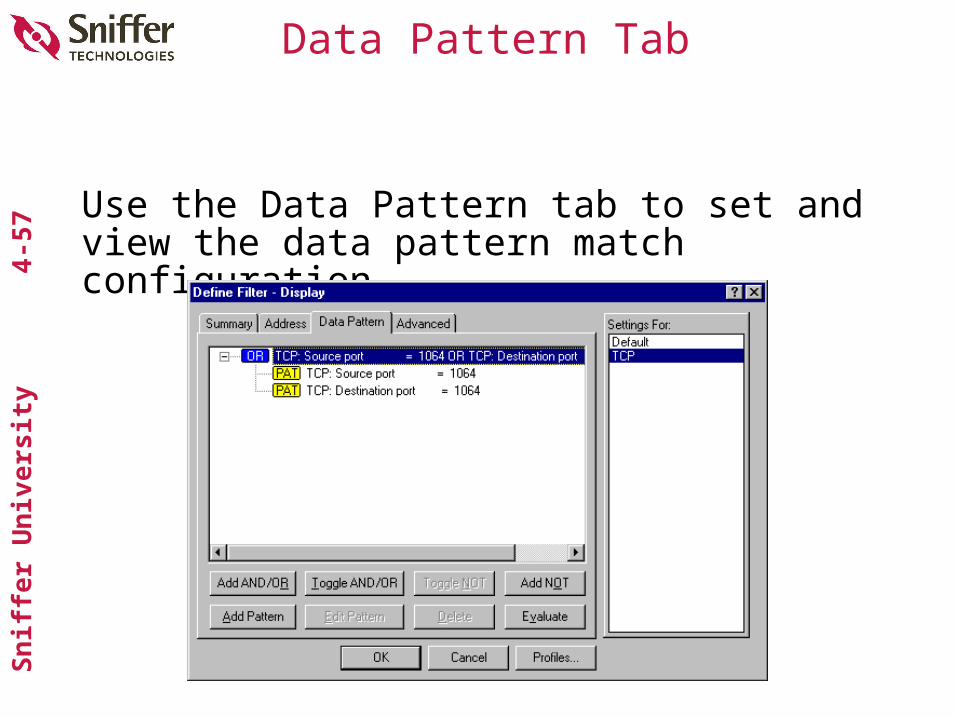
Data Pattern Tab
Use the Data Pattern tab to set and view the data pattern match configuration
Sn
iffe
r U
niv
ersi
ty
4
-58
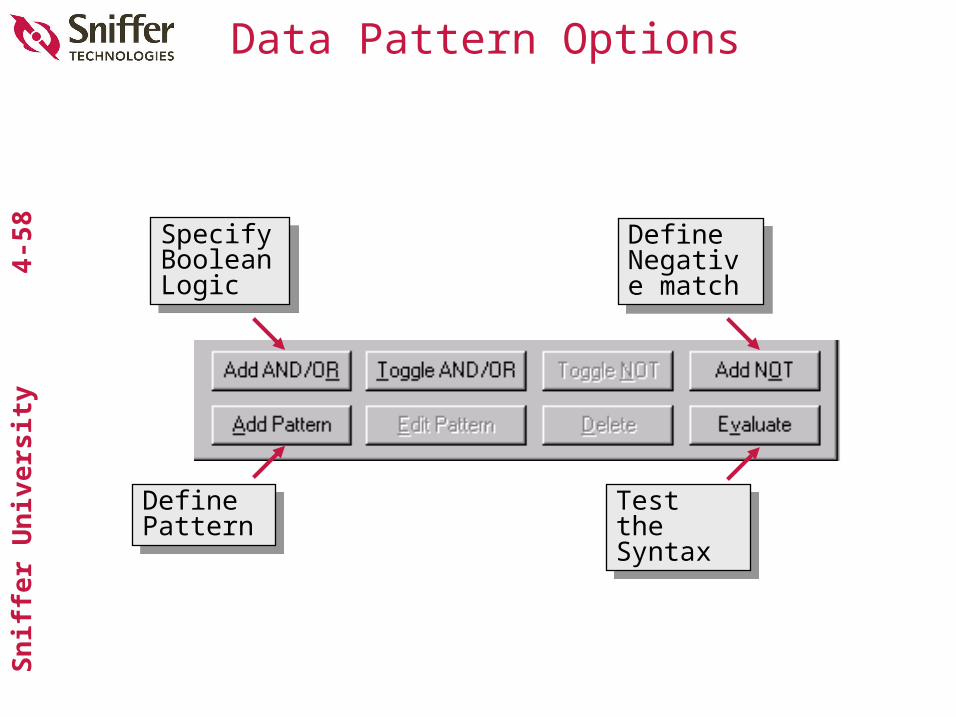
Data Pattern Options
Define PatternDefine Pattern
Specify Boolean Logic
Specify Boolean Logic
Test the SyntaxTest the Syntax
Define Negative match
Define Negative match
Sn
iffe
r U
niv
ersi
ty
4
-59
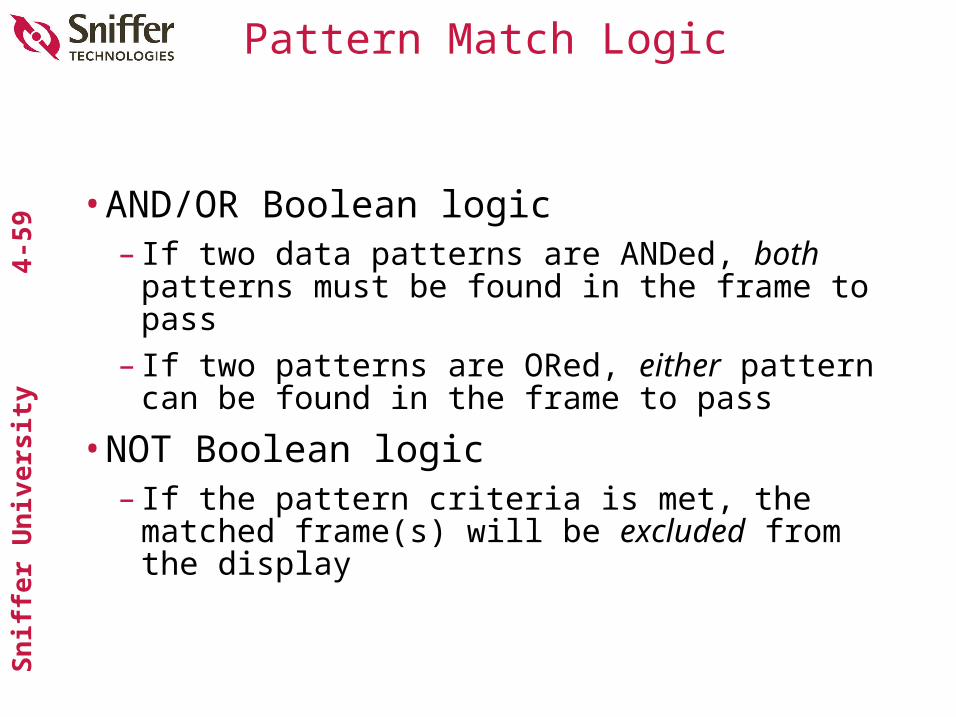
Pattern Match Logic
•AND/OR Boolean logic– If two data patterns are ANDed, both
patterns must be found in the frame to pass– If two patterns are ORed, either pattern can
be found in the frame to pass
•NOT Boolean logic– If the pattern criteria is met, the matched
frame(s) will be excluded from the display
Sn
iffe
r U
niv
ersi
ty
4
-60
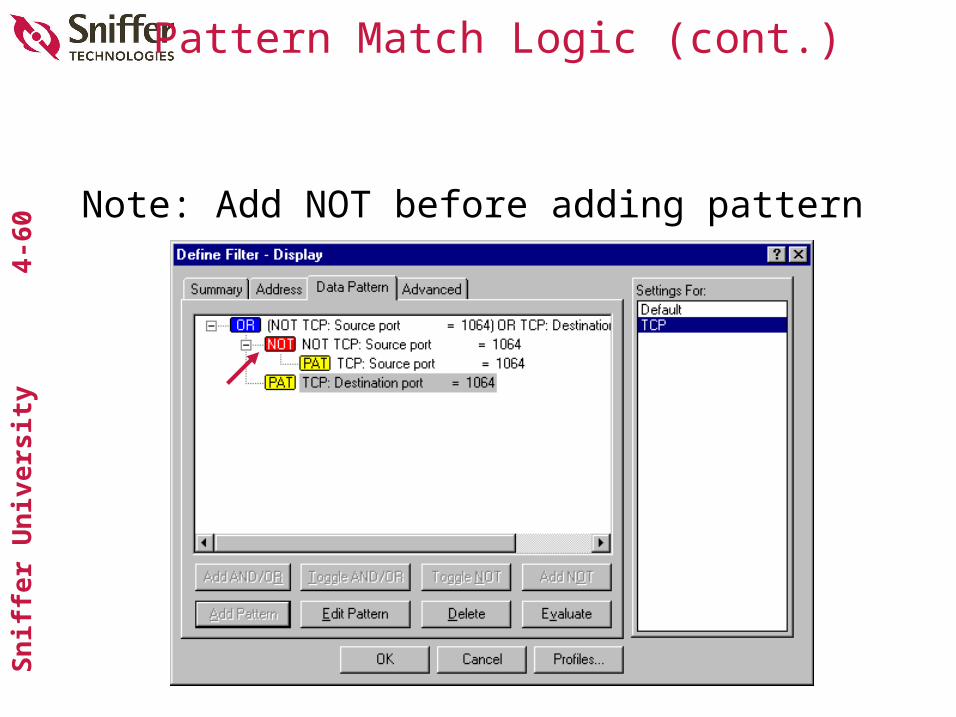
Pattern Match Logic (cont.)
Note: Add NOT before adding pattern
Sn
iffe
r U
niv
ersi
ty
4
-61
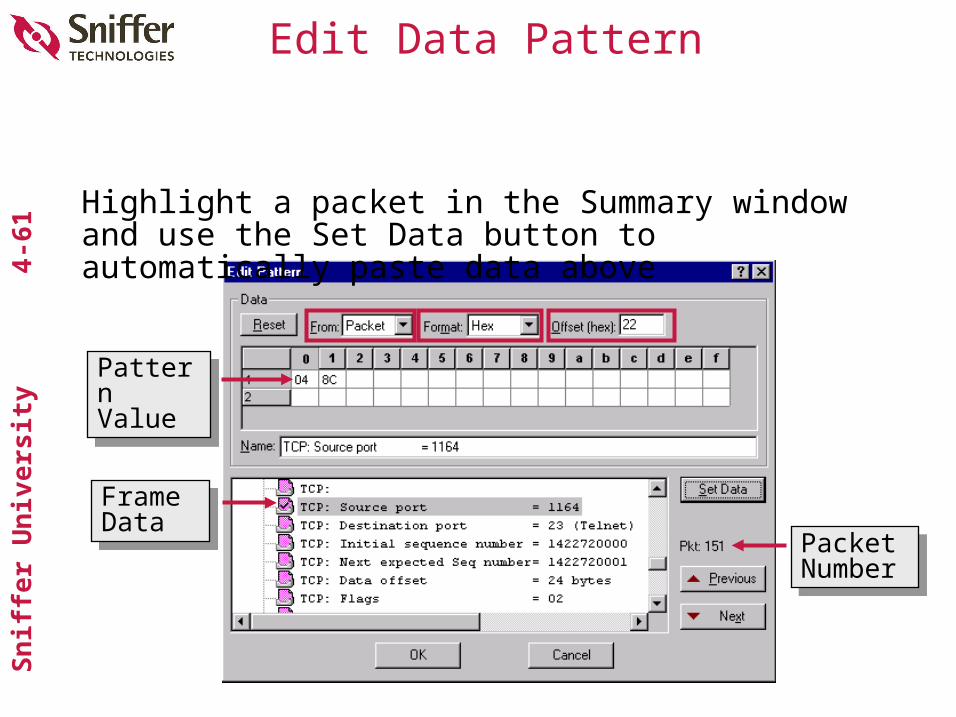
Edit Data Pattern
Highlight a packet in the Summary window and use the Set Data button to automatically paste data above
Frame DataFrame Data
Pattern ValuePattern Value
Packet NumberPacket Number

Sn
iffe
r U
niv
ersi
ty
4
-62
Determines from which point the offset is calculated
– From: Packet calculates the offset from the beginning of the frame
– From: Protocol calculates the offset backwards to the beginning of the Layer 3 header
(*Usually used when there is routing information in the frames)
MAC Header RI NW hdr Transport hdr Data CRC
MAC Header NW hdr Transport hdr Data CRC
Data Offset
Sn
iffe
r U
niv
ersi
ty
4
-63
Pattern Copy and Paste Procedure
To copy and paste a data pattern:1. Identify the frame that contains the desired pattern
2. Select Define Filter…
3. Go to the Data Pattern tab
4. Select the Add Pattern option
5. Select the data Format (Hex, Binary, ASCII, EBCIDIC)
6. Scroll through the data display and find the desired pattern
7. Press Set Data to paste the pattern into the data area
8. Click OK
Set up logical operations with additional data patterns as necessary
Sn
iffe
r U
niv
ersi
ty
4
-64
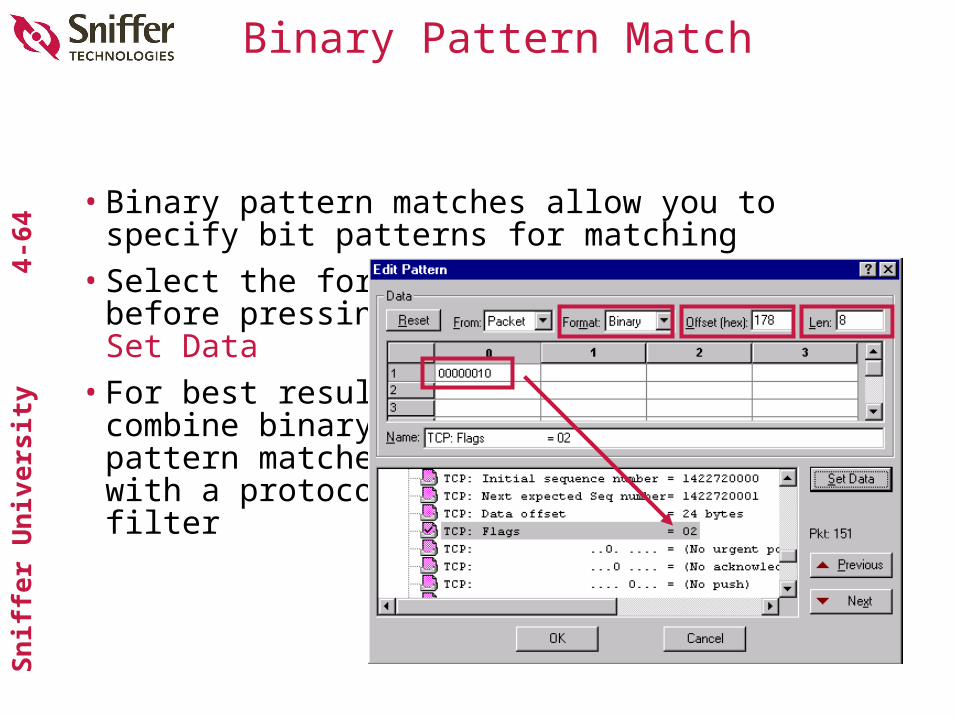
• Binary pattern matches allow you to specify bit patterns for matching
• Select the formatbefore pressingSet Data
• For best results, combine binary pattern matches with a protocol filter
Binary Pattern Match
Sn
iffe
r U
niv
ersi
ty
4
-65
Isolating a Subnet
Exercise 4-4

Sn
iffe
r U
niv
ersi
ty
4
-66
Address Book
Sn
iffe
r U
niv
ersi
ty
4
-67
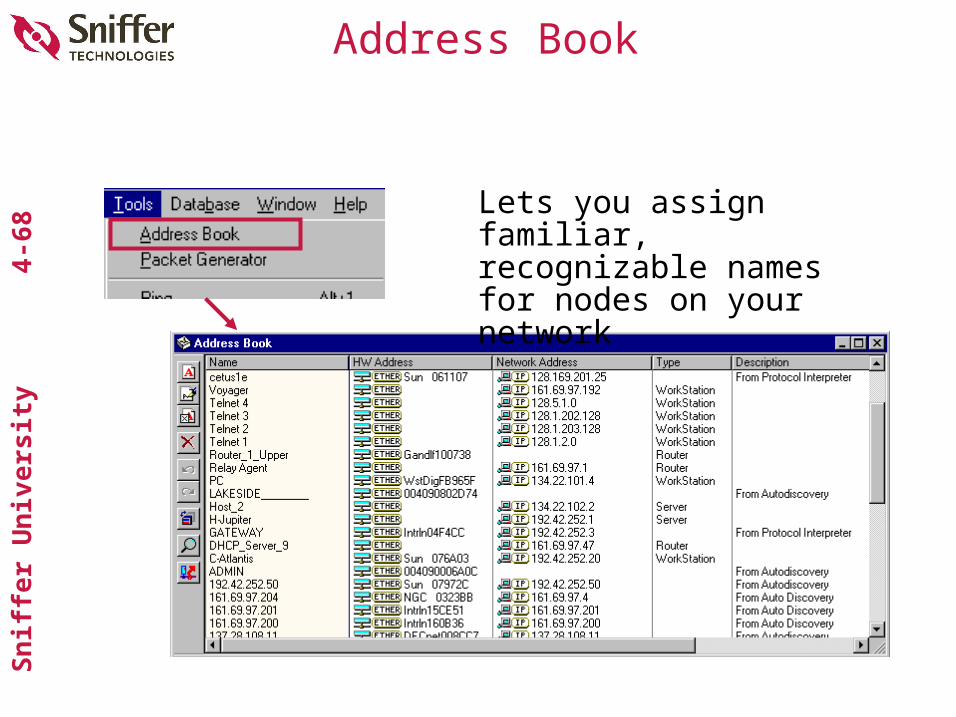
Managing Names
• In an effort to make the analyzer screens more “readable,” names associated with captured addresses are displayed in place of Network Layer or DLC addresses
• The names are discovered automatically by Sniffer Portable during monitor, capture, and display of data
• The name information is stored in a temporary table for display purposes and may be transferred to the Address Book for permanent storage
• Names may be imported into the Address Book, providing a more complete online reference for a network
Sn
iffe
r U
niv
ersi
ty
4
-68Address Book
Lets you assign familiar, recognizable names for nodes on your network
Sn
iffe
r U
niv
ersi
ty
4
-69
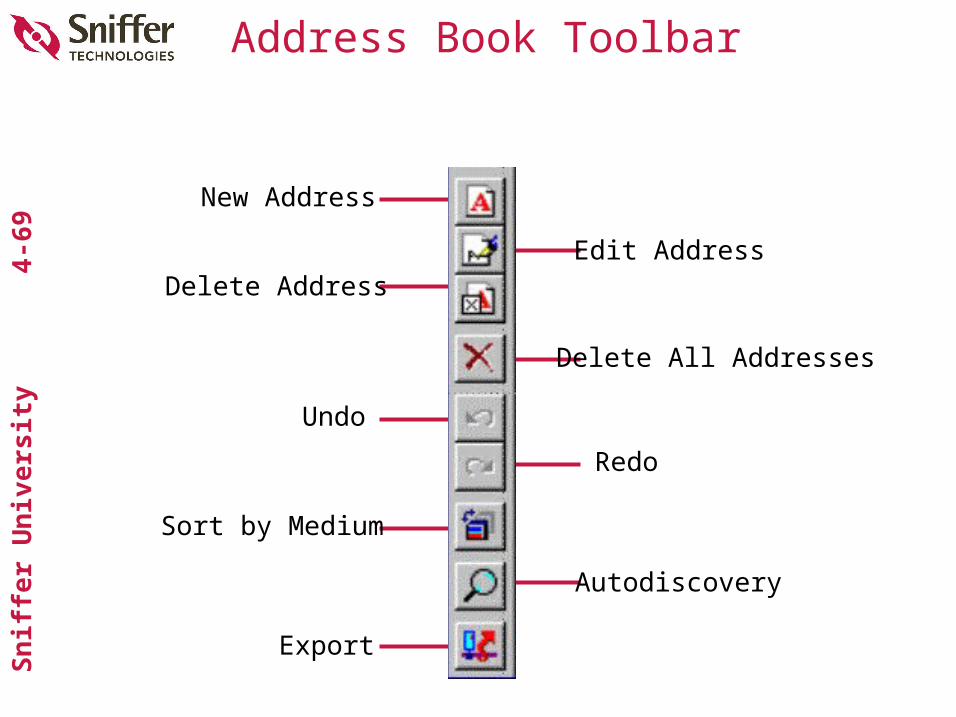
Address Book Toolbar
New Address
Sort by Medium
Export
Delete All Addresses
Autodiscovery
Delete Address
Undo
Edit Address
Redo
Sn
iffe
r U
niv
ersi
ty
4
-70
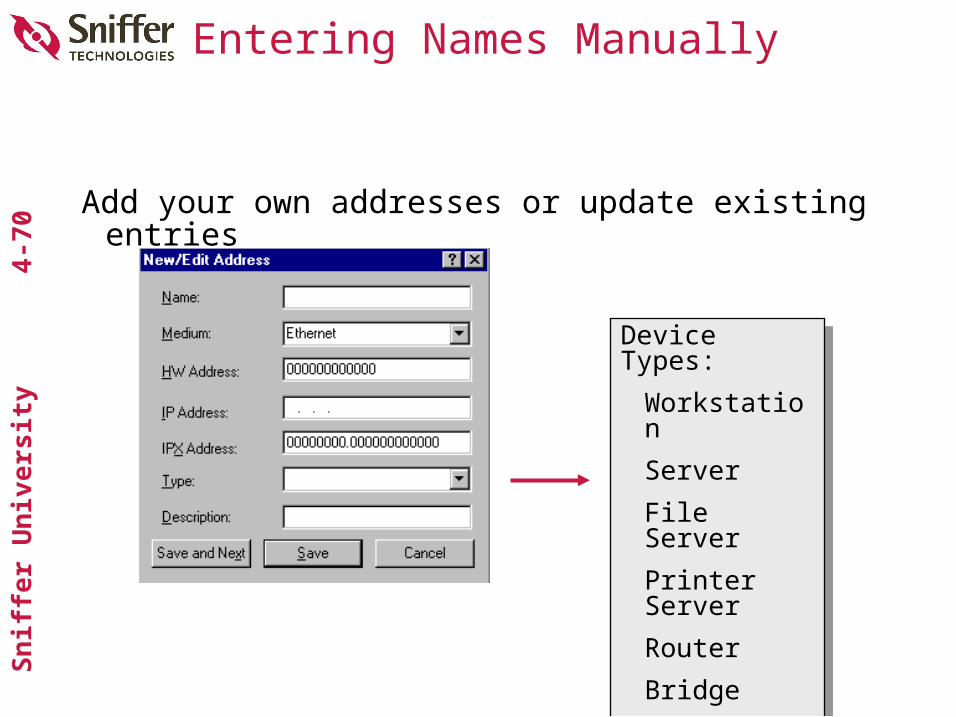
Entering Names Manually
Add your own addresses or update existing entries
Device Types:
Workstation
Server
File Server
Printer Server
Router
Bridge
Hub
Device Types:
Workstation
Server
File Server
Printer Server
Router
Bridge
Hub
Sn
iffe
r U
niv
ersi
ty
4
-71
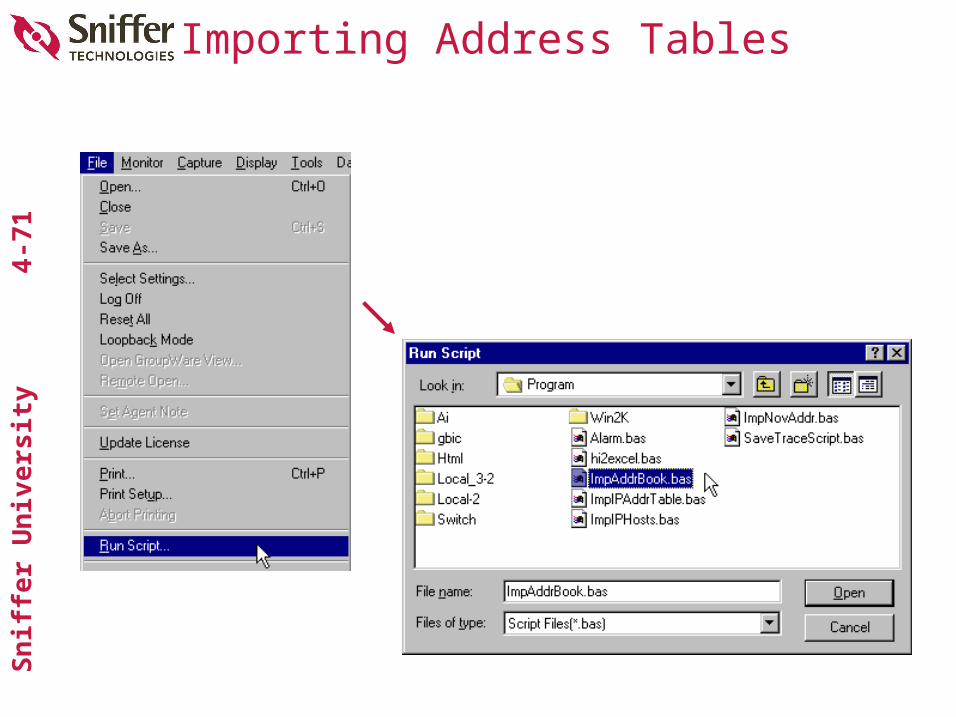
Importing Address Tables
Sn
iffe
r U
niv
ersi
ty
4
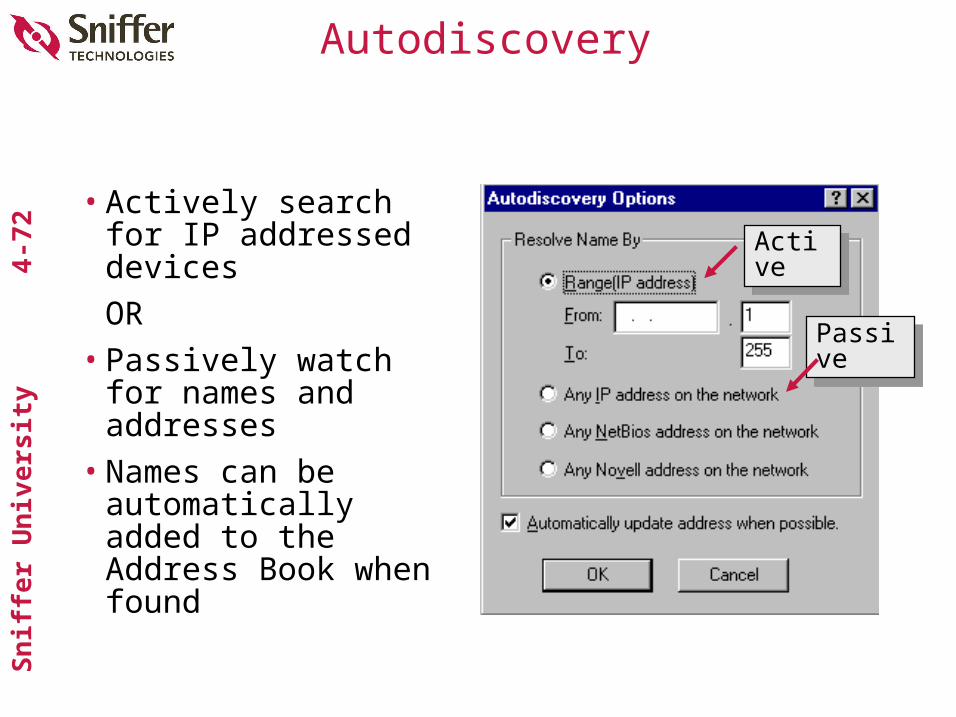
-72Autodiscovery
• Actively search for IP addressed devices
OR • Passively watch for
names and addresses
• Names can be automatically added to the Address Book when found
ActiveActive
PassivePassive
Sn
iffe
r U
niv
ersi
ty
4
-73
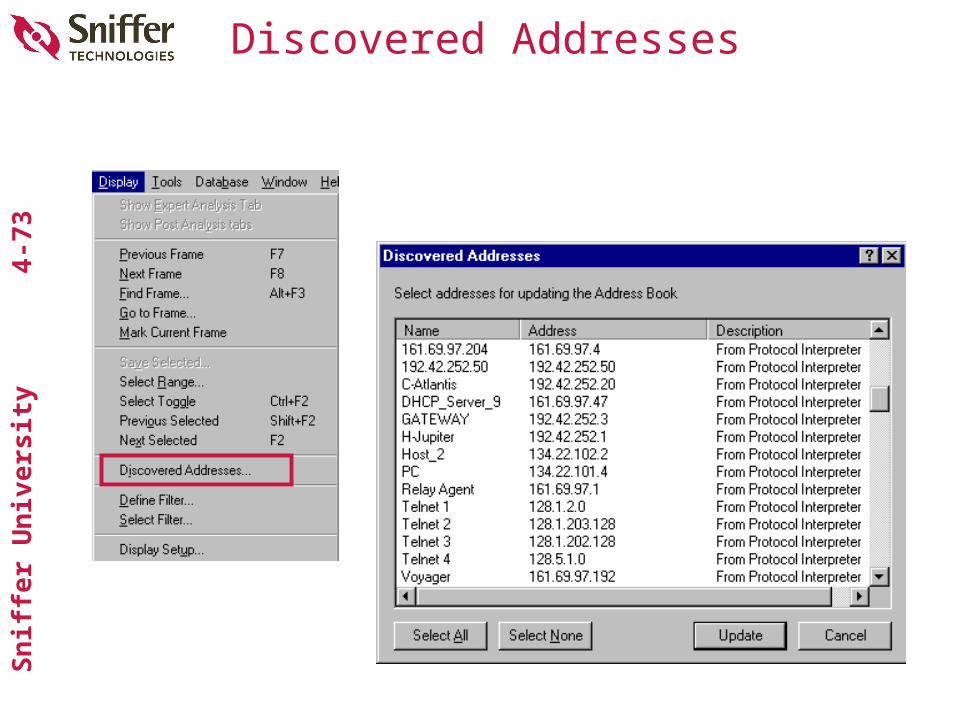
Discovered Addresses
Sn
iffe
r U
niv
ersi
ty
4
-74
Exercise 4-6
Managing Names
Sn
iffe
r U
niv
ersi
ty
4
-75
In this section, you learned how to use Sniffer Portable to:
Summary
•Use the Summary, Detail, and Hex views of the Decode window to examine frames for potential errors or activity of interest
•Find and select frames in the trace•Set display and capture filters•Work with Filtered (x) window•Use the Address Book•Use Sniffer Portable windows and
functions to do practical measurements
Sn
iffe
r U
niv
ersi
ty
4
-76
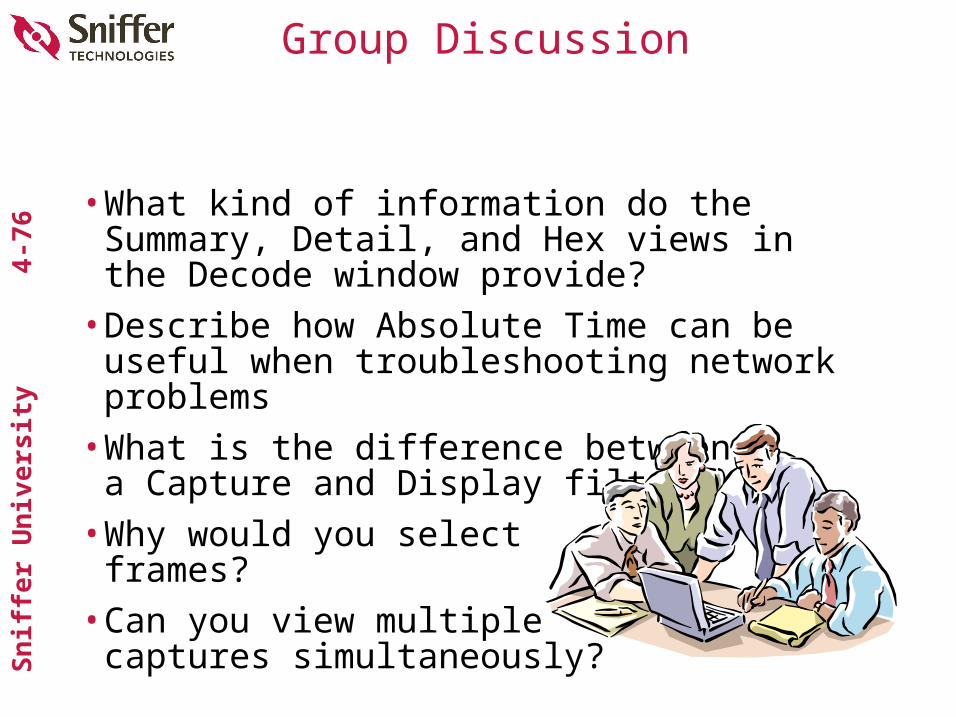
Group Discussion
•What kind of information do the Summary, Detail, and Hex views in the Decode window provide?
•Describe how Absolute Time can be useful when troubleshooting network problems
•What is the difference betweena Capture and Display filter?
•Why would you selectframes?
•Can you view multiplecaptures simultaneously?

Sn
iffe
r U
niv
ersi
ty
4
-77