sni report
TRANSCRIPT

Trey Thompson May 7, 2013 Scripps Networks Interactive, Inc. Summary
I rate shares of SNI a buy, with an aggressive
suitability. The 12-‐month target price for the stock is
$81.00 which implies a ~16% upside potential, along
with a modest 0.90% dividend yield. I believe that SNI
is well positioned to continue gaining market share
with its leading portfolio of lifestyle-‐oriented
networks. Additionally, the company’s strong balance
sheet will allow for continued timely investments and
acquisitions to expand its global footprint. Risks to
this rating include a decline in audience ratings for the
networks and the potential for slowing growth, which could cause the earnings multiple
applied to the stock to contract.
Company Description
Scripps Networks Interactive (SNI) is one of the leading developers of lifestyle-‐
oriented content for television and Internet. They have operations domestically, as well as
in the U.K., European Union, Middle East, Africa, and the Asia-‐Pacific regions. Revenue is
derived principally from advertising sales, affiliate fees, and ancillary sales, including
licensing of consumer products. Operating costs are primarily programming expenses,
BUY GICS Sector: Consumer Discretionary Sub-‐Industry: Broadcasting & Cable Key Statistics Ticker SNI Price (05/03/2013) $69.31 52-‐Week Range: $49-‐70 Shares Outstanding: 148.38 Market Cap*: 10.28 Beta: 1.06 Avg. Daily Volume* 0.822 Dividend/Yield: $0.60/0.90% Payout Ratio (ttm): 13.45% LT Debt*: $1.385 LT Debt/Equity: 0.76 12-‐Month Target Price: $81.00 3-‐5 Yr. Est. Growth Rate: 11% P/E 2013E EPS: 19.15x P/B (mrq): 5.45x ROE (ttm): 36.47% *All numbers in billions-‐ ex per share data

employee costs, and sales and marketing expenses. SNI became a publicly trade company
as the result of a separation from The E.W. Scripps Company on July 1, 2008.
SNI has two reporting segments: Lifestyle Media and Corporate & Other. The
Lifestyle Media segment includes National television networks, Food Network, Home and
Garden Television (HGTV), Travel Channel, DIY Network (DIY), Cooking Channel, and Great
American Country (GAC). This segment also includes websites and other media that are
associated with the aforementioned brands. The Corporate & Other operating segments
includes results from International brands including: Food Network UK, UKTV (50%
owned) and Canadian networks.
Subsidiary Breakdown: Scripps Networks, LLC Delaware Television Food Network, G.P. (69% owned) Delaware TCM Sub, LLC (65% owned) Delaware Travel Channel, LLC (65% owned) Delaware Scripps Networks International Limited (Travel Channel International)
England and Wales
Lightdragon Limited England and Wales
Source: Scripps Networks Interactive 2012 Annual Report
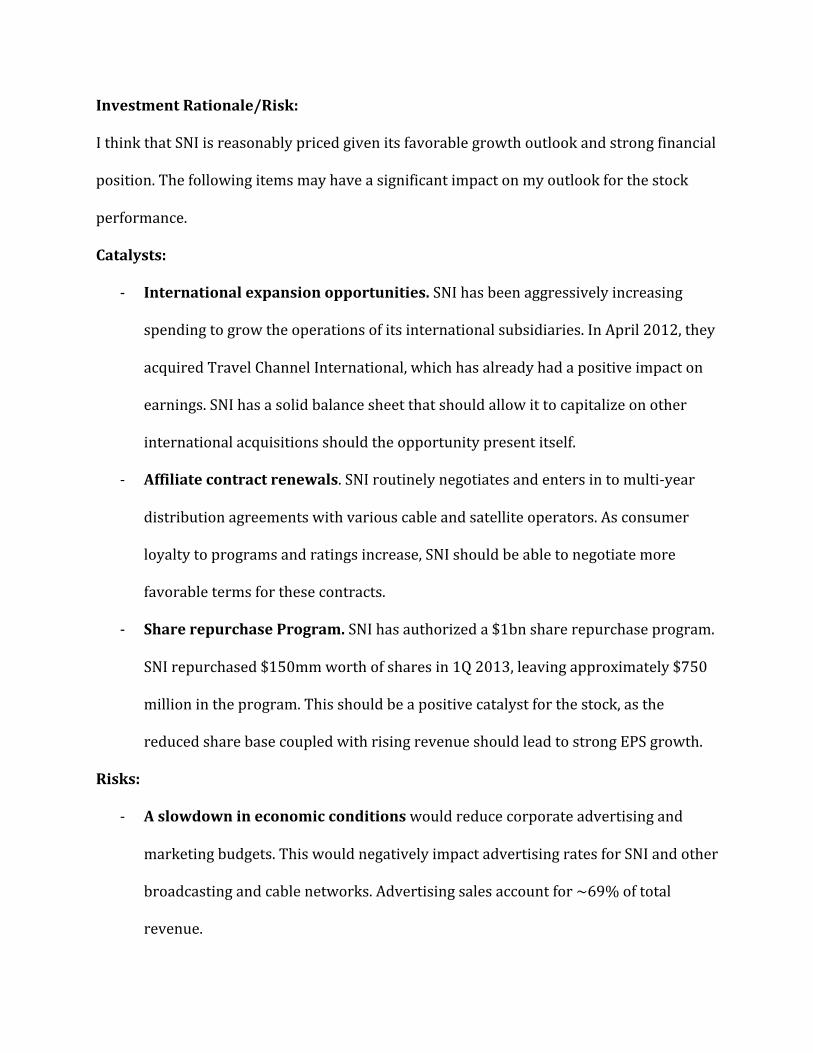
Investment Rationale/Risk:
I think that SNI is reasonably priced given its favorable growth outlook and strong financial
position. The following items may have a significant impact on my outlook for the stock
performance.
Catalysts:
-‐ International expansion opportunities. SNI has been aggressively increasing
spending to grow the operations of its international subsidiaries. In April 2012, they
acquired Travel Channel International, which has already had a positive impact on
earnings. SNI has a solid balance sheet that should allow it to capitalize on other
international acquisitions should the opportunity present itself.
-‐ Affiliate contract renewals. SNI routinely negotiates and enters in to multi-‐year
distribution agreements with various cable and satellite operators. As consumer
loyalty to programs and ratings increase, SNI should be able to negotiate more
favorable terms for these contracts.
-‐ Share repurchase Program. SNI has authorized a $1bn share repurchase program.
SNI repurchased $150mm worth of shares in 1Q 2013, leaving approximately $750
million in the program. This should be a positive catalyst for the stock, as the
reduced share base coupled with rising revenue should lead to strong EPS growth.
Risks:
-‐ A slowdown in economic conditions would reduce corporate advertising and
marketing budgets. This would negatively impact advertising rates for SNI and other
broadcasting and cable networks. Advertising sales account for ~69% of total
revenue.

-‐ Rating declines. Changes in consumer preferences and behavior occur frequently.
SNI must constantly adapt programming to fit these changing tastes and support
continued strong ratings. A failure to adapt to changing preferences could lead to
lower ratings, henceforth lower advertising sales and less favorable affiliate fees.
-‐ Negative performance of equity method investments. SNI has substantial
investments in companies that it accounts for using the equity method. Since SNI is
not responsible for the day-‐to-‐day operations of these companies, there
performance is largely out of management’s control.
Industry Position/Environment
The broadcasting and cable subsector has performed well over recent years after
recovering from the economic downturn. In 2012, the sector returned 44.7% versus 13.7%
for the S&P 1500. The industry is experiencing several challenges to their traditional
operating model, primarily; the introduction of video-‐on-‐demand (VOD) and other Internet
based media delivery systems. There have been many legal battles and media attention
drawn to this issue, but overall, the actual impact has been minimal. However, this issue is
not going away and there will likely be increased pressure on the industry to accept the
VOD concept.
Advertisement spending across the industry has been very strong in recent years
and is projected to continue. 1 This has been lead by the auto industry, a historical top
spender, which has finally recovered to pre-‐recession levels of spending. There continues
1 Source: S&P Capital IQ Industry Report
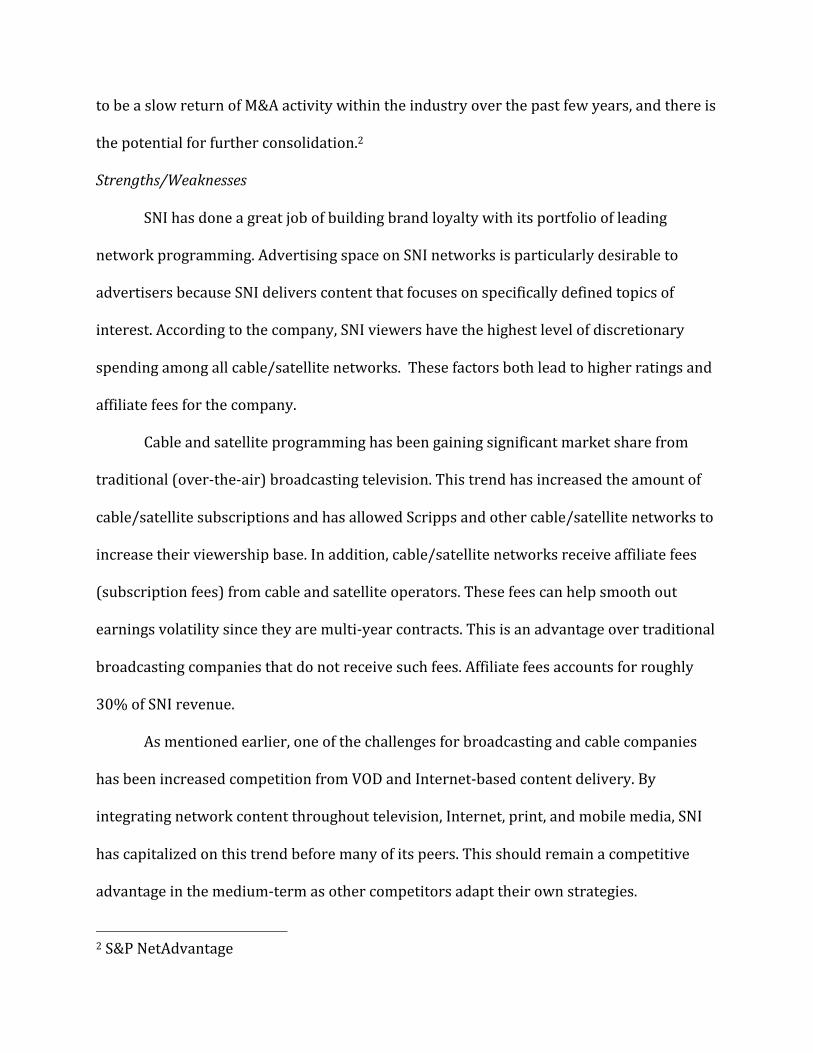
to be a slow return of M&A activity within the industry over the past few years, and there is
the potential for further consolidation.2
Strengths/Weaknesses
SNI has done a great job of building brand loyalty with its portfolio of leading
network programming. Advertising space on SNI networks is particularly desirable to
advertisers because SNI delivers content that focuses on specifically defined topics of
interest. According to the company, SNI viewers have the highest level of discretionary
spending among all cable/satellite networks. These factors both lead to higher ratings and
affiliate fees for the company.
Cable and satellite programming has been gaining significant market share from
traditional (over-‐the-‐air) broadcasting television. This trend has increased the amount of
cable/satellite subscriptions and has allowed Scripps and other cable/satellite networks to
increase their viewership base. In addition, cable/satellite networks receive affiliate fees
(subscription fees) from cable and satellite operators. These fees can help smooth out
earnings volatility since they are multi-‐year contracts. This is an advantage over traditional
broadcasting companies that do not receive such fees. Affiliate fees accounts for roughly
30% of SNI revenue.
As mentioned earlier, one of the challenges for broadcasting and cable companies
has been increased competition from VOD and Internet-‐based content delivery. By
integrating network content throughout television, Internet, print, and mobile media, SNI
has capitalized on this trend before many of its peers. This should remain a competitive
advantage in the medium-‐term as other competitors adapt their own strategies.
2 S&P NetAdvantage
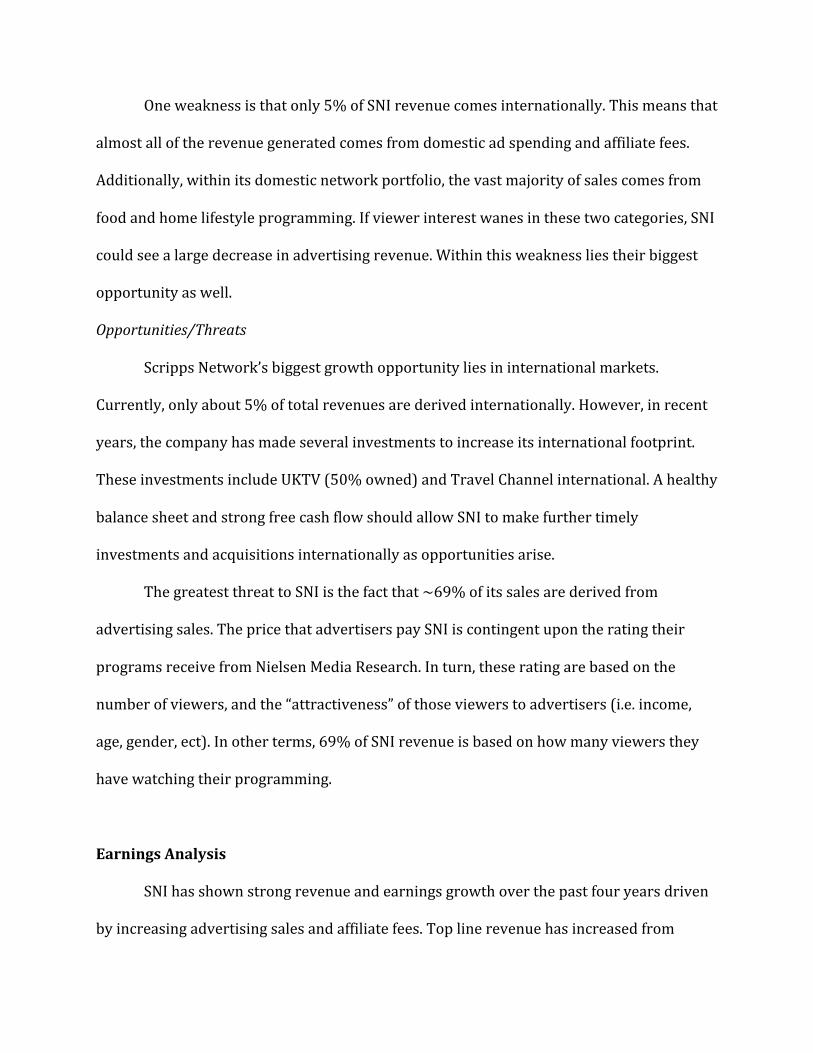
One weakness is that only 5% of SNI revenue comes internationally. This means that
almost all of the revenue generated comes from domestic ad spending and affiliate fees.
Additionally, within its domestic network portfolio, the vast majority of sales comes from
food and home lifestyle programming. If viewer interest wanes in these two categories, SNI
could see a large decrease in advertising revenue. Within this weakness lies their biggest
opportunity as well.
Opportunities/Threats
Scripps Network’s biggest growth opportunity lies in international markets.
Currently, only about 5% of total revenues are derived internationally. However, in recent
years, the company has made several investments to increase its international footprint.
These investments include UKTV (50% owned) and Travel Channel international. A healthy
balance sheet and strong free cash flow should allow SNI to make further timely
investments and acquisitions internationally as opportunities arise.
The greatest threat to SNI is the fact that ~69% of its sales are derived from
advertising sales. The price that advertisers pay SNI is contingent upon the rating their
programs receive from Nielsen Media Research. In turn, these rating are based on the
number of viewers, and the “attractiveness” of those viewers to advertisers (i.e. income,
age, gender, ect). In other terms, 69% of SNI revenue is based on how many viewers they
have watching their programming.
Earnings Analysis
SNI has shown strong revenue and earnings growth over the past four years driven
by increasing advertising sales and affiliate fees. Top line revenue has increased from

$1.3bn in 2008 to $2.3bn in 2012. Meanwhile, earnings have increased from $24mm in
2008 to $681mm last year, a 110% 4-‐year CAGR, reflecting efforts to reduce costs and
streamline operations.
Source: Scripps Networks Interactive 2012 Annual Report
SNI has been able to maintain gross margins in the low to mid 40% range, which is the best
in the industry. SNI also generates industry-‐leading return on equity (ROE), averaging in
the high 20% range over the past few years.
Source: S&P Capital IQ
3
In the food category, Food Network finished
the year ranked ninth among all ad-supported
cable networks, maintaining its command of
the genre. It was the most-watched year ever
for the network.
Contributing to the network’s positive audience
trends is the enduring popularity of programs
like Chopped, Iron Chef America, Restaurant:
Impossible and Food Network Star. The
network picked up tremendous audience gains
with breakout hits like Restaurant Stakeout
with New York restaurateur Willie Degel and
competition shows, including Rachael vs. Guy
and Worst Cooks in America with Anne Burrell.
And we’re pushing for even stronger
momentum in 2013.
This year at Food Network, we’re celebrating
20 years of defining a wildly popular television
genre and shaping the nation’s, and now the
world’s, conversation about food. There’s no
doubt that Food Network is an iconic power
brand and will be for decades to come.
We’re seeing continued success with our
flanker brands, DIY Network and Cooking
Channel. DIY Network finished the year on
a high note with record ratings and strong
growth in primetime audience, driven by The
Vanilla Ice Project, the new Bronson Pinchot
Project and the ever-popular Crashers series
— all favorites of our avid fan base of home
improvement enthusiasts. And at Cooking
Channel, viewership rose steeply with new
shows, such as Not My Mama’s Meals with
Bobby Deen and Symon’s Suppers with
Michael Symon, driving audience numbers.
FINANCIAL HIGHLIGHTS*
Q!Total Revenue"!
Q!Total Segment Profit
*Excludes discontinued operations for all periods presented.
Q!Segment Revenue"!
Q!Segment Profit
+15% 4-YEAR REVENUE CAGR
$1,315 $1,367
$1,883$2,072
$583 $571$835
$977
$2,307
$1,041
08 09 10 11 12
36% Food Network
34% HGTV
12% Travel Channel
10% DIY Network, Cooking Channel, GAC
5% Digital
3% International and Other
CONSOLIDATED REVENUE BY BRAND
CONSOLIDATED OPERATING RESULTS*
(Dollars in millions)
LIFESTYLE MEDIA
(Dollars in millions)
+15% 4-YEAR REVENUE CAGR
(Dollars in millions) 2012 2011 2010
CONSOLIDATED
Operating revenues $ 2,307 $ 2,072 $ 1,883
Income from continuing operations 681 473 398
LIFESTYLE MEDIA
Segment operating revenues $2,256 $ 2,045 $ 1,867
Segment profit 1,136 1,050 904
Segment profit margin 50% 51% 48%
*Excludes discontinued operations for all periods presented.
Segment profit is used by the company’s chief operating decision makers to evaluate its business segments. See page F-37 of the company’s Form 10-K.
$1,312 $1,367
$1,867$2,045
$632 $637$904
$1,050
$2,256
$1,136
08 09 10 11 12
-20
-10
0
10
20
30
40
36
38
40
42
44
46
48
Dec12 Dec11 Dec10 Dec09 Dec08 Dec07 Dec06 Gross Margin Return on Equity (%)
Gross Margin
ROE

For 1Q 2013, the most recently reported quarter, SNI reported EPS of $0.72 vs.
expectations of $0.74. The EPS miss was primarily due to unfavorable tax adjustments
totaling $7.8 million or $0.05 per share. Consolidated revenues of $594mm, were up 11%
from the same period last year. This was driven by an 11% increase in both advertising
sales and affiliate fees. SNI reported a very strong advertising market with Food, Retail,
and financial companies spending the most for the quarter. The robust increase in affiliate
fees was the result of a digital distribution deal with Amazon, Inc. This is a good example of
SNI capitalizing on new digital media trends.
SNI also announced they repurchased 2.4 million shares for $150 million during the
quarter, which leaves ~$750mm left in the current repurchase program. SNI generated
$268 million in cash from operating activities and reported cash reserves of $421mm.
One of the biggest positives, in my opinion, was the increase in revenues YoY for
smaller networks in the SNI portfolio. Most notably, the Cooking channel and Great
American Country (GAC) with 32.7% and 28.2% increases respectively. Although these
sizeable increases are coming from a relatively small base, it is nonetheless a step in the
right direction for SNI to grow the diversity of their revenue streams.
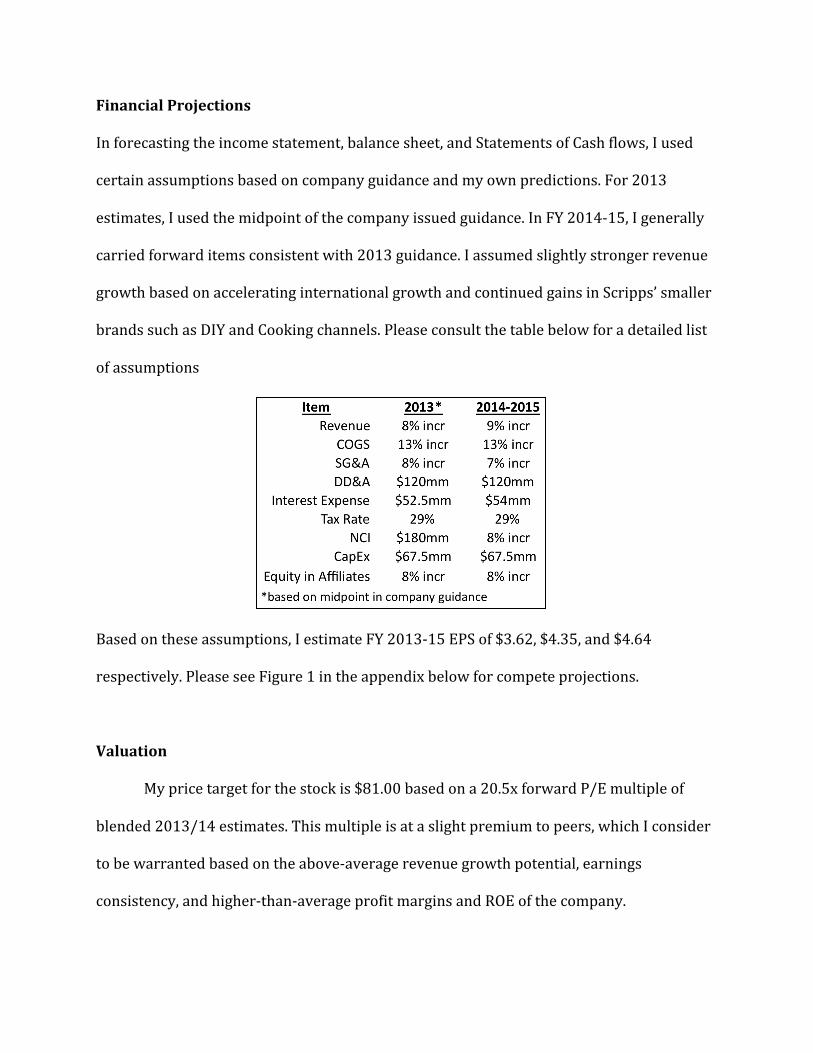
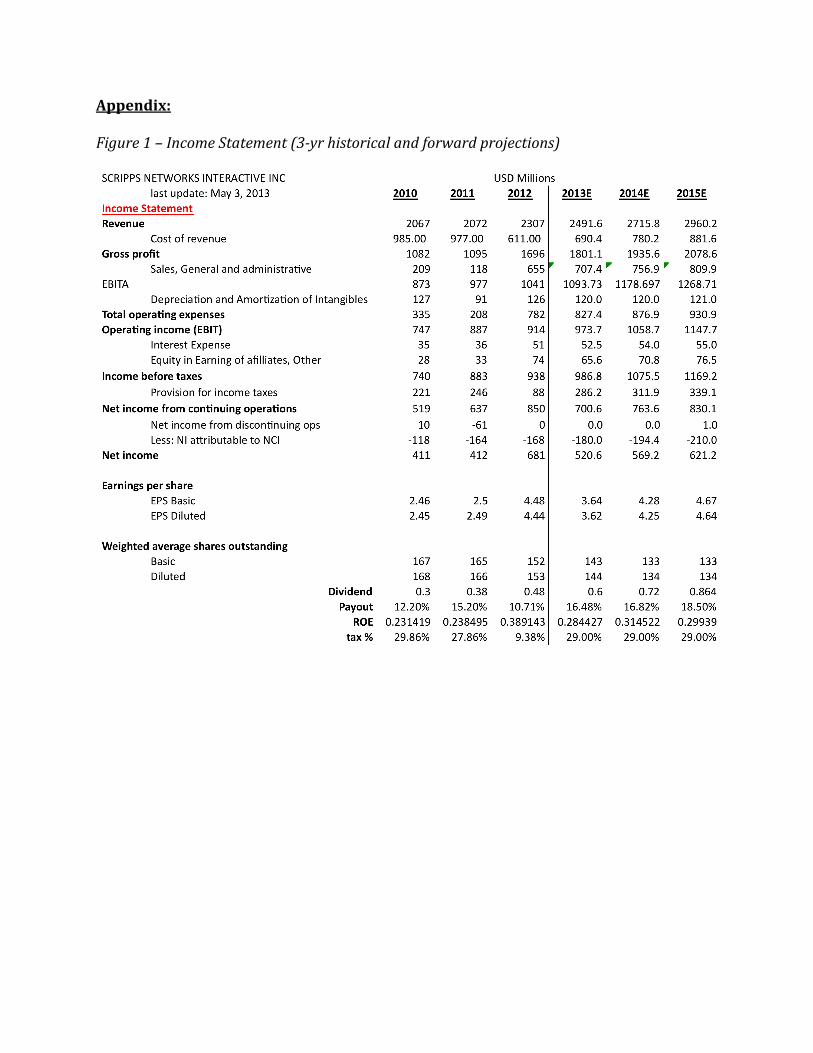
Financial Projections
In forecasting the income statement, balance sheet, and Statements of Cash flows, I used
certain assumptions based on company guidance and my own predictions. For 2013
estimates, I used the midpoint of the company issued guidance. In FY 2014-‐15, I generally
carried forward items consistent with 2013 guidance. I assumed slightly stronger revenue
growth based on accelerating international growth and continued gains in Scripps’ smaller
brands such as DIY and Cooking channels. Please consult the table below for a detailed list
of assumptions
Based on these assumptions, I estimate FY 2013-‐15 EPS of $3.62, $4.35, and $4.64
respectively. Please see Figure 1 in the appendix below for compete projections.
Valuation
My price target for the stock is $81.00 based on a 20.5x forward P/E multiple of
blended 2013/14 estimates. This multiple is at a slight premium to peers, which I consider
to be warranted based on the above-‐average revenue growth potential, earnings
consistency, and higher-‐than-‐average profit margins and ROE of the company.

In deriving the 20.5x P/E multiple, I first divided the peer group in two, and selected
stocks that traded at P/E multiples above the median of 17.5x forward 2013/14 blended
estimates. Then, I averaged the P/E of these companies to come up with what amounts to
an ‘average premium multiple’. Please note that I excluded the NFLX from the premium
multiple as the P/E was well over 100x and distorted the average.
I view this as a relatively conservative estimate since I believe that SNI is the best
company within the cable and broadcasting subsector. I choose to value the company using
relative valuation mainly because growth rates far exceeded the cost of capital for the
foreseeable future. This makes it difficult to come up with an accurate terminal value for
the DDM and DCF.
Appendix:
Figure 1 – Income Statement (3-yr historical and forward projections)
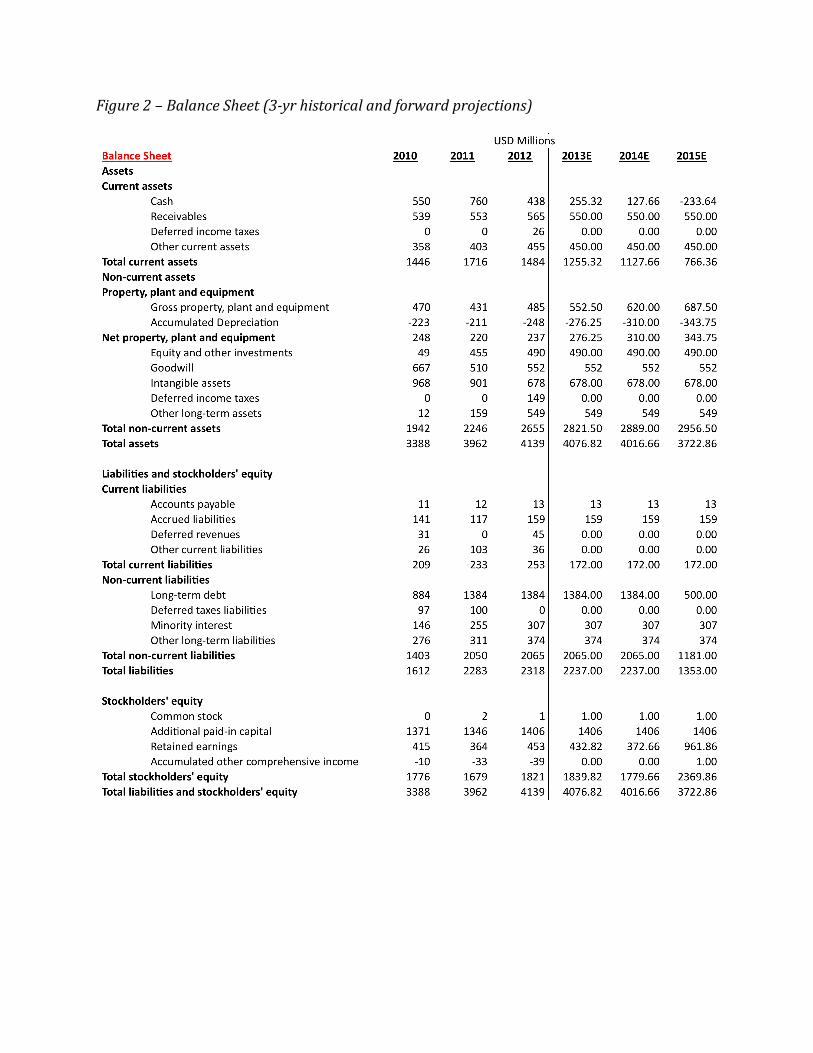
Figure 2 – Balance Sheet (3-yr historical and forward projections)
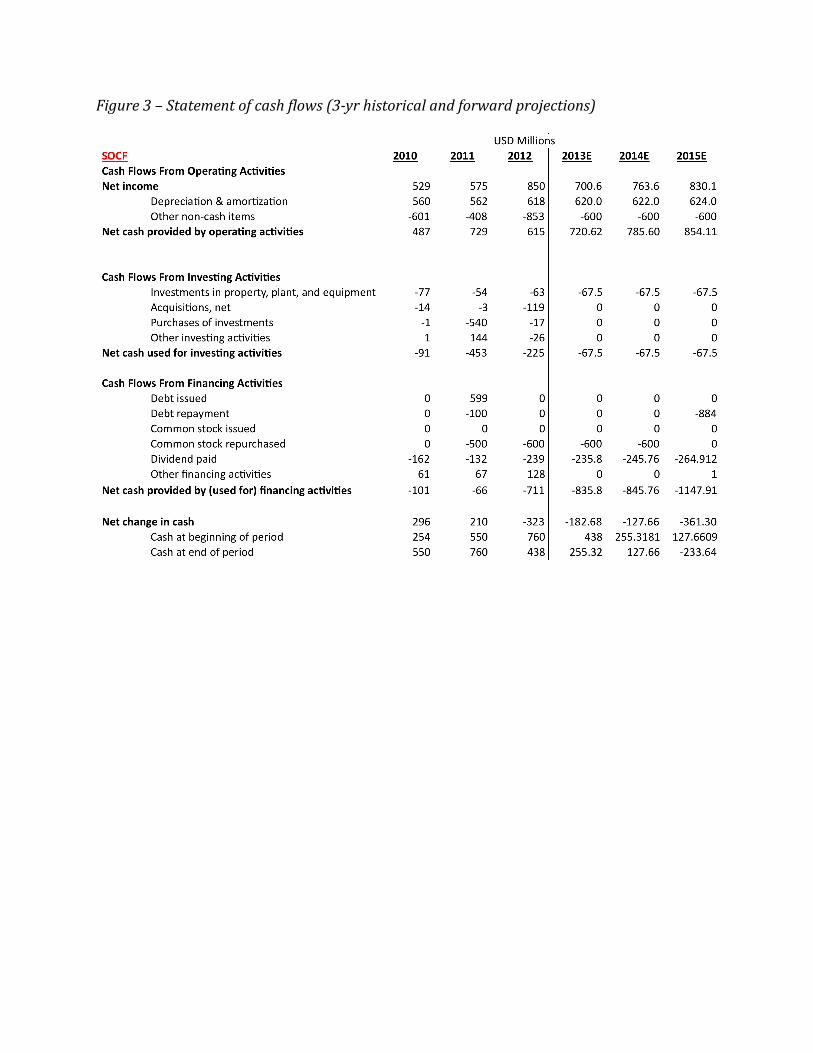
Figure 3 – Statement of cash flows (3-yr historical and forward projections)

Figure 4: Comparative common-sized Income Statements

Figure 5: Comparative Analysis
