snh commissioned report 542: raptors in scotland – a ... · simon foster, scottish natural...
TRANSCRIPT
Scottish Natural Heritage Commissioned Report No. 542
Raptors in Scotland – a methodology fordeveloping trends and indicators

C O M M I S S I O N E D R E P O R T
Commissioned Report No. 542
Raptors in Scotland – a methodology for
developing trends and indicators
For further information on this report please contact:
Simon Foster Scottish Natural Heritage Great Glen House INVERNESS IV3 8NW Telephone: 01463 725282 E-mail: [email protected]
This report should be quoted as: Roos, S., Dobson, A., Noble, D., Haworth, P., Fielding, A., Carrington-Cotton, A., Etheridge, B. & Wernham, C. 2015. Raptors in Scotland – a methodology for developing trends and indicators. Scottish Natural Heritage Commissioned Report No. 542.
This report, or any part of it, should not be reproduced without the permission of Scottish Natural Heritage. This permission will not be withheld unreasonably. The views expressed by the author(s) of this report should not be taken as the views and policies of Scottish Natural Heritage.
© Scottish Natural Heritage 2015.
i
Raptors in Scotland – a methodology for developing trends and indicators
Commissioned Report No. 542 Contractor: BTO Scotland Year of publication: 2015 Keywords
Raptors; breeding; Natural Heritage Zone; trends; monitoring. Background
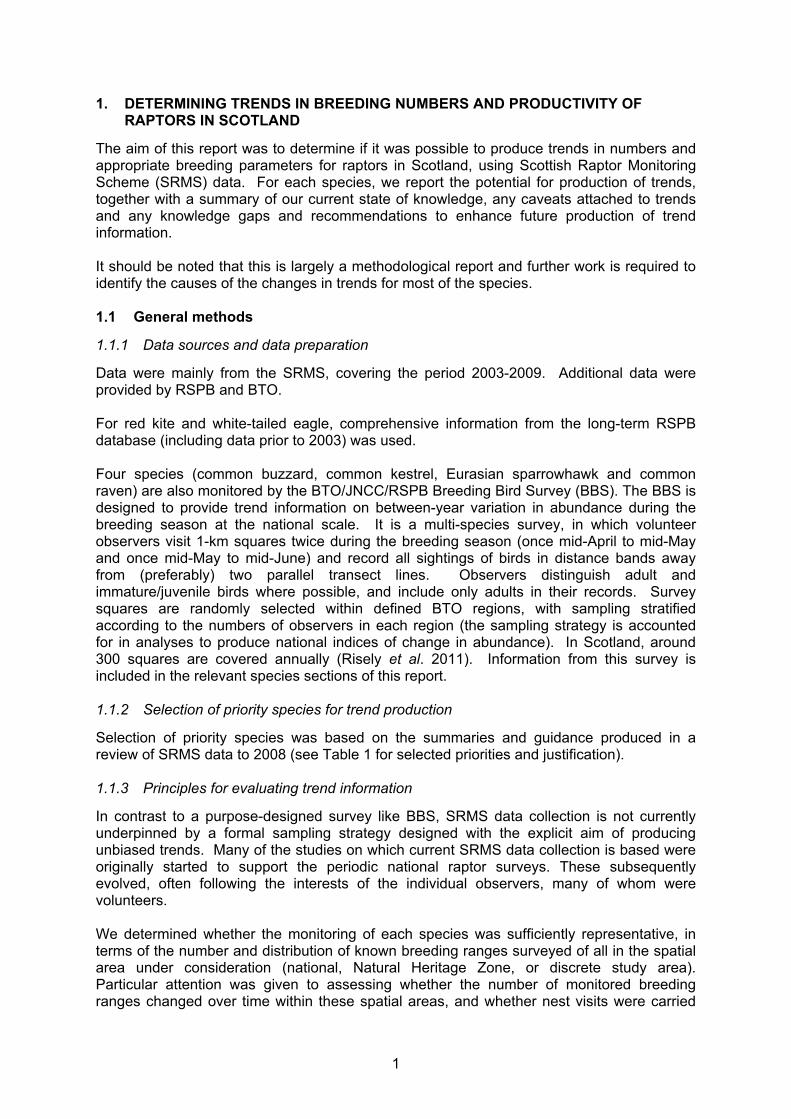
Published statistics on trends in raptor populations in Scotland currently use data from three national bird atlases, State of the UK Birds assessments, national BTO/JNCC/RSPB Breeding Bird Surveys (BBS) and species surveys undertaken through SCARABBS (Statutory Conservation Agencies and RSPB Breeding Bird Survey). This report considers the prospects for producing more detailed Scotland-wide and regional trends for breeding raptors. The report focuses on assessments of the suitability of data and methods for producing trends at a range of spatial scales, from area based - e.g. Natural Heritage Zones - to the whole of Scotland, and for breeding numbers and appropriate breeding parameters - e.g. proportion of pairs fledging young or the number of young fledged. The report meets three objectives: (i) produce and report trends in breeding numbers and productivity for the raptor species in Scotland at a range of spatial scales; (ii) evaluate the suitability of the existing schemes that are in place which may contribute to the monitoring of raptors (particularly EC Birds Directive Annex 1 species); and (iii) scope methods for producing a robust indicator or indicators of Scottish raptor populations, with the most appropriate indicator(s) dependent on end-user requirements. The report draws largely on data collected under the auspices of the Scottish Raptor Monitoring Scheme (SRMS). This was established in 2002 to improve partnership working between organisations involved in raptor monitoring in Scotland. It has eight partners, is chaired by SNH, and currently focuses on the annual monitoring of the abundance, distribution and breeding success of diurnal birds of prey and owls native to Scotland. The data are primarily from the SRMS for the period 2003-2009, supplemented by other sources where appropriate. Main findings
Estimates of trends in numbers and/or breeding productivity, at least at the scale of individual study areas, can be calculated for 13 species of breeding raptors in Scotland.
The most appropriate parameter for measuring breeding success for raptors, from the available data, is the number of fledglings produced per successful pair.
COMMISSIONED REPORT
Summary

ii
Data were sufficient to produce national, Natural Heritage Zone and area trends in breeding numbers and breeding productivity for two species – red kite and white-tailed eagle. Both show steady increases in breeding numbers since they were re-introduced.
For seven species with substantial annual monitoring coverage across Scotland (hen harrier, northern goshawk, common buzzard, golden eagle, merlin, peregrine falcon and barn owl), provisional area based trends in breeding numbers were produced. For these species, there is high potential to produce rigorous area-based trends in breeding success, and potentially also full national (Scottish) trends, in both breeding numbers and breeding success.
For four other species (Eurasian sparrowhawk, common kestrel, tawny owl and common raven), partial trend information is available from study areas or from the BBS. However, this is not considered sufficient to report rigorous national trends, without further validation work or additional data collection.
A further four species (European honey buzzard, black kite, Eurasian marsh harrier and Eurasian hobby) are too rare as breeding birds in Scotland to enable their trends to be calculated.
Finally, for long-eared owls and short-eared owls, there is currently insufficient annual monitoring coverage to generate trends.
Recommended enhancements to information collection under the SRMS include: submission of six-figure grid references for all breeding ranges; routine collection of information on survey coverage/effort, visit dates, and nest contents at each visit; and improved (on-line) software for standardized data entry.
Given the data available, we cannot produce a national indicator for breeding raptors in Scotland. Once representative national trends are available for a broader suite of Scottish raptors, however, a national indicator of breeding raptor numbers is feasible, and should be considered further.
For further information on this project contact: Simon Foster, Scottish Natural Heritage, Great Glen House, Inverness, IV3 8NW.
Tel: 01463 725282 or [email protected] For further information on the SNH Research & Technical Support Programme contact:
Knowledge & Information Unit, Scottish Natural Heritage, Great Glen House, Inverness, IV3 8NW. Tel: 01463 725000 or research @snh.gov.uk

iii
Table of Contents Page
1. DETERMINING TRENDS IN BREEDING NUMBERS AND PRODUCTIVITY OF RAPTORS IN SCOTLAND 1 1.1 General methods 1 1.1.1 Data sources and data preparation 1 1.1.2 Selection of priority species for trend production 1 1.1.3 Principles for evaluating trend information 1 1.2 Trends in numbers of breeding pairs: general principles 2 1.3 Trends in breeding productivity: general principles 2 1.3.1 Selection of spatial scales 2 1.3.2 Selection of trends to model for each species 5 1.3.3 Trends modelling 5 1.3.4 Reporting and interpretation of trend information and caveats 5 1.4 Species accounts 6 1.4.1 Red kite 11 1.4.2 White-tailed eagle 22 1.4.3 Hen harrier 36 1.4.4 Northern goshawk 43 1.4.5 Eurasian sparrowhawk 52 1.4.6 Common buzzard 59 1.4.7 Golden eagle 67 1.4.8 Common kestrel 74 1.4.9 Merlin 82 1.4.10 Peregrine falcon 87 1.4.11 Barn owl 96 1.4.12 Tawny owl 103 1.4.13 Common raven 110 1.5 Raptor trends: discussion and future directions 112 1.5.1 Extent of available trend information from annual monitoring efforts 112 1.5.2 Parameters for which trends from SRMS data are feasible 112 1.5.3 Current SRMS data collation and recommendations 113 1.5.4 Current gaps in SRMS data collection and overall recommendations 114 1.5.5 Expansion of coverage and future survey design considerations 115
2. DATASETS AVAILABLE TO CONTRIBUTE TO SCOTTISH RAPTOR MONITORING 125 2.1 Background 125 2.2 Surveillance of changes in breeding numbers 125 2.3 Surveillance of changes in breeding parameters 126
3. INDICATORS OF SCOTTISH RAPTOR POPULATIONS 129 3.1 Background and aims 129 3.2 Considerations specific to raptors in Scotland 129 3.2.1 Choice of geographical scale 129 3.2.2 Selection of habitat(s) 130 3.2.3 Drivers of change 131 3.2.4 Suitability of demographic parameters for inclusion 131 3.2.5 Statistical decisions 133 3.3 Conclusions 133
4. REFERENCES 135
ANNEX A: BBS MAPS 140
ANNEX B: SUPPORTING TABLES 144

iv
ANNEX C: AN EMPIRICAL TEST OF MONITORING EFFORT FOR GOLDEN EAGLES 195
ANNEX D: FURTHER BACKGROUND INFORMATION ON INDICATORS 199

v
Acknowledgements We thank all of the members of the Scottish Raptor Monitoring Scheme for providing information on raptors throughout Scotland. We are grateful to Will George (RSPB Data Unit) for red kite and white-tailed eagle data for this project. Innes Sim and Yvonne Boles (RSPB) provided further information on the monitoring protocols for these species. We thank Arjun Amar (RSPB and currently Percy FitzPatrick Institute of African Ornithology) and Dave Leech, Simon Gillings and Ali Johnston (BTO) for fruitful discussions regarding raptor monitoring and analytical approaches. We thank SRSG members Malcolm Henderson, Mick Marquiss, Ciril Ostroznik, Gordon Riddle, Chris Rollie and Ian Todd for additional information. We thank all those raptor workers who have contributed data to the Scottish Raptor Monitoring Scheme since 2003. We are grateful to Des Thompson, Andrew Stevenson and Simon Foster (SNH) for funding the project and for comments on previous drafts of the report. Finally, we thank RSPB for allowing Staffan Roos to finalise the project report, and all members of the SRMG for their support in planning and delivering this research.
1
1. DETERMINING TRENDS IN BREEDING NUMBERS AND PRODUCTIVITY OF RAPTORS IN SCOTLAND
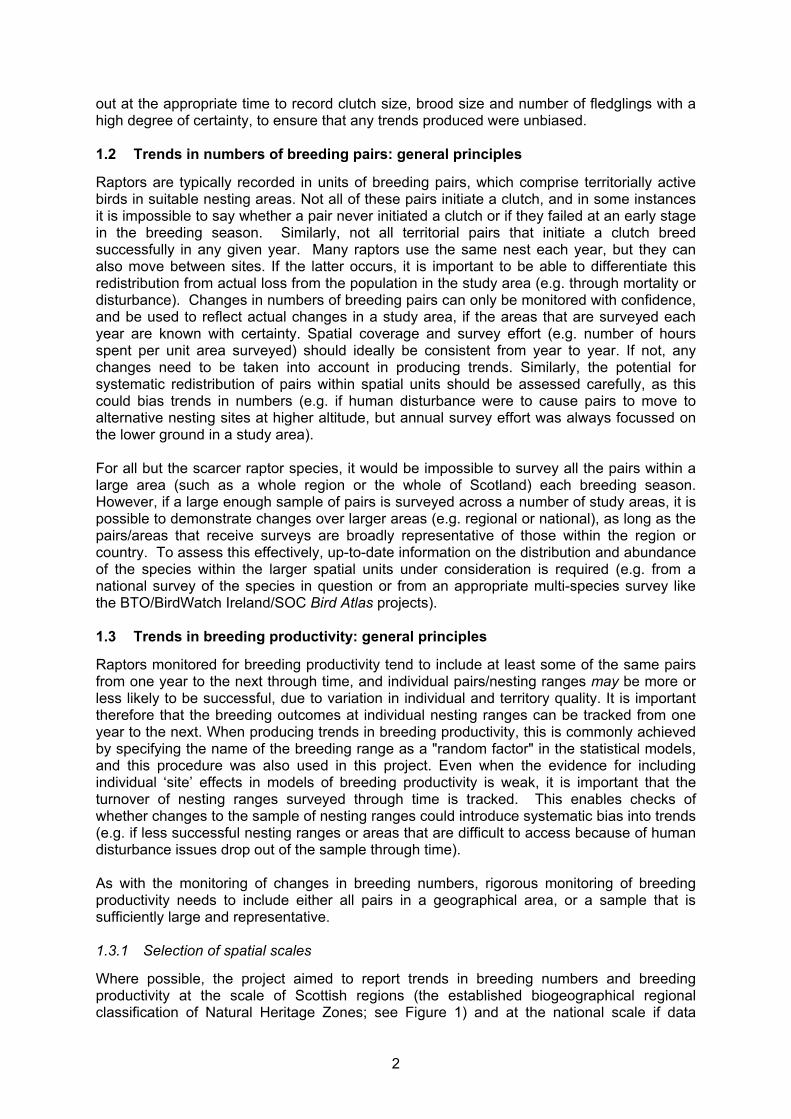
The aim of this report was to determine if it was possible to produce trends in numbers and appropriate breeding parameters for raptors in Scotland, using Scottish Raptor Monitoring Scheme (SRMS) data. For each species, we report the potential for production of trends, together with a summary of our current state of knowledge, any caveats attached to trends and any knowledge gaps and recommendations to enhance future production of trend information. It should be noted that this is largely a methodological report and further work is required to identify the causes of the changes in trends for most of the species. 1.1 General methods
1.1.1 Data sources and data preparation
Data were mainly from the SRMS, covering the period 2003-2009. Additional data were provided by RSPB and BTO. For red kite and white-tailed eagle, comprehensive information from the long-term RSPB database (including data prior to 2003) was used. Four species (common buzzard, common kestrel, Eurasian sparrowhawk and common raven) are also monitored by the BTO/JNCC/RSPB Breeding Bird Survey (BBS). The BBS is designed to provide trend information on between-year variation in abundance during the breeding season at the national scale. It is a multi-species survey, in which volunteer observers visit 1-km squares twice during the breeding season (once mid-April to mid-May and once mid-May to mid-June) and record all sightings of birds in distance bands away from (preferably) two parallel transect lines. Observers distinguish adult and immature/juvenile birds where possible, and include only adults in their records. Survey squares are randomly selected within defined BTO regions, with sampling stratified according to the numbers of observers in each region (the sampling strategy is accounted for in analyses to produce national indices of change in abundance). In Scotland, around 300 squares are covered annually (Risely et al. 2011). Information from this survey is included in the relevant species sections of this report. 1.1.2 Selection of priority species for trend production
Selection of priority species was based on the summaries and guidance produced in a review of SRMS data to 2008 (see Table 1 for selected priorities and justification). 1.1.3 Principles for evaluating trend information
In contrast to a purpose-designed survey like BBS, SRMS data collection is not currently underpinned by a formal sampling strategy designed with the explicit aim of producing unbiased trends. Many of the studies on which current SRMS data collection is based were originally started to support the periodic national raptor surveys. These subsequently evolved, often following the interests of the individual observers, many of whom were volunteers. We determined whether the monitoring of each species was sufficiently representative, in terms of the number and distribution of known breeding ranges surveyed of all in the spatial area under consideration (national, Natural Heritage Zone, or discrete study area). Particular attention was given to assessing whether the number of monitored breeding ranges changed over time within these spatial areas, and whether nest visits were carried
2
out at the appropriate time to record clutch size, brood size and number of fledglings with a high degree of certainty, to ensure that any trends produced were unbiased. 1.2 Trends in numbers of breeding pairs: general principles
Raptors are typically recorded in units of breeding pairs, which comprise territorially active birds in suitable nesting areas. Not all of these pairs initiate a clutch, and in some instances it is impossible to say whether a pair never initiated a clutch or if they failed at an early stage in the breeding season. Similarly, not all territorial pairs that initiate a clutch breed successfully in any given year. Many raptors use the same nest each year, but they can also move between sites. If the latter occurs, it is important to be able to differentiate this redistribution from actual loss from the population in the study area (e.g. through mortality or disturbance). Changes in numbers of breeding pairs can only be monitored with confidence, and be used to reflect actual changes in a study area, if the areas that are surveyed each year are known with certainty. Spatial coverage and survey effort (e.g. number of hours spent per unit area surveyed) should ideally be consistent from year to year. If not, any changes need to be taken into account in producing trends. Similarly, the potential for systematic redistribution of pairs within spatial units should be assessed carefully, as this could bias trends in numbers (e.g. if human disturbance were to cause pairs to move to alternative nesting sites at higher altitude, but annual survey effort was always focussed on the lower ground in a study area). For all but the scarcer raptor species, it would be impossible to survey all the pairs within a large area (such as a whole region or the whole of Scotland) each breeding season. However, if a large enough sample of pairs is surveyed across a number of study areas, it is possible to demonstrate changes over larger areas (e.g. regional or national), as long as the pairs/areas that receive surveys are broadly representative of those within the region or country. To assess this effectively, up-to-date information on the distribution and abundance of the species within the larger spatial units under consideration is required (e.g. from a national survey of the species in question or from an appropriate multi-species survey like the BTO/BirdWatch Ireland/SOC Bird Atlas projects).
1.3 Trends in breeding productivity: general principles
Raptors monitored for breeding productivity tend to include at least some of the same pairs from one year to the next through time, and individual pairs/nesting ranges may be more or less likely to be successful, due to variation in individual and territory quality. It is important therefore that the breeding outcomes at individual nesting ranges can be tracked from one year to the next. When producing trends in breeding productivity, this is commonly achieved by specifying the name of the breeding range as a "random factor" in the statistical models, and this procedure was also used in this project. Even when the evidence for including individual ‘site’ effects in models of breeding productivity is weak, it is important that the turnover of nesting ranges surveyed through time is tracked. This enables checks of whether changes to the sample of nesting ranges could introduce systematic bias into trends (e.g. if less successful nesting ranges or areas that are difficult to access because of human disturbance issues drop out of the sample through time). As with the monitoring of changes in breeding numbers, rigorous monitoring of breeding productivity needs to include either all pairs in a geographical area, or a sample that is sufficiently large and representative. 1.3.1 Selection of spatial scales
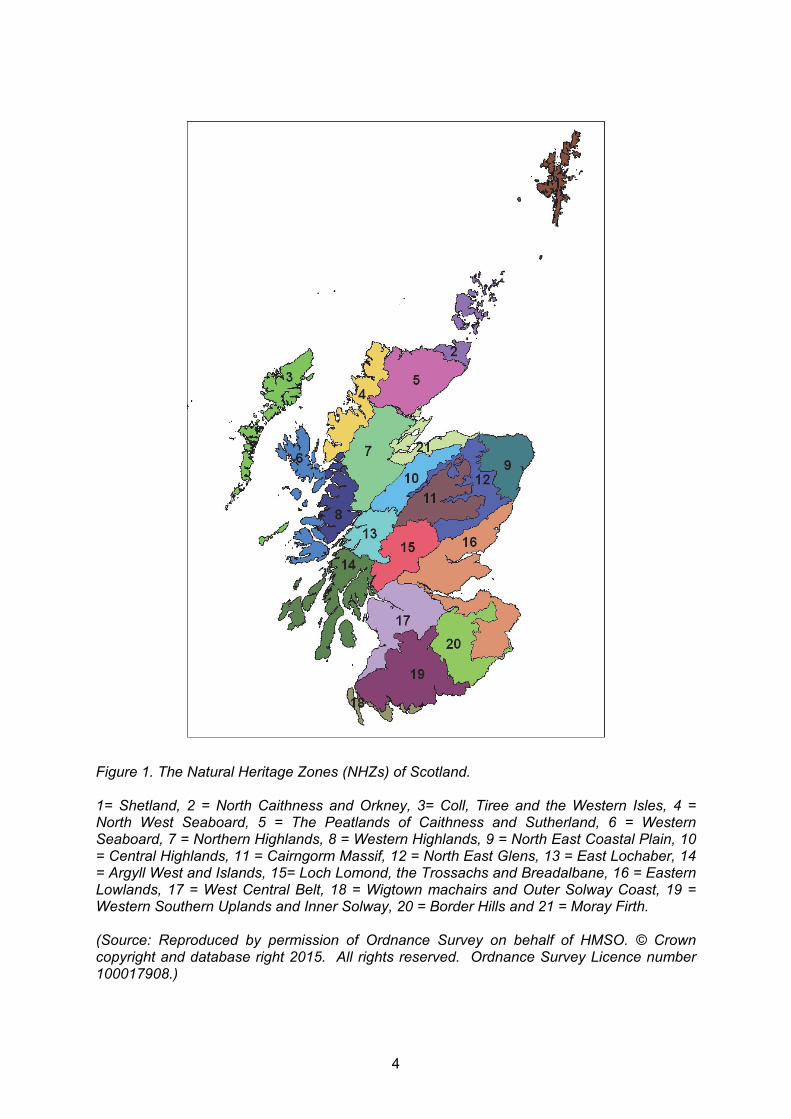
Where possible, the project aimed to report trends in breeding numbers and breeding productivity at the scale of Scottish regions (the established biogeographical regional classification of Natural Heritage Zones; see Figure 1) and at the national scale if data
3
allowed. Where survey coverage was not representative of whole NHZs, trends for smaller study areas with consistent coverage were reported, noting the NHZ(s) in which they lie. To select appropriate spatial scales for analysis, for each species we compared the annual distribution of survey effort with best current knowledge of the overall distribution of the species across Scotland and in each NHZ. The latter was obtained from the most recent national survey if such a comprehensive survey has been carried out (e.g. golden eagle and peregrine falcon). For other species, distribution information from the last published UK Bird Atlas survey (1988-91; Gibbons et al. 1993) was used. For red kite, for which there have been four spatially separated geographical areas of re-introduction, trends are presented for the largely discrete sub-populations and for relevant NHZs. We produced national trends in numbers and breeding productivity for those species that have received annual monitoring of a high proportion of the Scottish population to date (red kite and white-tailed eagle). In future it should also be possible to produce national trend information for other species that receive wide coverage under the SRMS and for which current knowledge of overall distribution and spatial variation in abundance across Scotland is considered good (e.g. peregrine falcon, golden eagle, hen harrier and merlin; noted in the individual species accounts). Some records contained in the database lacked full grid references. We were able to fill some of these for hen harrier, golden eagle and merlin by matching SRMS records with databases prepared for the hen harrier and golden eagle Conservation Framework projects (Whitfield et al. 2008, Fielding et al. 2011), and a recent SNH-funded project on merlins in Scotland (Fielding & Haworth 2011).
4
Figure 1. The Natural Heritage Zones (NHZs) of Scotland. 1= Shetland, 2 = North Caithness and Orkney, 3= Coll, Tiree and the Western Isles, 4 = North West Seaboard, 5 = The Peatlands of Caithness and Sutherland, 6 = Western Seaboard, 7 = Northern Highlands, 8 = Western Highlands, 9 = North East Coastal Plain, 10 = Central Highlands, 11 = Cairngorm Massif, 12 = North East Glens, 13 = East Lochaber, 14 = Argyll West and Islands, 15= Loch Lomond, the Trossachs and Breadalbane, 16 = Eastern Lowlands, 17 = West Central Belt, 18 = Wigtown machairs and Outer Solway Coast, 19 = Western Southern Uplands and Inner Solway, 20 = Border Hills and 21 = Moray Firth. (Source: Reproduced by permission of Ordnance Survey on behalf of HMSO. © Crown copyright and database right 2015. All rights reserved. Ordnance Survey Licence number 100017908.)
5
1.3.2 Selection of trends to model for each species
Species were selected for trends modelling based on a sample of at least 10 nesting ranges/nest sites in the selected geographical unit for which coverage and effort could be assumed to be approximately constant during the span of years considered. For each species, the selection of breeding parameters for which to produce trends involved consideration of the field methods used to collect the data and any potential biases caused by either selection of study areas, selection of samples of nests to monitor through to fledging, or selective submission of data to the SRMS. We modelled trends in laying, hatching and fledging success, number of eggs laid (by pairs that are known to have laid eggs), brood size at hatching (for pairs known to hatch young) and number of fledged young (for pairs that fledged at least one young) for spatial areas with a sample of at least 10 nests for the parameter of interest, if we were confident that the sample was sufficiently representative of the spatial unit. For species for which it can be difficult to record the exact number of fledged young once they have left the nest, we routinely included minimum estimates in the trends (e.g. in cases where the number fledged was recorded as 1+, 2+, 3+ and so on, the minimum number fledged was used in analyses). 1.3.3 Trends modelling
Trends in the numbers of breeding pairs from SRMS and RSPB data were based on raw counts and therefore did not require formal statistical modelling and do not have associated confidence limits. For the best available trends presented here, we have used raw counts so that annual breeding numbers from the various study areas and samples sizes available are clear. National trends in relative abundance from BBS data use the standard BBS analytical methods (see Risely et al. 2011; Baillie et al. 2012). All statistical analyses of trends from SRMS and RSPB data were carried out using Generalised Linear Mixed Models in PROC GLIMMIX in SAS 9.2 (SAS Institute Inc. 2008). Trends in the numbers of eggs laid (by pairs that are known to have laid eggs), young hatched (by pairs known to hatch young) and young fledged (by pairs that fledged at least one young) were modelled using a Poisson error distribution with a logit link. Note that these parameters all exclude pairs that did not lay, hatch or fledge young respectively, for the reasons given in Section 1.1.5. In the few cases where we considered it useful to estimate trends in whether or not pairs laid, hatched or fledged young, these were modelled using a binomial error term with a log link. In all analyses of breeding parameters, the unique nest site name (or nest site code for some species) was included in models as a random factor. For trends in individual breeding parameters, we used a general rule of thumb and attempted to model trends for any discrete region/study area with a minimum of 10 records per year for the parameter of interest. A few such sequences were interrupted by one or two years with lower sample sizes, but unless the model failed to converge we included these. 1.3.4 Reporting and interpretation of trend information and caveats
Wherever possible, we presented national, regional (NHZ) and/or study area specific trends for each species. For those species for which the majority of the Scottish breeding population is monitored each year (red kite and white-tailed eagle), these trends can be regarded as definitive. For most other species however, the trends should be regarded as the best currently available. Particularly with respect to trends in breeding numbers, there is an outstanding need to verify the extent to which coverage and effort in study areas has been consistent from one year to the next (See Section 1.3.3 and Table 3).

6
In each species account we give our best current assessment of the extent to which trends are representative of specific NHZs or the national population of each species. For some species for which substantial portions of the SRMS records are not linked to grid references, we could not complete this assessment. Assessment was not possible for species that lacked up-to-date information on distribution across Scotland for which we expect that distribution and spatial variation in relative abundance may have altered substantially since the last Bird Atlas project in 1988-91 (Gibbons et al. 1993). For these species, further assessment will be possible once the results of Bird Atlas 2007-11 are available. All trends are reported as annual estimates with 95% confidence limits unless otherwise stated. 1.4 Species accounts
In this section we provide the best available trends in breeding numbers and breeding parameters for the 13 raptor species covered in this project (see Table 1 for rationale for selection of species). We provide a summary of the information on which trends are based, any caveats to trends or work pending, and we highlight any significant gaps in knowledge. Note that because of potential variation in field and reporting methodologies by individual raptor workers, it is valid to derive trend information for individual studies or NHZs, but absolute values of breeding parameters should not be compared directly between study areas or NHZs.
7
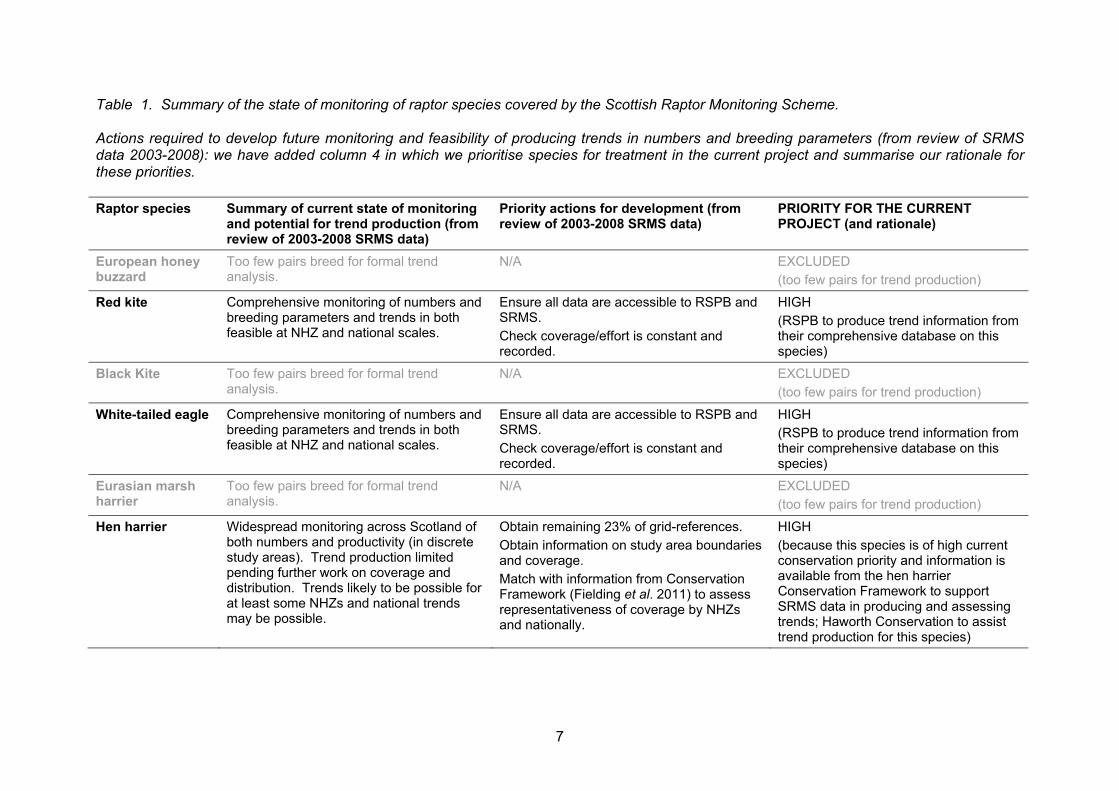
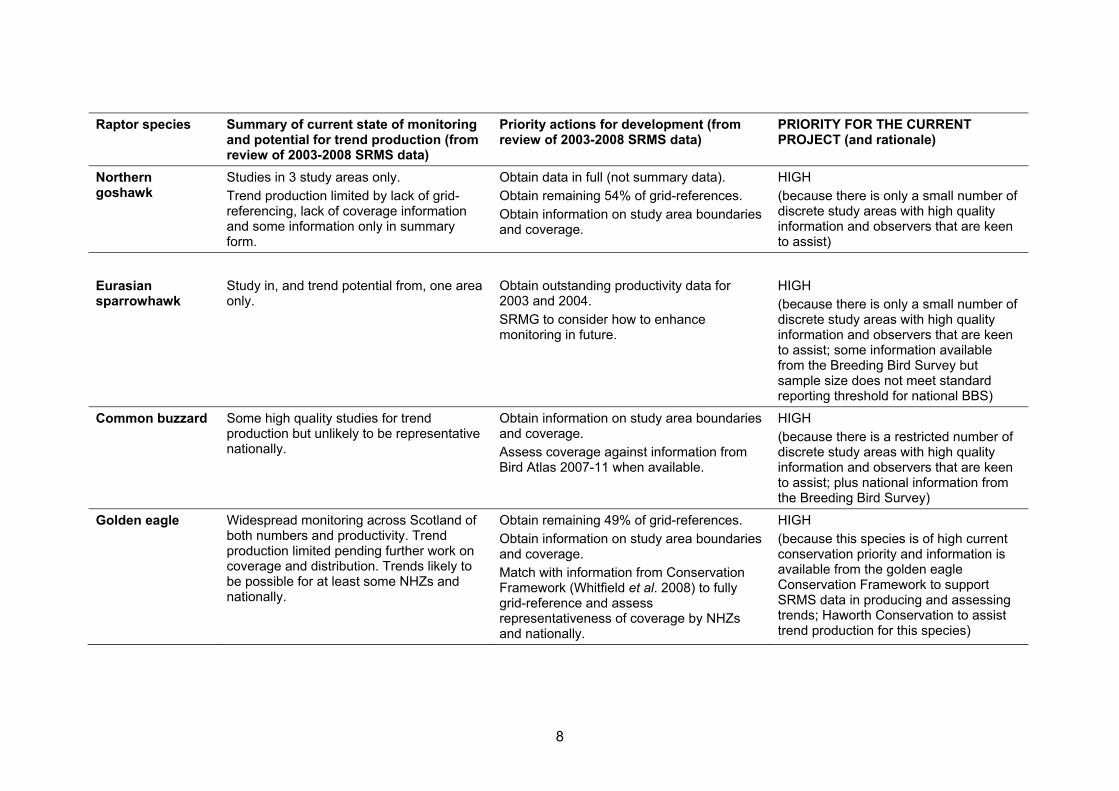
Table 1. Summary of the state of monitoring of raptor species covered by the Scottish Raptor Monitoring Scheme. Actions required to develop future monitoring and feasibility of producing trends in numbers and breeding parameters (from review of SRMS data 2003-2008): we have added column 4 in which we prioritise species for treatment in the current project and summarise our rationale for these priorities. Raptor species Summary of current state of monitoring
and potential for trend production (from review of 2003-2008 SRMS data)
Priority actions for development (from review of 2003-2008 SRMS data)
PRIORITY FOR THE CURRENT PROJECT (and rationale)
European honey buzzard
Too few pairs breed for formal trend analysis.
N/A EXCLUDED (too few pairs for trend production)
Red kite
Comprehensive monitoring of numbers and breeding parameters and trends in both feasible at NHZ and national scales.
Ensure all data are accessible to RSPB and SRMS. Check coverage/effort is constant and recorded.
HIGH (RSPB to produce trend information from their comprehensive database on this species)
Black Kite
Too few pairs breed for formal trend analysis.
N/A EXCLUDED (too few pairs for trend production)
White-tailed eagle
Comprehensive monitoring of numbers and breeding parameters and trends in both feasible at NHZ and national scales.
Ensure all data are accessible to RSPB and SRMS. Check coverage/effort is constant and recorded.
HIGH (RSPB to produce trend information from their comprehensive database on this species)
Eurasian marsh harrier
Too few pairs breed for formal trend analysis.
N/A EXCLUDED (too few pairs for trend production)
Hen harrier
Widespread monitoring across Scotland of both numbers and productivity (in discrete study areas). Trend production limited pending further work on coverage and distribution. Trends likely to be possible for at least some NHZs and national trends may be possible.
Obtain remaining 23% of grid-references. Obtain information on study area boundaries and coverage. Match with information from Conservation Framework (Fielding et al. 2011) to assess representativeness of coverage by NHZs and nationally.
HIGH (because this species is of high current conservation priority and information is available from the hen harrier Conservation Framework to support SRMS data in producing and assessing trends; Haworth Conservation to assist trend production for this species)
8
Raptor species Summary of current state of monitoring
and potential for trend production (from review of 2003-2008 SRMS data)
Priority actions for development (from review of 2003-2008 SRMS data)
PRIORITY FOR THE CURRENT PROJECT (and rationale)
Northern goshawk
Studies in 3 study areas only. Trend production limited by lack of grid-referencing, lack of coverage information and some information only in summary form.
Obtain data in full (not summary data). Obtain remaining 54% of grid-references. Obtain information on study area boundaries and coverage.
HIGH (because there is only a small number of discrete study areas with high quality information and observers that are keen to assist)
Eurasian sparrowhawk
Study in, and trend potential from, one area only.
Obtain outstanding productivity data for 2003 and 2004. SRMG to consider how to enhance monitoring in future.
HIGH (because there is only a small number of discrete study areas with high quality information and observers that are keen to assist; some information available from the Breeding Bird Survey but sample size does not meet standard reporting threshold for national BBS)
Common buzzard
Some high quality studies for trend production but unlikely to be representative nationally.
Obtain information on study area boundaries and coverage. Assess coverage against information from Bird Atlas 2007-11 when available.
HIGH (because there is a restricted number of discrete study areas with high quality information and observers that are keen to assist; plus national information from the Breeding Bird Survey)
Golden eagle
Widespread monitoring across Scotland of both numbers and productivity. Trend production limited pending further work on coverage and distribution. Trends likely to be possible for at least some NHZs and nationally.
Obtain remaining 49% of grid-references. Obtain information on study area boundaries and coverage. Match with information from Conservation Framework (Whitfield et al. 2008) to fully grid-reference and assess representativeness of coverage by NHZs and nationally.
HIGH (because this species is of high current conservation priority and information is available from the golden eagle Conservation Framework to support SRMS data in producing and assessing trends; Haworth Conservation to assist trend production for this species)
9
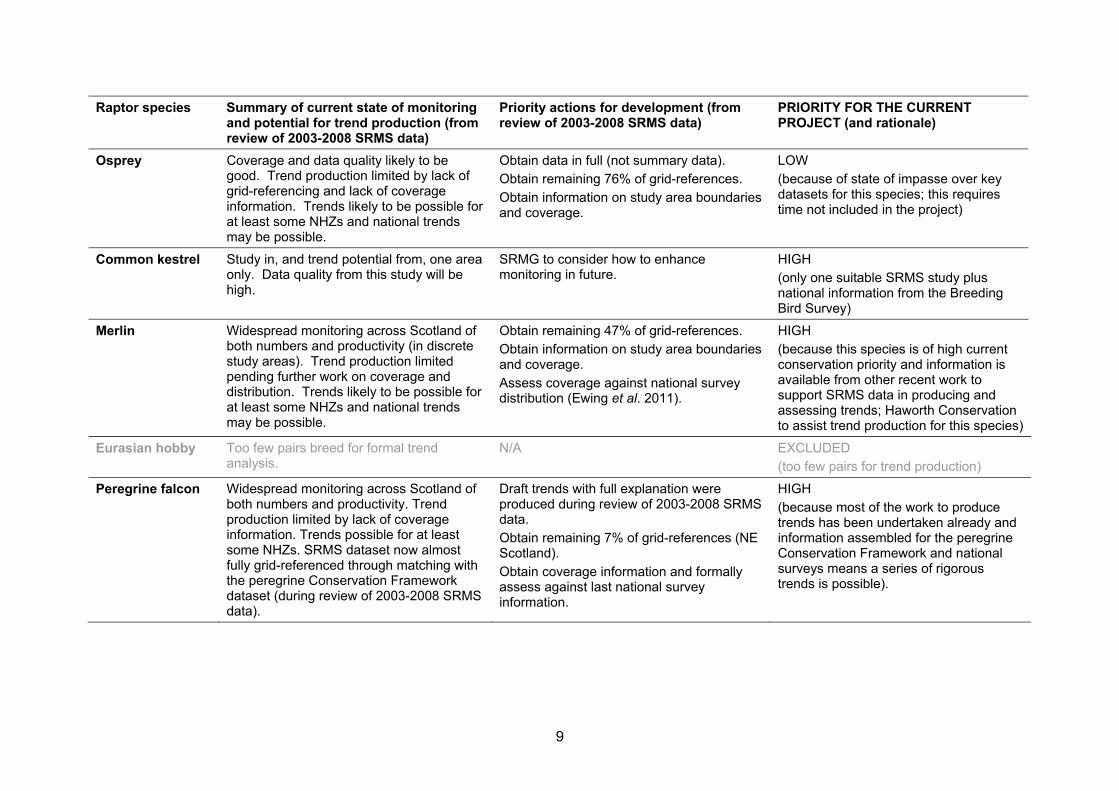
Raptor species Summary of current state of monitoring and potential for trend production (from review of 2003-2008 SRMS data)
Priority actions for development (from review of 2003-2008 SRMS data)
PRIORITY FOR THE CURRENT PROJECT (and rationale)
Osprey
Coverage and data quality likely to be good. Trend production limited by lack of grid-referencing and lack of coverage information. Trends likely to be possible for at least some NHZs and national trends may be possible.
Obtain data in full (not summary data). Obtain remaining 76% of grid-references. Obtain information on study area boundaries and coverage.
LOW (because of state of impasse over key datasets for this species; this requires time not included in the project)
Common kestrel
Study in, and trend potential from, one area only. Data quality from this study will be high.
SRMG to consider how to enhance monitoring in future.
HIGH (only one suitable SRMS study plus national information from the Breeding Bird Survey)
Merlin
Widespread monitoring across Scotland of both numbers and productivity (in discrete study areas). Trend production limited pending further work on coverage and distribution. Trends likely to be possible for at least some NHZs and national trends may be possible.
Obtain remaining 47% of grid-references. Obtain information on study area boundaries and coverage. Assess coverage against national survey distribution (Ewing et al. 2011).
HIGH (because this species is of high current conservation priority and information is available from other recent work to support SRMS data in producing and assessing trends; Haworth Conservation to assist trend production for this species)
Eurasian hobby
Too few pairs breed for formal trend analysis.
N/A EXCLUDED (too few pairs for trend production)
Peregrine falcon Widespread monitoring across Scotland of both numbers and productivity. Trend production limited by lack of coverage information. Trends possible for at least some NHZs. SRMS dataset now almost fully grid-referenced through matching with the peregrine Conservation Framework dataset (during review of 2003-2008 SRMS data).
Draft trends with full explanation were produced during review of 2003-2008 SRMS data. Obtain remaining 7% of grid-references (NE Scotland). Obtain coverage information and formally assess against last national survey information.
HIGH (because most of the work to produce trends has been undertaken already and information assembled for the peregrine Conservation Framework and national surveys means a series of rigorous trends is possible).
10
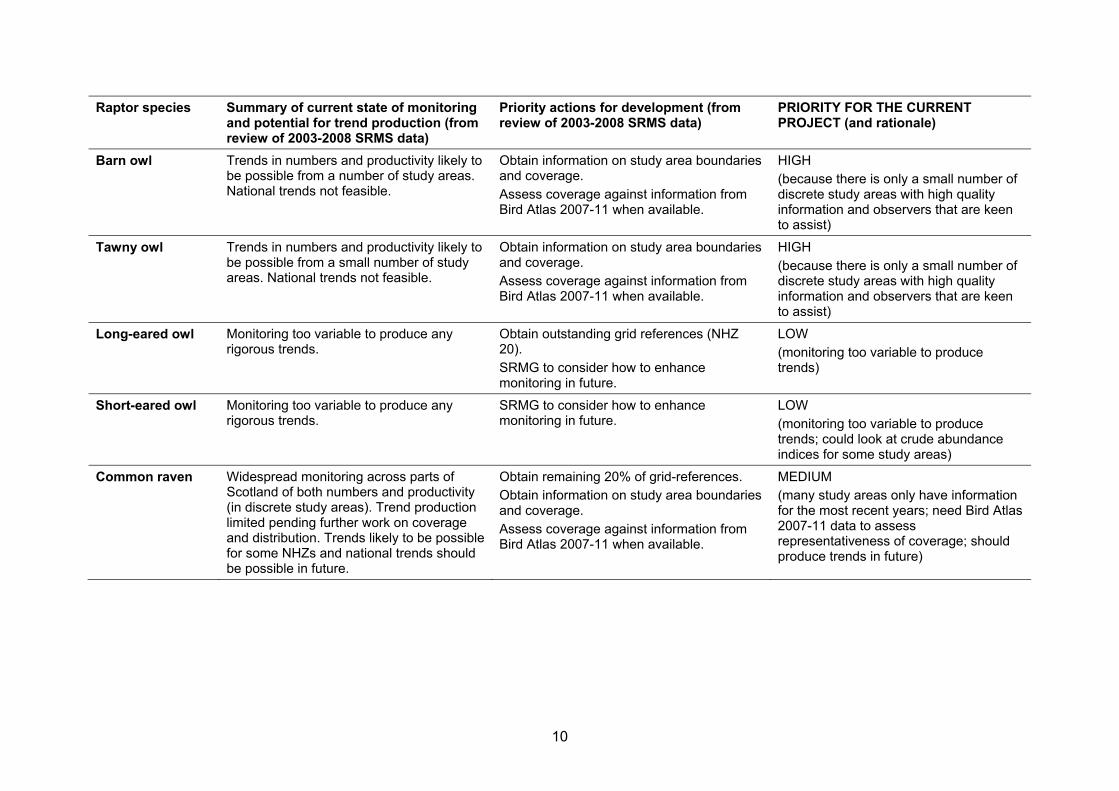
Raptor species Summary of current state of monitoring and potential for trend production (from review of 2003-2008 SRMS data)
Priority actions for development (from review of 2003-2008 SRMS data)
PRIORITY FOR THE CURRENT PROJECT (and rationale)
Barn owl
Trends in numbers and productivity likely to be possible from a number of study areas. National trends not feasible.
Obtain information on study area boundaries and coverage. Assess coverage against information from Bird Atlas 2007-11 when available.
HIGH (because there is only a small number of discrete study areas with high quality information and observers that are keen to assist)
Tawny owl
Trends in numbers and productivity likely to be possible from a small number of study areas. National trends not feasible.
Obtain information on study area boundaries and coverage. Assess coverage against information from Bird Atlas 2007-11 when available.
HIGH (because there is only a small number of discrete study areas with high quality information and observers that are keen to assist)
Long-eared owl
Monitoring too variable to produce any rigorous trends.
Obtain outstanding grid references (NHZ 20). SRMG to consider how to enhance monitoring in future.
LOW (monitoring too variable to produce trends)
Short-eared owl
Monitoring too variable to produce any rigorous trends.
SRMG to consider how to enhance monitoring in future.
LOW (monitoring too variable to produce trends; could look at crude abundance indices for some study areas)
Common raven
Widespread monitoring across parts of Scotland of both numbers and productivity (in discrete study areas). Trend production limited pending further work on coverage and distribution. Trends likely to be possible for some NHZs and national trends should be possible in future.
Obtain remaining 20% of grid-references. Obtain information on study area boundaries and coverage. Assess coverage against information from Bird Atlas 2007-11 when available.
MEDIUM (many study areas only have information for the most recent years; need Bird Atlas 2007-11 data to assess representativeness of coverage; should produce trends in future)
11
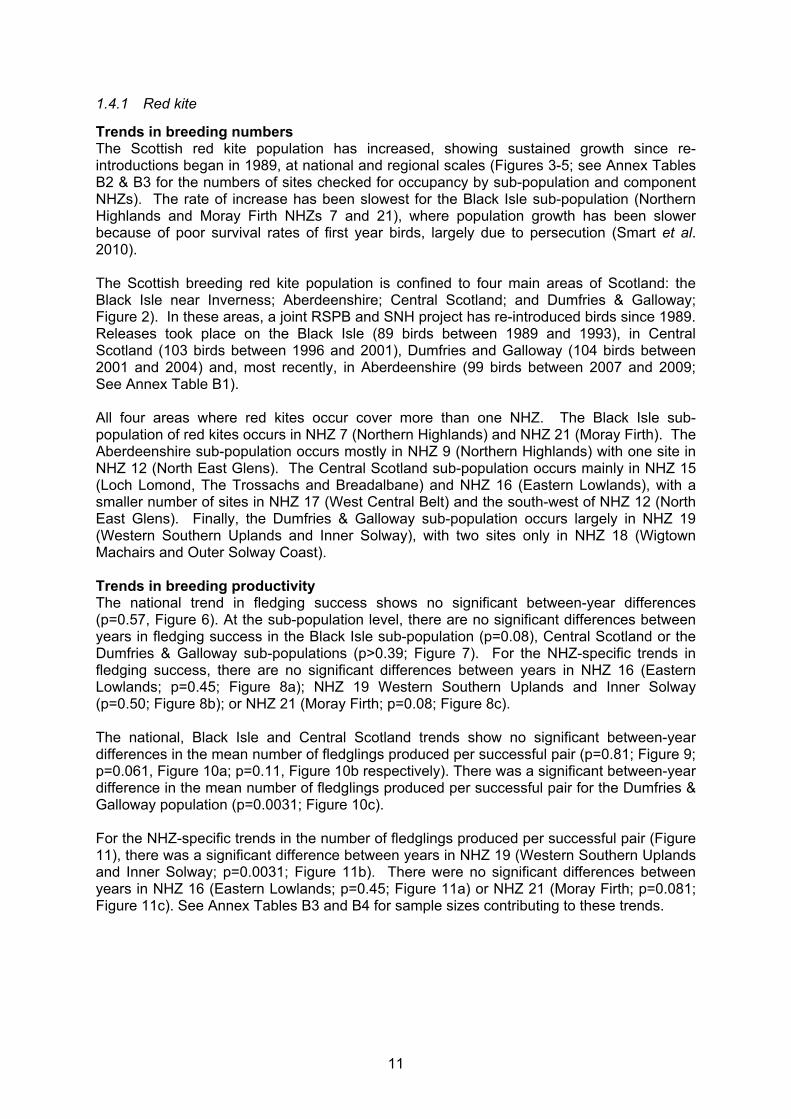
1.4.1 Red kite
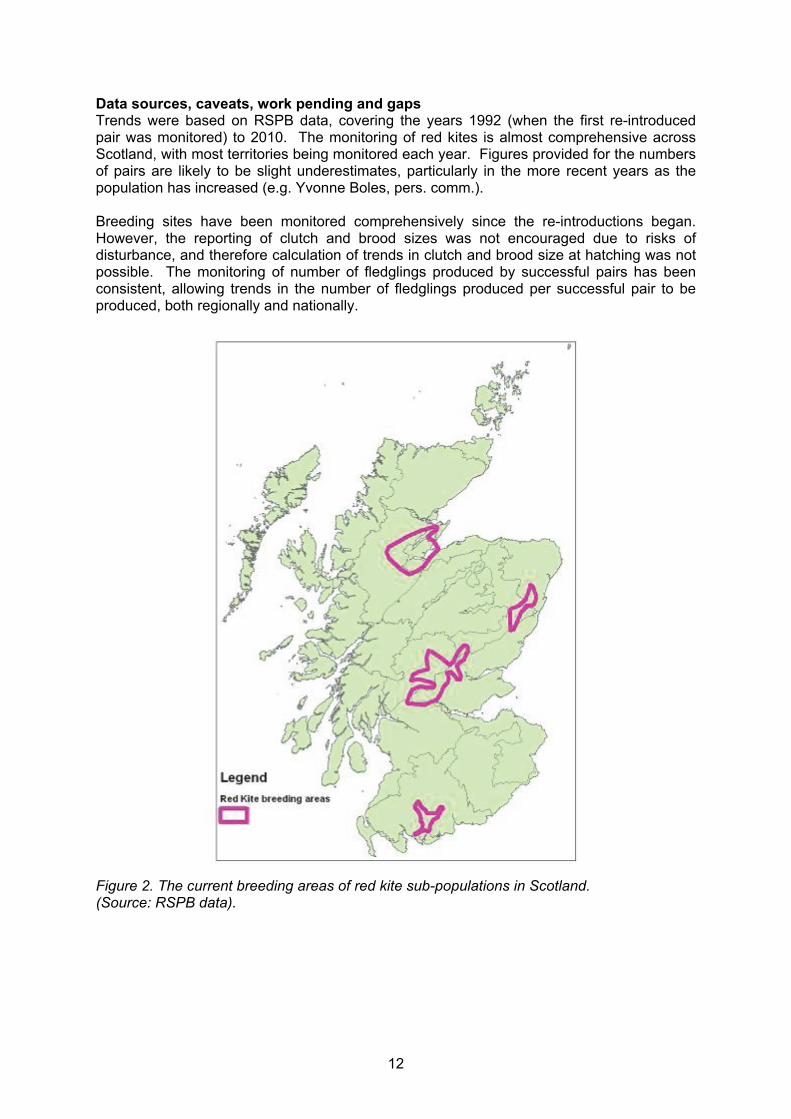
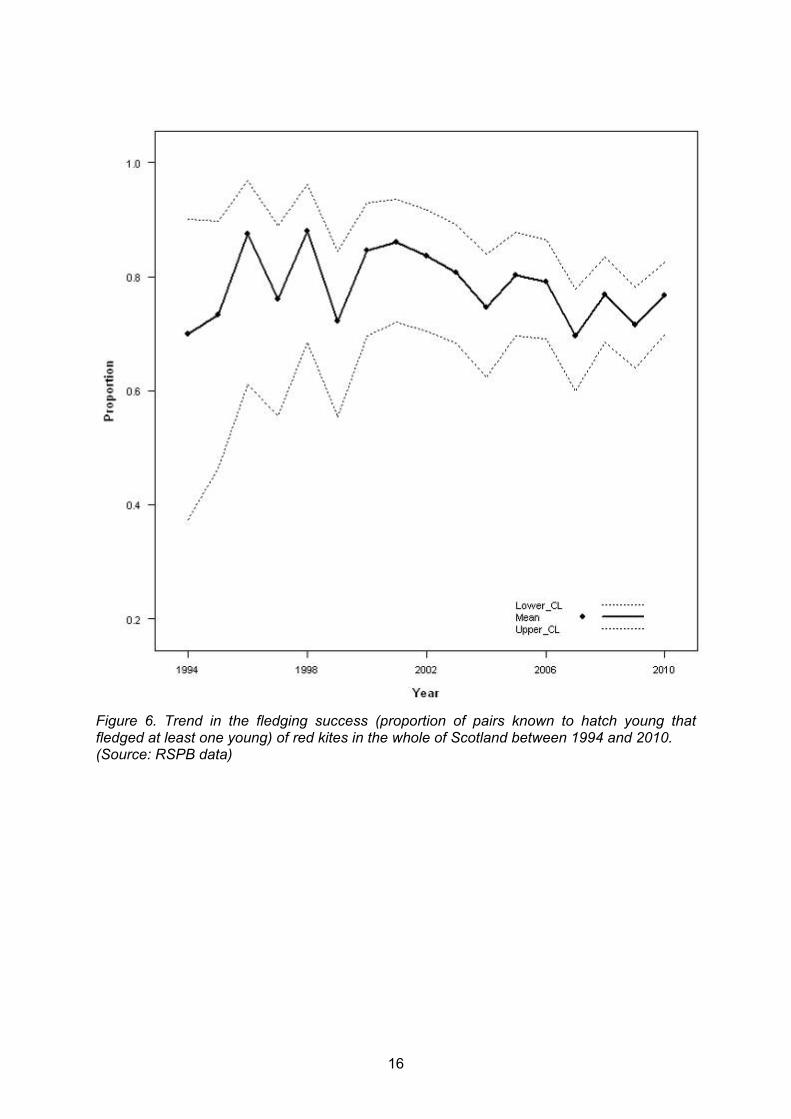
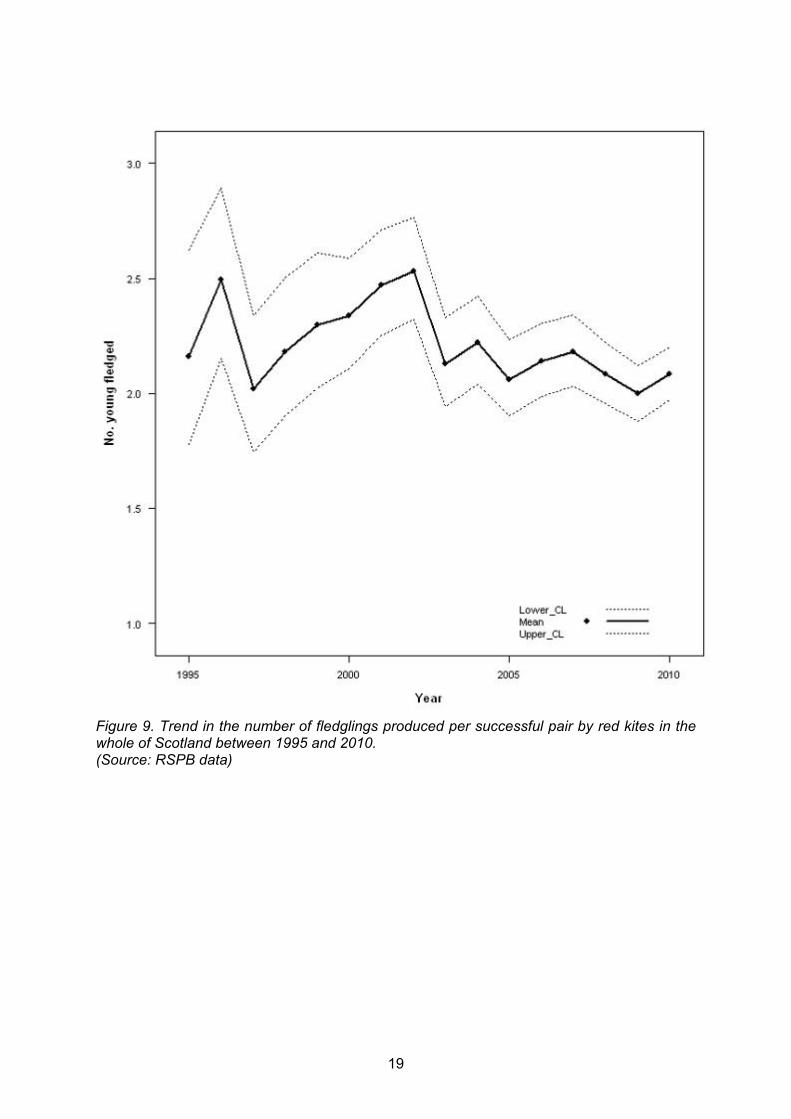
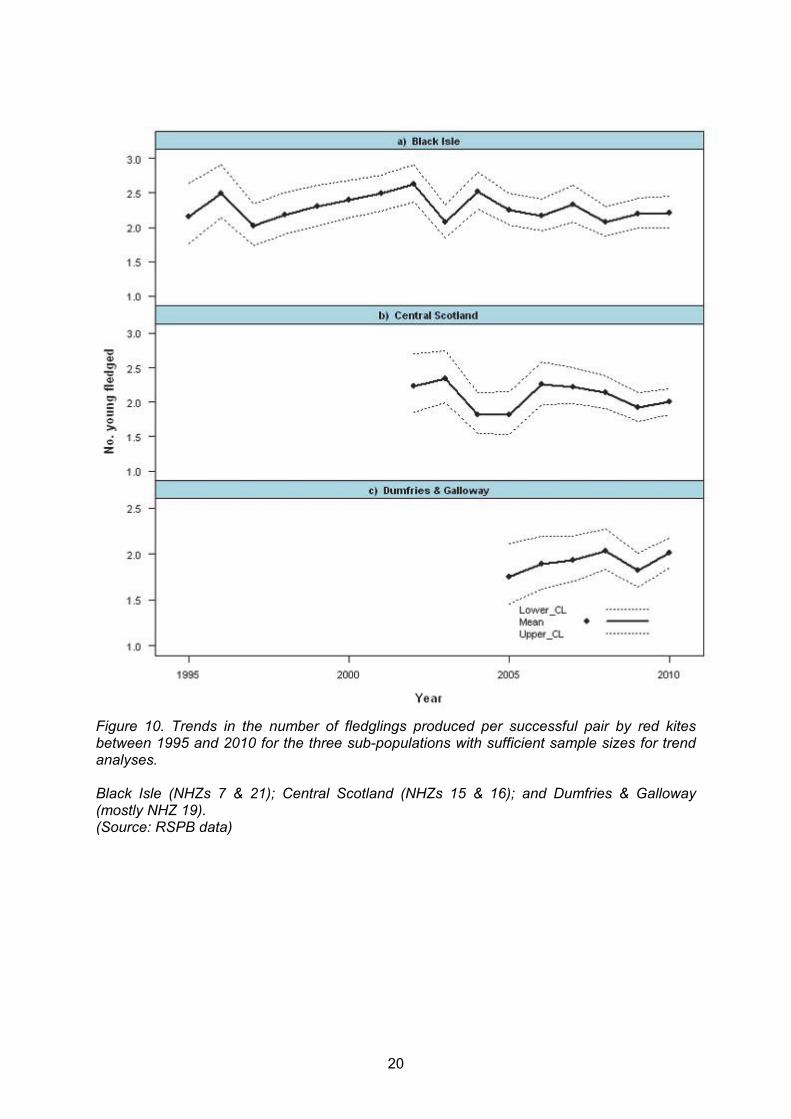
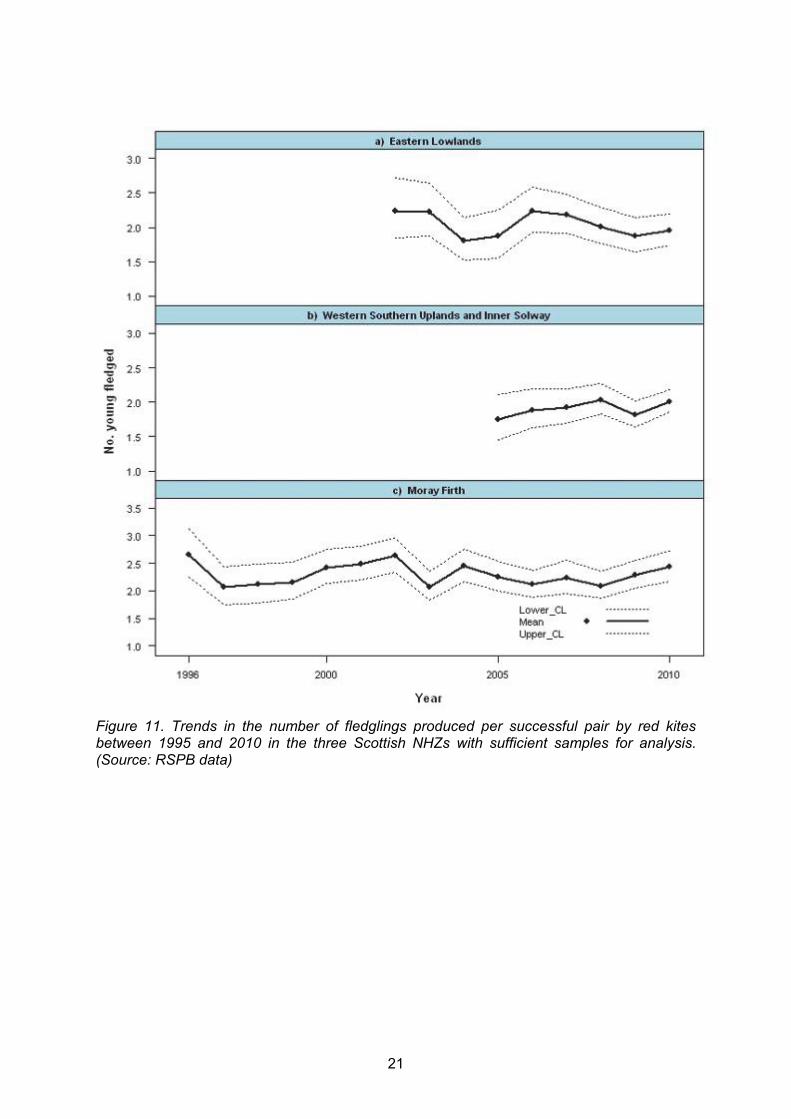
Trends in breeding numbers The Scottish red kite population has increased, showing sustained growth since re-introductions began in 1989, at national and regional scales (Figures 3-5; see Annex Tables B2 & B3 for the numbers of sites checked for occupancy by sub-population and component NHZs). The rate of increase has been slowest for the Black Isle sub-population (Northern Highlands and Moray Firth NHZs 7 and 21), where population growth has been slower because of poor survival rates of first year birds, largely due to persecution (Smart et al. 2010). The Scottish breeding red kite population is confined to four main areas of Scotland: the Black Isle near Inverness; Aberdeenshire; Central Scotland; and Dumfries & Galloway; Figure 2). In these areas, a joint RSPB and SNH project has re-introduced birds since 1989. Releases took place on the Black Isle (89 birds between 1989 and 1993), in Central Scotland (103 birds between 1996 and 2001), Dumfries and Galloway (104 birds between 2001 and 2004) and, most recently, in Aberdeenshire (99 birds between 2007 and 2009; See Annex Table B1). All four areas where red kites occur cover more than one NHZ. The Black Isle sub-population of red kites occurs in NHZ 7 (Northern Highlands) and NHZ 21 (Moray Firth). The Aberdeenshire sub-population occurs mostly in NHZ 9 (Northern Highlands) with one site in NHZ 12 (North East Glens). The Central Scotland sub-population occurs mainly in NHZ 15 (Loch Lomond, The Trossachs and Breadalbane) and NHZ 16 (Eastern Lowlands), with a smaller number of sites in NHZ 17 (West Central Belt) and the south-west of NHZ 12 (North East Glens). Finally, the Dumfries & Galloway sub-population occurs largely in NHZ 19 (Western Southern Uplands and Inner Solway), with two sites only in NHZ 18 (Wigtown Machairs and Outer Solway Coast). Trends in breeding productivity The national trend in fledging success shows no significant between-year differences (p=0.57, Figure 6). At the sub-population level, there are no significant differences between years in fledging success in the Black Isle sub-population (p=0.08), Central Scotland or the Dumfries & Galloway sub-populations (p>0.39; Figure 7). For the NHZ-specific trends in fledging success, there are no significant differences between years in NHZ 16 (Eastern Lowlands; p=0.45; Figure 8a); NHZ 19 Western Southern Uplands and Inner Solway (p=0.50; Figure 8b); or NHZ 21 (Moray Firth; p=0.08; Figure 8c). The national, Black Isle and Central Scotland trends show no significant between-year differences in the mean number of fledglings produced per successful pair (p=0.81; Figure 9; p=0.061, Figure 10a; p=0.11, Figure 10b respectively). There was a significant between-year difference in the mean number of fledglings produced per successful pair for the Dumfries & Galloway population (p=0.0031; Figure 10c). For the NHZ-specific trends in the number of fledglings produced per successful pair (Figure 11), there was a significant difference between years in NHZ 19 (Western Southern Uplands and Inner Solway; p=0.0031; Figure 11b). There were no significant differences between years in NHZ 16 (Eastern Lowlands; p=0.45; Figure 11a) or NHZ 21 (Moray Firth; p=0.081; Figure 11c). See Annex Tables B3 and B4 for sample sizes contributing to these trends.
12
Data sources, caveats, work pending and gaps Trends were based on RSPB data, covering the years 1992 (when the first re-introduced pair was monitored) to 2010. The monitoring of red kites is almost comprehensive across Scotland, with most territories being monitored each year. Figures provided for the numbers of pairs are likely to be slight underestimates, particularly in the more recent years as the population has increased (e.g. Yvonne Boles, pers. comm.). Breeding sites have been monitored comprehensively since the re-introductions began. However, the reporting of clutch and brood sizes was not encouraged due to risks of disturbance, and therefore calculation of trends in clutch and brood size at hatching was not possible. The monitoring of number of fledglings produced by successful pairs has been consistent, allowing trends in the number of fledglings produced per successful pair to be produced, both regionally and nationally.
Figure 2. The current breeding areas of red kite sub-populations in Scotland. (Source: RSPB data).

13
Figure 3. Trends in the number of breeding pairs of red kites in the whole of Scotland for the years 1992-2010. (Source: RSPB data) Note that numbers may be slightly underestimated in the most recent years.

14
Figure 4. Trends in the number of breeding pairs of red kites in the three areas of Scotland where the reintroduced species has been breeding for more than five years during the period 1992-2010. Black Isle (NHZs 7 & 21); Central Scotland (NHZs 12, 15, 16 & 17); and Dumfries & Galloway (NHZs 18 & 19). (Source: RSPB data)

15
Figure 5. Trends in the number of breeding pairs of red kites in the five NHZs that held the majority of the Scottish population during the period 1992-2010. (Source: RSPB data)
16
Figure 6. Trend in the fledging success (proportion of pairs known to hatch young that fledged at least one young) of red kites in the whole of Scotland between 1994 and 2010. (Source: RSPB data)

17
Figure 7. Trends in the fledging success (proportion of pairs known to hatch young that fledged at least one young) of red kites between 1994 and 2010 for the three sub-populations with sufficient sample sizes for trend analyses. Black Isle (NHZs 7 & 21); Central Scotland (NHZs 15 & 16); and Dumfries & Galloway (mostly NHZ 19). (Source: RSPB data)

18
Figure 8. Trends in the fledging success (proportion of pairs known to hatch young that fledged at least one young) of red kites between 1995 and 2010 in the three Scottish NHZs with sufficient samples for analysis. (Source: RSPB data)
19
Figure 9. Trend in the number of fledglings produced per successful pair by red kites in the whole of Scotland between 1995 and 2010. (Source: RSPB data)
20
Figure 10. Trends in the number of fledglings produced per successful pair by red kites between 1995 and 2010 for the three sub-populations with sufficient sample sizes for trend analyses. Black Isle (NHZs 7 & 21); Central Scotland (NHZs 15 & 16); and Dumfries & Galloway (mostly NHZ 19). (Source: RSPB data)
21
Figure 11. Trends in the number of fledglings produced per successful pair by red kites between 1995 and 2010 in the three Scottish NHZs with sufficient samples for analysis. (Source: RSPB data)
22
1.4.2 White-tailed eagle
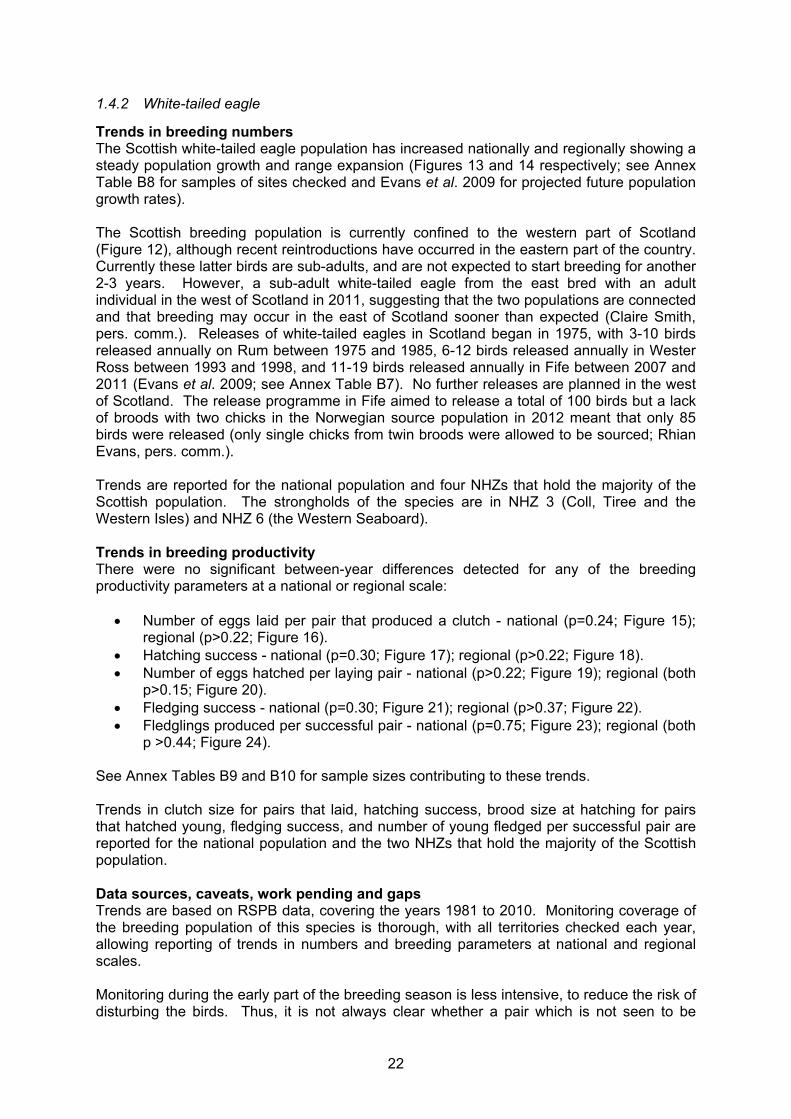
Trends in breeding numbers The Scottish white-tailed eagle population has increased nationally and regionally showing a steady population growth and range expansion (Figures 13 and 14 respectively; see Annex Table B8 for samples of sites checked and Evans et al. 2009 for projected future population growth rates). The Scottish breeding population is currently confined to the western part of Scotland (Figure 12), although recent reintroductions have occurred in the eastern part of the country. Currently these latter birds are sub-adults, and are not expected to start breeding for another 2-3 years. However, a sub-adult white-tailed eagle from the east bred with an adult individual in the west of Scotland in 2011, suggesting that the two populations are connected and that breeding may occur in the east of Scotland sooner than expected (Claire Smith, pers. comm.). Releases of white-tailed eagles in Scotland began in 1975, with 3-10 birds released annually on Rum between 1975 and 1985, 6-12 birds released annually in Wester Ross between 1993 and 1998, and 11-19 birds released annually in Fife between 2007 and 2011 (Evans et al. 2009; see Annex Table B7). No further releases are planned in the west of Scotland. The release programme in Fife aimed to release a total of 100 birds but a lack of broods with two chicks in the Norwegian source population in 2012 meant that only 85 birds were released (only single chicks from twin broods were allowed to be sourced; Rhian Evans, pers. comm.). Trends are reported for the national population and four NHZs that hold the majority of the Scottish population. The strongholds of the species are in NHZ 3 (Coll, Tiree and the Western Isles) and NHZ 6 (the Western Seaboard). Trends in breeding productivity There were no significant between-year differences detected for any of the breeding productivity parameters at a national or regional scale:
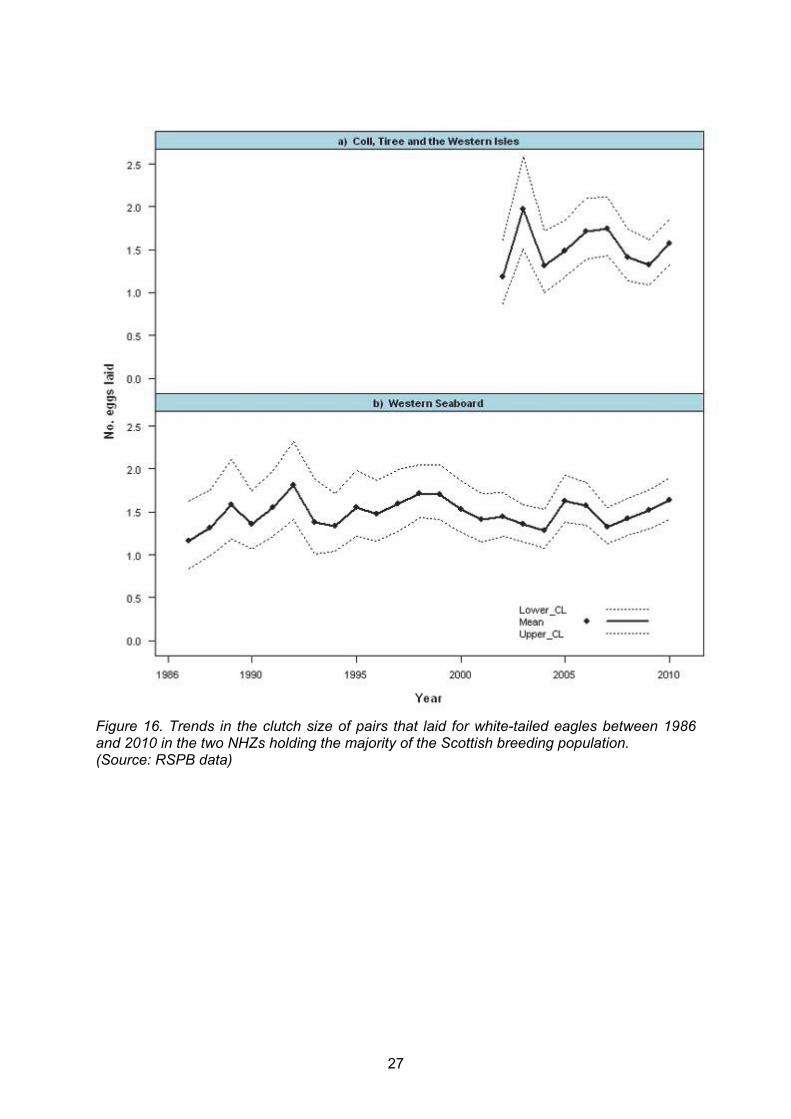
Number of eggs laid per pair that produced a clutch - national (p=0.24; Figure 15); regional (p>0.22; Figure 16).
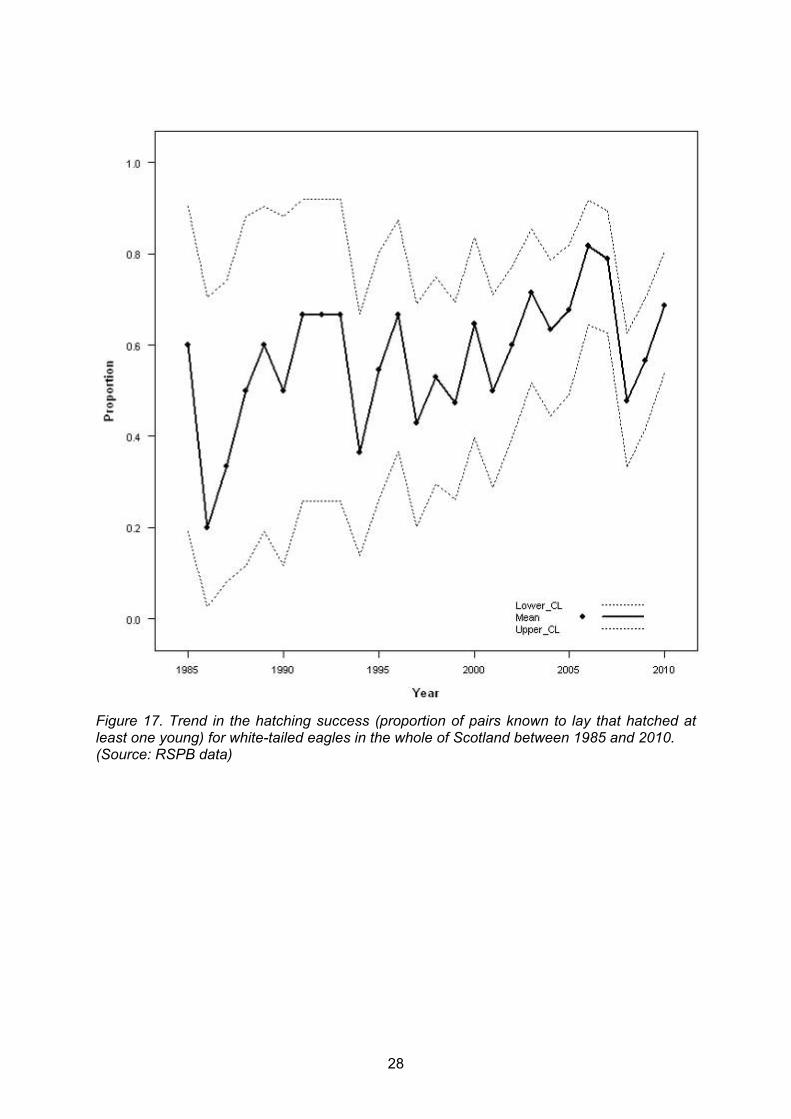
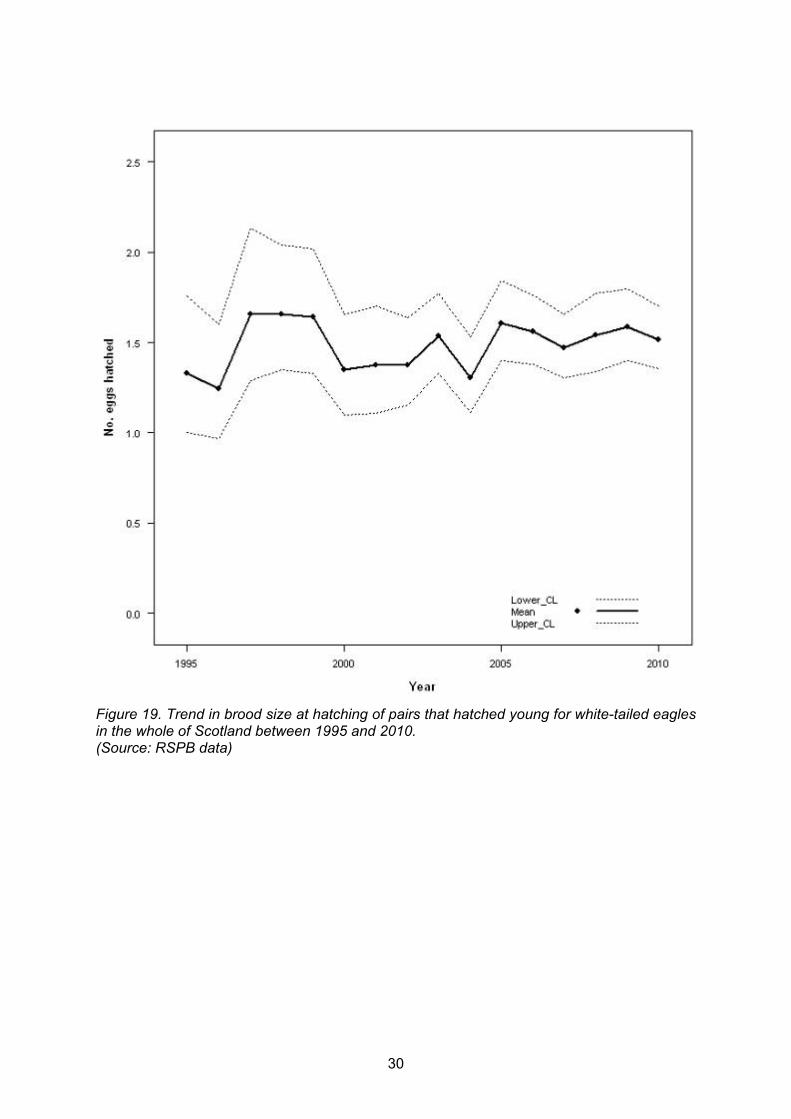
Hatching success - national (p=0.30; Figure 17); regional (p>0.22; Figure 18). Number of eggs hatched per laying pair - national (p>0.22; Figure 19); regional (both
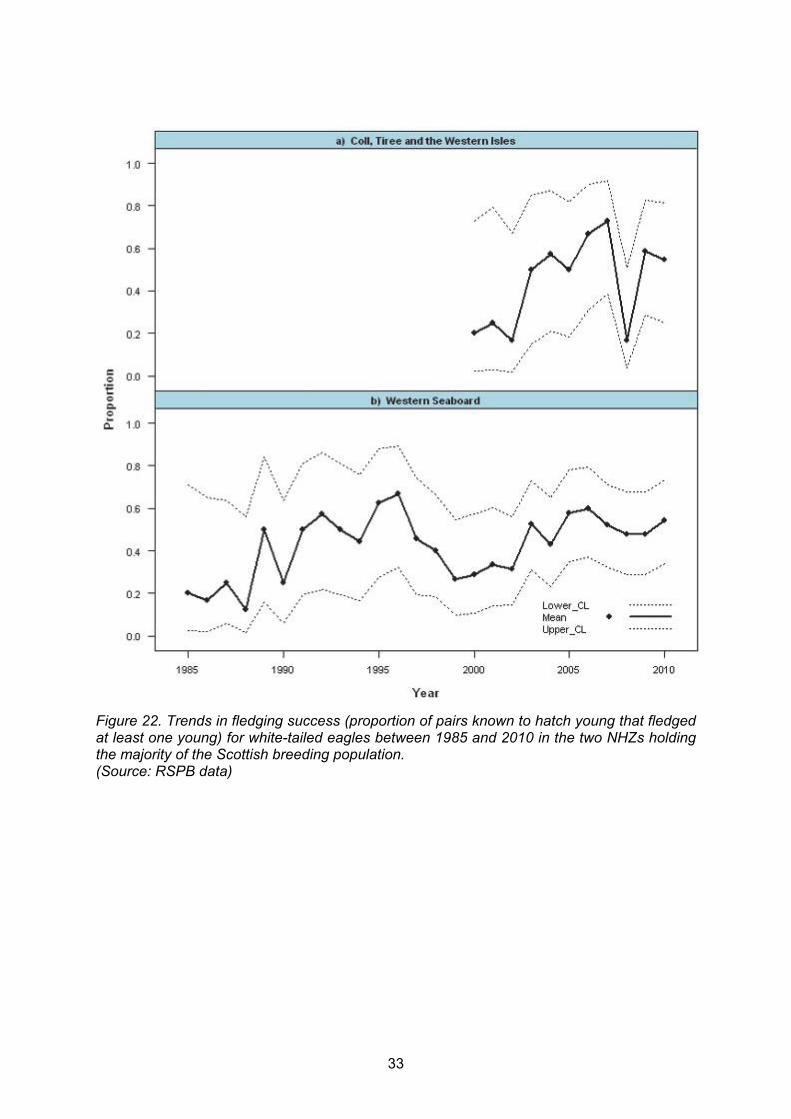
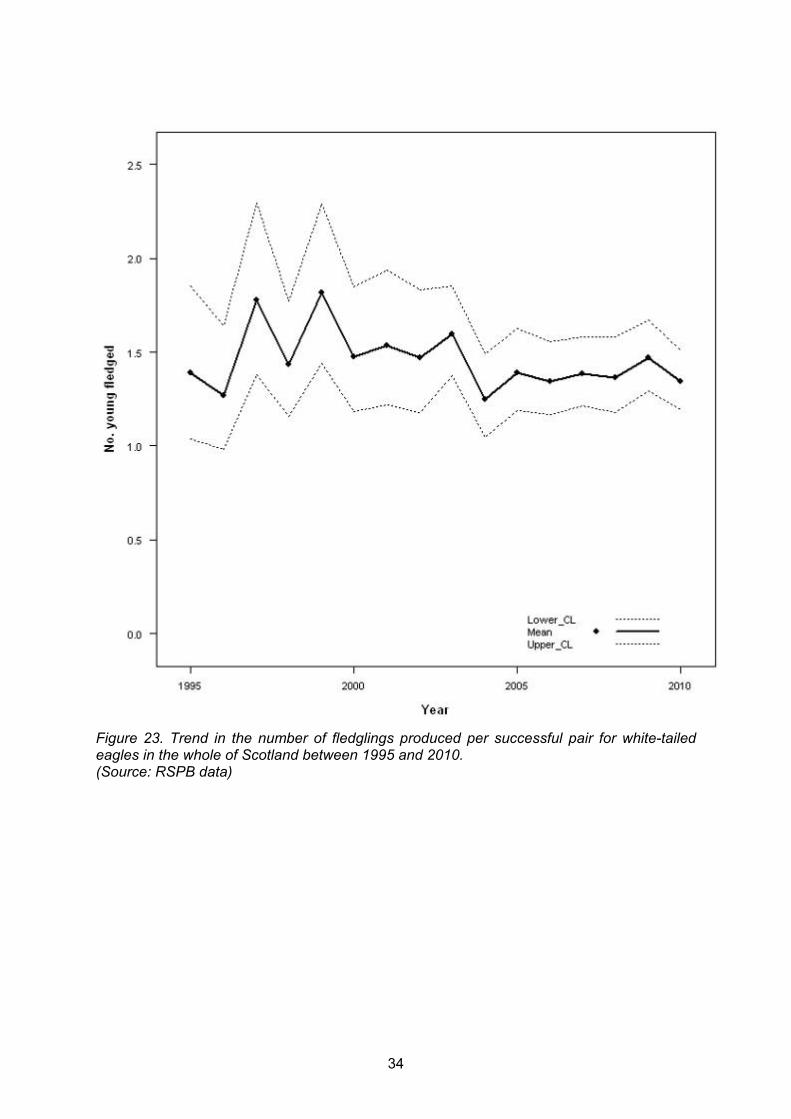
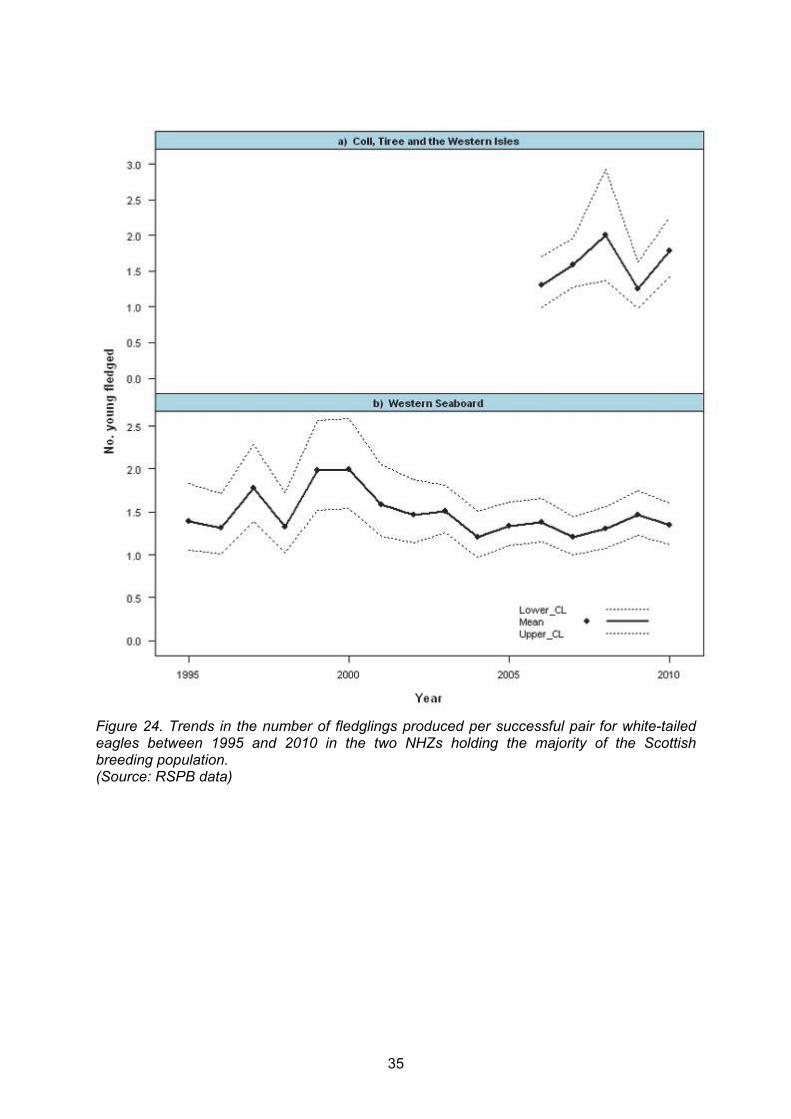
p>0.15; Figure 20). Fledging success - national (p=0.30; Figure 21); regional (p>0.37; Figure 22). Fledglings produced per successful pair - national (p=0.75; Figure 23); regional (both
p >0.44; Figure 24). See Annex Tables B9 and B10 for sample sizes contributing to these trends. Trends in clutch size for pairs that laid, hatching success, brood size at hatching for pairs that hatched young, fledging success, and number of young fledged per successful pair are reported for the national population and the two NHZs that hold the majority of the Scottish population. Data sources, caveats, work pending and gaps Trends are based on RSPB data, covering the years 1981 to 2010. Monitoring coverage of the breeding population of this species is thorough, with all territories checked each year, allowing reporting of trends in numbers and breeding parameters at national and regional scales. Monitoring during the early part of the breeding season is less intensive, to reduce the risk of disturbing the birds. Thus, it is not always clear whether a pair which is not seen to be

23
incubating eggs actually attempted to breeding, and therefore it is not possible to report trends in laying success. Figures for numbers of breeding pairs are likely to be slightly underestimated due to this uncertainty. Figures for total numbers of fledged young and successful pairs are thought to be precise. Trends in appropriate breeding parameters were calculated for the whole of Scotland (Annex Table B10). Trends in breeding parameters were also calculated for NHZs where the number of records was greater than five records per year. This was a relaxation of the more general inclusion criteria used, as records for white-tailed eagle are comprehensive. The species is still rare, and low sample sizes restricted the calculation of trends in breeding parameters for five of the seven NHZs in which the species breeds (Annex Table B9).
Figure 12. Breeding range of white-tailed eagles in Scotland by 2010. (Source: RSPB data)

24
Figure 13. Trends in the number of breeding pairs of white-tailed eagles in the whole of Scotland for the years 1981-2010. (Source: RSPB data)
25
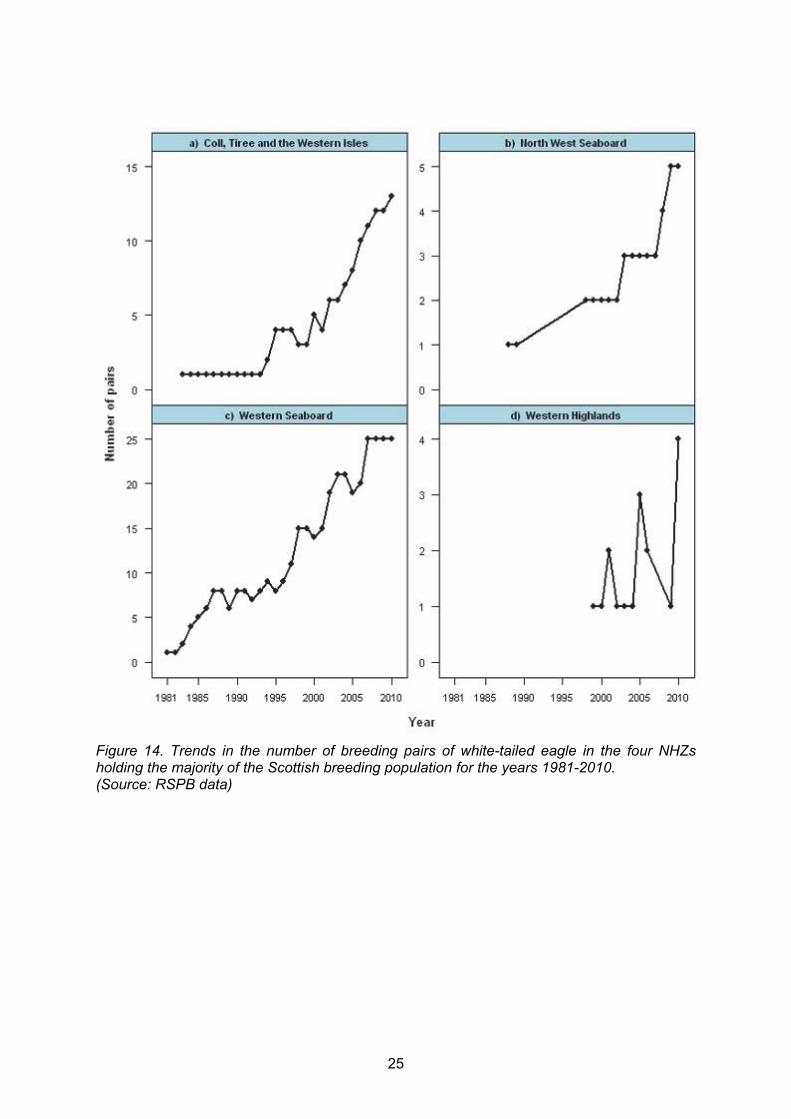
Figure 14. Trends in the number of breeding pairs of white-tailed eagle in the four NHZs holding the majority of the Scottish breeding population for the years 1981-2010. (Source: RSPB data)

26
Figure 15. Trend in the mean clutch size of pairs that laid for white-tailed eagles in the whole of Scotland between 1986 and 2010. (Source: RSPB data)
27
Figure 16. Trends in the clutch size of pairs that laid for white-tailed eagles between 1986 and 2010 in the two NHZs holding the majority of the Scottish breeding population. (Source: RSPB data)
28
Figure 17. Trend in the hatching success (proportion of pairs known to lay that hatched at least one young) for white-tailed eagles in the whole of Scotland between 1985 and 2010. (Source: RSPB data)

29
Figure 18. Trends in hatching success (proportion of pairs known to lay that hatched at least one young) for white-tailed eagles between 1986 and 2010 in the two NHZs holding the majority of the Scottish breeding population. (Source: RSPB data)
30
Figure 19. Trend in brood size at hatching of pairs that hatched young for white-tailed eagles in the whole of Scotland between 1995 and 2010. (Source: RSPB data)

31
Figure 20. Trends in the brood size at hatching of pairs that hatched young for white-tailed eagles between 1995 and 2010 in two NHZs holding the majority of the Scottish breeding population. (Source: RSPB data)

32
Figure 21. Trend in the fledging success (proportion of pairs known to hatch young that fledged at least one young) for white-tailed eagles in the whole of Scotland between 1985 and 2010. (Source: RSPB data)
33
Figure 22. Trends in fledging success (proportion of pairs known to hatch young that fledged at least one young) for white-tailed eagles between 1985 and 2010 in the two NHZs holding the majority of the Scottish breeding population. (Source: RSPB data)
34
Figure 23. Trend in the number of fledglings produced per successful pair for white-tailed eagles in the whole of Scotland between 1995 and 2010. (Source: RSPB data)
35
Figure 24. Trends in the number of fledglings produced per successful pair for white-tailed eagles between 1995 and 2010 in the two NHZs holding the majority of the Scottish breeding population. (Source: RSPB data)

36
1.4.3 Hen harrier
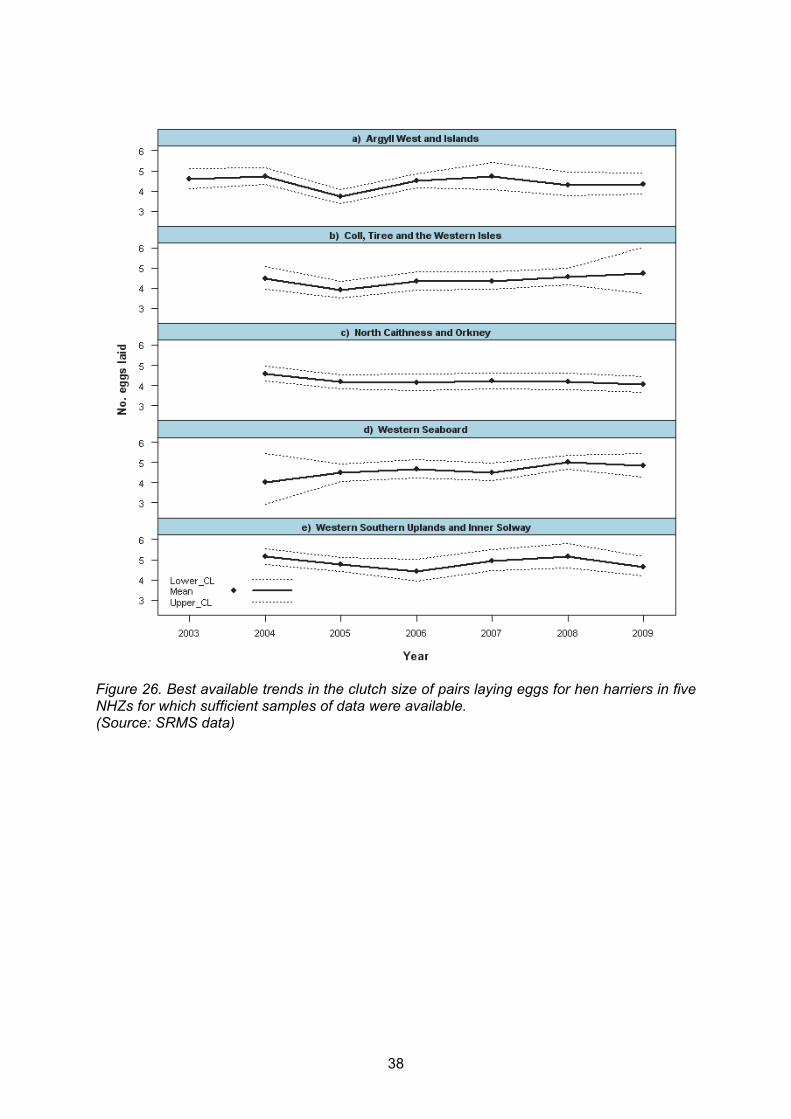
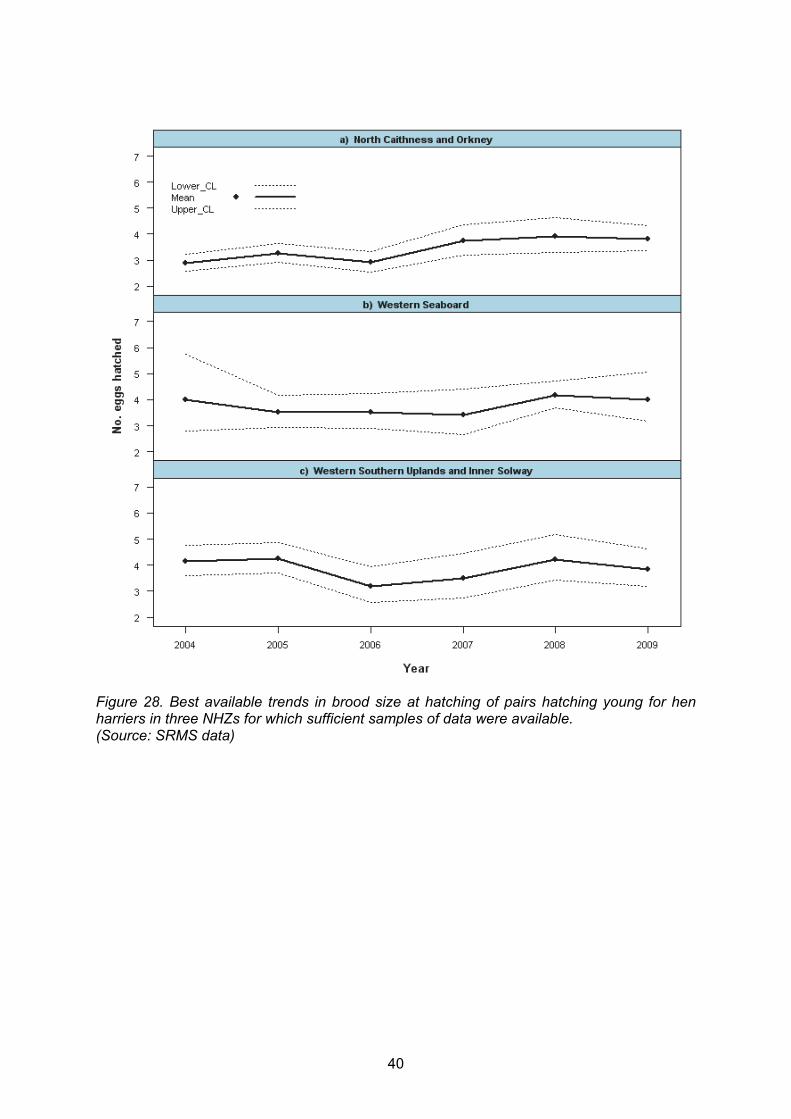
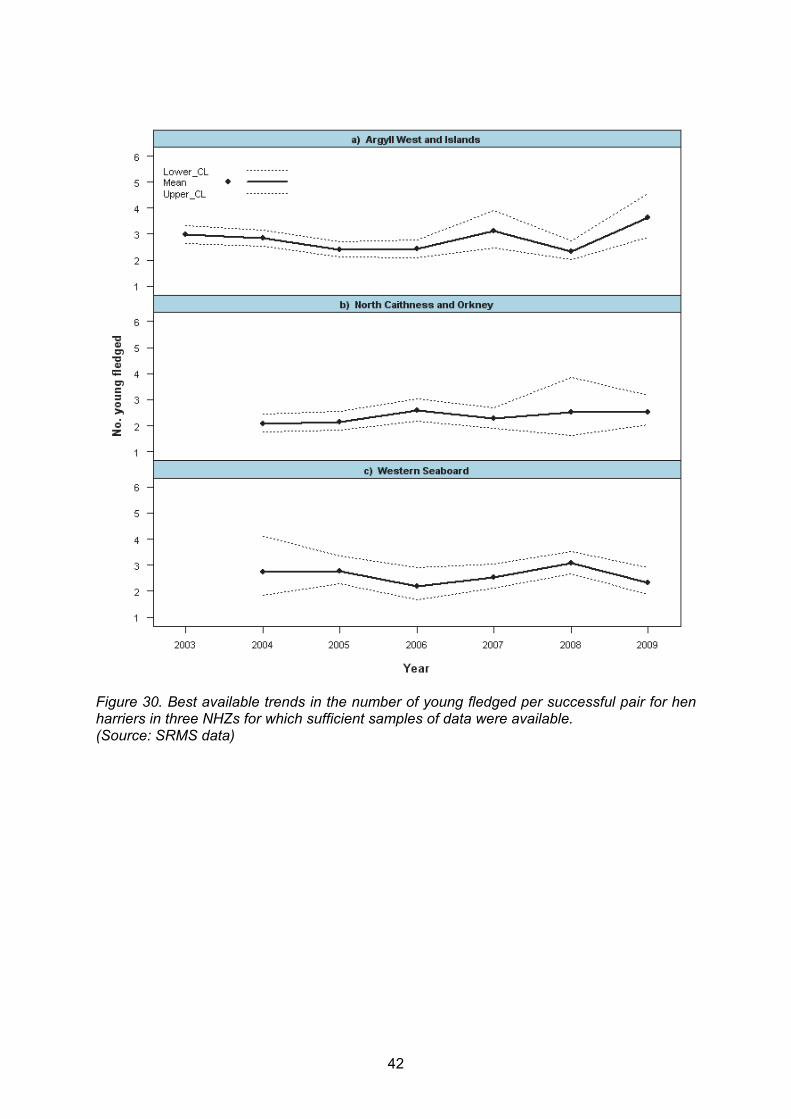
Trends in breeding numbers Trends in breeding numbers cannot be reported until further work to quantify coverage and compare this to current knowledge of the Scottish distribution of hen harriers is complete. Trends in breeding productivity There were no significant between-year differences detected for any of the breeding productivity parameters at a regional scale. None of the provisional NHZ-specific trends in laying success (Figure 25), clutch size (Figure 26), hatching success (Figure 27), brood size at hatching (Figure 28), fledging success (Figure 29) or number of young fledged per successful pair (Figure 30) show statistically significant between-year differences since 2003. Best available trends in laying success could be reported for one NHZ, clutch size of those pairs that laid for five NHZs, hatching success for three NHZs, brood size at hatching for pairs that hatch young for three NHZs, fledging success for four NHZs and number of young fledged per successful pair for three NHZs. Data sources, caveats, work pending and gaps Analyses were based on the 2,918 individual site-year records in the SRMS data for 2003-2009 that could be linked to individual NHZs (see Annex Tables B9 and B10). A breakdown of ranges surveyed under the SRMS 2003-2009 and the numbers found to be occupied by NHZ and Raptor Study Group (for those still without grid references) is available in Annex Table B13. For this species, trends in breeding numbers cannot be produced until two further pieces of work are carried out: (a) to obtain coverage/effort information from observers; and (b) to compare annual monitoring coverage to our best knowledge of the current distribution and abundance of hen harriers in Scotland (and in each NHZ; information available from the most recent national survey in 2010, supplemented by Bird Atlas 2007-11). It is not possible to identify any key monitoring gaps until this additional analysis is undertaken. We produced provisional trends in breeding parameters for up to five NHZs for which samples of at least 10 appropriate records exist for each parameter in each year (see Annex Table B14 for sample sizes). It was not possible to determine to what extent these trends are representative of each NHZ hen harrier population. Once coverage information for each NHZ is available, this can be compared with the up to date distribution information. The trends are provisional until checks have been made on the consistency of field methods employed by each hen harrier study that contributes to these trends. Across Scotland, we are aware of several long-term hen harrier monitoring studies. For example, raptor workers on Orkney have collected hen harrier data since 1953 and more systematically since 1975. These data have been used to demonstrate the effects of sheep grazing on Orkney vole (Microtus arvalis orcadensis) abundance and hen harrier productivity (Amar et al. 2012). Other such datasets, collected before the inception of the SRMS, exist and future inclusion of these in trends work would be beneficial. Given the number and distribution of hen harrier records submitted to the SRMS annually since 2003 (Annex Table B13), it should be possible to produce some national trends in future once the work pending (above) is complete.

37
Figure 25. Best available trend in laying success (proportion of known breeding attempts in which at least one egg was laid) of hen harriers in the one NHZ for which a sufficient sample of data was available. (Source: SRMS data)
38
Figure 26. Best available trends in the clutch size of pairs laying eggs for hen harriers in five NHZs for which sufficient samples of data were available. (Source: SRMS data)

39
Figure 27. Best available trends in hatching success (proportion of pairs known to lay that hatched at least one young) for hen harriers in three NHZs for which sufficient samples of data were available. (Source: SRMS data)
40
Figure 28. Best available trends in brood size at hatching of pairs hatching young for hen harriers in three NHZs for which sufficient samples of data were available. (Source: SRMS data)

41
Figure 29. Best available trends in fledging success (proportion of pairs known to hatch young that fledged at least one young) for hen harriers in four NHZs for which sufficient samples of data were available. (Source: SRMS data)
42
Figure 30. Best available trends in the number of young fledged per successful pair for hen harriers in three NHZs for which sufficient samples of data were available. (Source: SRMS data)
43
1.4.4 Northern goshawk
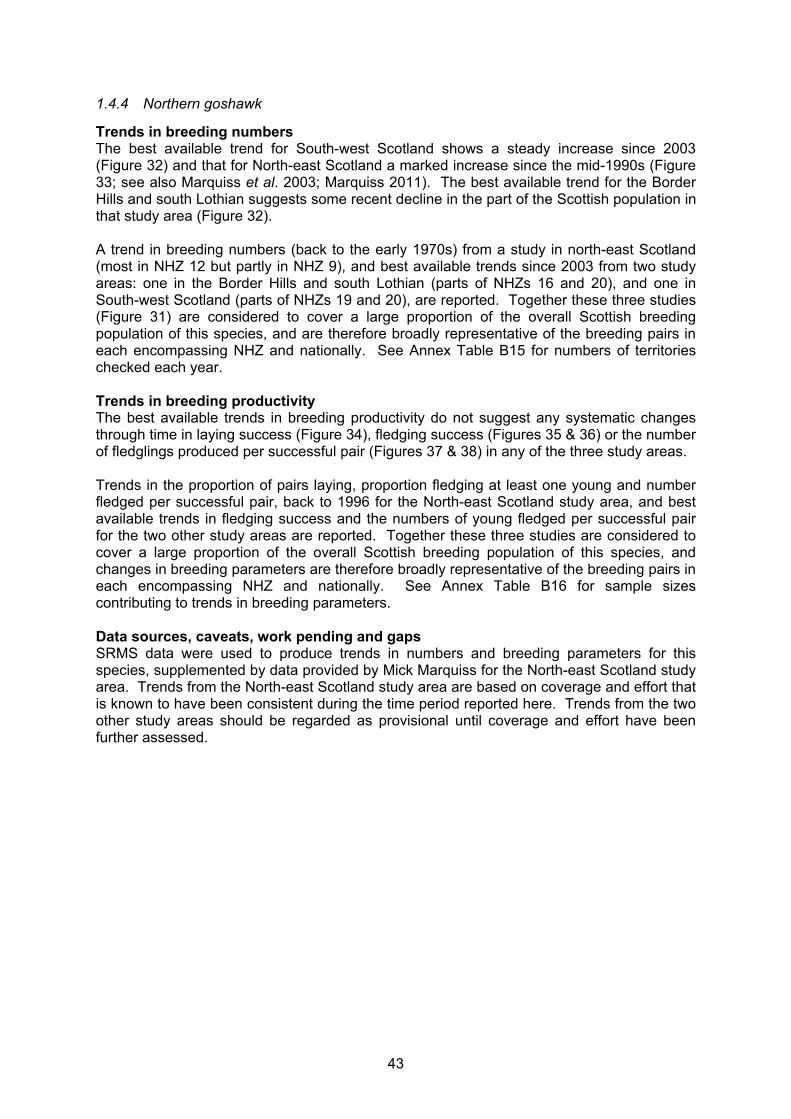
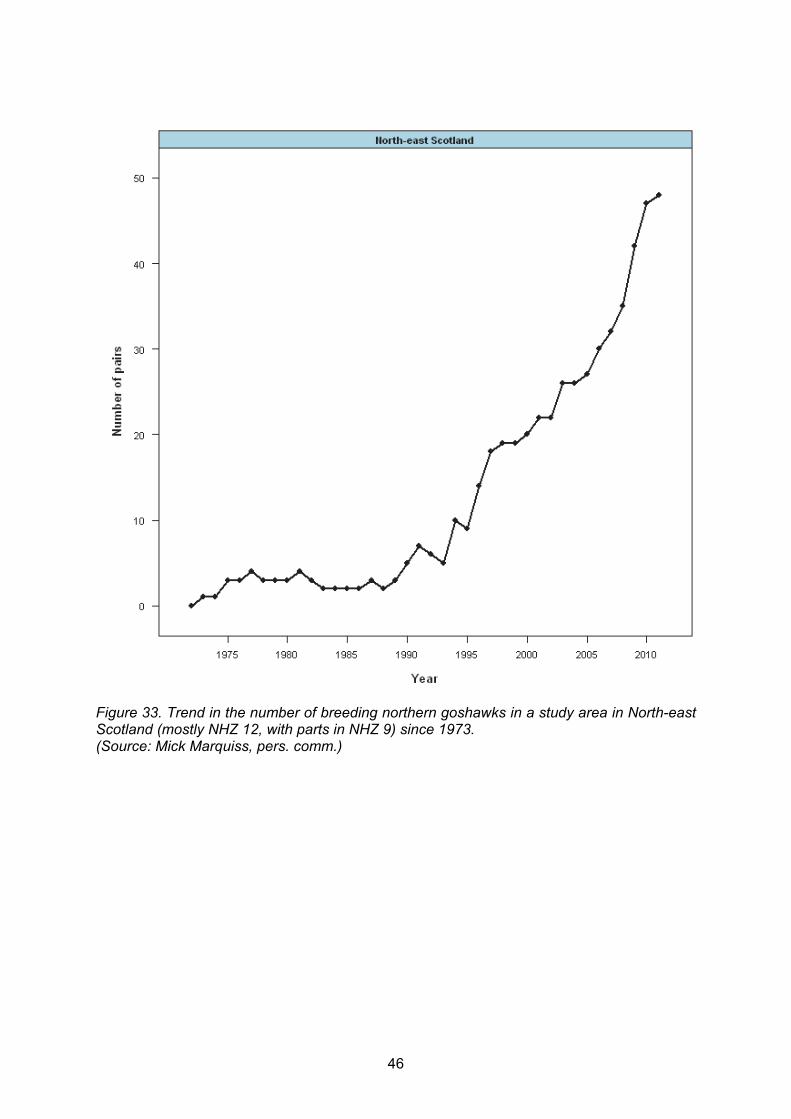
Trends in breeding numbers The best available trend for South-west Scotland shows a steady increase since 2003 (Figure 32) and that for North-east Scotland a marked increase since the mid-1990s (Figure 33; see also Marquiss et al. 2003; Marquiss 2011). The best available trend for the Border Hills and south Lothian suggests some recent decline in the part of the Scottish population in that study area (Figure 32). A trend in breeding numbers (back to the early 1970s) from a study in north-east Scotland (most in NHZ 12 but partly in NHZ 9), and best available trends since 2003 from two study areas: one in the Border Hills and south Lothian (parts of NHZs 16 and 20), and one in South-west Scotland (parts of NHZs 19 and 20), are reported. Together these three studies (Figure 31) are considered to cover a large proportion of the overall Scottish breeding population of this species, and are therefore broadly representative of the breeding pairs in each encompassing NHZ and nationally. See Annex Table B15 for numbers of territories checked each year. Trends in breeding productivity The best available trends in breeding productivity do not suggest any systematic changes through time in laying success (Figure 34), fledging success (Figures 35 & 36) or the number of fledglings produced per successful pair (Figures 37 & 38) in any of the three study areas. Trends in the proportion of pairs laying, proportion fledging at least one young and number fledged per successful pair, back to 1996 for the North-east Scotland study area, and best available trends in fledging success and the numbers of young fledged per successful pair for the two other study areas are reported. Together these three studies are considered to cover a large proportion of the overall Scottish breeding population of this species, and changes in breeding parameters are therefore broadly representative of the breeding pairs in each encompassing NHZ and nationally. See Annex Table B16 for sample sizes contributing to trends in breeding parameters. Data sources, caveats, work pending and gaps SRMS data were used to produce trends in numbers and breeding parameters for this species, supplemented by data provided by Mick Marquiss for the North-east Scotland study area. Trends from the North-east Scotland study area are based on coverage and effort that is known to have been consistent during the time period reported here. Trends from the two other study areas should be regarded as provisional until coverage and effort have been further assessed.

44
Figure 31. The locations of the three goshawk studies contributing information on trends.

45
Figure 32. Best available trends in the number of breeding northern goshawks in three study areas in Scotland. (Source: SRMS data, Mick Marquiss for North-east Scotland)
46
Figure 33. Trend in the number of breeding northern goshawks in a study area in North-east Scotland (mostly NHZ 12, with parts in NHZ 9) since 1973. (Source: Mick Marquiss, pers. comm.)

47
Figure 34. Trend in laying success (proportion of known pairs that laid at least one egg) for northern goshawks in a study area in North-east Scotland. (Source: Mick Marquiss pers. comm.)

48
Figure 35. Best available trends in fledging success (proportion of pairs known to hatch young that fledged at least one young) for northern goshawks in two study areas of Scotland. (Source: SRMS data)

49
Figure 36. Trend in fledging success (proportion of pairs known to hatch young that fledged at least one young) for northern goshawks in a study area in North-east Scotland. (Source: Mick Marquiss pers. comm.)

50
Figure 37. Best available trends in the number of fledglings produced per successful pair for northern goshawks in two study areas of Scotland. (Source: SRMS data)
51
Figure 38. Trend in the number fledged per successful pair for northern goshawks in a study area in North-east Scotland. (Source: Mick Marquiss pers. comm.)
52
1.4.5 Eurasian sparrowhawk
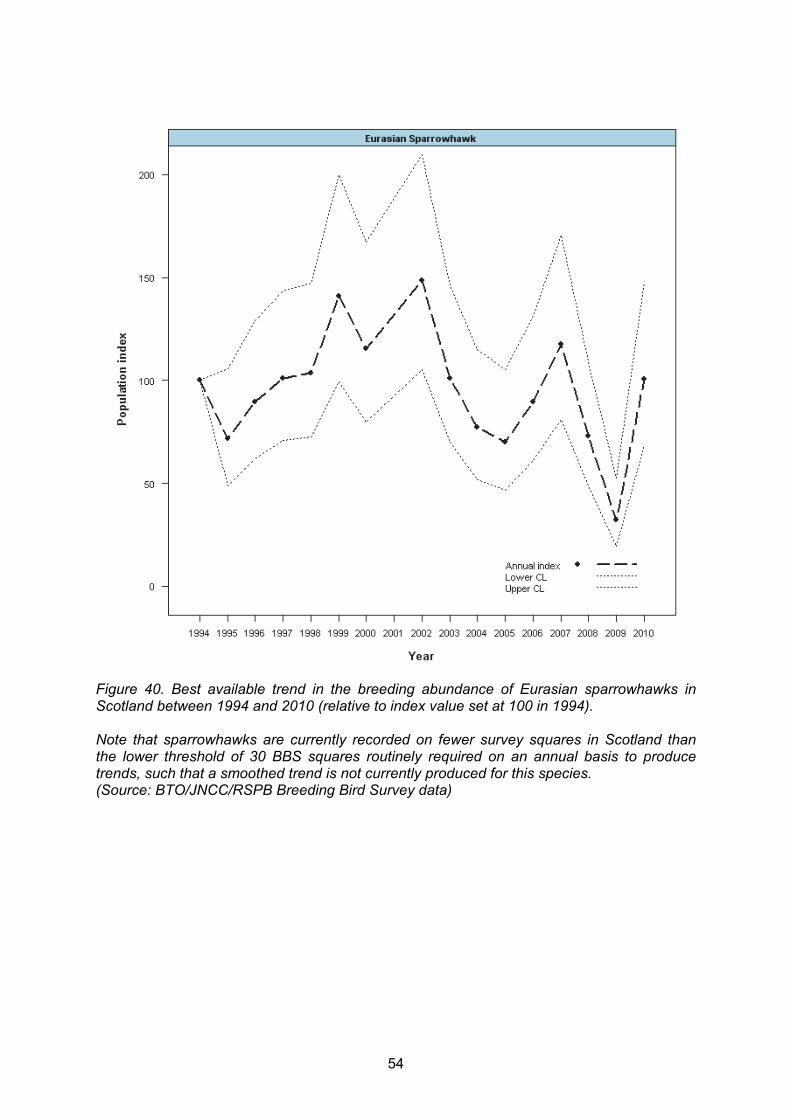
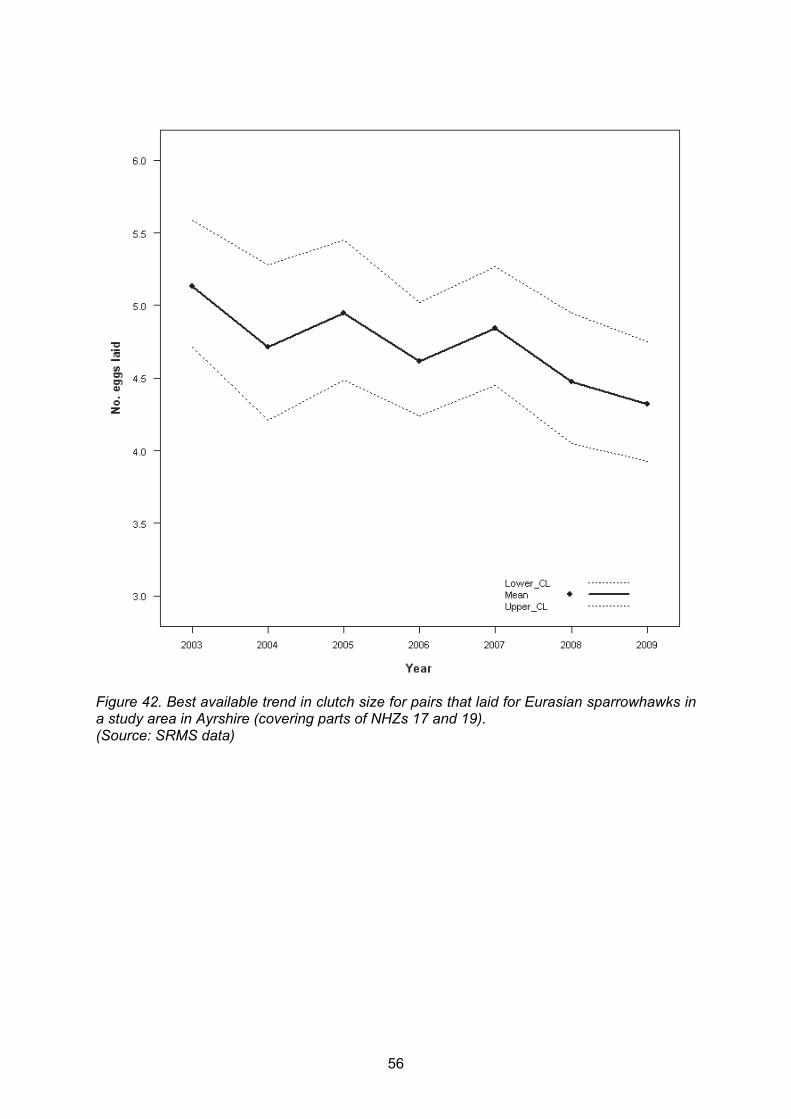
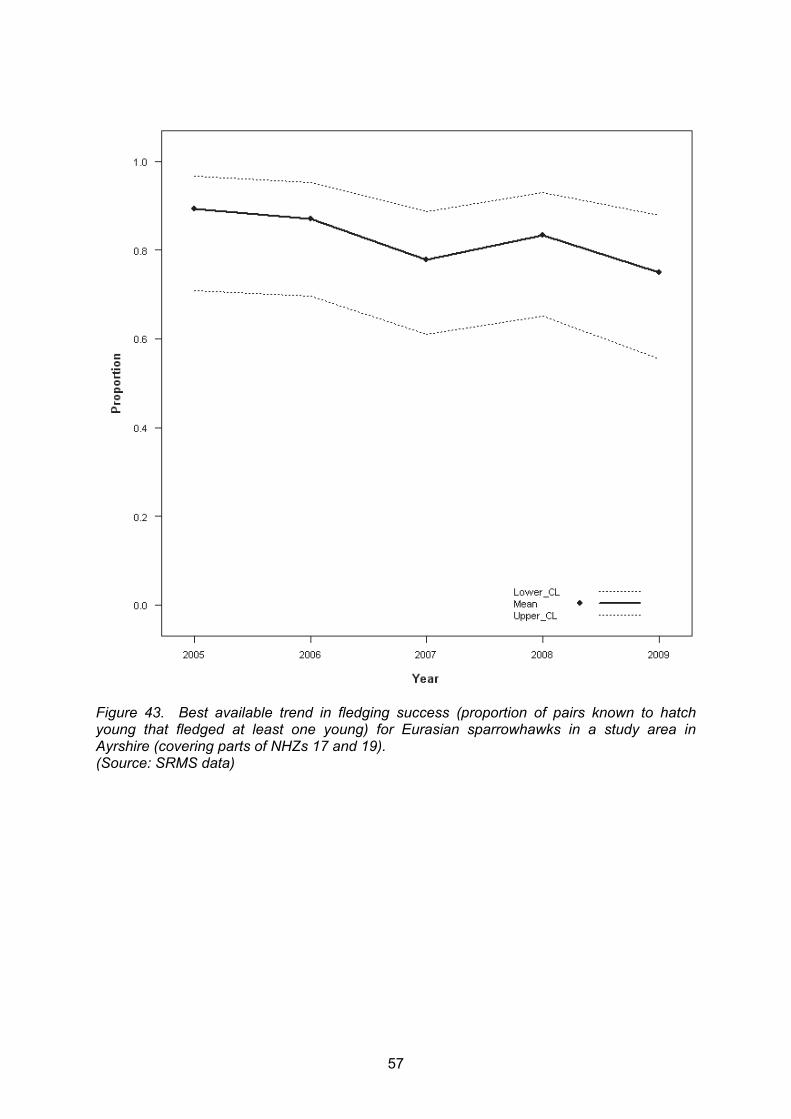
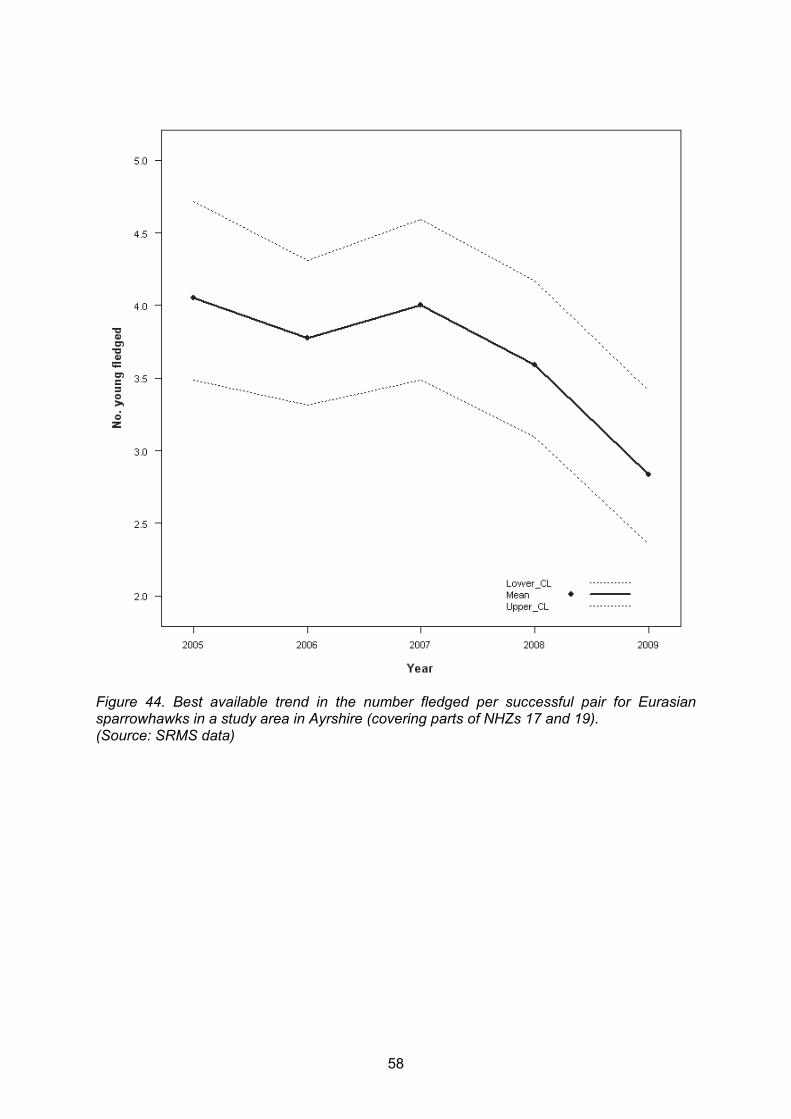
Trends in breeding numbers The best available national trend (from BBS) suggests a small decline in the most recent years (Figure 40). The best available trend in breeding numbers for an Ayrshire study area (spanning NHZs 17 and 19) suggests some increase followed by decrease in the number of breeding pairs since 2003 (Figure 41). See Annex Table B17 for sample sizes available for analysis. Trends in breeding productivity The three best available trends for the Ayrshire study area - clutch size for pairs that laid (Figure 42); fledging success (Figure 43); and the number fledged per successful pair (Figure 44) - all suggest signs of decrease since 2003. Data sources, caveats, work pending and gaps The national trend in breeding abundance from the BTO/JNCC/RSPB Breeding Bird Survey should not be regarded as definitive because sparrowhawks are currently recorded on fewer survey squares in Scotland (Annex Figure A1) than the recommended lower threshold of 30 BBS squares required on an annual basis: a smoothed trend is not produced and statistical significance not currently tested routinely for this species. In addition, we cannot assess for certain to what extent the provisional breeding abundance trend from the BBS is representative of breeding sparrowhawks across Scotland as a whole until up-to-date sparrowhawk distribution data for Scotland are available (from Bird Atlas 2007-11). The other analyses were based on SRMS data for 2003-2009. There are a number of areas of Scotland from which breeding attempts have been reported to the SRMS since 2003 but most have been ad hoc reports of individual breeding attempts. The single study in Ayrshire run by Ian Todd appears to have sufficient systematic annual coverage to permit the reporting of trends in breeding numbers (see Annex Table B17) or breeding parameters (Annex Table B18). There has been some minor variation in coverage across this study area since 2003; hence trends are currently provisional until this can be accounted for in analyses.

53
Figure 39. The location of the Ayrshire Eurasian sparrowhawk study contributing information on trends.
54
Figure 40. Best available trend in the breeding abundance of Eurasian sparrowhawks in Scotland between 1994 and 2010 (relative to index value set at 100 in 1994). Note that sparrowhawks are currently recorded on fewer survey squares in Scotland than the lower threshold of 30 BBS squares routinely required on an annual basis to produce trends, such that a smoothed trend is not currently produced for this species. (Source: BTO/JNCC/RSPB Breeding Bird Survey data)

55
Figure 41. Best available trend in the number of breeding Eurasian sparrowhawks in a study area in Ayrshire (covering parts of NHZs 17 and 19). (Source: SRMS data)
56
Figure 42. Best available trend in clutch size for pairs that laid for Eurasian sparrowhawks in a study area in Ayrshire (covering parts of NHZs 17 and 19). (Source: SRMS data)
57
Figure 43. Best available trend in fledging success (proportion of pairs known to hatch young that fledged at least one young) for Eurasian sparrowhawks in a study area in Ayrshire (covering parts of NHZs 17 and 19). (Source: SRMS data)
58
Figure 44. Best available trend in the number fledged per successful pair for Eurasian sparrowhawks in a study area in Ayrshire (covering parts of NHZs 17 and 19). (Source: SRMS data)
59
1.4.6 Common buzzard
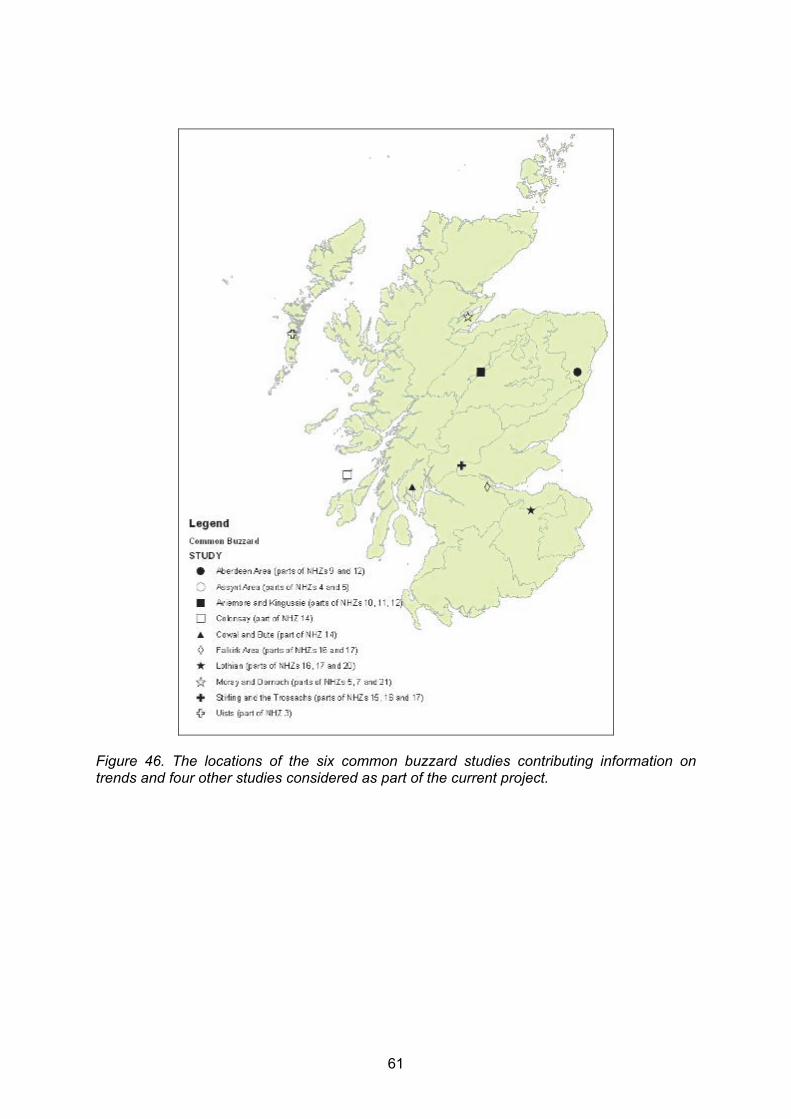
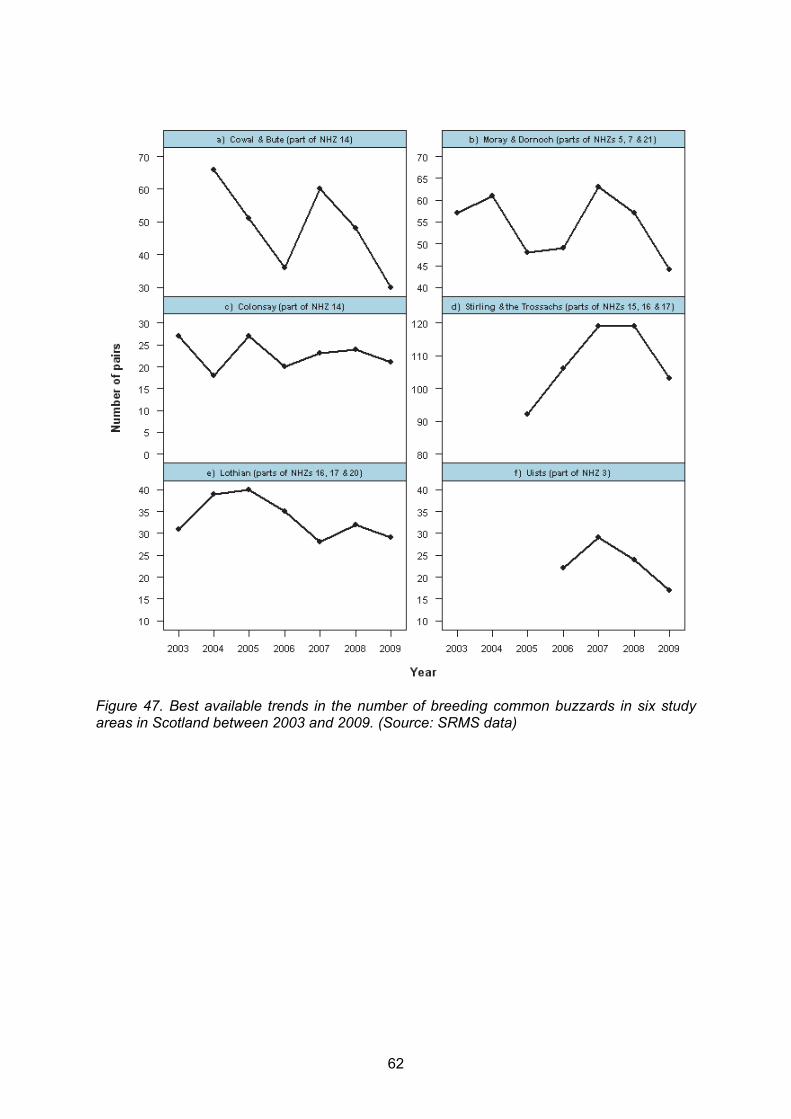
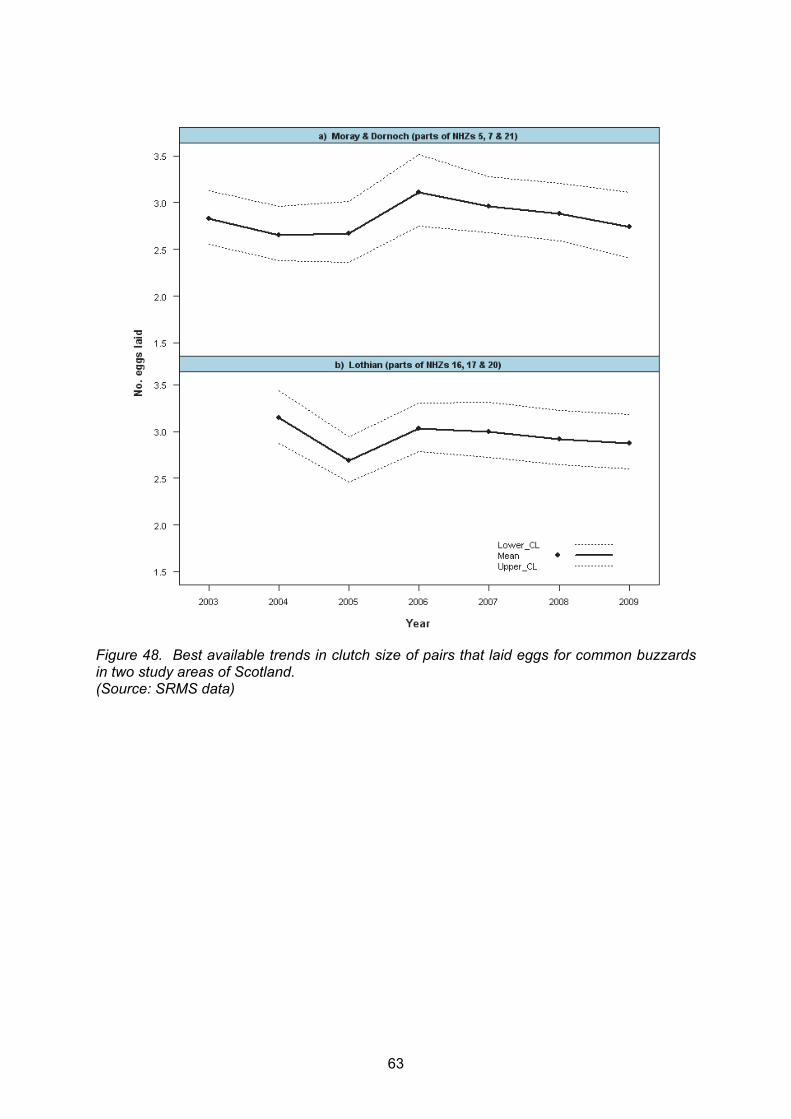
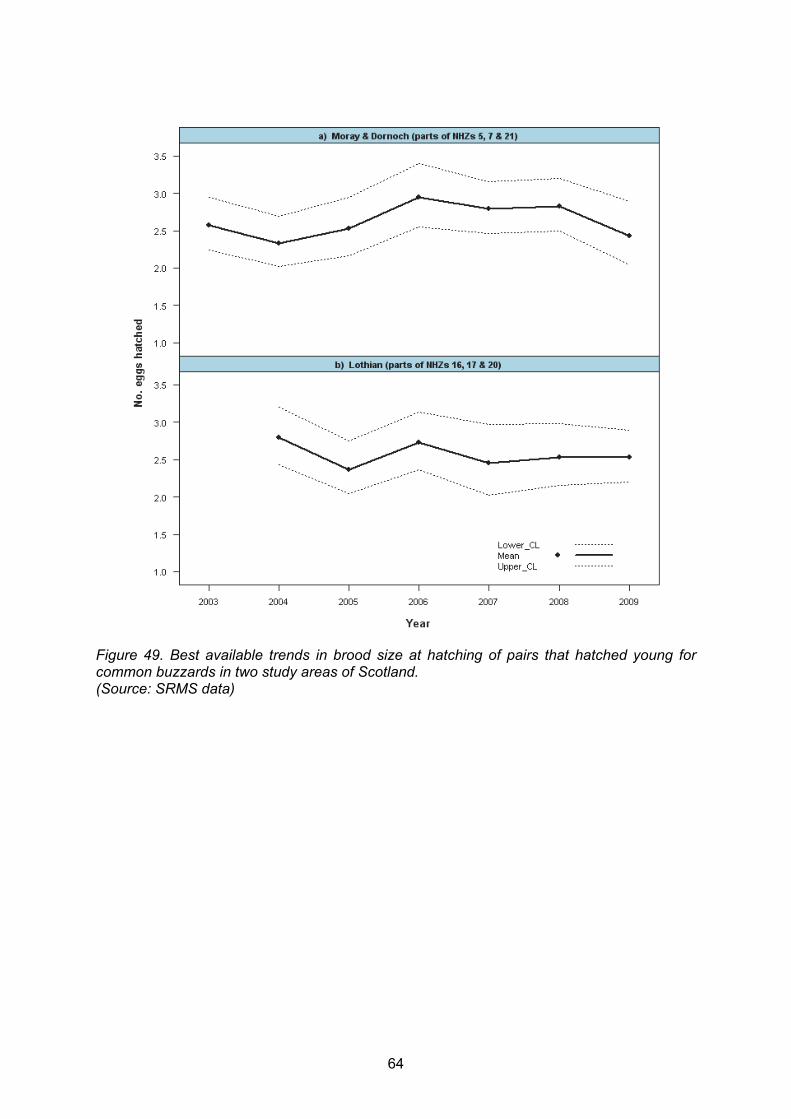
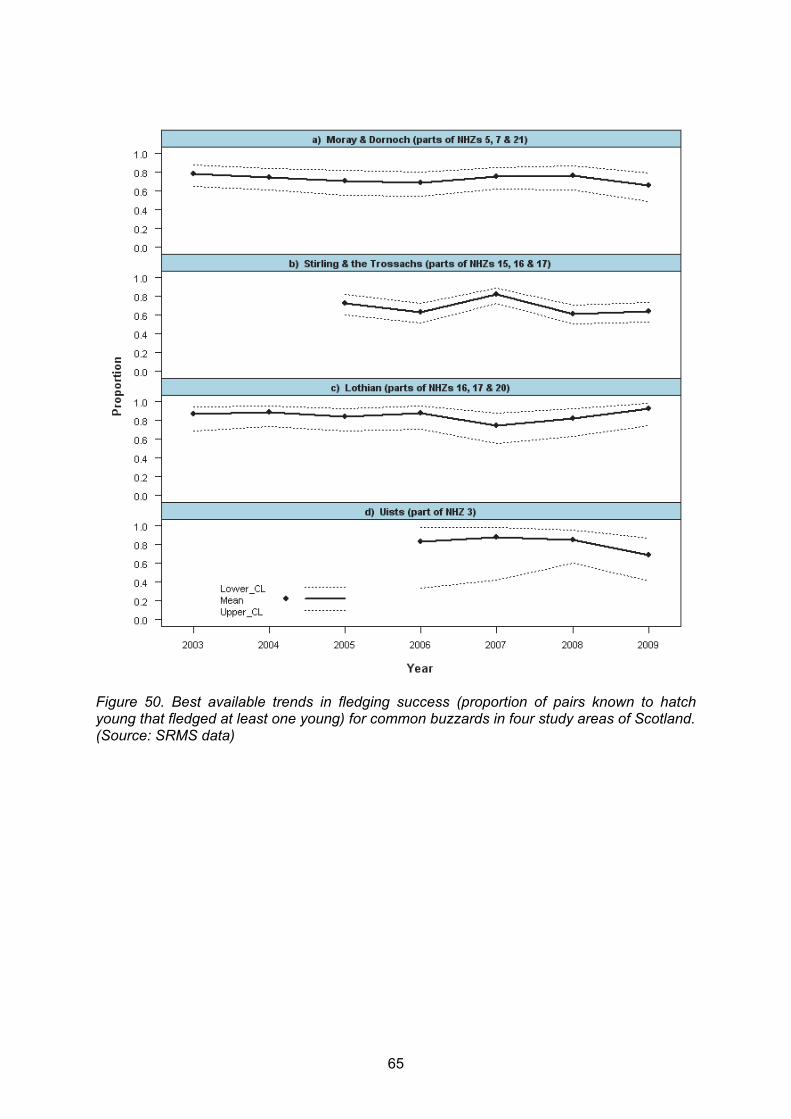
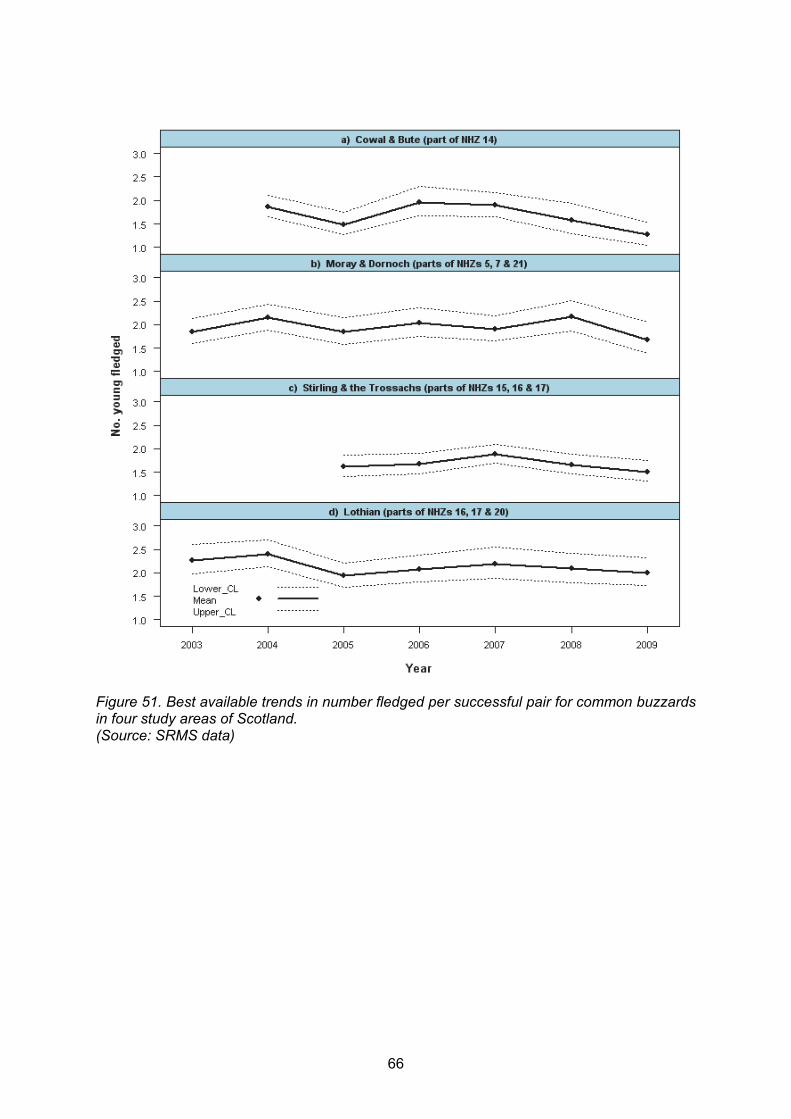
Trends in breeding numbers The national trend in buzzard breeding abundance, from BBS results, (Figure 45) shows a sustained and statistically significant increase between 1994 and 2002, with some degree of stabilisation since 2002. Overall, the abundance index for Scotland increased by 36% (lower and upper confidence limits 11-76%) between 1995 and 2009 (Risely et al. 2011). The best available trends in breeding numbers in the six study areas (Figure 46) across Scotland are highly variable from year to year, showing no consistent trends (Figure 47). The six study areas (Cowal and Bute (part of NHZ 14); Moray and Dornoch (parts of NHZs 5, 7 and 21); Colonsay (part of NHZ 14); Stirling and the Trossachs (parts of NHZs 15, 16, and 17); Lothian (parts of NHZs 16, 17 and 20); and the Uists (part of NHZ 3)) are well spread across Scotland and include both traditional buzzard strongholds and areas of recent population recovery. See Annex Table B19 for sample sizes available for analysis. Trends in breeding productivity In general breeding productivity parameters have been relatively stable in the study areas across recent years. The best available trends in clutch size for pairs that laid (Figure 48) and brood size at hatching for pairs that hatched young (Figure 49) are reported for two of the six study areas, and fledging success (Figure 50) and the number fledged per successful pair (Figure 51) for four of the six study areas. See Annex Table B 20 for sample size information. Data sources, caveats, work pending and gaps Buzzards were recorded in 135 of the 329 squares surveyed for the BTO/JNCC/RSPB Breeding Bird Survey in Scotland in 2010 (Risely et al. 2011; see Annex Figure A2). We consider that the national trend in breeding abundance produced by the BBS may overestimate the overall increase in breeding buzzard numbers across Scotland as a whole because: (i) the survey squares covered are biased towards the areas in which the largest increases have occurred during the last 20 years (Simon Gillings, pers. comm.); and (ii) because BBS methodology is not designed to allow breeding pairs to be distinguished from non-breeding ‘floaters’, numbers of which may not vary in direct proportion to the numbers of breeding pairs in a population. The other analyses were based on SRMS data for 2003-2009. Initial scoping of the SRMS datasets suggested that 10 widely distributed buzzard studies had the potential to be used in trend analyses. Some of these studies have been initiated relatively recently however, or include only a small sample of nests for several years, and thus it was only possible to report trends in numbers and breeding parameters from six of these studies. For three of these studies, the number of years included in trends analysis was restricted due to low sample sizes in the early years of the studies (see Annex Table B19). Trends from the six study areas must be regarded as provisional until annual coverage and effort is verified with the relevant observers. For example, in the study area on the Uists, the number of monitored nest sites decreased in 2009 (Annex Table B19) due to lack of monitoring on the island of Barra and outlying islands, whilst the core part of the study on the Uists appears to have been comprehensive in all years. For the Cowal and Bute study, the lower number of monitored nest sites in 2006 is probably due to an almost complete lack of coverage on mainland Argyll, whereas coverage of the Isle of Bute appears to have been comprehensive from 2004 to 2009. Conversely, for the study in Stirling and the Trossachs, visual inspection of the year-specific maps suggests that the increasing number of monitored nest sites is due to a shorter distance between neighbouring nests but we need to verify with observers whether this is due to population increase, leading to smaller territories, or increased monitoring effort.

60
Given the number of and geographical spread of studies of common buzzard that submit data to the SRMS currently (Annex Table B19), national trends should be possible in future once we have an improved picture of monitoring coverage.
Figure 45. Trend in the breeding abundance of common buzzard in Scotland between 1994 and 2010 (relative to index value set to 100 in 1994). Both the annual index values, and the smoothed index with associated 95% confidence limits, are shown. (Source: BTO/JNCC/RSPB Breeding Bird Survey data)
61
Figure 46. The locations of the six common buzzard studies contributing information on trends and four other studies considered as part of the current project.
62
Figure 47. Best available trends in the number of breeding common buzzards in six study areas in Scotland between 2003 and 2009. (Source: SRMS data)
63
Figure 48. Best available trends in clutch size of pairs that laid eggs for common buzzards in two study areas of Scotland. (Source: SRMS data)
64
Figure 49. Best available trends in brood size at hatching of pairs that hatched young for common buzzards in two study areas of Scotland. (Source: SRMS data)
65
Figure 50. Best available trends in fledging success (proportion of pairs known to hatch young that fledged at least one young) for common buzzards in four study areas of Scotland. (Source: SRMS data)
66
Figure 51. Best available trends in number fledged per successful pair for common buzzards in four study areas of Scotland. (Source: SRMS data)

67
1.4.7 Golden eagle
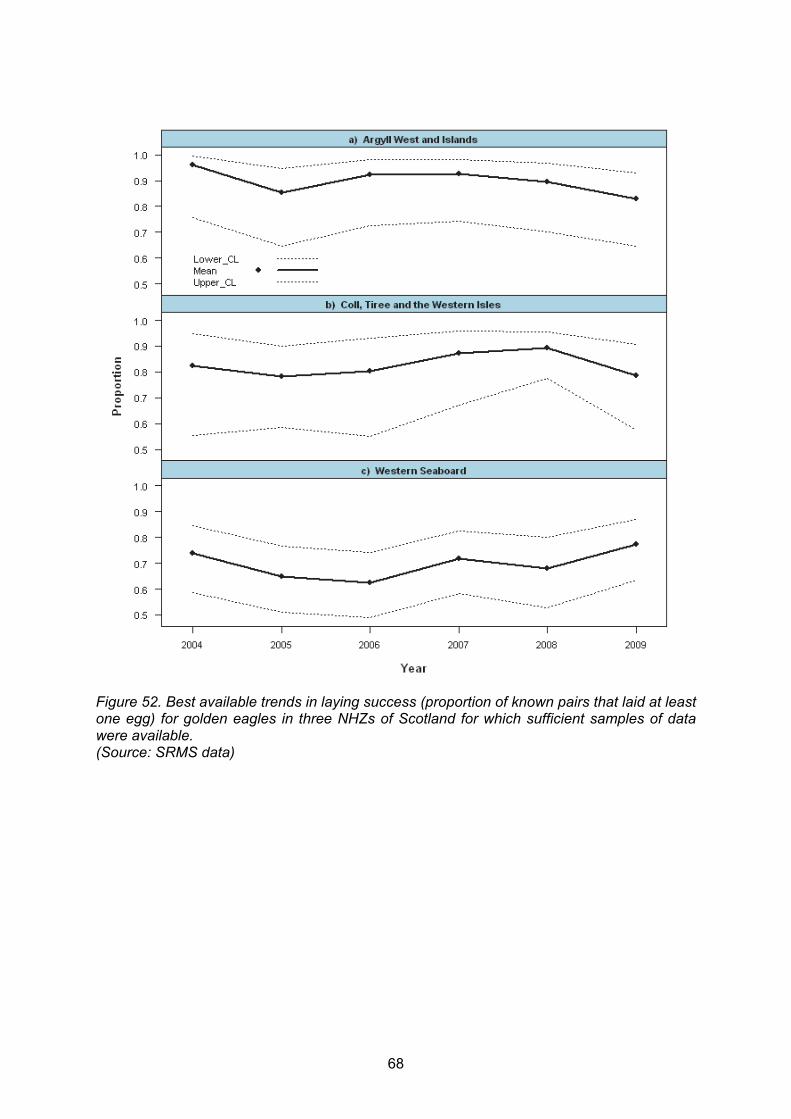
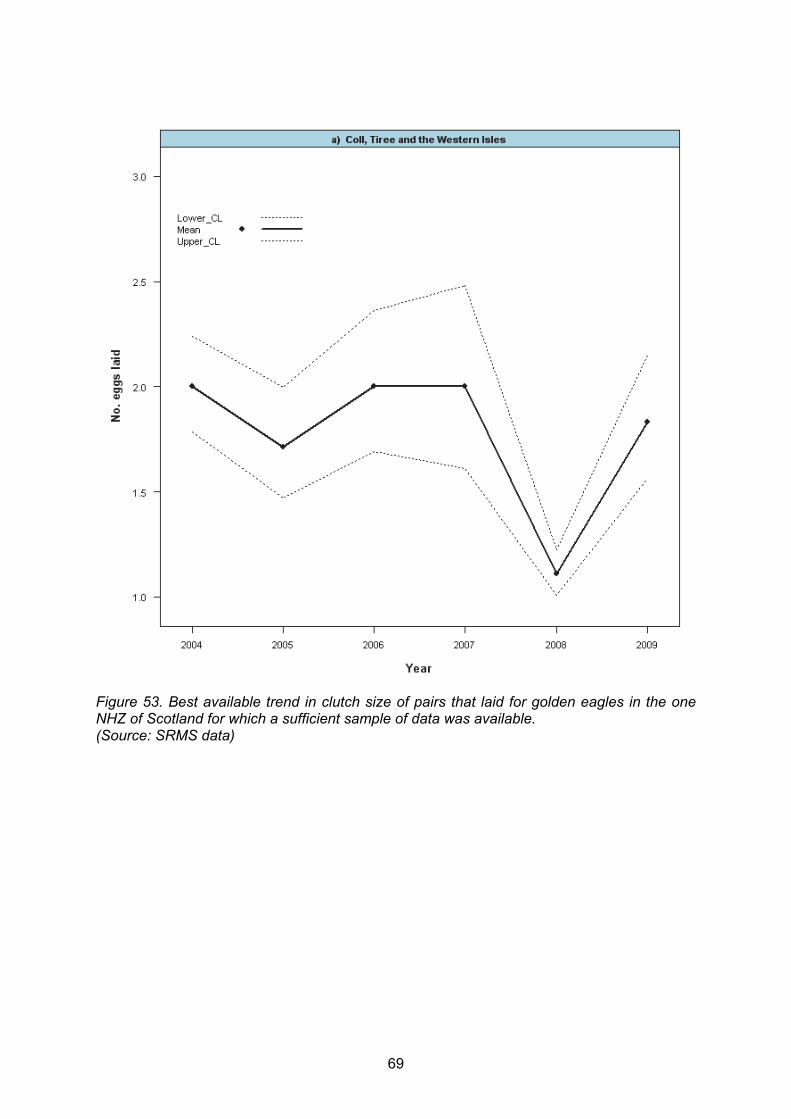
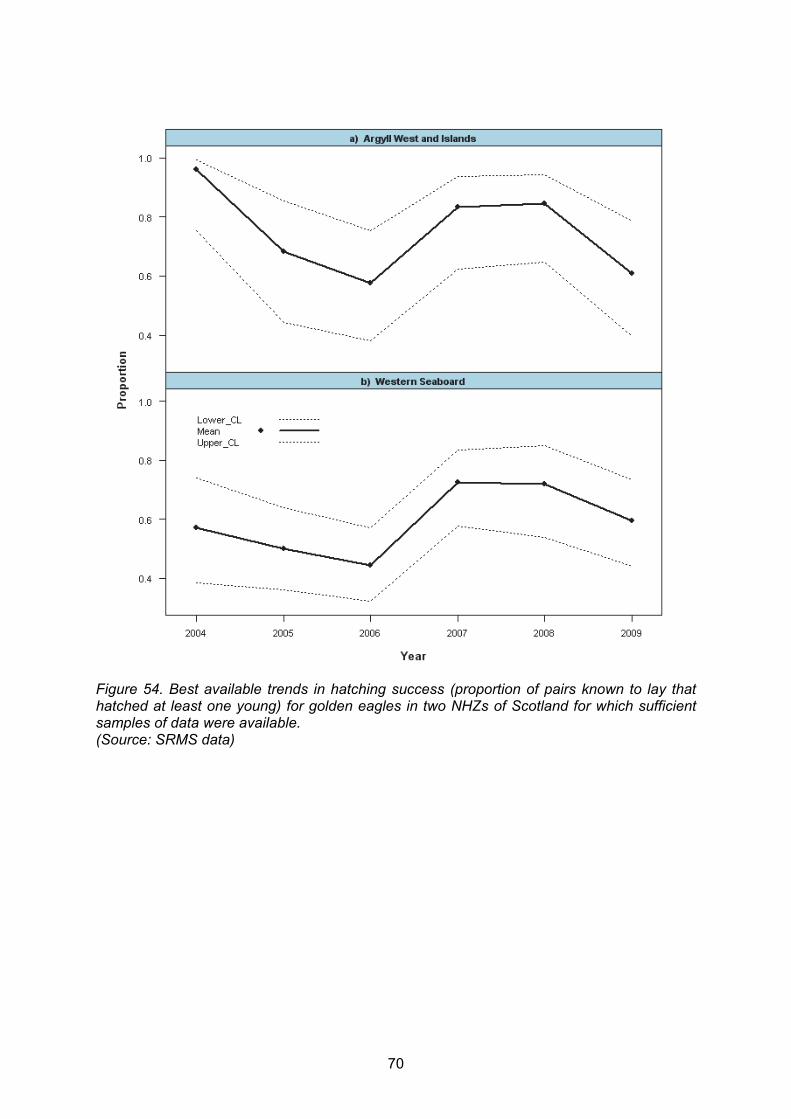
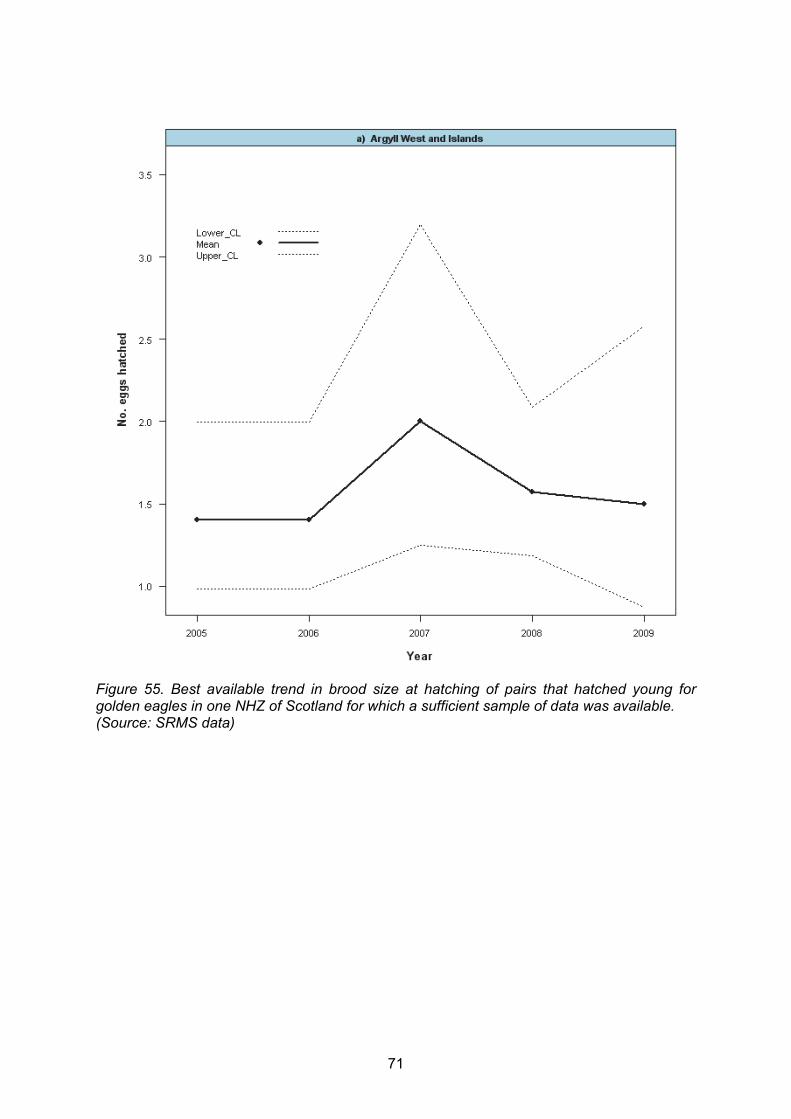
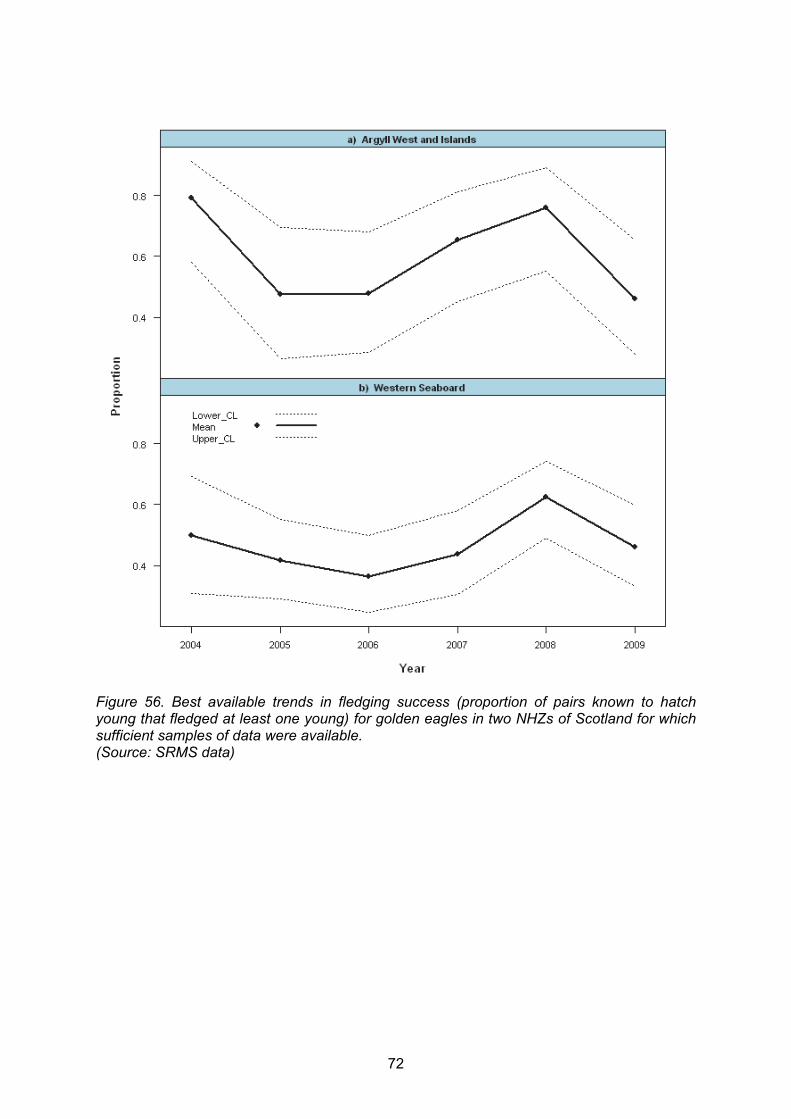
Trends in breeding numbers Trends in breeding numbers cannot be reported until further work to quantify coverage and compare this to current knowledge of the Scottish distribution is complete (see below). Trends in breeding productivity None of the breeding productivity measures shows any systematic trend over the duration of the SRMS. Best available trends in laying success for three NHZs (Figure 52), clutch size of those pairs that laid for one NHZ (Figure 53), hatching success for two NHZs (Figure 54), brood size at hatching for those pairs hatching young for one NHZ (Figure 55), fledging success for two NHZs (Figure 56) and proportion fledging twins for one NHZ (Figure 57) are reported. Data sources, caveats, work pending and gaps Analyses were based on the 1,626 site-year records that were attributable to individual NHZs within the SRMS dataset for 2003-2009 (information was largely provided in summary form only in 2003). We were able to link 648 of these records to grid references and assign them to NHZs using site codes, site names and information supplied for the golden eagle Conservation Framework (Annex Table B 21). A comparison of the numbers of ranges that were known and active during the 2003 national survey (Whitfield et al. 2007) with numbers surveyed and information submitted to the SRMS in 2004-2009 is provided in Annex Table B22. It was not feasible to produce trends in breeding numbers until two further pieces of work can be carried out: (a) to obtain coverage/effort information from observers that submit records to the SRMS; and (b) to compare that annual monitoring coverage to our best knowledge of the current distribution and abundance of golden eagles in Scotland (and in each NHZ; this should be available following the next national survey planned for 2015. It is not possible to identify key monitoring gaps with certainty until the above work is undertaken. We have reported provisional trends in breeding parameters for up to five NHZs for which samples of at least five appropriate records exist for each parameter in each year (see Annex Table B23 for sample sizes). Many NHZs appear to have good sampling coverage on an annual basis and we have flagged six NHZs as likely to require further careful consideration because coverage of these is relatively poorer on an annual basis. Previous work to assess possible sampling strategies for annual monitoring of golden eagles in Scotland based on breeding data from intensively surveyed areas of Argyll, Mull, Lochaber and Skye suggested that (for monitoring trends in the mean number of young fledged per annum) a sample of around 40% of ranges covered gave an optimal balance between precision and practical effort (there was little additional precision to be gained by sampling more ranges annually based on that data set; see Annex C). Given the number and distribution of golden eagle records submitted to the SRMS annually since 2003 (Annex Table B 22), it should be possible to produce national trends in future once a clearer picture of annual monitoring coverage in relation to overall Scottish distribution is available.
68
Figure 52. Best available trends in laying success (proportion of known pairs that laid at least one egg) for golden eagles in three NHZs of Scotland for which sufficient samples of data were available. (Source: SRMS data)
69
Figure 53. Best available trend in clutch size of pairs that laid for golden eagles in the one NHZ of Scotland for which a sufficient sample of data was available. (Source: SRMS data)
70
Figure 54. Best available trends in hatching success (proportion of pairs known to lay that hatched at least one young) for golden eagles in two NHZs of Scotland for which sufficient samples of data were available. (Source: SRMS data)
71
Figure 55. Best available trend in brood size at hatching of pairs that hatched young for golden eagles in one NHZ of Scotland for which a sufficient sample of data was available. (Source: SRMS data)
72
Figure 56. Best available trends in fledging success (proportion of pairs known to hatch young that fledged at least one young) for golden eagles in two NHZs of Scotland for which sufficient samples of data were available. (Source: SRMS data)

73
Figure 57. Best available trend in the proportion of pairs fledging twins for golden eagles in one Scottish NHZ for which a sufficient sample of data was available. (Source: SRMS data)
74
1.4.8 Common kestrel
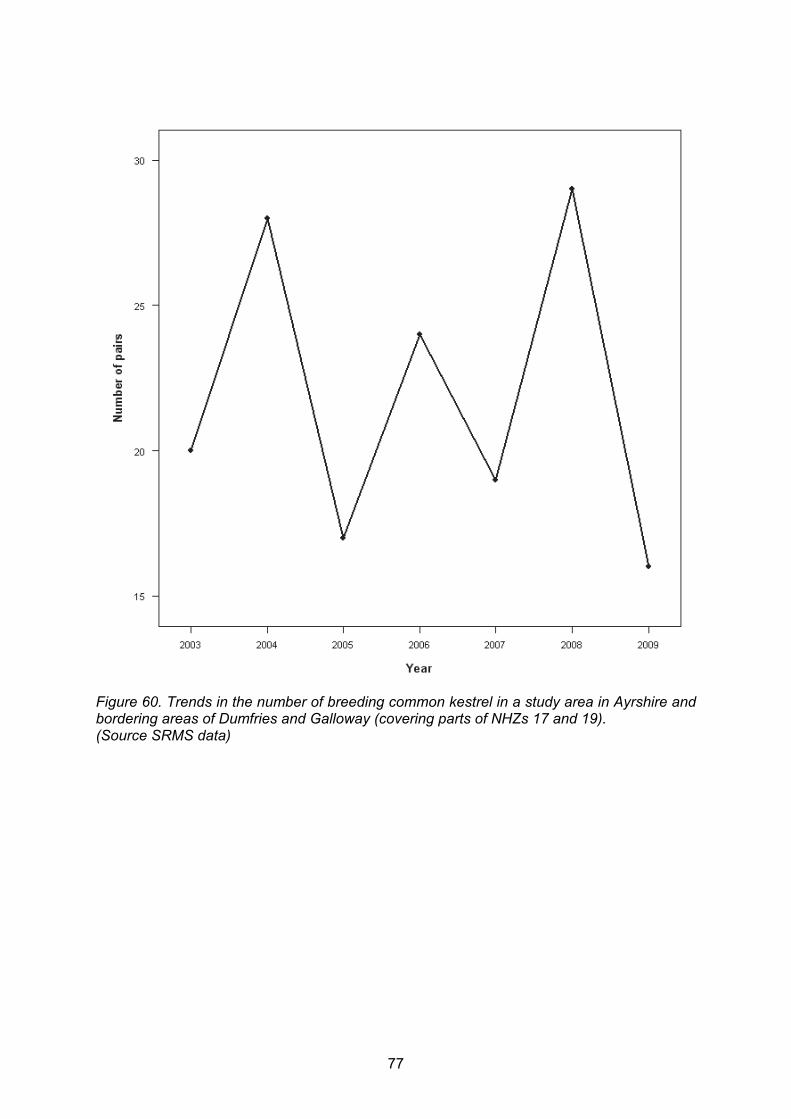
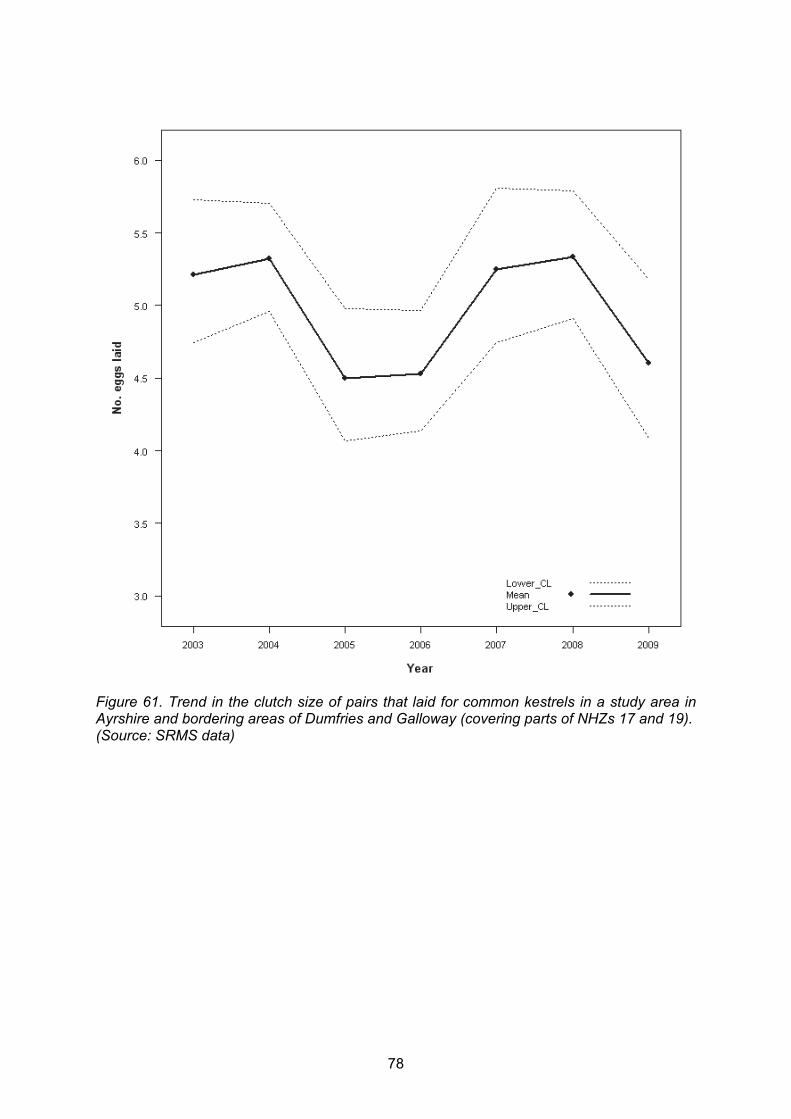
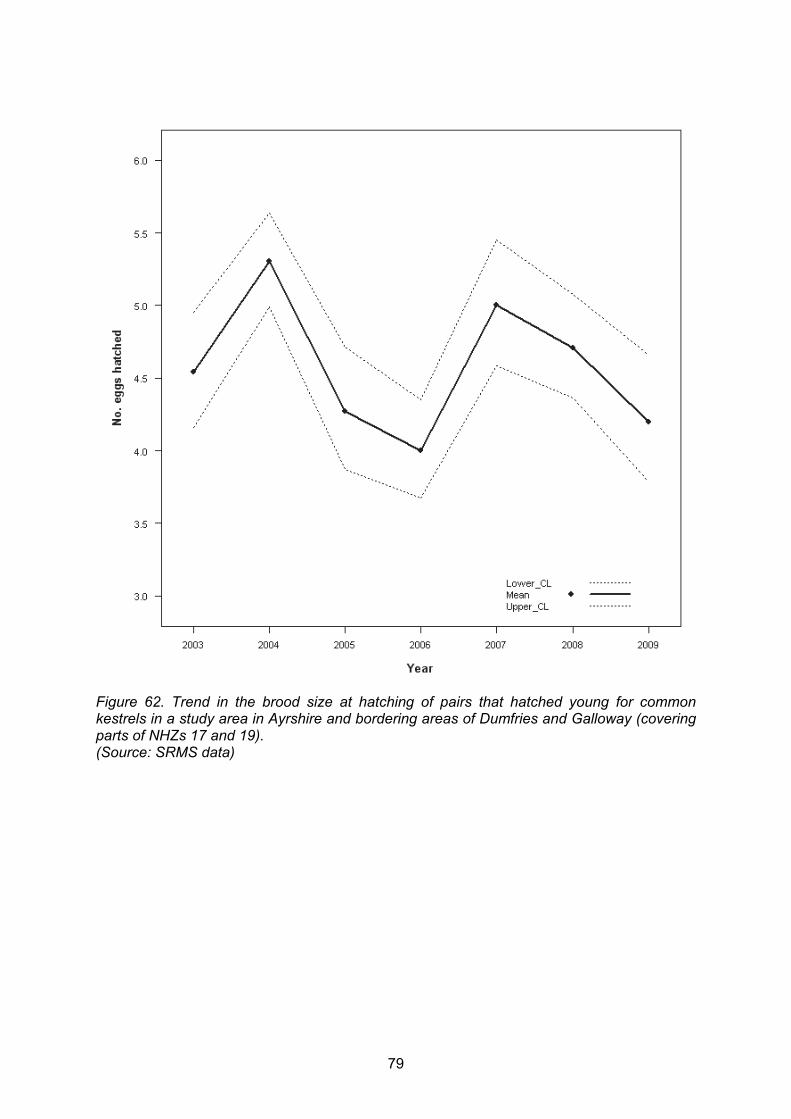
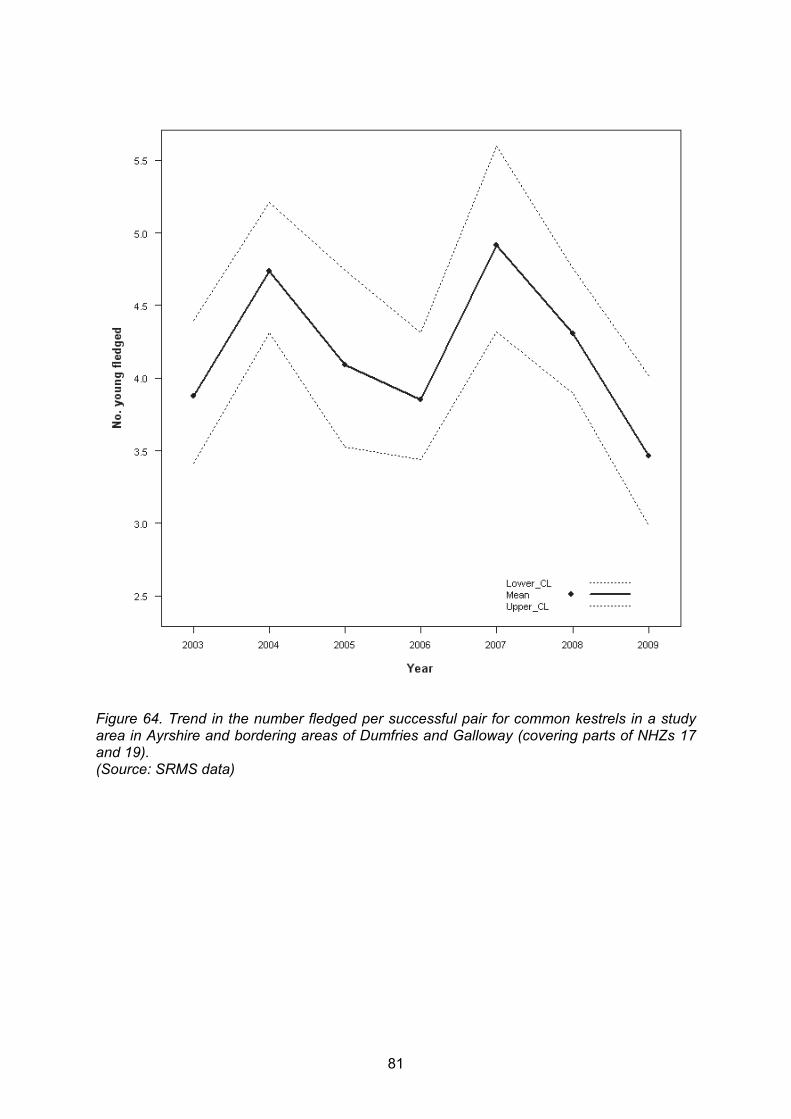
Trends in breeding numbers The national trend, from BBS results, in kestrel breeding abundance (Figure 59) shows a sustained and statistically significant decrease since 1994. Overall, the abundance index for Scotland decreased by 58% (lower and upper confidence limits -73 and -36%) between 1995 and 2009 (Risely et al. 2011). Kestrel breeding numbers in the Ayrshire study area have shown fluctuations between years since 2003, related to annual changes in vole abundance (Riddle 2011) and 2009 saw the lowest number of pairs recorded since 2003 (Figure 60). A trend in breeding numbers is reported from one study area in Ayrshire (and the border with Dumfries and Galloway; covering parts of NHZs 17 and 19; Figure 60). See Annex Table B24 for sample sizes available for analyses. Trends in breeding productivity Results for the single study area (Ayrshire) show marked annual fluctuations for the breeding productivity, related to vole abundance (Riddle 2011). No systematic trend since 2003 is apparent. Trends in the clutch size of pairs that laid (Figure 61), brood size at hatching of pairs that hatched young (Figure 62), fledging success (Figure 63), and the number fledged per successful pair (Figure 64) are reported for the Ayrshire study area. See Annex Table B25 for sample sizes. . Data sources, caveats, work pending and gaps Kestrels were recorded in 42 of the 329 squares surveyed for the BTO/JNCC/RSPB Breeding Bird Survey in Scotland in 2010 (Risely et al. 2011; Annex Figure A3). The national trend in breeding abundance produced by the BBS may not be representative of that for Scotland as a whole because the sample of squares in which kestrels are recorded is biased towards lowland areas of Scotland; this should be assessed further once updated information on distribution and spatial variation in relative abundance is available from the Bird Atlas 2007-11 project. The other analyses were based on SRMS data for 2003-2009. There are a number of areas of Scotland from which kestrel breeding attempts have been reported to the SRMS since 2003 but many have been ad hoc reports of individual breeding attempts that do not lend themselves to trend analysis. Trends from the Ayrshire study run by Gordon Riddle are robust and data for years prior to 2003 may be available for analysis in the future. More details on the Ayrshire study can be found in Riddle (2011). There are at least two other studies that might provide trend information in future once coverage and effort have been further assessed (Annex Table B25).

75
Figure 58. The location of the Ayrshire common kestrel study contributing information on trends.

76
Figure 59. Trend in the breeding abundance of kestrels in Scotland between 1994 and 2010 (relative to index value set to 100 in 1994). Both the annual index values, and the smoothed index with associated 95% confidence limits, are shown. (Source: BTO/JNCC/RSPB Breeding Bird Survey data)
77
Figure 60. Trends in the number of breeding common kestrel in a study area in Ayrshire and bordering areas of Dumfries and Galloway (covering parts of NHZs 17 and 19). (Source SRMS data)
78
Figure 61. Trend in the clutch size of pairs that laid for common kestrels in a study area in Ayrshire and bordering areas of Dumfries and Galloway (covering parts of NHZs 17 and 19). (Source: SRMS data)
79
Figure 62. Trend in the brood size at hatching of pairs that hatched young for common kestrels in a study area in Ayrshire and bordering areas of Dumfries and Galloway (covering parts of NHZs 17 and 19). (Source: SRMS data)

80
Figure 63. Trend in fledging success (proportion of pairs known to hatch young that fledged at least one young) for common kestrels in a study area in Ayrshire and bordering areas of Dumfries and Galloway (covering parts of NHZs 17 and 19). (Source: SRMS data)
81
Figure 64. Trend in the number fledged per successful pair for common kestrels in a study area in Ayrshire and bordering areas of Dumfries and Galloway (covering parts of NHZs 17 and 19). (Source: SRMS data)
82
1.4.9 Merlin
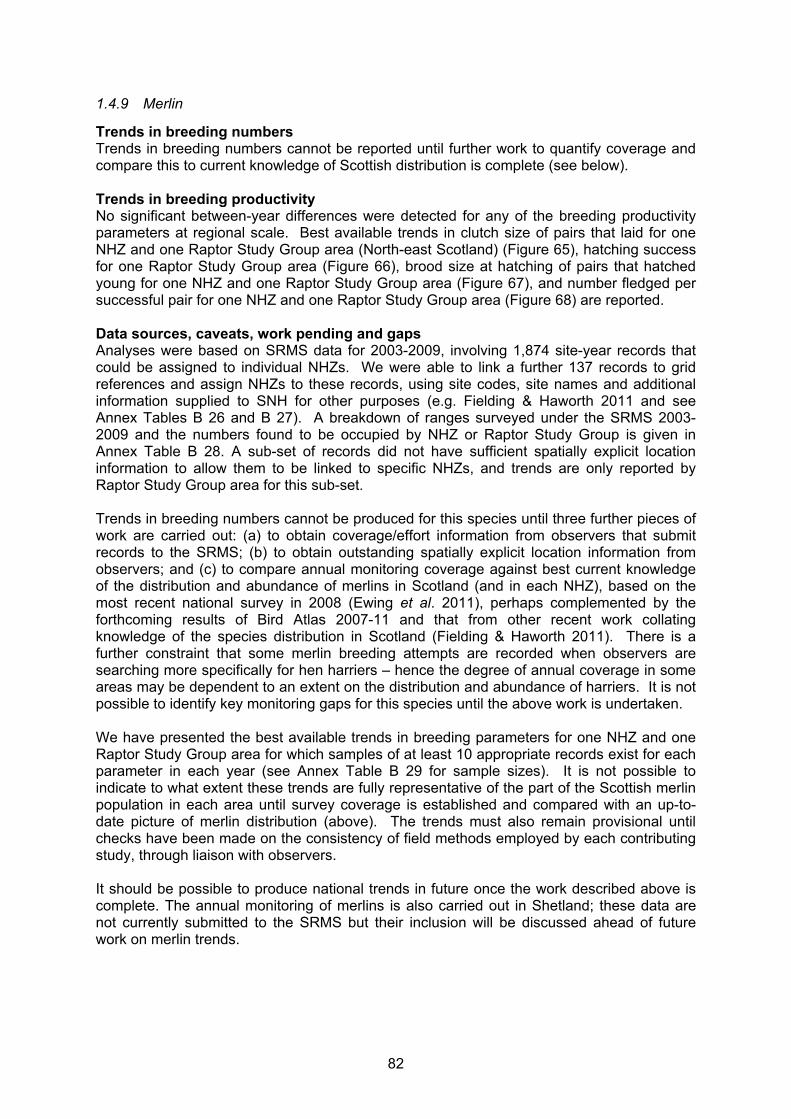
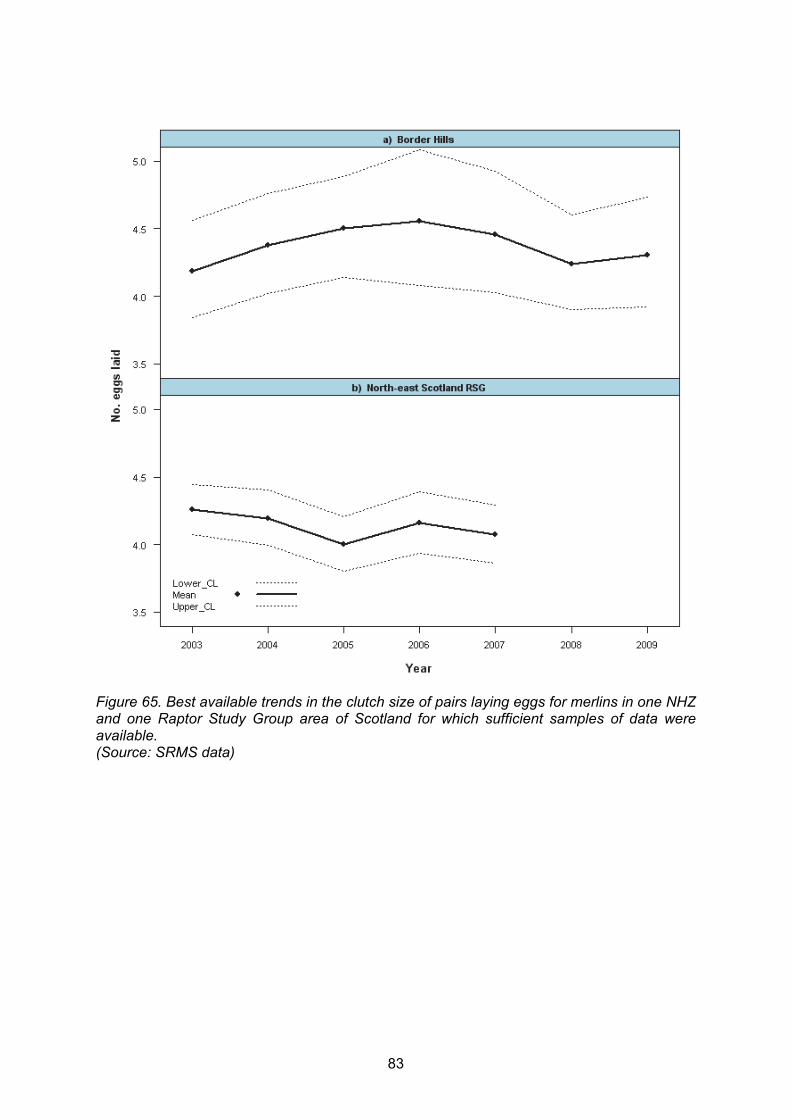
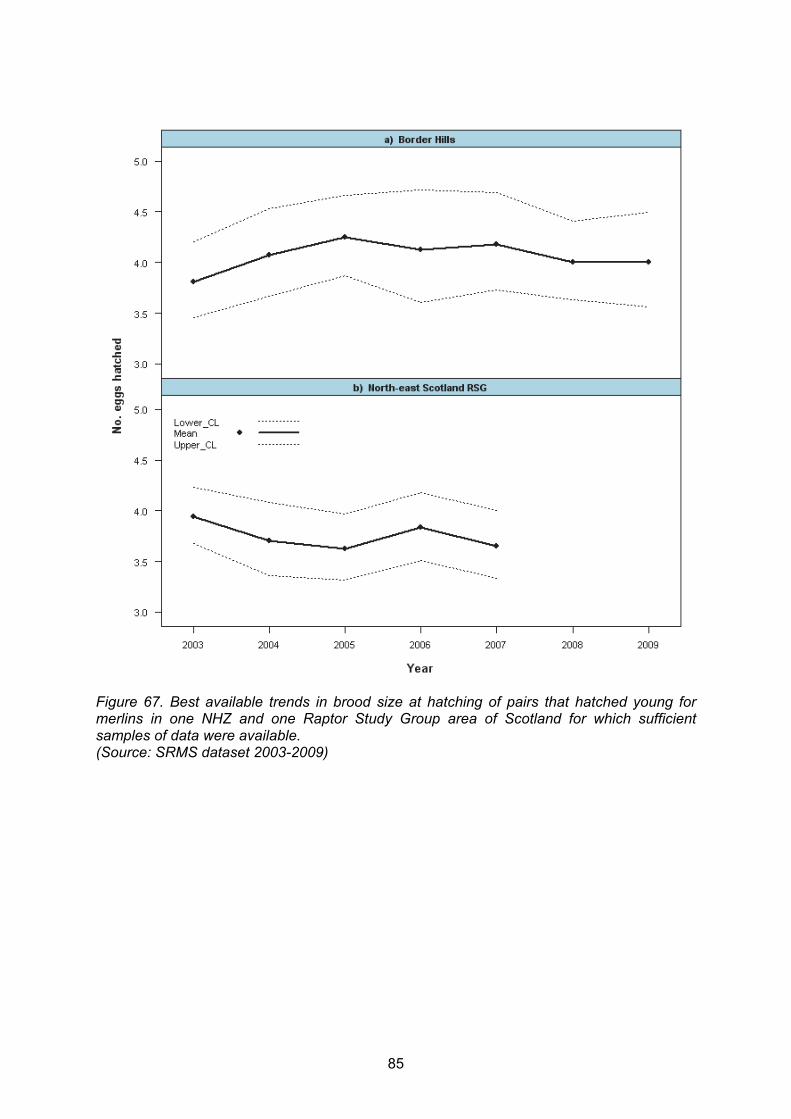
Trends in breeding numbers Trends in breeding numbers cannot be reported until further work to quantify coverage and compare this to current knowledge of Scottish distribution is complete (see below). Trends in breeding productivity No significant between-year differences were detected for any of the breeding productivity parameters at regional scale. Best available trends in clutch size of pairs that laid for one NHZ and one Raptor Study Group area (North-east Scotland) (Figure 65), hatching success for one Raptor Study Group area (Figure 66), brood size at hatching of pairs that hatched young for one NHZ and one Raptor Study Group area (Figure 67), and number fledged per successful pair for one NHZ and one Raptor Study Group area (Figure 68) are reported. Data sources, caveats, work pending and gaps Analyses were based on SRMS data for 2003-2009, involving 1,874 site-year records that could be assigned to individual NHZs. We were able to link a further 137 records to grid references and assign NHZs to these records, using site codes, site names and additional information supplied to SNH for other purposes (e.g. Fielding & Haworth 2011 and see Annex Tables B 26 and B 27). A breakdown of ranges surveyed under the SRMS 2003-2009 and the numbers found to be occupied by NHZ or Raptor Study Group is given in Annex Table B 28. A sub-set of records did not have sufficient spatially explicit location information to allow them to be linked to specific NHZs, and trends are only reported by Raptor Study Group area for this sub-set. Trends in breeding numbers cannot be produced for this species until three further pieces of work are carried out: (a) to obtain coverage/effort information from observers that submit records to the SRMS; (b) to obtain outstanding spatially explicit location information from observers; and (c) to compare annual monitoring coverage against best current knowledge of the distribution and abundance of merlins in Scotland (and in each NHZ), based on the most recent national survey in 2008 (Ewing et al. 2011), perhaps complemented by the forthcoming results of Bird Atlas 2007-11 and that from other recent work collating knowledge of the species distribution in Scotland (Fielding & Haworth 2011). There is a further constraint that some merlin breeding attempts are recorded when observers are searching more specifically for hen harriers – hence the degree of annual coverage in some areas may be dependent to an extent on the distribution and abundance of harriers. It is not possible to identify key monitoring gaps for this species until the above work is undertaken. We have presented the best available trends in breeding parameters for one NHZ and one Raptor Study Group area for which samples of at least 10 appropriate records exist for each parameter in each year (see Annex Table B 29 for sample sizes). It is not possible to indicate to what extent these trends are fully representative of the part of the Scottish merlin population in each area until survey coverage is established and compared with an up-to-date picture of merlin distribution (above). The trends must also remain provisional until checks have been made on the consistency of field methods employed by each contributing study, through liaison with observers. It should be possible to produce national trends in future once the work described above is complete. The annual monitoring of merlins is also carried out in Shetland; these data are not currently submitted to the SRMS but their inclusion will be discussed ahead of future work on merlin trends.
83
Figure 65. Best available trends in the clutch size of pairs laying eggs for merlins in one NHZ and one Raptor Study Group area of Scotland for which sufficient samples of data were available. (Source: SRMS data)
84
Figure 66. Best available trend in hatching success (proportion of pairs known to lay that hatched at least one young) for merlins in one Raptor Study Group area of Scotland for which a sufficient sample of data was available. (Source: SRMS data)
85
Figure 67. Best available trends in brood size at hatching of pairs that hatched young for merlins in one NHZ and one Raptor Study Group area of Scotland for which sufficient samples of data were available. (Source: SRMS dataset 2003-2009)

86
Figure 68. Best available trends in number of young fledged per successful pair for merlins in one NHZ and one Raptor Study Group area of Scotland for which sufficient samples of data were available. (Source: SRMS dataset 2003-2009)
87
1.4.10 Peregrine falcon
Trends in breeding numbers In most of the NHZs for which best available trends can be reported, breeding numbers have shown only minor changes (and are generally stable or increasing) since 2003 (Figure 70). There are suggestions of decreases in the Cairngorm Massif and North East Glens (NHZs 11 and 12), and perhaps Loch Lomond, the Trossachs and Breadalbane (NHZ 15) and the Western Southern Uplands and Inner Solway (NHZ 19). Trends in breeding numbers are reported for 11 NHZs or parts of NHZs (Figure 69): the North-east Coastal Plain (NHZ 9); the Cairngorm Massif (NHZ 11) and a separate trend for the Tayside sub-area of NHZ 11; the southern part of the North-east Glens (part of NHZ 12); the Cowal (part of NHZ 14); Loch Lomond, the Trossachs and Breadalbane (NHZ 15); the Eastern Lowlands (NHZ 16); the West Central Belt (NHZ 17); Wigtown Machairs and Outer Solway Coast (NHZ 18); Western Southern Uplands and Inner Solway (NHZ 19); and Border Hills (NHZ 20). Sample sizes available for analyses are given in Annex Table B 30. Together these NHZs cover a large part of the species’ range in Scotland, with the exception that the far north and west of mainland Scotland and the outer islands are not represented in the regional trends available to date. Trends in breeding productivity None of the provisional trends in breeding productivity parameters shows significant systematic change since 2003. Best available trends in the clutch size of laying pairs for three NHZs (Figure 71), hatching success for three NHZs (Figure 72), brood size at hatching of pairs that hatch young for two NHZs (Figure 73), fledging success for seven NHZs or part of NHZs (Figure 74) and the number fledged per successful pair for eight NHZs or part of NHZs (Figure 75) are reported. Sample sizes available for analyses are given in Annex Table B 31. The information available on fledging success and numbers fledged covers a moderate part of the species’ range in Scotland (with comprehensive coverage of central and southern Scotland), but areas further north, the far north and west of mainland Scotland, and the outer islands are not represented in the regional trends available to date. Data sources, caveats, work pending and gaps Analyses were based on SRMS data for 2003-2009. We assessed the extent to which annual coverage in each NHZ is representative of each NHZ as a whole (Annex Table B 32) by comparison with results from the 2002 National Survey dataset (including enhanced geo-referencing based on the peregrine Conservation Framework dataset). Although NHZ 11 had large enough sample sizes, the spatial coverage of the monitoring appeared to change between years, and we considered that rigorous trend analyses could only be carried out for a subset of the NHZ 11 data (termed Tayside NHZ 11; see Figure 69). Based on our current understanding of annual survey coverage for this species, we consider that caveats should be attached to trends from the following study areas: NHZ 9: Trends in numbers are probably generally representative for the years 2003-
2008. No records were received for 2009 by the time of data compilation for this project.
NHZ 11: Poor coverage in the northern part of the NHZ in 2009. Tayside NHZ 11: Relatively consistent coverage across years, but the study area only
covers approximately one-third of the whole NHZ. Southern NHZ 12: Relatively consistent coverage across years, but the study area
only covers approximately 50% of the whole NHZ. Cowal NHZ 14: Only part of the mainland (Cowal) is covered consistently each year.
The trends for this species should be regarded as provisional until between-year variation in coverage and survey effort has been assessed further in liaison with observers. Coverage

88
should also be compared with the results of the 2014 national peregrine survey. Once this further work has been carried out, it should be feasible to produce national trends.
Figure 69. Potential NHZs and areas within NHZs from which trends in peregrine breeding numbers and breeding parameters might be produced from SRMS data 2003-2009. Further assessment revealed that sample sizes were too small for trend analyses for some of these study areas.
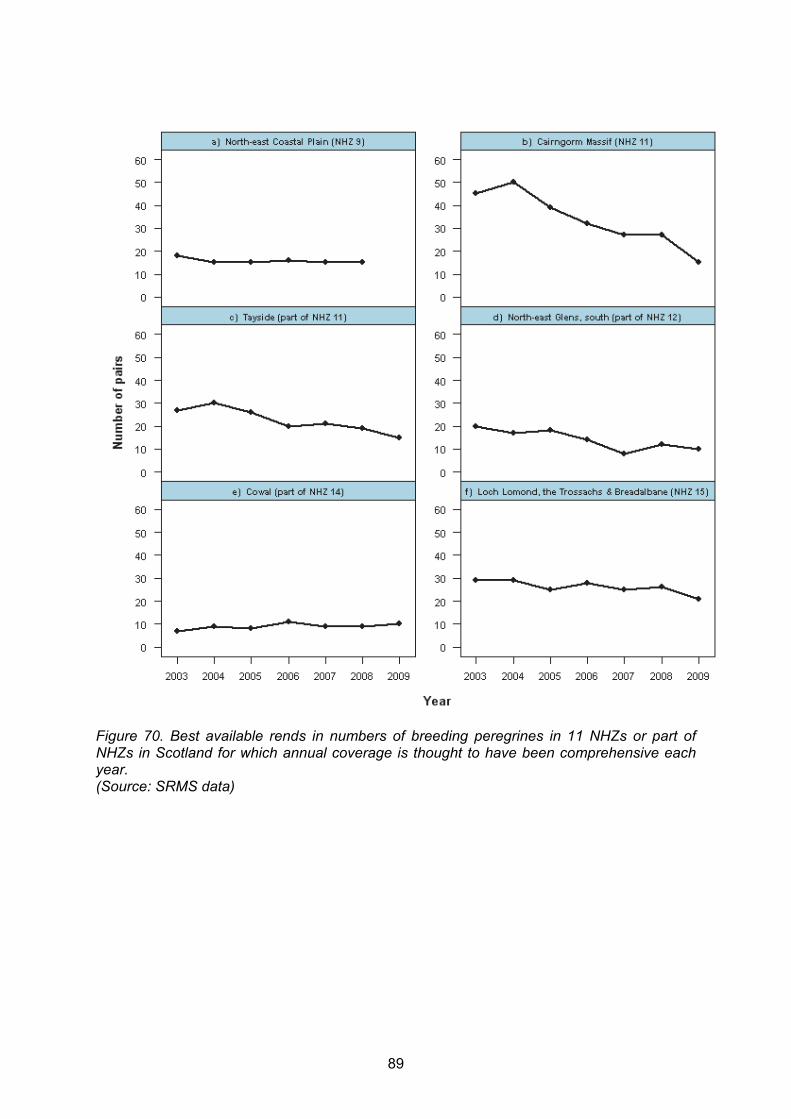
89
Figure 70. Best available rends in numbers of breeding peregrines in 11 NHZs or part of NHZs in Scotland for which annual coverage is thought to have been comprehensive each year. (Source: SRMS data)
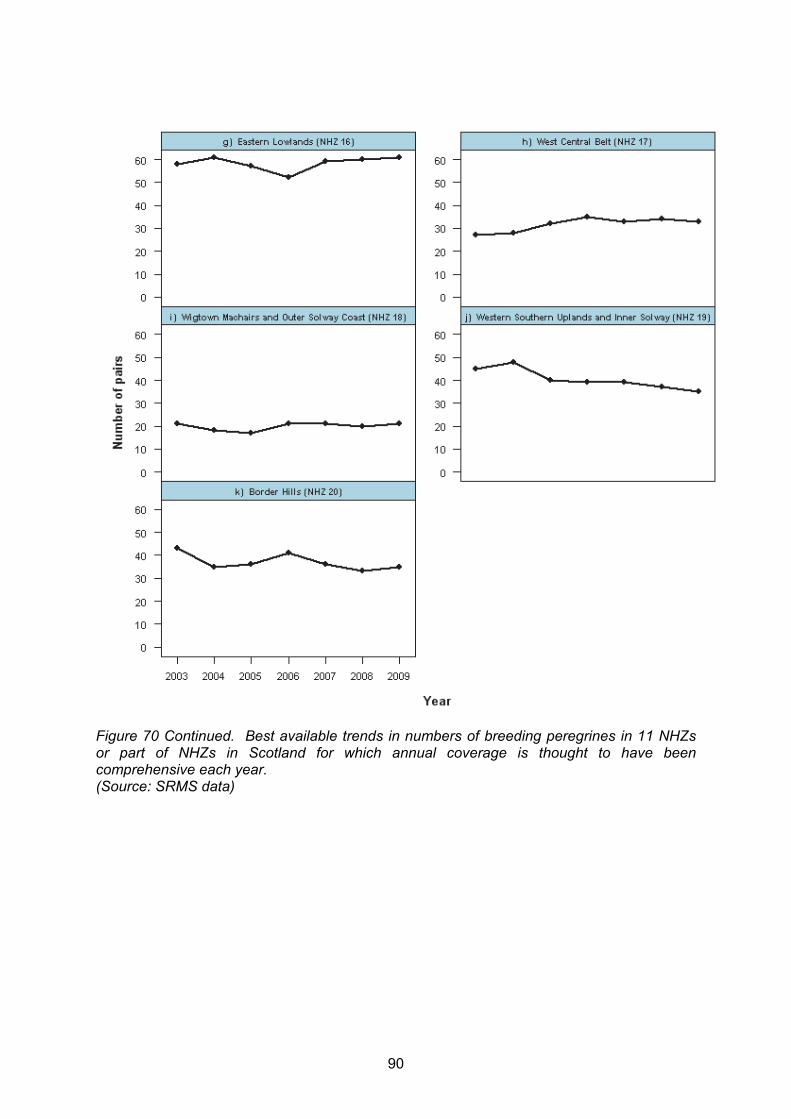
90
Figure 70 Continued. Best available trends in numbers of breeding peregrines in 11 NHZs or part of NHZs in Scotland for which annual coverage is thought to have been comprehensive each year. (Source: SRMS data)
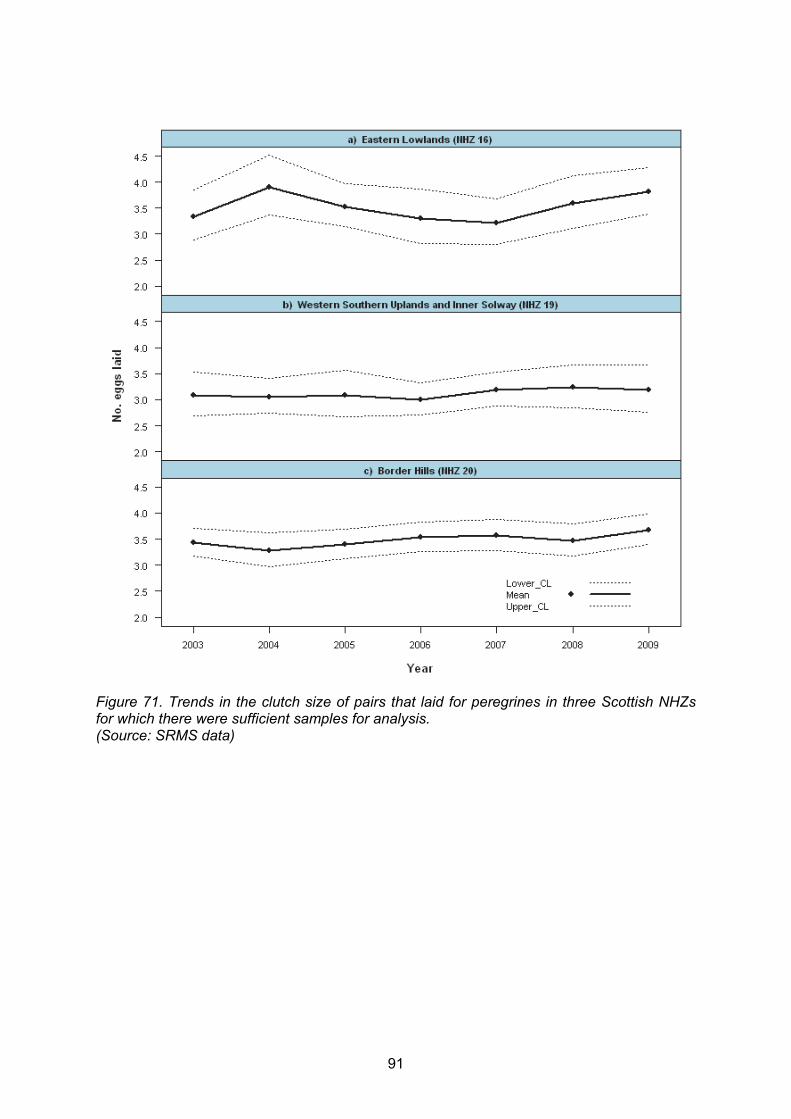
91
Figure 71. Trends in the clutch size of pairs that laid for peregrines in three Scottish NHZs for which there were sufficient samples for analysis. (Source: SRMS data)

92
Figure 72. Trends in hatching success (proportion of pairs known to lay that hatched at least one young) for peregrines in three Scottish NHZs for which there were sufficient samples for analysis. (Source: SRMS data)

93
Figure 73. Trends in brood size at hatching of pairs that hatched young for peregrines in two Scottish NHZs for which there were sufficient samples for analysis. (Source: SRMS data)

94
Figure 74. Trends in fledging success (proportion of pairs known to hatch young that fledged at least one young) for peregrines in seven Scottish NHZs or parts of NHZs for which there were sufficient samples for analysis. (Source: SRMS data)

95
Figure 75. Trends in the number fledged per successful pair for peregrines in eight Scottish NHZs or parts of NHZs for which there were sufficient samples for analysis. (Source: SRMS data)

96
1.4.11 Barn owl
Trends in breeding numbers The best available trends in breeding numbers at regional scale since 2003 show variable changes, with suggestions of declines in some of the southern studies, and some increase in Stirlingshire (Figure 77). Best available trends in breeding numbers are reported for seven study areas across Scotland (Figure 76): North-east Highlands (parts of NHZs 5, 7, 10 and 21); Southern Uplands (parts of NHZs 19 and 20); West Galloway (parts of NHZs 18 and 19); Central Galloway (part of NHZ 19); Mid-Argyll and Kintyre (part of NHZ 14); Stirlingshire (parts of NHZs 15, 16 and 17); and Aberdeenshire (parts of NHZs 9, 11 and 12). These seven study areas are distributed across Scotland but concentrated in the southern part of the country, reflecting the traditional strongholds of barn owl distribution in Scotland but probably not representing fully the current distribution. Sample sizes available for analyses are given in Annex Table B 33. Trends in breeding productivity The breeding productivity parameters showed marked fluctuations across the study areas, probably due to a combination of changes in prey abundance and severity of winter weather (e.g. Taylor 1989, 1994). Best available trends in clutch size of pairs that laid for three studies (Figure 78), hatching success for one study (Figure 79), fledging success for four studies (Figure 80) and the number fledged per successful pair for six studies (Figure 81) are reported. See Annex Table B 34 for sample sizes available for analyses. Data sources, caveats, work pending and gaps Analyses are based on the SRMS dataset for 2003-2009. Initial scoping of the datasets suggested 11 study areas distributed across Scotland that had the potential to be used in trend analyses (Figure 76). Some of the identified studies were initiated relatively recently, or have a low sample size, and thus provisional trends in numbers and productivity are reported for only seven of the studies. For two of these studies, it was necessary to restrict the years to 2004-2009 and for one study to 2005-2009 (Annex Table B 33). Most of the seven study areas had comprehensive monitoring of productivity across years, but large enough sample sizes of productivity parameters were achieved for only some of the studies and some years (Annex Table B 34). Trends from the seven study areas should be regarded as provisional until annual coverage and survey effort have been verified with observers. Provisional year-on-year comparisons suggested that the spatial coverage of monitoring has been relatively consistent across years in at least five of the seven study areas. However, in one study area (Southern Uplands) for example, the high number of monitored nest boxes in 2003 and 2009 appears to be due mainly to the monitoring of sites in the eastern part of the study area, which were not covered in all years. In the core (western) part of the same study area, monitoring appears to have been comprehensive in all years, without apparent changes in coverage. In another study (Stirlingshire), the number of checked nest sites shows a pronounced peak in 2007 and 2008 and appears to reflect a higher density of nest boxes and/or natural nests in the central part of the study area. For several of the studies, the results suggest that in the early years of the SRMS (mainly 2003-2005) there was a positive correlation between the number of checked nest sites and the number of sites occupied by breeding pairs (see Annex Table B 33 and Figure 77) but this relationship was less evident for the later years. This may have occurred due to a lack of reporting of sites that were checked but not occupied during the earlier study years but we need to confirm this through further liaison with observers.

97
Given the number and geographical spread of studies of barn owl that submit data to the SRMS currently (Annex Table B 33), it may be possible to produce some national trends in future once the work described above is complete.
Figure 76. The locations of the seven barn owl studies contributing information on trends, and other study areas considered for inclusion in the current project.
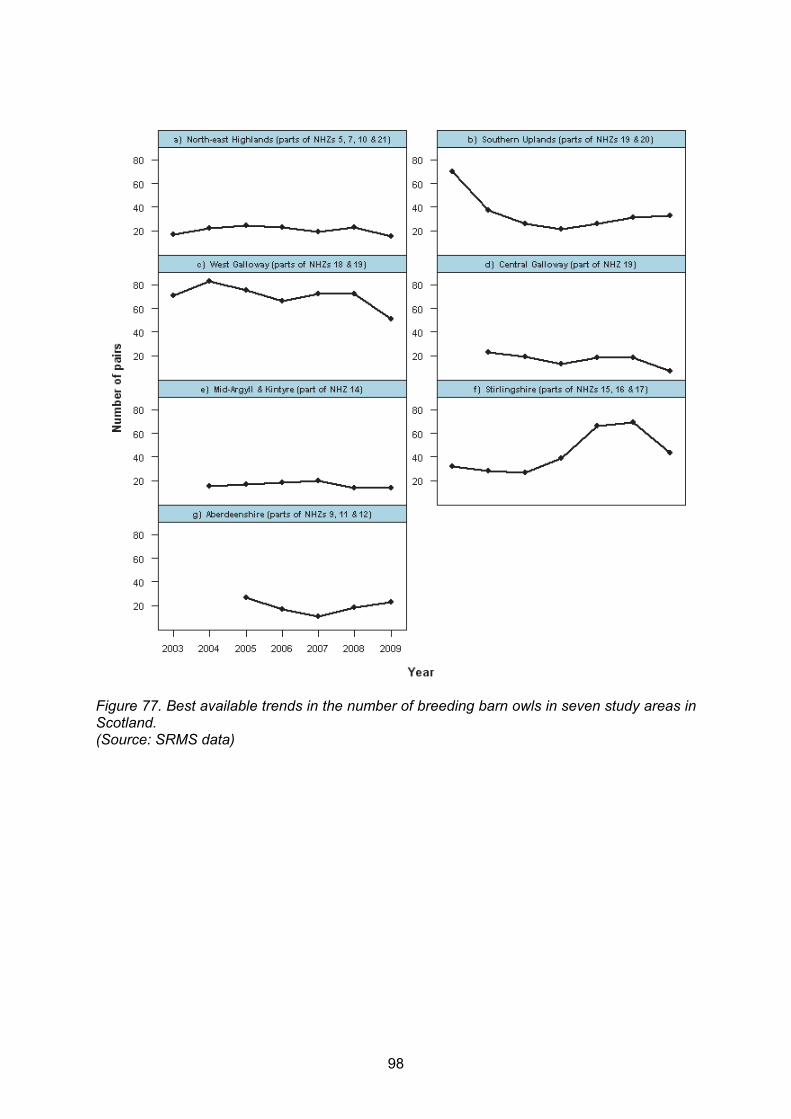
98
Figure 77. Best available trends in the number of breeding barn owls in seven study areas in Scotland. (Source: SRMS data)

99
Figure 78. Best available trends in clutch size of pairs that laid for barn owls in three Scottish study areas for which sufficient samples were available for analysis. (Source: SRMS data)
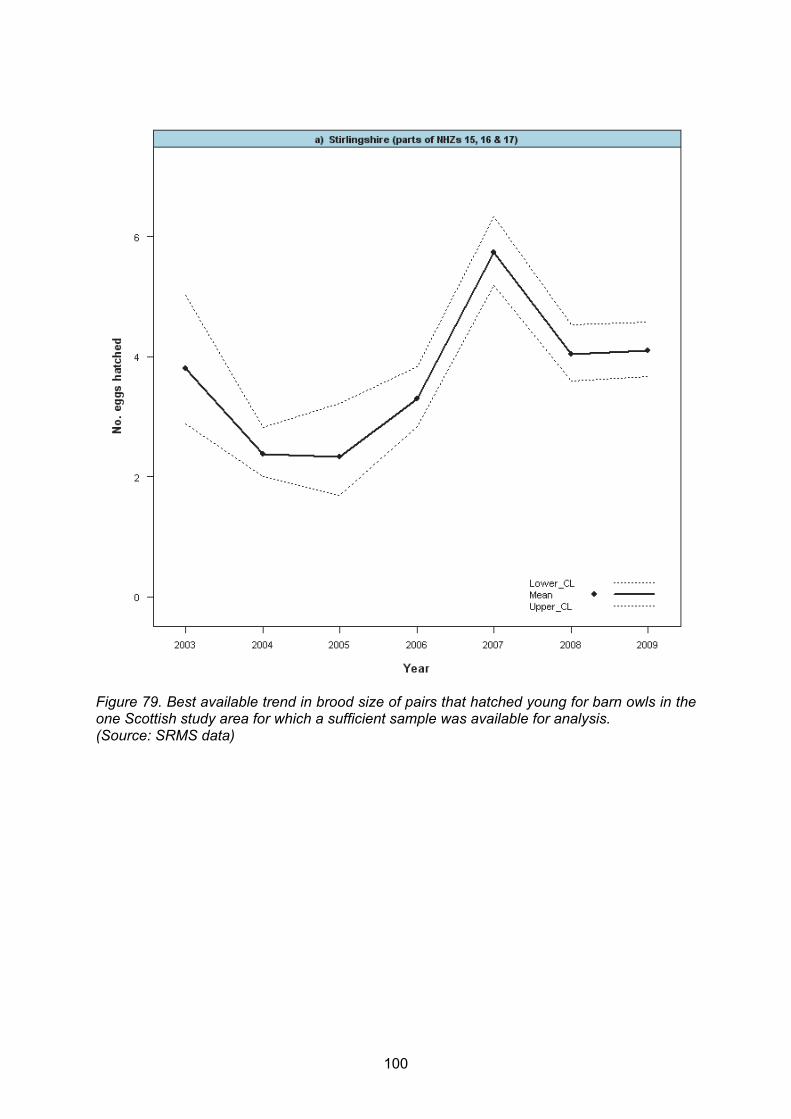
100
Figure 79. Best available trend in brood size of pairs that hatched young for barn owls in the one Scottish study area for which a sufficient sample was available for analysis. (Source: SRMS data)
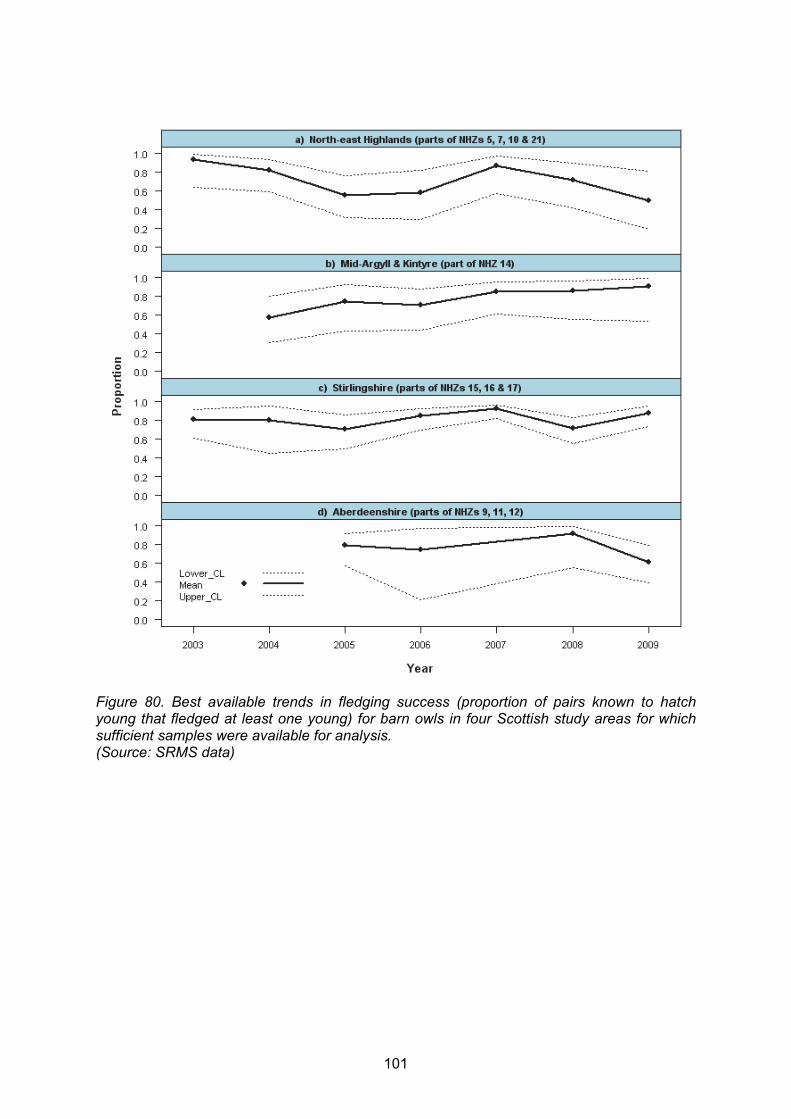
101
Figure 80. Best available trends in fledging success (proportion of pairs known to hatch young that fledged at least one young) for barn owls in four Scottish study areas for which sufficient samples were available for analysis. (Source: SRMS data)
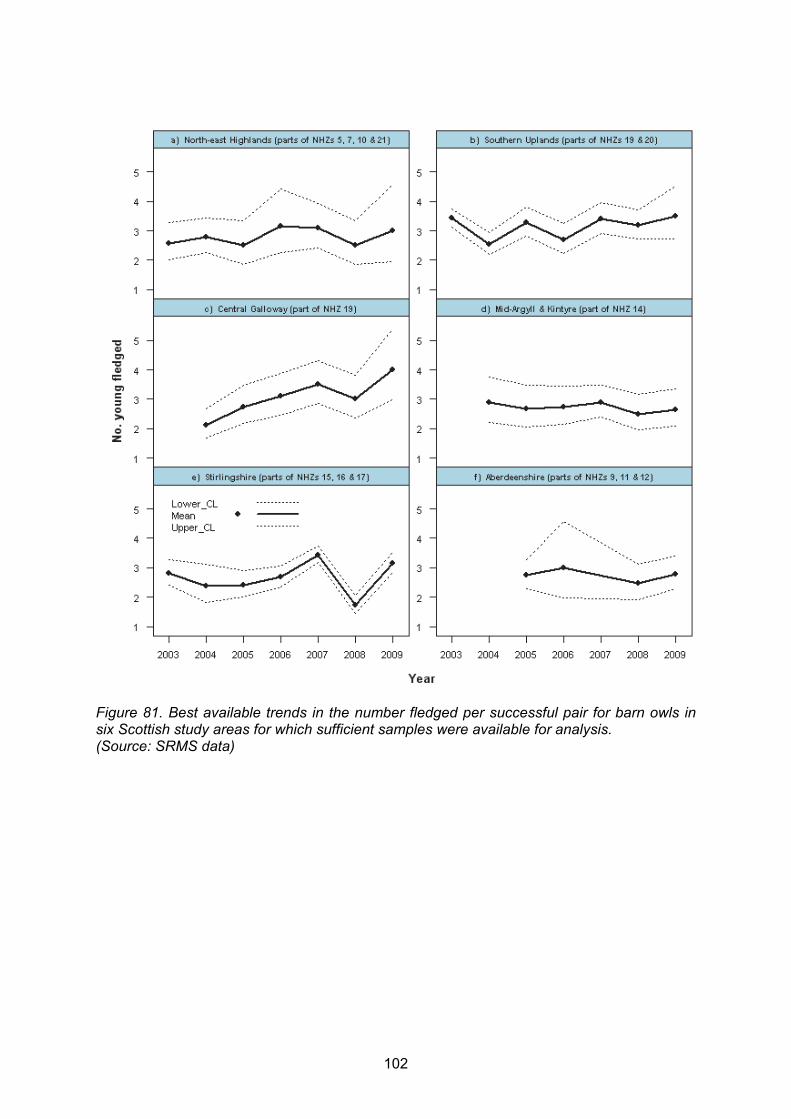
102
Figure 81. Best available trends in the number fledged per successful pair for barn owls in six Scottish study areas for which sufficient samples were available for analysis. (Source: SRMS data)
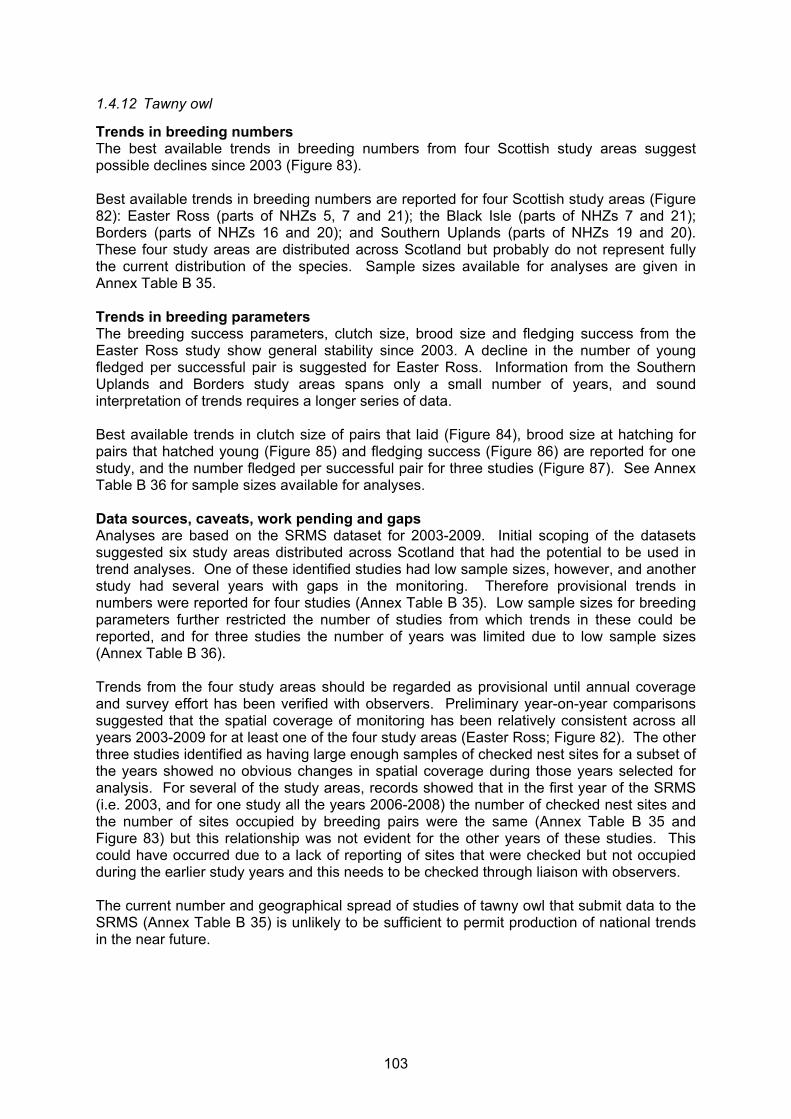
103
1.4.12 Tawny owl
Trends in breeding numbers The best available trends in breeding numbers from four Scottish study areas suggest possible declines since 2003 (Figure 83). Best available trends in breeding numbers are reported for four Scottish study areas (Figure 82): Easter Ross (parts of NHZs 5, 7 and 21); the Black Isle (parts of NHZs 7 and 21); Borders (parts of NHZs 16 and 20); and Southern Uplands (parts of NHZs 19 and 20). These four study areas are distributed across Scotland but probably do not represent fully the current distribution of the species. Sample sizes available for analyses are given in Annex Table B 35. Trends in breeding parameters The breeding success parameters, clutch size, brood size and fledging success from the Easter Ross study show general stability since 2003. A decline in the number of young fledged per successful pair is suggested for Easter Ross. Information from the Southern Uplands and Borders study areas spans only a small number of years, and sound interpretation of trends requires a longer series of data. Best available trends in clutch size of pairs that laid (Figure 84), brood size at hatching for pairs that hatched young (Figure 85) and fledging success (Figure 86) are reported for one study, and the number fledged per successful pair for three studies (Figure 87). See Annex Table B 36 for sample sizes available for analyses. Data sources, caveats, work pending and gaps Analyses are based on the SRMS dataset for 2003-2009. Initial scoping of the datasets suggested six study areas distributed across Scotland that had the potential to be used in trend analyses. One of these identified studies had low sample sizes, however, and another study had several years with gaps in the monitoring. Therefore provisional trends in numbers were reported for four studies (Annex Table B 35). Low sample sizes for breeding parameters further restricted the number of studies from which trends in these could be reported, and for three studies the number of years was limited due to low sample sizes (Annex Table B 36). Trends from the four study areas should be regarded as provisional until annual coverage and survey effort has been verified with observers. Preliminary year-on-year comparisons suggested that the spatial coverage of monitoring has been relatively consistent across all years 2003-2009 for at least one of the four study areas (Easter Ross; Figure 82). The other three studies identified as having large enough samples of checked nest sites for a subset of the years showed no obvious changes in spatial coverage during those years selected for analysis. For several of the study areas, records showed that in the first year of the SRMS (i.e. 2003, and for one study all the years 2006-2008) the number of checked nest sites and the number of sites occupied by breeding pairs were the same (Annex Table B 35 and Figure 83) but this relationship was not evident for the other years of these studies. This could have occurred due to a lack of reporting of sites that were checked but not occupied during the earlier study years and this needs to be checked through liaison with observers. The current number and geographical spread of studies of tawny owl that submit data to the SRMS (Annex Table B 35) is unlikely to be sufficient to permit production of national trends in the near future.
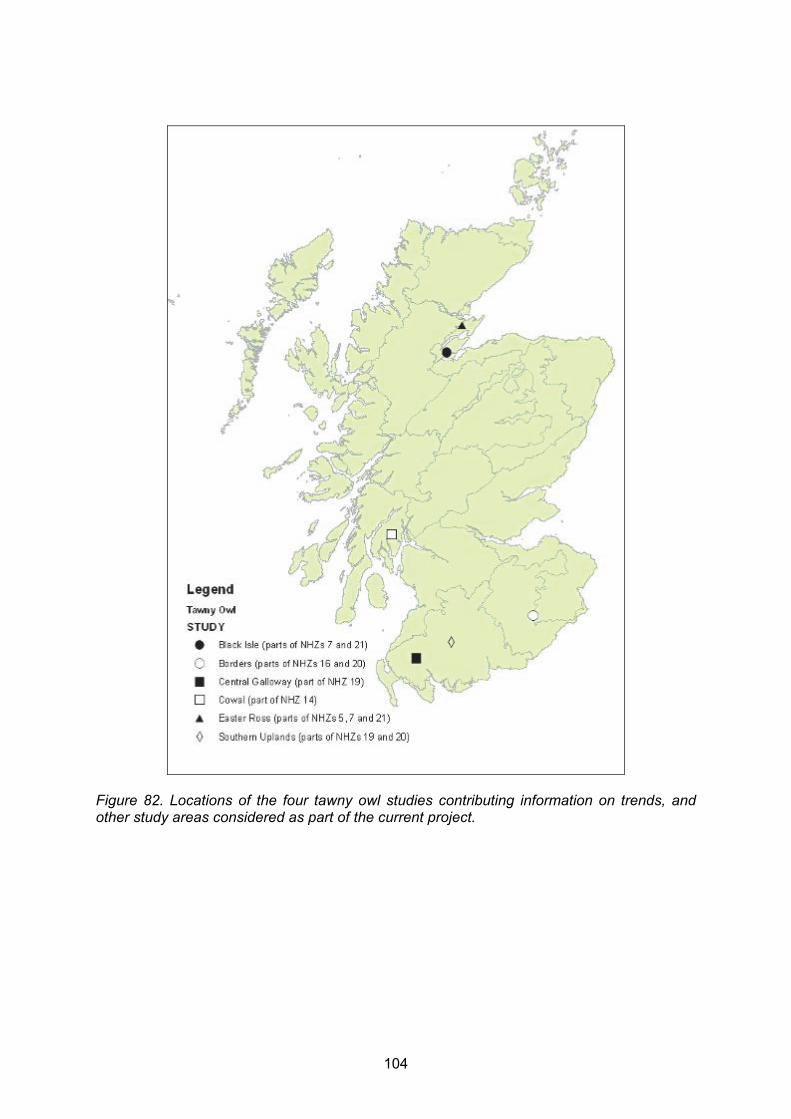
104
Figure 82. Locations of the four tawny owl studies contributing information on trends, and other study areas considered as part of the current project.

105
Figure 83. Best available trends in the number of breeding tawny owls in four Scottish study areas between 2003 and 2009. (Source: SRMS data)
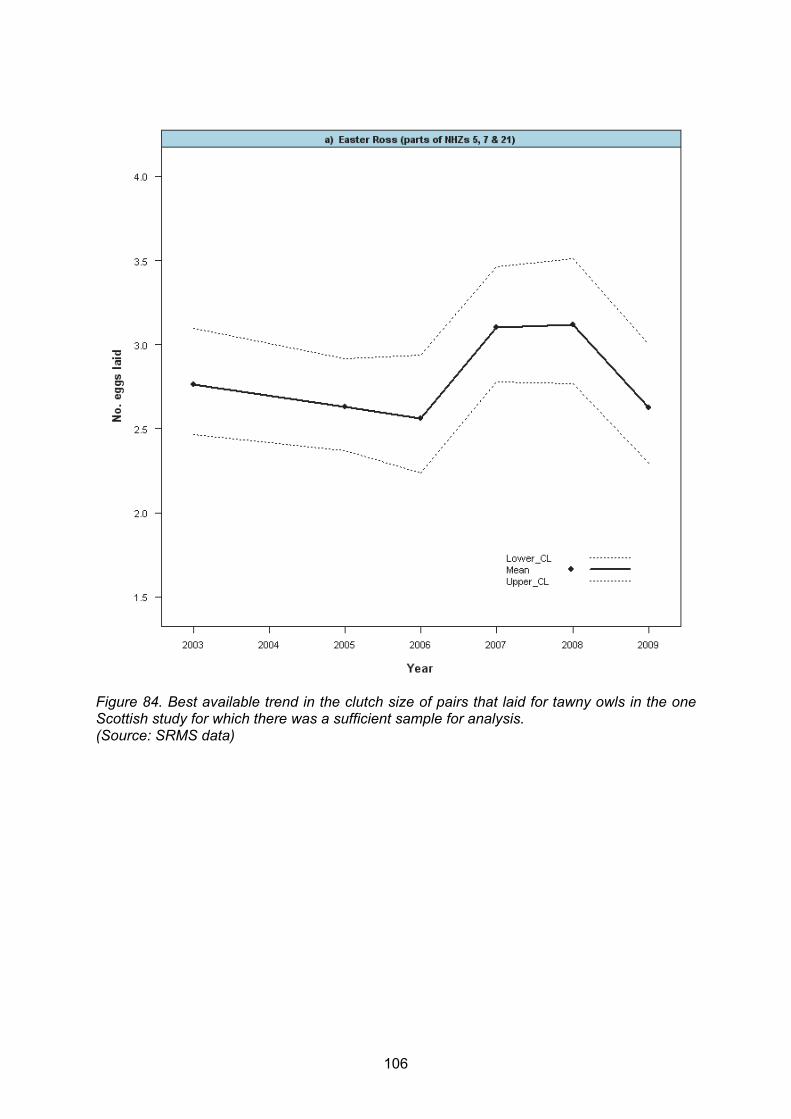
106
Figure 84. Best available trend in the clutch size of pairs that laid for tawny owls in the one Scottish study for which there was a sufficient sample for analysis. (Source: SRMS data)

107
Figure 85. Best available trend in the brood size at hatching of pairs that hatched young for tawny owls in the one Scottish study for which there was a sufficient sample for analysis. (Source: SRMS data)
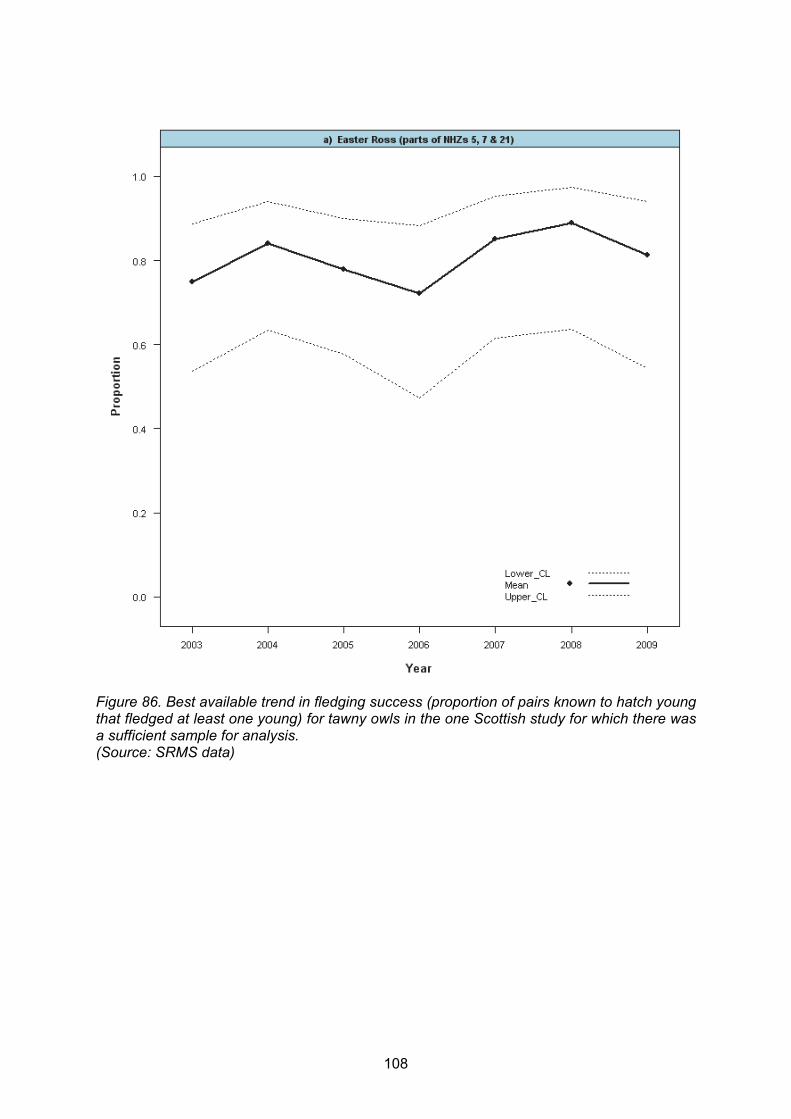
108
Figure 86. Best available trend in fledging success (proportion of pairs known to hatch young that fledged at least one young) for tawny owls in the one Scottish study for which there was a sufficient sample for analysis. (Source: SRMS data)
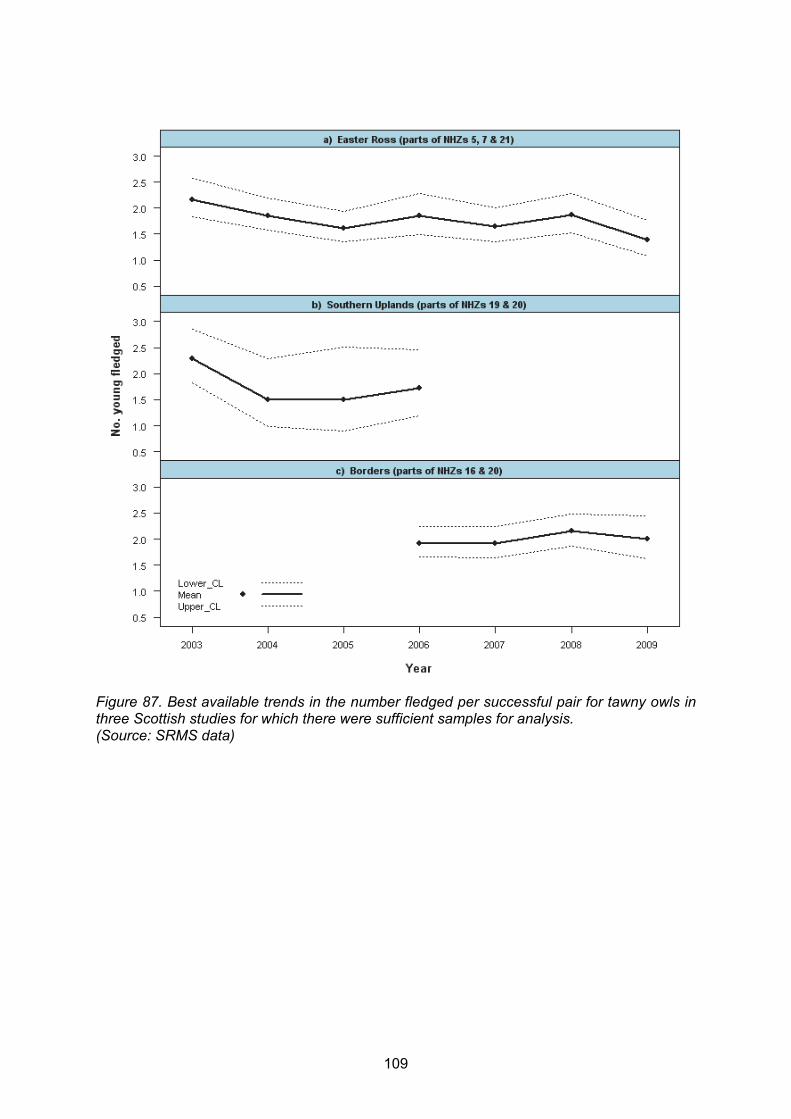
109
Figure 87. Best available trends in the number fledged per successful pair for tawny owls in three Scottish studies for which there were sufficient samples for analysis. (Source: SRMS data)
110
1.4.13 Common raven
Trends in breeding numbers The national trend in raven breeding abundance, from BBS results, shows some increase between 1994 and 2002, particularly in the early 2000s, and perhaps some degree of stabilisation subsequently (Figure 88). Overall, the smoothed abundance index for Scotland increased by 65% between 1995 and 2009 but the overall increase was not significant (lower and upper confidence limits -10 to 160%; Risely et al. 2011). This trend may not be fully representative of changes in breeding numbers across Scotland as a whole (see below). It is not currently possible to report regional trends in breeding numbers. Trends in breeding parameters It is not currently possible to report regional or national trends in breeding parameters. Data sources, caveats, work pending and gaps Ravens were recorded in 43 of the 329 squares surveyed for the BTO/JNCC/RSPB Breeding Bird Survey in Scotland in 2010 (Risely et al. 2011; Annex Figure A4). The trend in breeding abundance produced by the Breeding Bird Survey may not be representative of changes in breeding raven numbers across Scotland as a whole because: (i) the survey squares covered could be biased towards the areas in which the largest increases in the breeding raven population have occurred during the last 20 years (Simon Gillings pers. comm.); (ii) because BBS methodology is not designed to allow breeding pairs to be distinguished from non-breeding ‘floaters’, numbers of which are likely to vary with population density but not in direct proportion to the number of breeding pairs; and (iii) because non-territorial individuals and family groups can move around large areas during the breeding season and after breeding (from late May onwards), with non-territorial pairs sometimes displaying well away from possible nest sites (W. Mattingley, pers. comm.). The SRMS data for raven were not analysed for trends in the current project because studies with sample sizes sufficient for analyses were only established in the most recent years (see Table 1). There is a need to obtain coverage and survey effort information from these studies, and compare coverage with the overall distribution and relative abundance of the species across Scotland (using Bird Atlas 2007-11 information), before it will be possible to assess the extent to which these can produce representative regional or national trends in future.
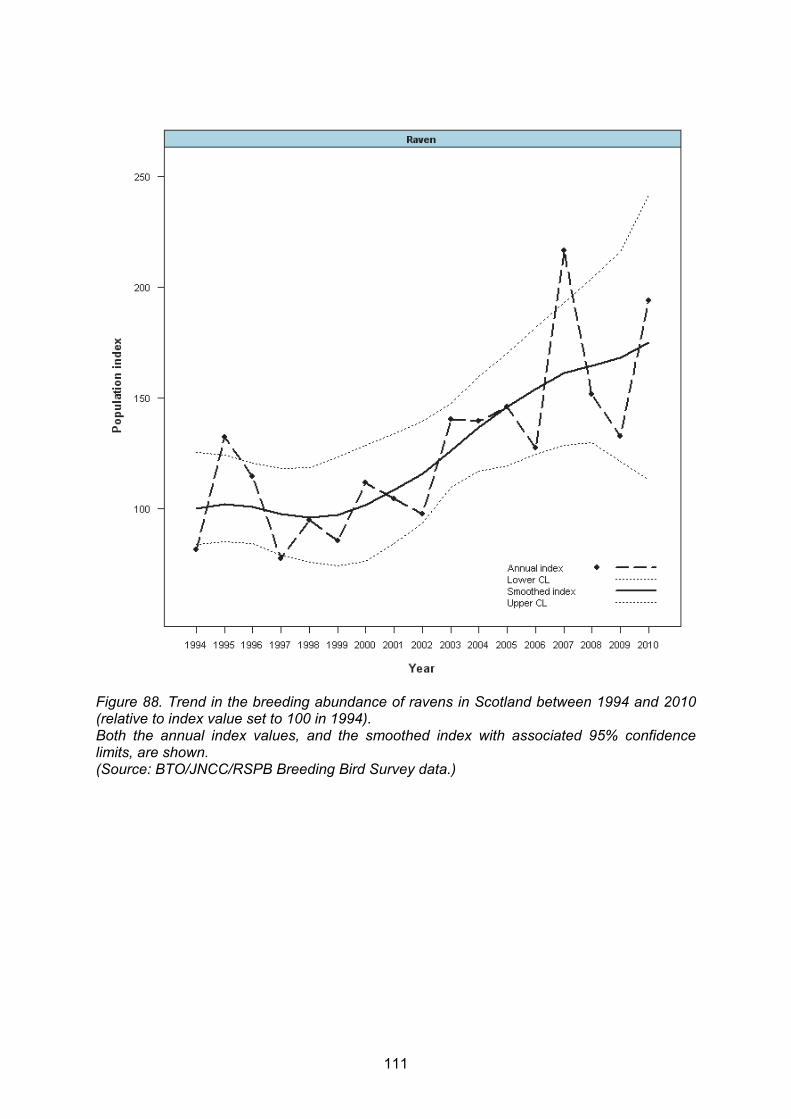
111
Figure 88. Trend in the breeding abundance of ravens in Scotland between 1994 and 2010 (relative to index value set to 100 in 1994). Both the annual index values, and the smoothed index with associated 95% confidence limits, are shown. (Source: BTO/JNCC/RSPB Breeding Bird Survey data.)
112
1.5 Raptor trends: discussion and future directions
1.5.1 Extent of available trend information from annual monitoring efforts
The current project has allowed a clear picture of the potential for production of temporal trends in breeding numbers and breeding productivity for raptors covered by the SRMS to be developed. Trends are rigorous at the regional and national scale for species that receive comprehensive or near-comprehensive monitoring on an annual basis and for which full location information is available (red kite and white-tailed eagle). There is also the potential to produce rigorous trend information for a number of other species that receive dedicated monitoring effort each year (e.g. golden eagle, peregrine falcon, hen harrier, merlin, and perhaps common buzzard and barn owl; see Table 2). For these species, we have produced the best available trends, pending further work to establish whether/how coverage of study areas and monitoring effort may have varied since establishment of the SRMS (see Section 1.3.3), and to what extent annual coverage is representative at the required spatial scale. For other species (e.g. common kestrel, Eurasian sparrowhawk and tawny owl), trend information is available from a small number of intensive studies that are limited in their geographical extent. These cannot be expected to produce trend information that is more widely representative of Scottish populations as a whole but they currently produce rigorous trend information at a local or regional scale. For some species and study areas, notably osprey, golden eagle and merlin, trend analysis at any scale is restricted because of a lack of grid reference information being supplied to the SRMS from some survey areas. In general, it is the more widespread species that have received lower monitoring coverage (e.g. common kestrel, Eurasian sparrowhawk, common buzzard and common raven; see Table 2). Information on changes in the breeding relative abundance of these species is available from the BTO/JNCC/RSPB Breeding Bird Survey but the extent to which such trends are representative of Scottish populations deserves further assessment (e.g. using Bird Atlas 2007-11 data to clarify current range and spatial variation in relative abundance across Scotland). The SRMG is currently considering more generally other ways in which monitoring of numbers and breeding parameters could be improved for the more widespread raptor species in Scotland (see also Section 1.3.4). We did not carry out any formal tests of statistical significance for the trends produced from SRMS data as part of this project, first, because data were generally only available from 2003 onwards (a short time series) and, second, because many of the trends should be regarded as provisional under survey coverage/effort is verified with observers. The SRMS aims to start requesting data from observers for years prior to 2003. 1.5.2 Parameters for which trends from SRMS data are feasible
For the species for which further work is still required on changes in SRMS survey coverage and effort, the trends presented in this report must be regarded as provisional and subject to modification. This is more so for trends in numbers, where a change in coverage can directly influence the annual count of breeding birds, than for the productivity measures. We have reported trends in numbers as the absolute number of breeding pairs in study areas each year, so that the sample sizes contributing to studies are explicit. In future, once the extent of annual coverage is clear, it may be preferable to convert these trends to population indices (where counts are standardised to a baseline value in a given year; e.g. 2003 or the most
113
recent year). This would facilitate comparisons of changes between spatial areas and ensure that the numbers of breeding pairs contributing to the trends (the sample) are not confused with total population size. For longer-lived raptor species, breeding numbers might be expected to change relatively slowly through time, such that a trend in the number of breeding pairs might not be the most sensitive indicator of either adverse environmental change or positive conservation action over shorter timescales. For some species, for example golden eagle, white-tailed eagle and peregrine, for which individual birds can be aged by experienced surveyors, the SRMS could encourage more observers to routinely collect information the age of breeding pairs, as an indicator of potential changing age structure of populations (Whitfield et al. 2008). Changes in population age structure can be indicative of age-specific mortality (e.g. Whitfield et al. 2008; Smart et al. 2010) and can provide information on recruitment into the breeding population. Across the species covered by the SRMS, the number of young fledged per successful pair was the breeding success parameter for which we considered it feasible to produce unbiased trends for the most species. Whilst temporal trends in clutch size and brood size at hatching were feasible for some species and some particular studies, it would not be possible for the SRMS to encourage the collection of larger samples of data on these parameters for many species (due to risks of disturbance; current guidance is given in Hardey et al. 2013). In addition, for longer-lived species with smaller clutch/brood sizes, low annual variation in such parameters means that trends will not function as sensitive indicators of environmental change. For longer-lived species with small brood sizes, the parameters proportion of pairs that lay, proportion of pairs that hatch young and proportion of pairs that rear at least one young successfully are likely to be more sensitive indicators of environmental change (and deliberate human disturbance; e.g. Amar et al. 2012). To give the maximum potential to produce trends in these parameters from SRMS data in future, observers need to routinely record the dates of all survey visits and nest contents/stage of breeding information at each visit. 1.5.3 Current SRMS data collation and recommendations
The current project has reinforced the findings of a previous review of SRMS data (2003-2008), highlighting areas of current SRMS data collation that should be enhanced so that the Scheme can deliver effectively and efficiently in relation to the aims of the SRMS (Anon. 2002 & revised SRMS Agreement 2014) and the needs of its stakeholders. Table 3 outlines the recommended enhancements that could be made to the SRMS, based on this study. In summary, these are:
(i) Full details of individual breeding attempts should be submitted to the SRMS (not summary data) in the form required by the bespoke SRMS MS Excel recording spreadsheet, including full six-figure grid references, all visit dates, details of all sites (including those not checked in any given year) and definite breeding outcomes. Assessment of the extent to which samples surveyed annually are representative of populations in specific spatial units (e.g. NHZs) requires location information to allow nesting ranges to be linked to specific NHZs but not all records have associated grid-references that allow this linking to be carried out (the extent of the problem varies between species; see Table 1).
(ii) In the short-term, observers should be encouraged to use master spreadsheets,
available from the Scottish Raptor Monitoring Coordinator, to ensure that they supply data in a format consistent with the SRMS dataset (2003-2009) and include a ‘return’ for each of their sites each year (even if not checked). This will ensure that the

114
substantial cleaning and standardisation of the 2003-2009 dataset that has been undertaken to date will not be diminished, and checking for site turnover between years (which is required for trends work) can be carried out efficiently.
(iii) Coverage/effort information should be obtained from all SRMS contributors. Once
study area boundaries have been established, little work will be required on the part of volunteer raptor workers annually to update the information but the annual update must occur to allow rigorous trends to be produced in future. The SRMG needs to achieve an appropriate balance between recording suitable measures of effort without making this too onerous for volunteer raptor workers each year.
(iv) We recommend that a process begins to request historical (pre-2003) survey data
from SRMS contributors that have carried out consistent monitoring of core study areas and have the data in a form that can be submitted. This will enable longer-term trends to be reported in future.
(v) The SRMS needs to develop bespoke, fit-for-purpose software to collect SRMS data
more efficiently and effectively. A number of current BTO-organised monitoring schemes employ, or are in the process of developing, on-line applications (including off-line upload modules) that encapsulate most if not all of the functionality that would be required for a similar SRMS application, such that it should be possible to develop a cost-effective system for the SRMS in the near future. It is important that any new system captures information on annual survey coverage and effort, as well as full details of individual breeding attempts through records made at each visit. The SRMG has already initiated appropriate discussion and a preliminary software specification has been drafted. In future, such a system could allow automated feedback of monitoring results on an annual basis, and functionality for volunteer observers (and SRSG Species Coordinators/Chairs) to store, manage, query and report on their own data, as is the case with other on-line recording software (such as. the BTO/RSPB/BWI/SOC/WOS BirdTrack system; see http://www.bto.org/volunteer-surveys/birdtrack).
1.5.4 Current gaps in SRMS data collection and overall recommendations
We consider that there is now a logical progression of future work that is required to finalise our understanding of gaps in monitoring effort across the range of species covered by the SRMS, and to take forward the aims of the SRMS, which we suggest as follows:
(i) Build the complete picture of annual survey coverage/effort through liaison with all
regular SRMS observers; (ii) Finalise assessment of the extent to which current survey coverage is representative
(at NHZ and national scale) by comparison with key datasets (particularly with the latest hen harrier, golden eagle and merlin national survey data and Bird Atlas 2007-11 data for appropriate species);
(iii) Using the current report and the above as a basis, hold appropriate meetings
(including SRMG partners and other organisations and individuals with relevant expertise) to agree priorities for enhanced survey effort (species and geographical areas) and suitable survey design(s) to achieve the agreed priorities;
(iv) Consider ways of working with existing SRSG observers to move current monitoring
efforts towards more rigorous study design where necessary, and to make most effective use of new volunteer effort; and
115
(v) Consider development of entry-level and supplementary survey(s) that would assist development of monitoring of more widespread species (e.g. a grid-based common raptor survey, as discussed previously by the SRMG) and ways to encourage a wider audience of potential volunteers (e.g. BTO, SOC and RSPB members) to get involved in these via co-ordinated promotion and training events. This might involve an element of mentoring, with experienced raptor observers volunteering to supervise less experienced volunteers, as is done informally by a number of SRSGs already. These ideas are already being developed by the SRMG.
1.5.5 Expansion of coverage and future survey design considerations
Once the SRMG has a clear picture of current survey coverage and the distribution of each SRMS species (Section 1.3.4), it will be possible to produce a targeting strategy for the SRMS, showing which regions are most in need of additional survey work for each species. In general, long-term study areas will require little or no shift in survey coverage but it would be valuable for the SRMG and SRSGs to be able to provide guidance to new members on the most useful species to cover in their chosen geographical area of study. It will also be possible to advise existing observers about small changes to their current study design that could have important positive effects on the usefulness of the data they collect. To maintain and enhance SRMS coverage, it is vital that new volunteers are found to continue monitoring of raptors across Scotland. We cannot assume that new volunteers will necessarily be able to commit the substantial amounts of time each breeding season committed by some of the existing RSG members, and it is important that this is taken into consideration when thinking about future survey design. Whilst a small number of new volunteers might be persuaded to take on large study areas with substantial numbers of pairs to check and monitor for breeding success each year, others might be willing to contribute smaller amounts of time. Perhaps individuals with large amounts of time to commit should be encouraged to get involved in existing long-term studies (with a view to continuing them when the current observers need to hand them on). Attempts to expand survey coverage could then focus on other new groups of volunteers (perhaps with less time to contribute) by asking them to survey smaller areas comprehensively each year, focussing these for any given species in regions, or areas of particular habitat within regions, with poor current coverage whenever possible. Once coverage information is available for the main studies identified in the current project (Section 1.3.4), so that areas that receive comprehensive coverage each year are established, simple modelling scenarios should be run to assess the optimal study area size and/or number of nesting ranges checked each year to produce robust trends in numbers and key breeding parameters (see Figure 89 for illustration). This would be achieved by sub-sampling the results from areas with comprehensive coverage and comparing trends thus derived with those from the whole sample, and would allow the SRMG to then set guidance for each SRMS species.
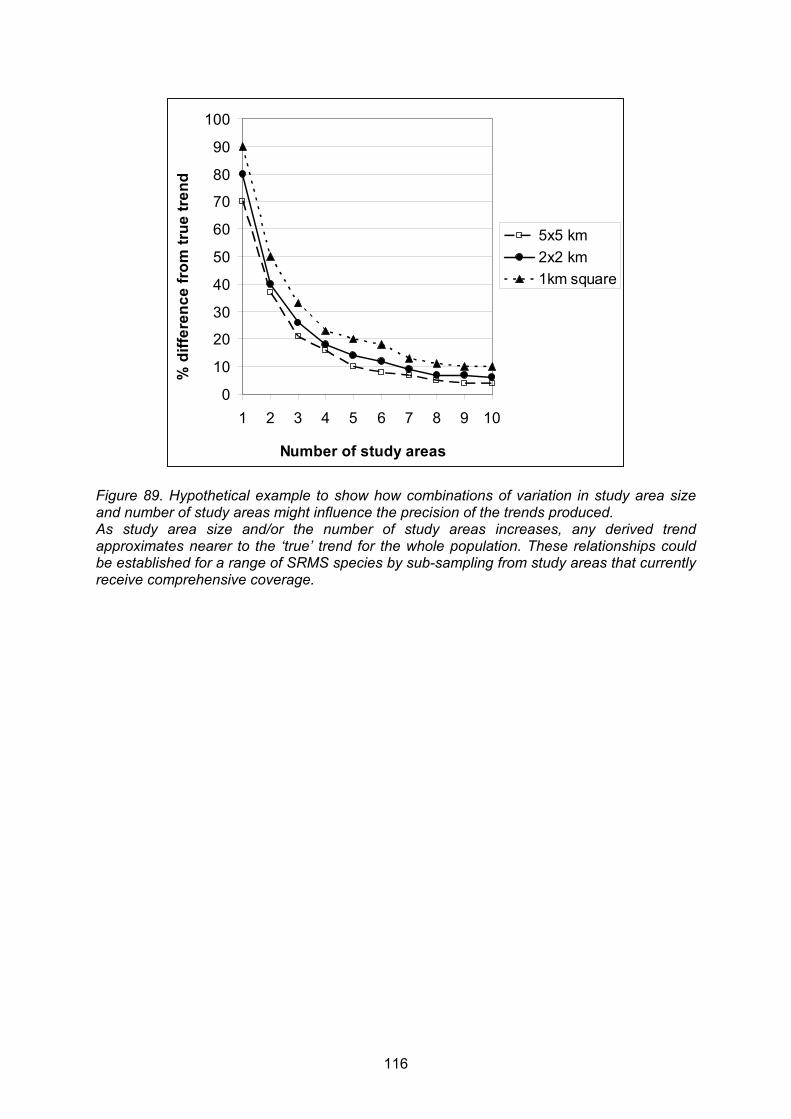
116
0
10
20
30
40
50
60
70
80
90
100
1 2 3 4 5 6 7 8 9 10
Number of study areas
% d
iffe
ren
ce
fro
m t
rue
tre
nd
5x5 km
2x2 km
1km square
Figure 89. Hypothetical example to show how combinations of variation in study area size and number of study areas might influence the precision of the trends produced. As study area size and/or the number of study areas increases, any derived trend approximates nearer to the ‘true’ trend for the whole population. These relationships could be established for a range of SRMS species by sub-sampling from study areas that currently receive comprehensive coverage.
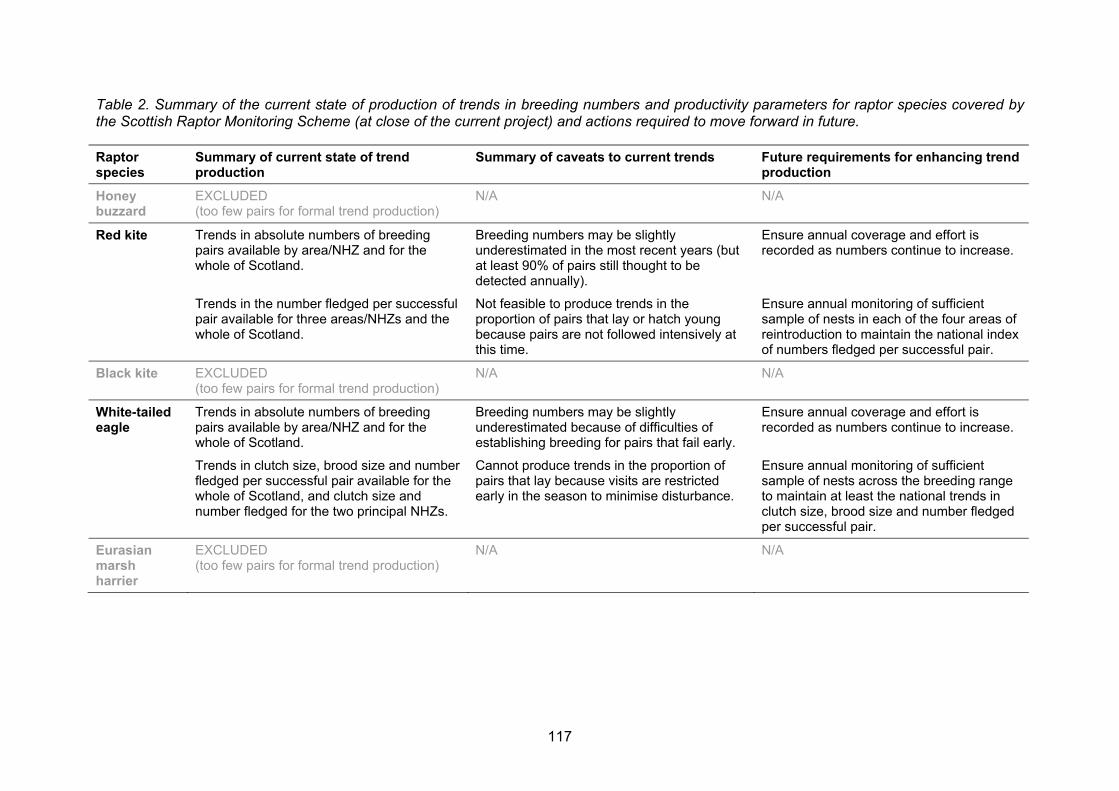
117
Table 2. Summary of the current state of production of trends in breeding numbers and productivity parameters for raptor species covered by the Scottish Raptor Monitoring Scheme (at close of the current project) and actions required to move forward in future.
Raptor species
Summary of current state of trend production
Summary of caveats to current trends Future requirements for enhancing trend production
Honey buzzard
EXCLUDED (too few pairs for formal trend production)
N/A N/A
Red kite Trends in absolute numbers of breeding pairs available by area/NHZ and for the whole of Scotland.
Breeding numbers may be slightly underestimated in the most recent years (but at least 90% of pairs still thought to be detected annually).
Ensure annual coverage and effort is recorded as numbers continue to increase.
Trends in the number fledged per successful pair available for three areas/NHZs and the whole of Scotland.
Not feasible to produce trends in the proportion of pairs that lay or hatch young because pairs are not followed intensively at this time.
Ensure annual monitoring of sufficient sample of nests in each of the four areas of reintroduction to maintain the national index of numbers fledged per successful pair.
Black kite EXCLUDED (too few pairs for formal trend production)
N/A N/A
White-tailed eagle
Trends in absolute numbers of breeding pairs available by area/NHZ and for the whole of Scotland.
Breeding numbers may be slightly underestimated because of difficulties of establishing breeding for pairs that fail early.
Ensure annual coverage and effort is recorded as numbers continue to increase.
Trends in clutch size, brood size and number fledged per successful pair available for the whole of Scotland, and clutch size and number fledged for the two principal NHZs.
Cannot produce trends in the proportion of pairs that lay because visits are restricted early in the season to minimise disturbance.
Ensure annual monitoring of sufficient sample of nests across the breeding range to maintain at least the national trends in clutch size, brood size and number fledged per successful pair.
Eurasian marsh harrier
EXCLUDED (too few pairs for formal trend production)
N/A N/A

118
Raptor species
Summary of current state of trend production
Summary of caveats to current trends Future requirements for enhancing trend production
Hen harrier Matching with the hen harrier Conservation Framework dataset added 126 grid references and good numbers of records are submitted annually from at least 8-10 NHZs but trends in breeding numbers cannot be taken further until coverage/effort information is obtained from observers.
Trend production limited by lack of grid-referencing and lack of coverage/effort information.
Obtain outstanding grid-references1.
Obtain information on study area boundaries and coverage.
Best available trends in breeding parameters are reported for 1-5 NHZs.
Some national trends should be possible in future at current level of SRMS coverage.
Match with information from last (2010) national survey and Bird Atlas 2007-11 to assess representativeness of coverage by NHZs and nationally.
Goshawk Best available trends in breeding numbers are reported from three study areas (in NHZs 9+12; 19+20; and 16+20). National trend in breeding numbers probably not appropriate.
Trends are provisional until coverage/effort information is complete.
Obtain data in full if possible (not summary data).
Obtain outstanding grid-references.
Trends in number of young fledged per successful pair available for three study areas.
Need to check to what extent the three study areas are representative of Scottish population as a whole.
Complete information on study area boundaries and coverage/effort.
Assess coverage against information from Bird Atlas 2007-11 when available.
Eurasian sparrowhawk
Best available trend in breeding numbers available from one study area only (in NHZs 17+19).
BBS trend still marginal as currently recorded in less than 30 BBS squares annually.
Obtain outstanding productivity data for 2003 and 2004.
Provisional BBS trend available.
Trends in clutch size, brood size and number fledged per successful pair available from one study area only (in NHZs 17+19).
SRMG to consider how to enhance monitoring in future.
1 Note that for hen harrier and merlin in particular, six-figure grid references will not always be appropriate for pairs that either fail early in their nesting attempts or do not breed (when a nest site is not found). In these situations, four-figure grid references may be more appropriate.
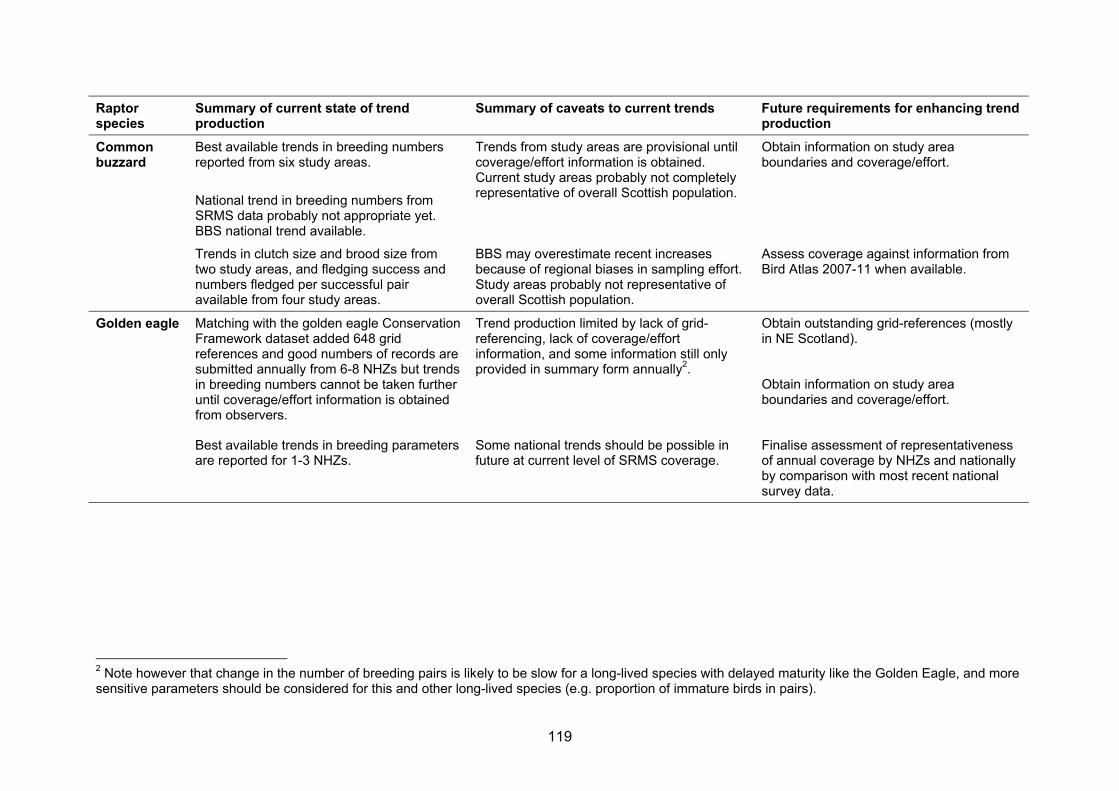
119
Raptor species
Summary of current state of trend production
Summary of caveats to current trends Future requirements for enhancing trend production
Common buzzard
Best available trends in breeding numbers reported from six study areas.
Trends from study areas are provisional until coverage/effort information is obtained. Current study areas probably not completely representative of overall Scottish population.
Obtain information on study area boundaries and coverage/effort.
National trend in breeding numbers from SRMS data probably not appropriate yet. BBS national trend available.
Trends in clutch size and brood size from two study areas, and fledging success and numbers fledged per successful pair available from four study areas.
BBS may overestimate recent increases because of regional biases in sampling effort. Study areas probably not representative of overall Scottish population.
Assess coverage against information from Bird Atlas 2007-11 when available.
Golden eagle Matching with the golden eagle Conservation Framework dataset added 648 grid references and good numbers of records are submitted annually from 6-8 NHZs but trends in breeding numbers cannot be taken further until coverage/effort information is obtained from observers.
Trend production limited by lack of grid-referencing, lack of coverage/effort information, and some information still only provided in summary form annually2.
Obtain outstanding grid-references (mostly in NE Scotland).
Obtain information on study area boundaries and coverage/effort.
Best available trends in breeding parameters are reported for 1-3 NHZs.
Some national trends should be possible in future at current level of SRMS coverage.
Finalise assessment of representativeness of annual coverage by NHZs and nationally by comparison with most recent national survey data.
2 Note however that change in the number of breeding pairs is likely to be slow for a long-lived species with delayed maturity like the Golden Eagle, and more sensitive parameters should be considered for this and other long-lived species (e.g. proportion of immature birds in pairs).
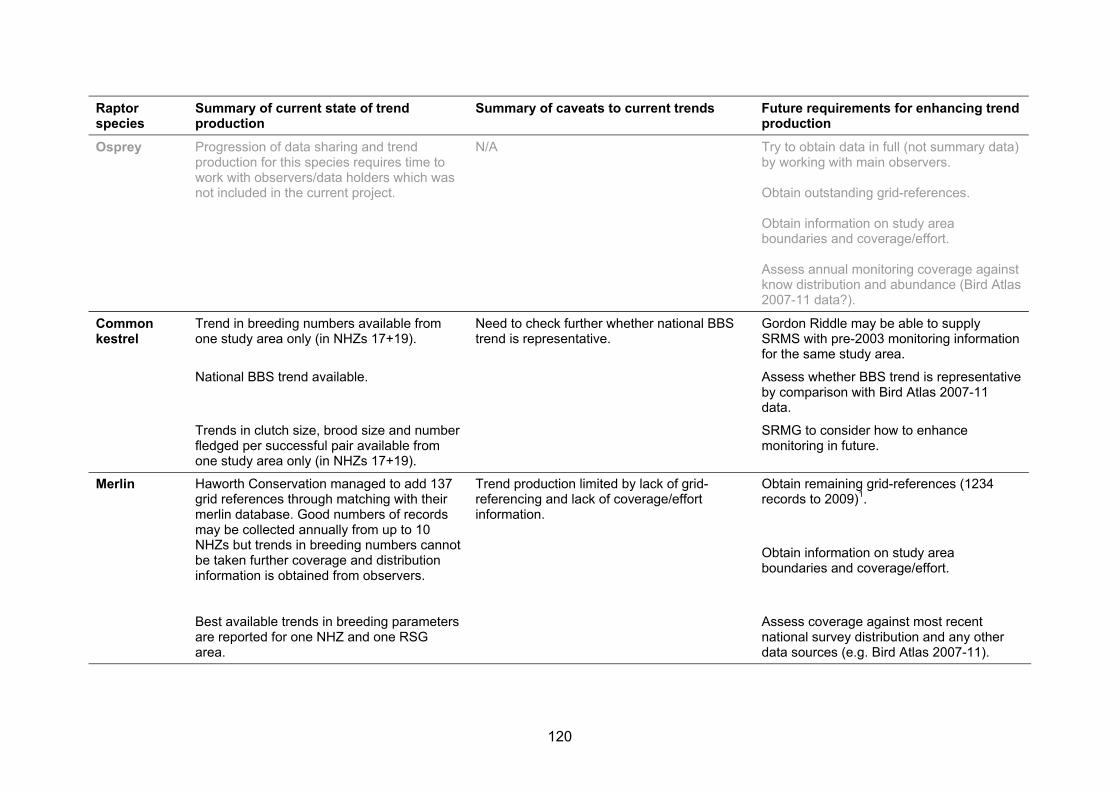
120
Raptor species
Summary of current state of trend production
Summary of caveats to current trends Future requirements for enhancing trend production
Osprey
Progression of data sharing and trend production for this species requires time to work with observers/data holders which was not included in the current project.
N/A Try to obtain data in full (not summary data) by working with main observers. Obtain outstanding grid-references. Obtain information on study area boundaries and coverage/effort. Assess annual monitoring coverage against know distribution and abundance (Bird Atlas 2007-11 data?).
Common kestrel
Trend in breeding numbers available from one study area only (in NHZs 17+19).
Need to check further whether national BBS trend is representative.
Gordon Riddle may be able to supply SRMS with pre-2003 monitoring information for the same study area.
National BBS trend available. Assess whether BBS trend is representative by comparison with Bird Atlas 2007-11 data.
Trends in clutch size, brood size and number fledged per successful pair available from one study area only (in NHZs 17+19).
SRMG to consider how to enhance monitoring in future.
Merlin Haworth Conservation managed to add 137 grid references through matching with their merlin database. Good numbers of records may be collected annually from up to 10 NHZs but trends in breeding numbers cannot be taken further coverage and distribution information is obtained from observers.
Trend production limited by lack of grid-referencing and lack of coverage/effort information.
Obtain remaining grid-references (1234 records to 2009)1.
Obtain information on study area boundaries and coverage/effort.
Best available trends in breeding parameters are reported for one NHZ and one RSG area.
Assess coverage against most recent national survey distribution and any other data sources (e.g. Bird Atlas 2007-11).
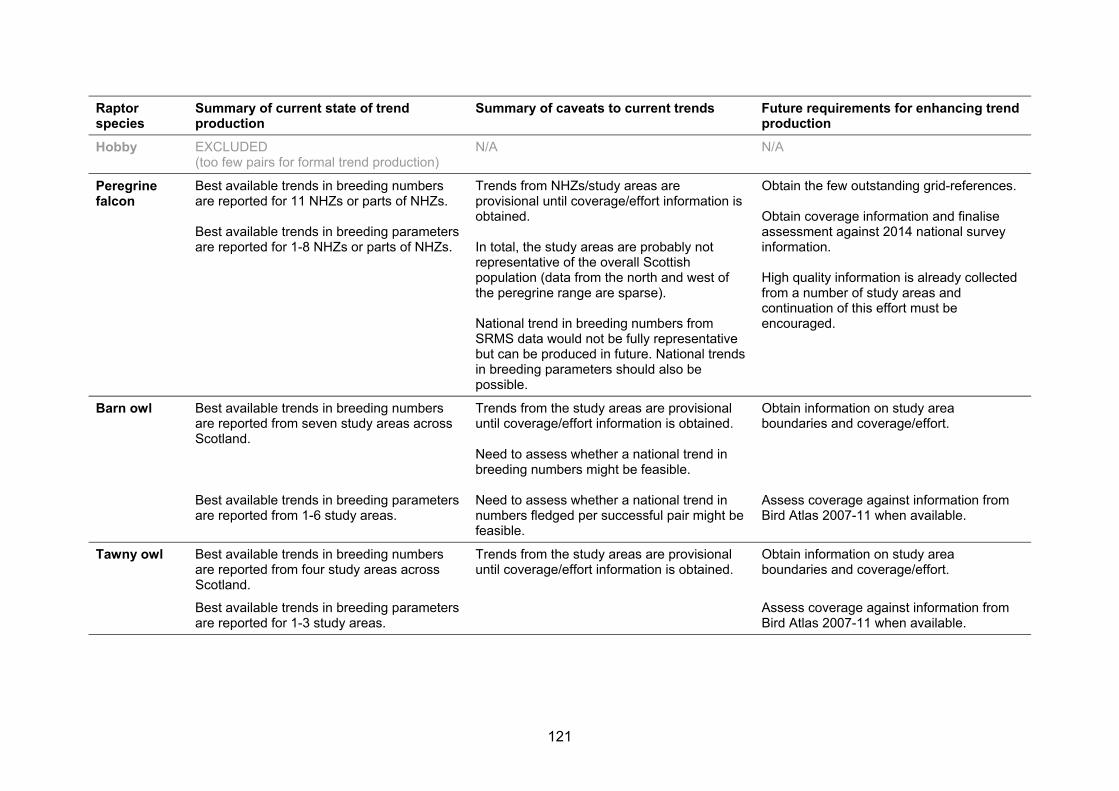
121
Raptor species
Summary of current state of trend production
Summary of caveats to current trends Future requirements for enhancing trend production
Hobby
EXCLUDED (too few pairs for formal trend production)
N/A N/A
Peregrine falcon
Best available trends in breeding numbers are reported for 11 NHZs or parts of NHZs. Best available trends in breeding parameters are reported for 1-8 NHZs or parts of NHZs.
Trends from NHZs/study areas are provisional until coverage/effort information is obtained. In total, the study areas are probably not representative of the overall Scottish population (data from the north and west of the peregrine range are sparse). National trend in breeding numbers from SRMS data would not be fully representative but can be produced in future. National trends in breeding parameters should also be possible.
Obtain the few outstanding grid-references. Obtain coverage information and finalise assessment against 2014 national survey information. High quality information is already collected from a number of study areas and continuation of this effort must be encouraged.
Barn owl Best available trends in breeding numbers are reported from seven study areas across Scotland.
Trends from the study areas are provisional until coverage/effort information is obtained.
Obtain information on study area boundaries and coverage/effort.
Need to assess whether a national trend in breeding numbers might be feasible.
Best available trends in breeding parameters are reported from 1-6 study areas.
Need to assess whether a national trend in numbers fledged per successful pair might be feasible.
Assess coverage against information from Bird Atlas 2007-11 when available.
Tawny owl Best available trends in breeding numbers are reported from four study areas across Scotland.
Trends from the study areas are provisional until coverage/effort information is obtained.
Obtain information on study area boundaries and coverage/effort.
Best available trends in breeding parameters are reported for 1-3 study areas.
Assess coverage against information from Bird Atlas 2007-11 when available.

122
Raptor species
Summary of current state of trend production
Summary of caveats to current trends Future requirements for enhancing trend production
Long-eared owl
Monitoring too variable to produce any rigorous trends.
N/A Obtain outstanding grid references (NHZ 20). SRMG to consider how to enhance monitoring in future.
Short-eared owl
Monitoring too variable to produce any rigorous trends. Might be possible to look at crude abundance indices for some study areas but this would need further work to liaise with observers.
N/A SRMG to consider how to enhance monitoring in future.
Common Raven
Not considered in the current project because samples have only been adequate in very recent years in most study areas. Should be possible to produce study-area based trends for a number of NHZs in future.
N/A Encourage established studies to continue and expand.
Obtain remaining ca. 20% of grid-references.
Obtain information on study area boundaries and coverage/effort.
National BBS trend available. Need to check further whether national BBS trend is representative.
Assess coverage against information from Bird Atlas 2007-11 when available.

123
Table 3. Recommended enhancements to SRMS data curation to improve efficiency, cost-effectiveness and biological value. (Modified from previous review of SRMS data 2003-2008.)
Current shortfall Explanation of importance Required actions for improvement
and progress to date
Lack of routine recording by SRMS of important information types
1 Summary breeding information only provided to the SRMS (not details of individual breeding attempts)
Cannot assess coverage annually.
1a Encourage submission of full records by all observers.
Cannot produce rigorous trends.
Cannot link information to specific regions or designated sites.
1b REQUIRED QUICKLY: General onus that SRMS collects full records (and acceptance that summary data are of low utility). NOW IMPLEMENTED BY SRMS
2 Lack of grid references for some home ranges checked annually
Cannot assess coverage annually.
2a Work with observers to encourage submission of grid references that are lacking currently. Cannot produce rigorous
trends.
Cannot link information to specific regions or designated sites.
2b REQUIRED QUICKLY: SRMG to encourage ALL observers to submit grid references (including when new sites enter the annual monitoring sample). NOW IMPLEMENTED BY SRMS
3 Inconsistent recording of Source, Observer, Site Code, Site Name and Area/District (and link to grid-reference)
Cannot produce rigorous trends in breeding parameters.
3a REQUIRED QUICKLY BUT SHORT-TERM ONLY: Create master spreadsheets for all major contributors/coordinators (will improve but not solve problem and is a labour intensive approach).
Cannot track coverage/effort changes.
Incomplete recording of negative returns.
3b. Provide recording software that is fit for purpose. SRMS HAS AGREED TO DO THIS Cannot automatically check
annual data and revert to observers with queries.
4 Lack of recording of objective breeding outcome codes
Cannot produce rigorous trends in breeding parameters.
4a REQUIRED QUICKLY: Enhance current spreadsheet to record outcome objectively according to major causes of failure.
Cannot report objectively on causes of failure (including persecution).
4b Recording software that is fit for purpose. SRMS HAS AGREED THIS

124
Current shortfall Explanation of importance Required actions for improvement and progress to date
Lack of routine recording by SRMS of important information types
5 Lack of recording of visit dates / nest contents at each visit
Cannot assess extent of negative returns.
5a SHORT-TERM ONLY: Encourage ALL observers to complete existing spreadsheet with visit dates.
Cannot produce rigorous trends in breeding parameters.
5b Provide recording software that is fit for purpose, such that observers enter nest contents and date of each visit. SRMS HAS AGREED TO DO THIS
6 Lack of knowledge and recording of true monitoring spatial coverage and effort
Cannot produce rigorous trends in numbers.
6a REQUIRED QUICKLY: Implement a process to collate coverage/effort information from all regular observers. IN PROGRESS BY SRMS
Cannot assess to what extent trends in breeding parameters are representative.
6b Provide recording software that ensures that coverage/effort is recorded annually and that details of study areas are complete when new observers start raptor recording. SRMS HAS AGREED TO DO THIS
Overall inadequacy of MS Excel software
7 MS Excel software does not force consistency of recording across years
Much manual matching and checking of data sets is required annually prior to reporting.
7 Need to move to recording software where the format of data entry is more controlled and quality-checked at the point of submission. SRMS HAS AGREED TO DO THIS Problems 1-6 above will
continue to occur.
8 MS Excel not fit for purpose for recording coverage efficiently
Could be done but the ideal would be a system that could handle mapping to make storage of information more efficient.
8 Move to recording software that is fit for purpose for storing coverage and effort information (including study area boundaries on maps). SRMS HAS AGREED TO DO THIS

125
2. DATASETS AVAILABLE TO CONTRIBUTE TO SCOTTISH RAPTOR MONITORING
2.1 Background
There are ten raptor species listed under Annex 1 of the EC Birds Directive: golden eagle, hen harrier, honey buzzard, Eurasian marsh harrier, merlin, osprey, peregrine falcon, red kite, short-eared owl and white-tailed eagle. The data for these species have been scoped in detail (see Section 1). Here we consider other potential sources of breeding raptor information (Table 4) and their future potential for contributing to surveillance. 2.2 Surveillance of changes in breeding numbers
The periodic SCARABBS (Statutory Conservation Agencies and RSPB Breeding Bird Surveys) surveys of breeding raptors are designed to provide updated population estimates and measures of population change for the whole of the UK, Scotland and sometimes for limited regional populations (see Table 4). The periodic (rather than annual) nature of these surveys means that they provide a less sensitive measure of population change than annual monitoring and, if carried out in a single breeding season, the results can be biased by environmental conditions in that one year (e.g. weather, vole abundance). To date, the SCARABBS surveys have not been designed specifically to provide robust estimates of breeding population size or change at the NHZ-scale. The near-comprehensive surveys (golden eagle and peregrine falcon) have been able to provide this information for most NHZs however, via the Conservation Framework projects (Whitfield et al. 2008 for golden eagle; Roos et al. 2009 for peregrine falcon) but those SCARABBS surveys with a random sampling element (merlin and hen harrier) would require more intensive sampling to deliver this additional aim. The SCARABBS surveys that have achieved near comprehensive coverage of known breeding territories to date (golden eagle and peregrine falcon) provide an important baseline against which to assess the extent to which annual monitoring coverage of each species (SRMS coverage) is representative of the Scottish or NHZ-scale population (see Sections 1.2.6 and 1.2.9). The periodic BTO/BWI/SOC Bird Atlas 2007-11 project (Balmer et al. 2013) provides up-to-date distribution and relative abundance information for all regularly occurring raptors in Scotland at the 10-km resolution, and change measures comparable with the previous breeding atlas survey in 1988-91. The breeding season fieldwork for this project was carried out over four years, so that variable environmental conditions are taken into consideration (at least at a broad spatial scale). The results provide important baseline information on distribution and relative abundance against which to assess the extent to which annual SRMS monitoring coverage of each species is representative. It will also be possible to analyse for changes in relative abundance over the last 20 years at regional (NHZ) resolution. The BTO/JNCC/RSPB Breeding Bird Survey (see Section 1.1.1) reports trends in breeding abundance for widespread raptor species at the whole of Scotland scale (common buzzard, common kestrel and common raven are routinely reported annually, and Eurasian sparrowhawk is close to the required number of sample squares for annual reporting at national scale). The fieldwork methodology of this survey is not suitable for recording absolute breeding numbers of raptors, and (variable) proportions of non-breeding individuals will be included in the records each year (see Sections 1.2.5 and 1.2.13 for further information). For the BBS to be capable of delivering NHZ-specific trends, even for widespread raptor species, there would need to be a large increase in the annual sample of random 1-km squares surveyed by volunteers. This would be very difficult to achieve in practice, although such a change would deliver widespread benefits in terms of monitoring a range of other widespread bird species at smaller spatial scales (e.g. NHZ-scale).

126
Each year, specific surveys of breeding raptor numbers are also undertaken, for example for SNH Site Condition Monitoring (SCM) of designated sites, and as part of the monitoring required for development consenting (e.g. in relation to onshore wind farms). The SNH SCM summary database shows around 40 SPA/SSSIs for which assessments for raptors are made periodically: in 2011 these include golden eagle (9 sites covered); hen harrier (22 sites); Eurasian marsh harrier (2 sites); merlin (7 sites); osprey (12 sites); peregrine falcon (6 sites); and short-eared owl (5 sites). The raw data are not currently held in a central database but it would be useful to cross-check and ensure that the information collected annually as part of the SCM process is fed through to the main SRMS dataset. SCM and specific development monitoring data, if collated and made available, could play a useful part in building up a comprehensive picture of the distribution and relative abundance of raptor species across Scotland. It is unlikely, however, that they could contribute extensively to rigorous monitoring of changes in breeding numbers because of the sporadic nature of the surveys (although post-consent monitoring as a condition of development consent could contribute to long-term monitoring if methods are rigorous and consistent across a period of years, monitoring is annual or near-annual and data were submitted to the SRMS annually). This potential should be explored further in liaison with the Scottish Windfarm Bird Steering Group (see http://www.swbsg.org/). 2.3 Surveillance of changes in breeding parameters
Surveillance of changes in breeding parameters does not necessarily require such comprehensive survey effort as surveillance of breeding numbers but it is nonetheless important: (i) to assess the extent to which samples are representative of the spatial population under surveillance; (ii) to understand any implications of the turnover of sites in the sample; and (iii) to ensure that the field methodology and reporting is adequate for recording the parameter(s) of interest (see Sections 1.2.3-1.2.6). Of the schemes additional to the SRMS in Table 4, the BTO Nest Record Scheme (NRS) has the most potential to deliver additional rigorous monitoring of breeding parameters. A breakdown of Scottish raptor records submitted electronically to the NRS since 2007 is provided in Annex Table B 37. Most (but not all) of these data are also submitted to the SRMS (at least in summarised form). A further cross-check between the NRS and the SRMS would be useful, however, and pathways of ensuring appropriate flows of information between the NRS and SRMS should be explored further in future. A closer future relationship with the NRS will be beneficial given the need for the SRMS to develop its data collation/submission processes (Section 1.3.3), and also ongoing development of the NRS towards more integrated demographic monitoring of numbers in study areas as well as breeding performance (Dave Leech, BTO, pers. comm.).
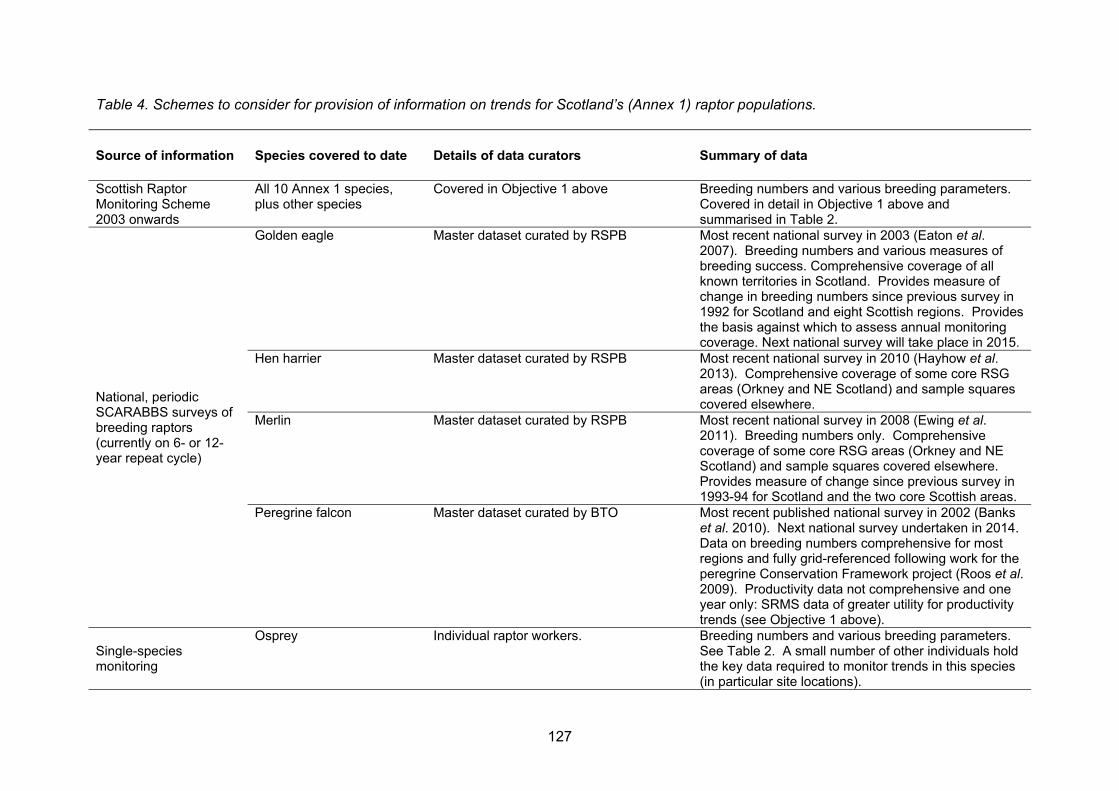
127
Table 4. Schemes to consider for provision of information on trends for Scotland’s (Annex 1) raptor populations.
Source of information Species covered to date Details of data curators Summary of data
Scottish Raptor Monitoring Scheme 2003 onwards
All 10 Annex 1 species, plus other species
Covered in Objective 1 above Breeding numbers and various breeding parameters. Covered in detail in Objective 1 above and summarised in Table 2.
National, periodic SCARABBS surveys of breeding raptors (currently on 6- or 12-year repeat cycle)
Golden eagle Master dataset curated by RSPB Most recent national survey in 2003 (Eaton et al. 2007). Breeding numbers and various measures of breeding success. Comprehensive coverage of all known territories in Scotland. Provides measure of change in breeding numbers since previous survey in 1992 for Scotland and eight Scottish regions. Provides the basis against which to assess annual monitoring coverage. Next national survey will take place in 2015.
Hen harrier Master dataset curated by RSPB Most recent national survey in 2010 (Hayhow et al. 2013). Comprehensive coverage of some core RSG areas (Orkney and NE Scotland) and sample squares covered elsewhere.
Merlin Master dataset curated by RSPB Most recent national survey in 2008 (Ewing et al. 2011). Breeding numbers only. Comprehensive coverage of some core RSG areas (Orkney and NE Scotland) and sample squares covered elsewhere. Provides measure of change since previous survey in 1993-94 for Scotland and the two core Scottish areas.
Peregrine falcon Master dataset curated by BTO Most recent published national survey in 2002 (Banks et al. 2010). Next national survey undertaken in 2014. Data on breeding numbers comprehensive for most regions and fully grid-referenced following work for the peregrine Conservation Framework project (Roos et al. 2009). Productivity data not comprehensive and one year only: SRMS data of greater utility for productivity trends (see Objective 1 above).
Single-species monitoring
Osprey Individual raptor workers. Breeding numbers and various breeding parameters. See Table 2. A small number of other individuals hold the key data required to monitor trends in this species (in particular site locations).

128
Source of information Species covered to date Details of data curators Summary of data
Red kite RSPB/SNH (Covered in Objective 1 and master dataset curated by RSPB)
Breeding numbers and various breeding parameters. Covered in detail in Objective 1 above and summarised in Table 2.
White-tailed eagle RSPB/SNH (Covered in Objective 1 and master dataset curated by RSPB)
Breeding numbers and various breeding parameters. Covered in detail in Objective 1 above and summarised in Table 2.
Rare Breeding Birds Panel (RBBP)
Rarer species Master dataset held by Mark Holling (RBBP Secretary)
All relevant information for Scotland is currently shared with the SRMS.
BTO/JNCC/RSPB Breeding Bird Survey (BBS) 1994 onwards
Widespread (non-Annex 1) species
Organised and data curated by BTO Abundance data for common buzzard, sparrowhawk, kestrel and raven covered in Objective 1 above.
SNH Site Condition Monitoring surveys (SCM)
Annex 1 species Data curated by SNH Summary of data holdings held centrally by SNH but raw data not held in central electronic database.
Wind farm pre- and post-construction monitoring
Focus on Annex 1 species No central database at present; raptor data from a small number of consultants is submitted to the SRMS annually.
The recently established Scottish Wind farm Bird Steering Group will be addressing collation of wind farm monitoring data as part of its remit.
Nest Record Scheme (NRS)
BTO/JNCC (organised and data curated by BTO)
A summary of current data holdings for Scottish raptor species is given in Annex Table B 37. Most records are also submitted to the SRMS.
BTO/BWI/SOC Bird Atlas 2007-11
All breeding and wintering species in Scotland
Organised and data curated by BTO for Scotland
Periodic survey of breeding distribution and spatial variation in relative abundance (ca every 20 years), directly comparable with 1988-91 atlas survey for most raptor species. Of great value in assessing current range and spatial variation in relative abundance of raptors (against which to assess current monitoring effort; see Table 2) and potentially for generating improved national and regional population estimates (particularly if used together with information from intensive studies).

129
3. INDICATORS OF SCOTTISH RAPTOR POPULATIONS
3.1 Background and aims
Indicators have become much-used in conservation and land-use management in recent decades as a means of synthesizing simplified and useful information from complex systems, often integrating multiple sources of data (Jackson et al. 2000). The terms ‘indicator’, ‘indicator species’, ‘signal species’, ‘bio-indicator’ or ‘bio-monitor’ have all become widely used and their relative meanings and merits debated in the literature (e.g. Landres et al. 1988; Simberloff 1998; Caro & O'Doherty 1999; Hilty & Merenlender 2000; Lindenmayer et al. 2000; Gregory et al. 2005). Birds are widely used in indicators of environmental health because of their conspicuousness, their mobility across landscapes (and hence rapid response to pressures compared to some other taxa), the diversity of species, their appeal to the public, the availability of suitable data and their potential loyalty to specific habitat types (Gregory et al. 2004; Gregory et al. 2005). Further useful background to the various types of indicator that have been used and their development in the UK and Scotland to date is provided in Annex D. Here we consider the usefulness and feasibility of producing a robust indicator, or indicators, specifically for Scottish raptor populations, potential methods for doing so, and the data sets available (from Sections 1 and 2). 3.2 Considerations specific to raptors in Scotland
The future development of Scottish raptor indicators needs to involve the following considerations:
(i) selection of target geographical areas (scale of reporting), habitats, or drivers of interest;
(ii) identification of the type of indicator required; (iii) selection of appropriate datasets (species and parameters of interest) from the
evidence base of species associated with these habitats, areas or drivers; and (iv) selection of statistical rules for calculation of indicators.
Raptors pose some special problems in their use in composite (and habitat-specific) indicators. Firstly, although some are restricted to particular habitats, many, like common buzzard, have broad habitat preferences. Second, the assumption that species with very small population sizes are likely to be restricted to a small area does not hold true for most raptors, which due to their position at the top of the food chain, mobility and large territories, can be both scarce and widespread (e.g. merlin, golden eagle, northern goshawk). Thirdly, numbers of some species, such as red kite and white-tailed eagle, have been strongly influenced by specific conservation interventions such as reintroductions. Changes in their numbers are therefore unlikely to be indicative of wider ecosystem or guild processes. 3.2.1 Choice of geographical scale
If a Scottish raptor national headline indicator were desirable, it is important to consider that headline indicators are a unique type of indicator, intended to provide simple immediate information to policy makers, decision makers and the general public. Headline indicators are meant to communicate the general story rather than provide detailed information. They are not a substitute for the detailed knowledge needed to assess the causes of change in individual species, or ecosystems, and then to formulate strategies in response (Bibby 1999). Moreover, headline indicators will only work effectively when they are few in number.
130
There is a risk that an overall composite raptor indicator for Scotland could suffer from lack of interpretability. For example, the inclusion of data from red kites or white-tailed eagles – both of which are increasing in number after reintroduction schemes – could cause declines in other species to be masked. The inclusion of recent hen harrier population data might skew an upland indicator downward whilst reflecting a driver (human persecution) that does not necessarily affect, to the same extent, other species in the habitat or guild. The inclusion of common buzzard data might be questionable purely because the influences behind the species’ recent and substantial expansion are not fully understood. It is important to be clear about what additional information such an overall composite indicator would provide and thus of its utility as a headline indicator. This does not mean that population trends for individual species’ trends lack utility however; as a collective – as opposed to a composite – they provide a comprehensive and varied reflection of a wide variety of external drivers operating in the Scottish natural environment. For example, the simultaneous inspection of productivity and/or population trends for both merlin and hen harrier could provide an indication of the degree to which human persecution affects the latter, given that the overlap of environmental influences of the species is otherwise considerable. The comparison of indices of northern goshawks and common kestrels in the same regions would give insight into the potential role of the expansion of the former in the decline of the latter (e.g. Petty et al. 2003). For any given species’ trends, the performance of others will help to identify which drivers are exerting the most influence, by offering additional evidence, in the manner of a (qualitative) simultaneous equation. National indicators can only be drawn from species with satisfactory monitoring coverage across their Scottish range. In addition, in order to produce satisfactory ecological indicators, the selected species should exist in relatively stable populations of appreciable size (i.e. not white-tailed eagle, red kite, European honey buzzard). Species/parameters for inclusion must be carefully chosen so as to reliably represent the environmental condition/driver that the indicator is designed to indicate. Regional variability across Scotland in environmental conditions may be considerable, with several of the key issues affecting raptor populations (e.g. commercial forestry, over-grazing, agricultural intensification, persecution, prey depletion) showing strong spatial variation. In this sense, indicators limited to certain regions or habitats might be more meaningful and interpretable than those that attempt to capture the overall ‘state’ of raptor populations in Scotland (and thereby over-arching environmental conditions). Regional bird indicators have been developed for Government Office Regions in England and trialled for Natural Heritage Zones in Scotland, but there are often practical problems in generating trends from so much smaller data sets, as well as in achieving comparable indicators across regions. 3.2.2 Selection of habitat(s)
The association of species with habitat types has been central to the development of composite bird indicators in the UK and Europe to date. In developing bird indicators for Scotland (Noble et al., 2007), habitat information recorded on BBS sites was used to firstly classify species as habitat generalists or specialists and, secondly, to derive habitat-specific trends for species found in more than one major habitat (e.g. farmland and woodland). Trends for individual bird species selected as representative of habitats were then amalgamated into composite indicators using methods consistent with other bird indicators for the UK and Europe. Within these composite UK and Scottish wild bird indicators, widespread and annually-monitored raptor species such as Eurasian sparrowhawk (in woodland) and common kestrel (in farmland) are included, along with other bird species associated with the same habitats. In the Scottish Terrestrial Breeding Bird Indicator, BBS count data for species showing preferences for more than one major habitat are analysed separately to generate habitat-specific population trends. Hence, a woodland-specific common buzzard trend contributes to the Scottish woodland bird indicator and a farmland-specific common buzzard trend contributes to the farmland bird indicator. Population trends
131
for less common raptors such as peregrine falcon and golden eagle, monitored only periodically, are generated by interpolation between census years, and these trends contribute to the overall indicator and to woodland or upland indicators as appropriate, according to the classification of raptors in Gibbons et al. (1993). Due to their position near the top of food webs, there could be utility in using changes in populations of one or a small number of raptor species to reflect wider environmental quality for specific Scottish habitats. For example, the merlin might be a particularly suitable indicator species for upland habitats, being relatively widespread, well-monitored, and mostly free from persecution. It is also relatively short-lived and hence numerically responsive to change, although migration away from the uplands in the winter might complicate the drivers of changes in abundance. A reliable productivity metric such as mean number of fledglings per successful clutch might be preferred to abundance in this context. Scottish data for merlin could feasibly be combined with those from hen harrier and/or golden eagle to produce an indicator of upland quality, although the interpretability of such an indicator might still be influenced by spatial and interspecific variation in drivers. Current data on merlin (and other species) would first need to be validated by reference to the observer coverage, which is not yet fully documented (Section 1). There is, for example, possible concern that in some study areas merlin breeding attempts may be recorded when observers are searching more specifically for hen harriers – hence the coverage in some areas may be dependent to an extent on the distribution and abundance of the latter species. 3.2.3 Drivers of change
The approach taken to date in developing the suite of composite wild bird indicators for different habitat types is that they are not intended to reflect specific pressures, but rather to reflect the cumulative impacts of multiple pressures at a landscape scale (overall state indicators). Raptor populations in Scotland are subject to a wide range of ecological and environmental drivers including afforestation, changes in agricultural land use and land management of other habitats, deliberate persecution by humans, incidental poisoning and disturbance, impacts of pollutants, changes in fisheries, changes in prey species abundance, effects on wintering areas, climate change and interactions with other raptors and mammalian predators. It might in theory therefore be possible to construct raptor indicators that link populations at national or regional scales to the strength or likelihood of these pressures (these could also be developed in a similar manner to the climate change indicators for Europe, in which the strengths of both negative and positive responses to particular drivers are used in the indicator). Note that single-pressure indicators, designed to reflect ecological response to individual pressures, for example, aquatic invertebrate community measures that reflect point sources of sewage treatment effluent (Wright et al., 1998), cannot safely be extrapolated to conclusions about other attributes of ecosystem health (Boon and Howell, 1997). 3.2.4 Suitability of demographic parameters for inclusion
Information on changes in the breeding abundance of Scottish raptors is available for a number of species, based on counts using a rigorous sampling design (e.g. BBS for common buzzard and kestrel), annual counts in study areas or nationally (e.g. SRMS datasets), or interpolation between periodic censuses (e.g. SCARABBS datasets; see Sections 1 and 2). Abundance data will vary in utility for indicator production from species to species. Use of abundance change as an indicator of environmental drivers, whether comprised of data from single or multiple species, makes the tacit assumption that the species exist(s) at or close to the carrying capacity of the environment (or at least exhibits long-term population stability), such that overall numbers will be susceptible to changes in one or more environmental drivers. The numerical response of a species with a population reduced to well below carrying capacity by human intervention (for example a species
132
recovering from historical persecution and pesticide effects like peregrine falcon) may be negligible or slow, highly variable geographically, or conversely very rapid, which may render it harder to either detect or to ascribe to any given driver than a change. In the early stages of recovery from such human intervention, a rapid rate of population increase may indicate that the suppressive effects of the human intervention factor have been removed but, if included in an ecological indicator, could give a falsely positive impression of overall ecological conditions. Human persecution of widespread and established species in Scotland, such as golden eagle and hen harrier, therefore provides a challenge in the development of ecological indicators, given that the scale and effect of this source of mortality is difficult to quantify, and sometimes cannot therefore be easily separated from other potential drivers of population change. If illegal human interference is one of the key drivers of change for particular species, the abundance of these raptors may be wholly unrelated to that of other species in the same habitat, thereby rendering an ecological indicator based on abundance of limit utility. Raptors are relatively long-lived, and thus their numerical response to certain environmental drivers is likely to be delayed, particularly for the larger species. For such species, changes in breeding parameters may provide a more immediate measure of changes in environmental quality than abundance. The current Seabird Indicator (now included in the UK headline indicator) is based upon the monitoring of numbers at breeding colonies, but as long-lived seabirds may not show the population-level impact of reduced breeding success for some years, a complementary indicator based on annual productivity has also been developed. This makes use of good information on year-to-year changes in productivity, and serves to illustrate clearly illustrating the trend for widespread breeding failure across multiple species in recent years. For raptors, there is a risk that for some species data collection may be biased towards successful pairs/sites/territories (Section 1). In this case, breeding parameters must be chosen carefully to minimise any potential bias from this observer behaviour. Within current SRMS data, the mean number of fledglings per successful clutch is likely to be more reliable than overall fledging rate (though may still be biased towards higher quality pairs, since those pairs that rear the smallest clutches may also be those most likely to have failed in previous years, and hence dropped off the list of monitored territories). The mean number fledged per successful clutch may also have the advantage of being largely independent of any effects of illegal human activity, since it is unlikely that only a fraction of a given brood would be destroyed whilst still in the nest. Productivity parameters have the additional advantage over abundance that they are much less influenced by factors outside the breeding season. Individuals of species such as merlin, hen harrier and osprey (as well as the rarer species such as European honey buzzard and Eurasian hobby) may over-winter some distance from the breeding grounds, such that annual abundance indices at least partly reflect environmental conditions in areas that may not even be within Scotland, let alone the habitat or region of interest. Individual raptors in some low-density populations may suffer less from intra-specific competition, and hence achieve higher productivity, than those with more neighbours, so that the use of productivity data from species existing well below carrying capacity may still be problematic. Ideally, any indicator based upon productivity data needs to be considered alongside simultaneous population abundance data to ensure that increased productivity is not a function merely of increasing rarity, and resulting reduction in competition – and hence a negative rather than positive response. For many of the longer-lived raptors, individuals may not breed until their second, third or even fourth year. In a stable population with relatively stable adult survival rates, the age structure of breeding birds is likely to remain fairly stable also, such that the proportion of immature breeders in the population may provide a good indication of external change. Unusually frequent occurrence of sub-adults in the Scottish golden eagle breeding population (and non-breeding occupancy of vacant territories) has been related to poor

133
survival of adults, and hence illegal human activity (Whitfield et al. 2004a, b), a phenomenon noted in other long-lived species such as Bonelli’s eagle (Aquila fasciata) and the Spanish imperial eagle (Aquila adalberti) (Balbontin et al. 2003; Ferrer et al. 2003). The age structure of breeding hen harriers may not be so obviously related to adult survival rates, due to the occurrence of polygyny, the extent of which varies temporally and spatially for reasons most likely related to food supplies (Simmons et al. 1986; Simmons 2000; Amar et al. 2003; Redpath et al. 2006). The type of change signified by changes in breeding age structure will once again depend upon the initial population conditions; species in a phase of population/range expansion may contain a higher proportion of immature breeders as a result of reduced competition with territory-holding adults, although the extent to which this occurs will be species-specific (immature common buzzards, for example, disperse relatively short distances and seem to prefer natal areas with adults present to empty suitable habitat further afield; Walls & Kenward 1998). At the national level, the proportion of immatures in the northern goshawk population might reflect either reduced adult survival (negative) or population expansion (positive). It would be necessary in this instance to relate this parameter to observer coverage and population density in order to distinguish between these disparate inferences. We consider that raptor workers should be further encouraged to record information on the age of individual birds occupying breeding sites for species that can be aged with reasonable certainty in the field (e.g. golden eagle and peregrine falcon), as changes in age structure provide complementary information to other changes in overall breeding numbers and productivity. 3.2.5 Statistical decisions
The statistical power to detect change in trends of this type, whether single species or composite indicators, is affected by count variability in space and time, the magnitude of observed changes, the length of the time series, the number of survey plots, and sampling error associated with the survey design. It is important to think very carefully about sensible combinations of species groups, taking into account differences in such issues as precision and accuracy of the underlying data, species response times, numbers of species per group, and the need for weighting. A problem particular to developing a Scottish raptor indicator is the relatively small number of species and hence fewer possible combinations of species that are possible. 3.3 Conclusions
Raptors are a small guild with relatively little overlap in terms of niche; i.e. each species tends to be more distinct from any other than would be the case with a suite of granivorous passerines, for example. This relative lack of overlap lessens the scope for a suite of species to provide a robust guild-level indicator as opposed to a set of disparate trends that probably become less meaningful when combined. Careful consideration must therefore be given to what inferences might be drawn from an indicator or indicators taken from a suite of Scottish raptors. Trends in abundance for some of the more widespread raptor species are already included in the Scottish terrestrial breeding bird indicator. As the SRMS moves towards the production of more national species trends from its data holdings (which are likely to be more accurate than some of the trends used in the indicators currently; Section 1), it will be important that these then become part of the national indicators, where the trends can be broken down appropriately by habitat (either for species restricted to one habitat, or habitat-specific trends for less specialised species). In order to achieve the latter, SRMS records will need to be fully spatially referenced at an appropriate resolution for use with land classification data sets (six-figure grid references will be important).
134
Changes in bird abundance are already used as headline indicators of overall wildlife health because birds in general are wide-ranging in habitat use, tend to be at, or near, the top of the food chain, have great public resonance, and hence were judged to be an excellent way to raise awareness of biodiversity issues. Whether an indicator for raptors alone would add anything further to this needs careful consideration but there may well be merit in such an indicator. Populations of a range of raptor species (some of which are top predators) that were stable or fluctuating around equilibria would be broadly indicative of a healthy, balanced ecosystem (e.g. Newton 1979; Rodríguez-Estrella et al. 1998). Now, or in the near future, it should be possible to produce broadly representative national trends in abundance for a good number of the Scottish raptor species (red kite; white-tailed eagle; hen harrier; northern goshawk; common buzzard; golden eagle; merlin; peregrine falcon; and barn owl). National trends may also be possible for osprey, common kestrel (from BBS only), common raven and for the small number of Eurasian marsh harriers; but not for Eurasian sparrowhawk, tawny owl, long-eared owl or short-eared owl in the near future (Table 2). It is questionable whether the two species (red kite and white-tailed eagle) with rapidly growing populations as a result of ongoing reintroductions should be included in a headline raptor indicator (see Annex D for equivalent considerations for rare species within the UK wildbird indicators). If an indicator were to include these species, their rapid population growth could mask adverse declines in other species unless some appropriate weighting were specifically applied. Moreover, the interpretation of the indicator would require not only knowledge of the reintroduction schemes, but also an understanding of the notions of carrying capacity and population stability. These issues could mean that the indicator would be potentially misleading (due to masking of declines) and difficult for non-specialists (e.g. the public) to interpret. At the time of undertaking this study it was not possible to produce an indicator for raptor populations in Scotland. Once data have been analysed for a greater range of species an indicator or indicators should be given more detailed consideration.
135
4. REFERENCES
Adams, S.M. (ed.). 2002. Biological Indicators of Aquatic Ecosystem Stress. Wallingford, Cab Publishing. Amar, A., Redpath, S. & Thirgood, S. 2003. Evidence for food limitation in the declining hen harrier population on the Orkney Islands, Scotland. Biological Conservation 111, 377-384. Amar, A., Court, I.R., Davidson, M., Downing, S., Grimshaw, T., Pickford, T. & Raw, D. 2012. Linking nest histories, remotely sensed land use data and wildlife crime records to explore the impact of grouse moor management on peregrine falcon populations. Biological Conservation 145(1), 86-94. Anonymous. 2002. Scottish Raptor Monitoring Scheme Agreement. Scottish Natural Heritage. Austin, G.E., Rehfisch, M.M. & Banks, A. 2007. Natural Heritage Trends: developing a Scottish Wintering Waterbird Indicator. Scottish Natural Heritage Commissioned Report No. 227. Baillie, S.R., Marchant, J.H., Leech, D.I. et al. 2012. BirdTrends 2011. BTO Research Report No. 609. BTO, Thetford. Available at: http://www.bto.org/birdtrends. Balbontin, J., Penteriani, V. & Ferrer, M. 2003. Variations in the age of mates as an early warning signal of changes in population trends? The case of Bonelli’s eagle in Andalusia. Biological Conservation 109, 417-423. Balmer, D.E., Gillings, S., Caffrey, B.J. & Swann, R.L. 2013. Bird Atlas 2007-11: the breeding and wintering birds of Britain and Ireland. BTO Books, Thetford. Banks, A. N., Crick, H. Q. P., Coombes, R. et al. 2010. The breeding status of peregrine falcons Falco peregrinus in the UK and Isle of Man in 2002. Bird Study 57, 421-436. Bibby, C.J. 1999. Making the most of birds as environmental indicators. Ostrich 70, 81-88. Boon, P. J. and Howell, D. L. (eds.). 1997. Freshwater Quality: Defining the Indefinable? The Stationery Office, Edinburgh. Butchart, S.H.M., Stattersfield, A.J., Bennun, L.A. et al. 2004. Measuring Global Trends in the Status of Biodiversity: Red List Indices for Birds. PLoS Biol 2(12), e383. doi:10.1371/journal.pbio.0020383. Butchart, S.H., Resit Akçakaya, H., Chanson, J. et al. 2007. Improvements to the Red List Index. PLoS ONE 2(1), e140. doi:10.1371/journal.pone.0000140 Caro, T.M. & O'Doherty, G. 1999. On the use of surrogate species in conservation biology. Conservation Biology 13, 805-814. Dayton, P.K. 1972. Toward an understanding of community resilience and the potential effects of enrichments to the benthos of McMurdo Sound, Antarctica. In: Parker, B.C. (Ed). Proceedings of the colloquium on conservation problems in Antarctica. Lawrence, KS: Allen Press.
136
Defra. 2014. Wild birds populations in the UK, 1970 to 2013. Available at: https://www.gov.uk/government/uploads/system/uploads/attachment_data/file/372755/UK_Wild_birds_1970-2013_final_-_revision_2.pdf Eaton, M.A., Dillon, I.A., Stirling-Aird, P.K. & Whitfield, D.P. 2007. Status of the golden eagle Aquila chrysaetos in Britain. Bird Study 54, 212-220. Evans, R.J., Wilson, J.D., Amar, A. et al. 2009. Growth and demography of a re-introduced population of White-tailed Eagles Haliaeetus albicilla. Ibis 151, 244–254. Everard, M. 2008. Viewpoint: Selection of taxa as indicators of river and freshwater wetland quality. Aquatic Conservation: Marine and Freshwater Ecosystems 18, 1052-1061. Ewing, S.R., Rebecca, G.W., Heavisides, A. et al. 2011. Breeding status of merlins Falco columbarius in the UK in 2008. Bird Study 58(4), 379-389. Ferrer, M., Penteriani, V., Balbontin, J. & Pandolfi, M. 2003. The proportion of immature breeders as a reliable early warning signal of population decline: evidence from the Spanish imperial eagle in Donana. Biological Conservation 114, 463-466. Fielding, A. & Haworth, P. 2011. The Identification of Important Localities for Breeding Merlins in Scotland. Report by Haworth Conservation to Scottish Natural Heritage (Contract SNH PO No. 33426). Fielding, A., Haworth, P., Whitfield, P., McLeod, D. & Riley, H. 2011. A Conservation Framework for Hen Harriers in the United Kingdom. JNCC Report 441. Joint Nature Conservation Committee, Peterborough. Furness, R.W. & Greenwood, J.J.D. (eds.). 1993. Birds as Monitors of Environmental Change. London, Chapman & Hall. Garibaldi, A. & Turner, N. 2004. Cultural keystone species: implications for ecological conservation and restoration. Ecology and Society 9(3), 1. Gibbons, D.W., Reid, J.B. & Chapman, R.A. 1993. The New Atlas of Breeding Birds in Britain and Ireland: 1988-1991. T & AD Poyser, London. Gregory, R.D., Noble, D., Field, R. et al. 2003. Using birds as indicators of biodiversity. Ornis Hungarica 12–13, 11-24. Gregory, R.D., Noble, D. & Custance, J. 2004. The state of play of farmland birds: population trends and conservation status of lowland farmland birds in the United Kingdom. Ibis 146, 1-13. Gregory, R.D., van Strien, A., Vorisek, P. et al. 2005. Developing indicators for European birds. Philosophical Transactions of the Royal Society B, 360, 269-288. Grime, J.P. 1984. Dominant and subordinate components of plant communities: implications for succession, stability and diversity. In: Gray, A.J. and Crawley, M.J. (eds.) Colonization, succession and stability. Oxford, Blackwell. Hanski, I. 1982. Dynamics of regional distribution: the core and satellite species hypothesis. Oikos 38, 210-221.

137
Hardey, J., Crick, H., Wernham, C. et al. 2013. Raptors. A Field Guide for Surveys and Monitoring. 3rd Edition. The Stationery Office, Edinburgh. Hayhow, D.B., Eaton, M.A., Bladwell, S. et al. 2013. The status of the Hen Harrier, Circus cyaneus, in the UK and Isle of Man in 2010. Bird Study, 60, 446-458. Hilty, J. & Merenlender, A.M. 2000. Faunal indicator taxa selection for monitoring ecosystem health. Biological Conservation 92,185-197. Huston, M.A. 1994. Biological Diversity: The Coexistence of Species on Changing Landscapes. Cambridge, UK: Cambridge University Press. Jackson, L.E., Kurtz, J.C. & Fisher, W,S. 2000. Evaluation Guidelines for Ecological Indicators. Environmental Protection Agency, Washington DC, Report No. EPA/620/R-99/0005. 110pp. Jones, C.G., Lawton, J.H. & Shachak, M. 1994. Organisms as ecosystem engineers. Oikos 69, 373-386. Jones, G., Jacobs, D.S., Kunz, T.H., Willig, M.R. & Racey, P.A. 2009. Carpe noctem: the importance of bats as bioindicators. Endangered Species Research 8, 93-115. Landres, P.B., Verner, J. & Thomas, W.J. 1988. Ecological uses of vertebrate indicator species: a critique. Conservation Biology 4,316-32. Leader-Williams, N. & Dublin, H.T. 2000. Charismatic megafauna as 'flagship species'. In Entwhistle, A. & Dunstone, N. (eds.) Priorities for the Conservation of Mammalian Diversity: Has the Panda had its Day? pp 53-81 Cambridge: Cambridge University Press. Lindenmeyer, D.B., Margules, C.R. & Botkin, D.B. 2000. Indicators of biodiversity for ecologically sustainable forest management. Conservation Biology 14(4), 941-950. McKinney, M.L. & Lockwood, J.L. 1999. Biotic homogenization: a few winners replacing many losers in the next mass extinction. Trends in Ecology and Evolution 14, 450-453. Marquiss, M. 2011. Goshawk Accipiter gentilis. In Francis, I. & Cook, M. (eds.) The Breeding Birds of North-East Scotland. pp. 138-139. Scottish Ornithologists’ Club, Aberdeen. Marquiss, M., Petty, S.J., Anderson, D.I.K & Legge, G. 2003. Contrasting population trends of the northern goshawk (Accipiter gentilis) in the Scottish/English borders and north-east Scotland. In Thompson, D.B.A., Redpath, S.M., Fielding, A.H., Marquiss, M. & Galbraith, C.A. (eds.). Birds of Prey in a Changing Environment. pp 143-148. The Stationery Office, Edinburgh. McGeoch, M.A. 1998. The selection, testing and application of terrestrial insects as bioindicators. Biological Reviews of the Cambridge Philosophical Society, 73, 181-201. Newton, I. 1979. Population Ecology of Raptors. T & AD Poyser, Berkamsted. Niemeijer, D. & de Groot, R.S. 2007. A conceptual framework for selecting environmental indicator sets. Ecological Indicators 8, 14-25. Noble, D.G., Joys, A.C. and Eaton, M.A. 2007. Natural Heritage Trends: A Scottish Biodiversity Indicator for Terrestrial Breeding Birds. Scottish Natural Heritage Commissioned Report No.245.
138
OECD. 1999. Environmental Indicators for Agriculture: Volume 1. Concepts and Frameworks. Organisation for Economic Cooperation and Development, Paris, 45pp. Paine, R.T. 1969. A note on trophic complexity and community stability. The American Naturalist 103, 91-93. Petty, S.J., Anderson, D.I.K., Davison, M. et al. 2003. The decline of Common Kestrels Falco tinnunculus in a forested area of northern England: the role of predation by Northern Goshawks Accipiter gentilis. Ibis 145, 472-483. Redpath, S., Leckie, F.M., Arroyo, B., Amar, A. & Thirgood, S.J. 2006. Compensating for the costs of polygyny in hen harriers Circus cyaneus. Behavioral Ecology and Sociobiology, 60, 386-391. Riddle, G. 2011. Kestrels for Company. Dunbeath, Caithness, Whittles Publishing. Risely, K., Renwick, A.R., Dadam, D. et al. 2011. The Breeding Bird Survey 2010. BTO Research Report No. 597. Rodríguez-Estrella, R., Donázar, J.A. & Hiraldo, F. 1998. Raptors as indicators of environmental change in the scrub habitat of Baja California Sur, Mexico. Conservation Biology 12, 921-925. Roos, R., Humphreys, L. & Wernham, C. 2009. Breeding occupancy and productivity of the Scottish population of peregrine falcon (Falco peregrinus): a comparison between the 1991 and 2002 national peregrine surveys by biogeographical region of Scotland. Report to Scottish Natural Heritage and the Scottish Raptor Monitoring Group. BTO Scotland, Stirling. SAS Institute Inc. 2008. SAS/STAT 9.2. Users Guide. Cary, NC, US. Sergio, F., Newton, I. & Marchesi, L. 2008. Top predators and biodiversity: much debate, few data. Journal of Applied Ecology 45, 992-999. Simberloff, D. 1998. Flagships, umbrellas and keystones: is single-species management passé in the landscape era? Biological Conservation 83(3), 247-257. Simmons, R. E. 2000. Harriers of the World. Oxford University Press, Oxford. Simmons, R., Barnard, P., MacWhirter, B. & Hansen, G.L. 1986. The influence of microtines on polygyny, productivity, age, and provisioning of northern harriers: a 5 year study. Canadian Journal of Zoology 64, 2447-2456. Smart, J., Amar, A., Sim, I.M.W. et al. 2010. Illegal killing slows population recovery of a re-introduced raptor of high conservation concern – the red kite Milvus milvus. Biological Conservation 143, 1278-1286. Taylor, I.R. 1989 The Barn Owl. Shire Publications, Aylesbury. Taylor, I.R. 1994. Barn Owls: Predator-Prey Relationships and Conservation. Cambridge University Press, Cambridge. Ten Brink, B.J.E. 2000. Biodiversity indicators for the OECD. Environmental Outlook and Strategy. RIVM Rapport, 402001014, Globo Report Series 25.

139
Van Strien, A. J. 1999. From monitoring data to policy-relevant summary statistics. Bird Numbers 1998. Vogelwelt 120, 67-71. Walls, S.S. & Kenward, R.E. 1998. Movements of radio-tagged buzzards Buteo buteo in early life. Ibis 140, 561-568. Whitfield, D.P., Fielding, A.H., McLeod, D.R.A. & Haworth, P.F. 2004a. The effects of persecution on age of breeding and territory occupation in golden eagles in Scotland. Biological Conservation 118, 249-259. Whitfield, D.P., Fielding, A.H., McLeod, D.R.A. & Haworth, P.F. 2004b. Modelling the effects of persecution on the population dynamics of golden eagles in Scotland. Biological Conservation 119, 319-333. Whitfield, D.P., Fielding, A.H., McLeod, D.R.A. et al. 2007. Factors constraining the distribution of golden eagles Aquila chrysaetos in Scotland. Bird Study 54, 199-211. Whitfield, D.P., Fielding, A.H., McLeod, D.R.A. & Haworth, P.F. 2008. A conservation framework for golden eagles: implications for their conservation and management in Scotland. Scottish Natural Heritage Commissioned Report No.193. Wright, J.F., Armitage, P.D., Furse, M.T. & Moss, D. 1988. A new approach to the biological surveillance of river quality using macroinvertebrates. Verh. int. theor. angew. Limnol. 23, 1548-1552.

140
ANNEX A: BBS MAPS
Figure A1. Map showing the distribution of squares in Scotland surveyed under the BTO/JNCC/RSPB Breeding Bird Survey in 2010 in which no sparrowhawks were recorded (open circles) and those in which sparrowhawks were recorded (solid circles). (Source: Kate Risely, BTO, pers. comm.)

141
Figure A2. Map showing the distribution of squares in Scotland surveyed under the BTO/JNCC/RSPB Breeding Bird Survey in 2010 in which no common buzzards were recorded (open circles) and those in which common buzzards were recorded (solid circles). (Source: Kate Risely, BTO, pers. comm.)
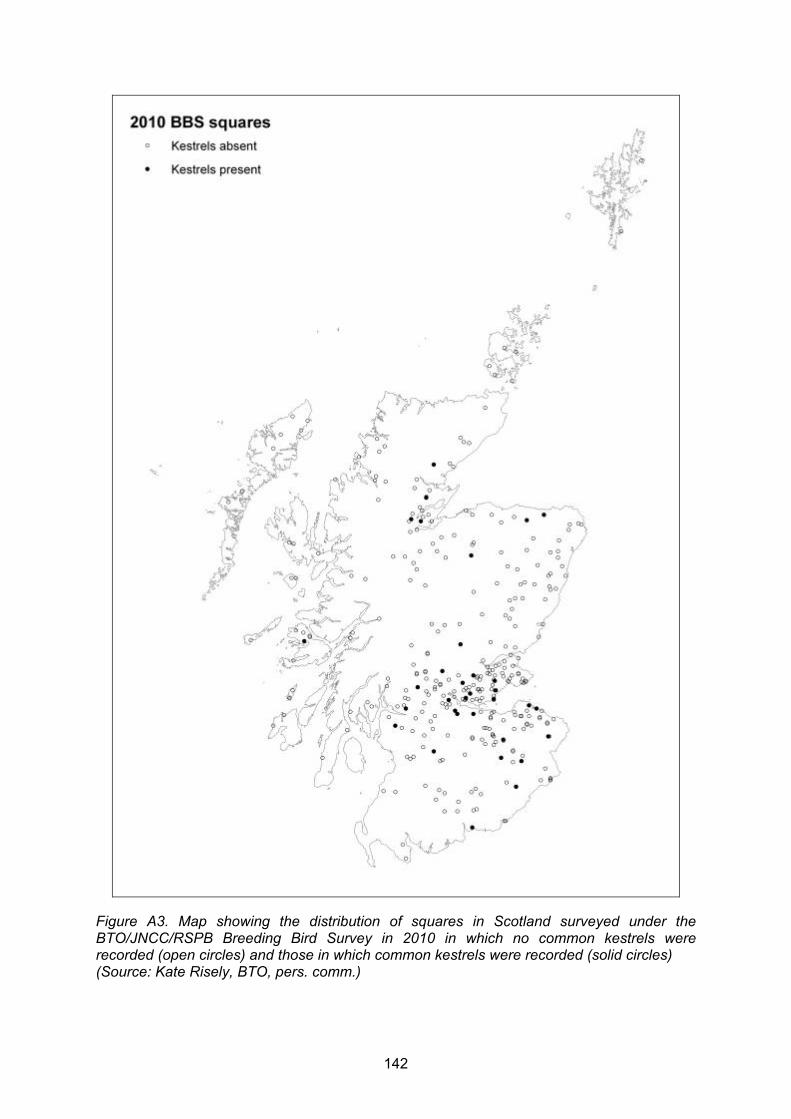
142
Figure A3. Map showing the distribution of squares in Scotland surveyed under the BTO/JNCC/RSPB Breeding Bird Survey in 2010 in which no common kestrels were recorded (open circles) and those in which common kestrels were recorded (solid circles) (Source: Kate Risely, BTO, pers. comm.)
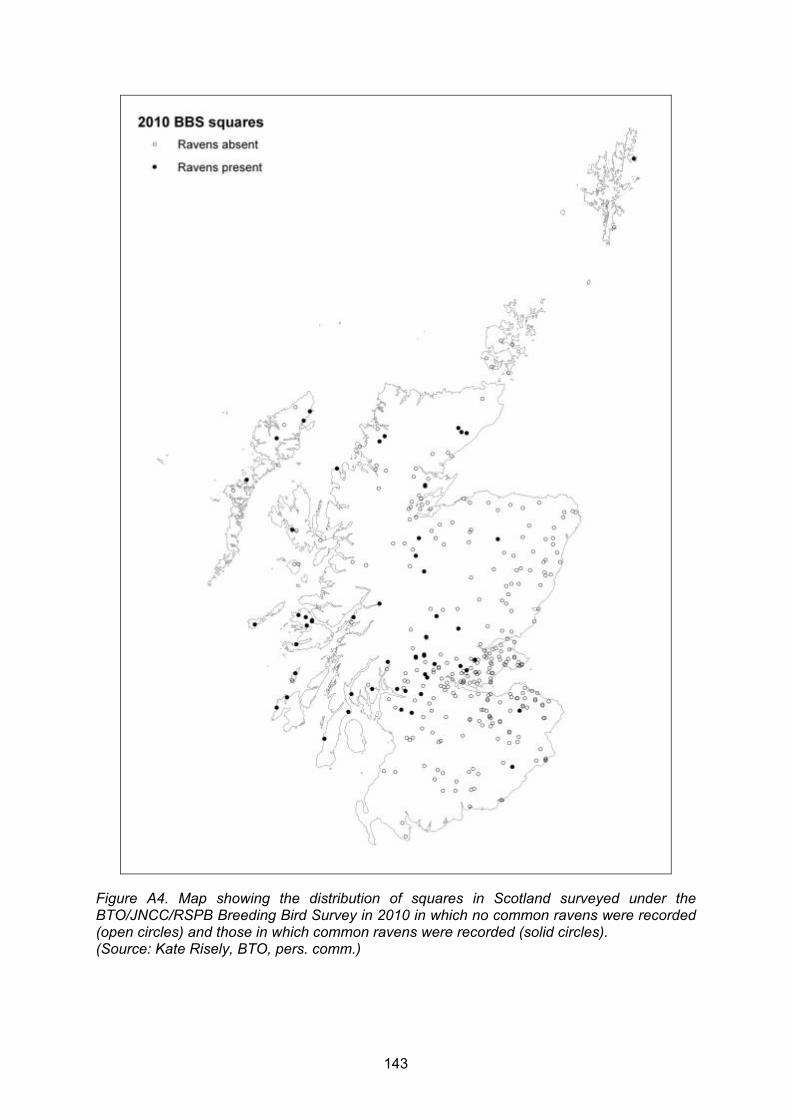
143
Figure A4. Map showing the distribution of squares in Scotland surveyed under the BTO/JNCC/RSPB Breeding Bird Survey in 2010 in which no common ravens were recorded (open circles) and those in which common ravens were recorded (solid circles). (Source: Kate Risely, BTO, pers. comm.)
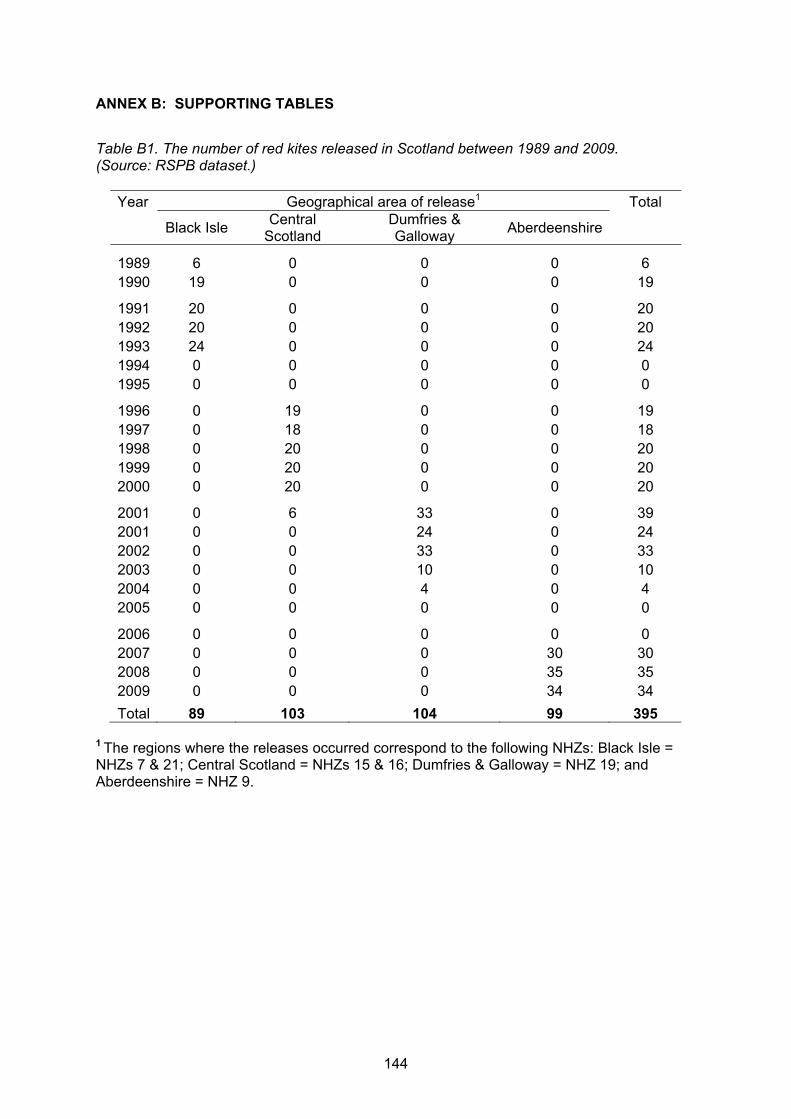
144
ANNEX B: SUPPORTING TABLES
Table B1. The number of red kites released in Scotland between 1989 and 2009. (Source: RSPB dataset.)
Year Geographical area of release1 Total
Black Isle Central
Scotland Dumfries & Galloway
Aberdeenshire
1989 6 0 0 0 6 1990 19 0 0 0 19
1991 20 0 0 0 20 1992 20 0 0 0 20 1993 24 0 0 0 24 1994 0 0 0 0 0 1995 0 0 0 0 0
1996 0 19 0 0 19 1997 0 18 0 0 18 1998 0 20 0 0 20 1999 0 20 0 0 20 2000 0 20 0 0 20
2001 0 6 33 0 39 2001 0 0 24 0 24 2002 0 0 33 0 33 2003 0 0 10 0 10 2004 0 0 4 0 4 2005 0 0 0 0 0
2006 0 0 0 0 0 2007 0 0 0 30 30 2008 0 0 0 35 35 2009 0 0 0 34 34
Total 89 103 104 99 395 1 The regions where the releases occurred correspond to the following NHZs: Black Isle = NHZs 7 & 21; Central Scotland = NHZs 15 & 16; Dumfries & Galloway = NHZ 19; and Aberdeenshire = NHZ 9.

145
Table B2. The number of red kite nest sites that were checked for occupancy in the different areas where the species occurs in Scotland between 1992 and 2010. (Source: RSPB dataset.)
Sub-
population Aberdeenshire
Black Isle
Central Scotland
Dumfries & Galloway
Total
1992 0 1 0 0 1 1993 0 5 0 0 5 1994 0 10 0 0 10 1995 0 15 0 0 15 1996 0 17 0 0 17 1997 0 25 0 0 25 1998 0 23 2 0 25 1999 0 30 6 0 36 2000 0 35 8 0 43 2001 0 34 12 0 46 2002 0 35 20 0 55 2003 0 34 23 4 61 2004 0 36 31 7 74 2005 0 39 41 12 92 2006 0 70 57 19 146 2007 0 75 71 22 168 2008 0 84 89 31 204 2009 5 82 101 42 230 2010 9 86 113 54 262
Total 14 736 574 191 1515
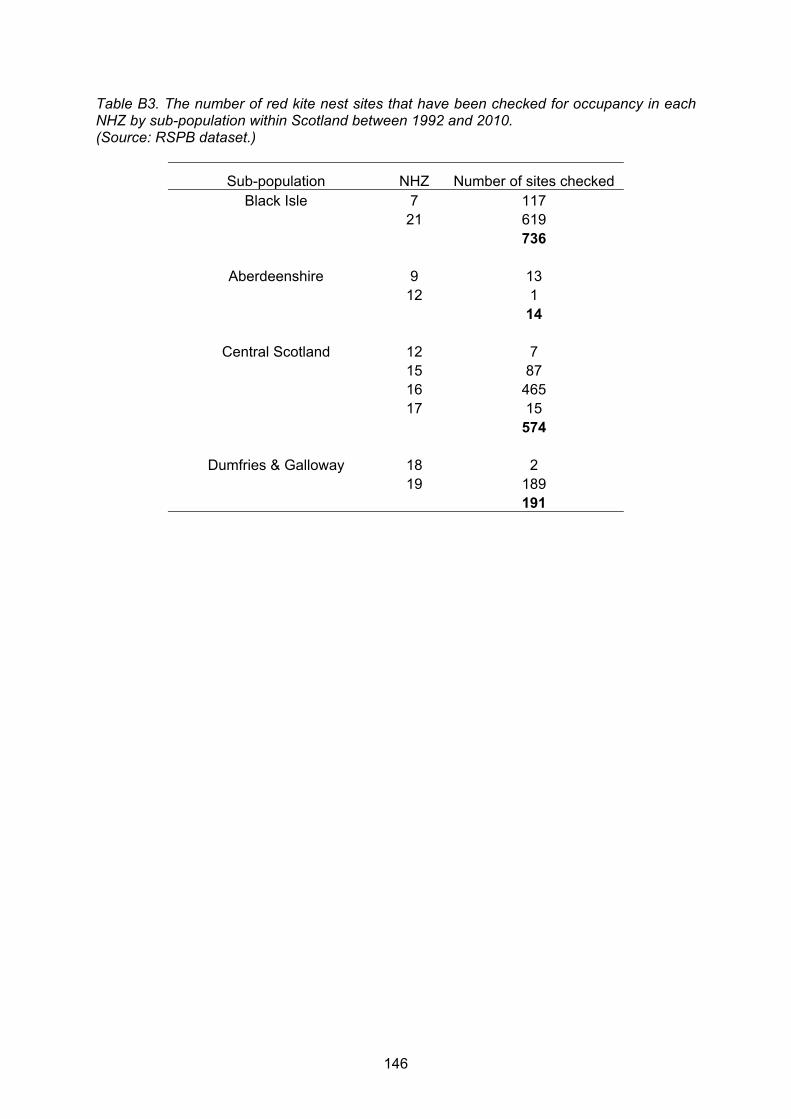
146
Table B3. The number of red kite nest sites that have been checked for occupancy in each NHZ by sub-population within Scotland between 1992 and 2010. (Source: RSPB dataset.)
Sub-population NHZ Number of sites checked Black Isle 7 117
21 619 736
Aberdeenshire 9 13 12 1 14
Central Scotland 12 7 15 87 16 465 17 15 574
Dumfries & Galloway 18 2 19 189 191
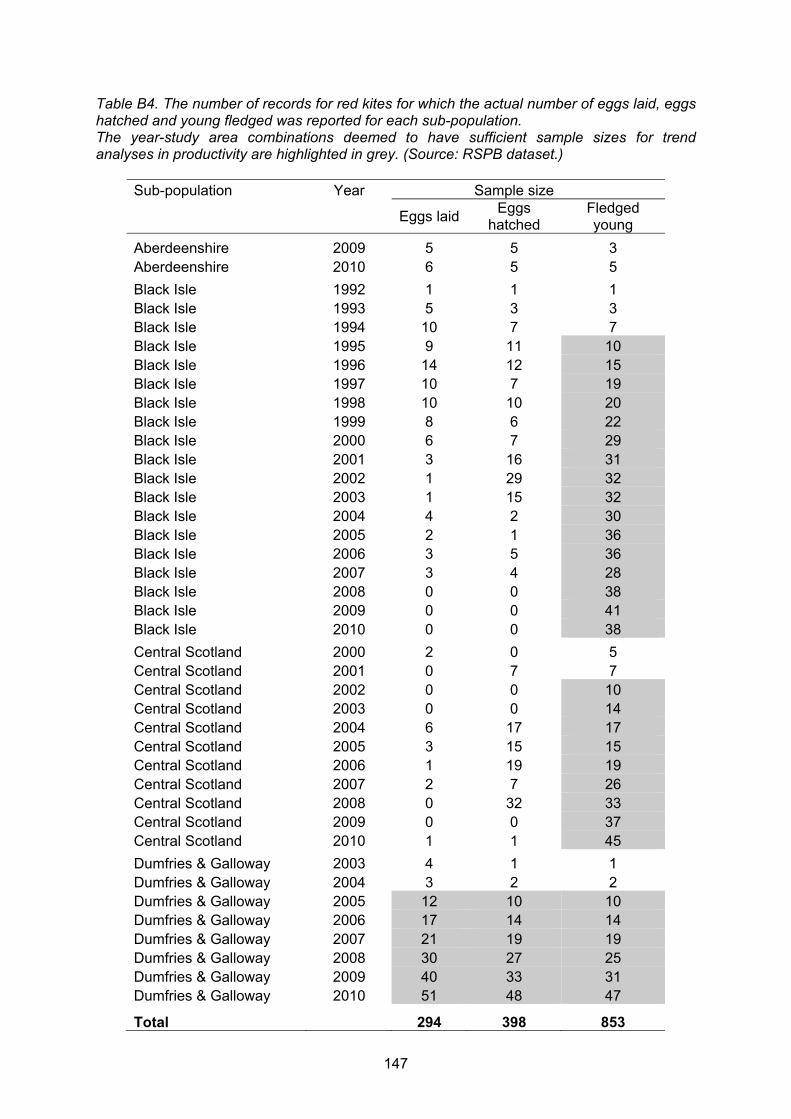
147
Table B4. The number of records for red kites for which the actual number of eggs laid, eggs hatched and young fledged was reported for each sub-population. The year-study area combinations deemed to have sufficient sample sizes for trend analyses in productivity are highlighted in grey. (Source: RSPB dataset.)
Sub-population Year Sample size
Eggs laidEggs
hatched Fledged young
Aberdeenshire 2009 5 5 3 Aberdeenshire 2010 6 5 5
Black Isle 1992 1 1 1 Black Isle 1993 5 3 3 Black Isle 1994 10 7 7 Black Isle 1995 9 11 10 Black Isle 1996 14 12 15 Black Isle 1997 10 7 19 Black Isle 1998 10 10 20 Black Isle 1999 8 6 22 Black Isle 2000 6 7 29 Black Isle 2001 3 16 31 Black Isle 2002 1 29 32 Black Isle 2003 1 15 32 Black Isle 2004 4 2 30 Black Isle 2005 2 1 36 Black Isle 2006 3 5 36 Black Isle 2007 3 4 28 Black Isle 2008 0 0 38 Black Isle 2009 0 0 41 Black Isle 2010 0 0 38
Central Scotland 2000 2 0 5 Central Scotland 2001 0 7 7 Central Scotland 2002 0 0 10 Central Scotland 2003 0 0 14 Central Scotland 2004 6 17 17 Central Scotland 2005 3 15 15 Central Scotland 2006 1 19 19 Central Scotland 2007 2 7 26 Central Scotland 2008 0 32 33 Central Scotland 2009 0 0 37 Central Scotland 2010 1 1 45
Dumfries & Galloway 2003 4 1 1 Dumfries & Galloway 2004 3 2 2 Dumfries & Galloway 2005 12 10 10 Dumfries & Galloway 2006 17 14 14 Dumfries & Galloway 2007 21 19 19 Dumfries & Galloway 2008 30 27 25 Dumfries & Galloway 2009 40 33 31 Dumfries & Galloway 2010 51 48 47
Total 294 398 853
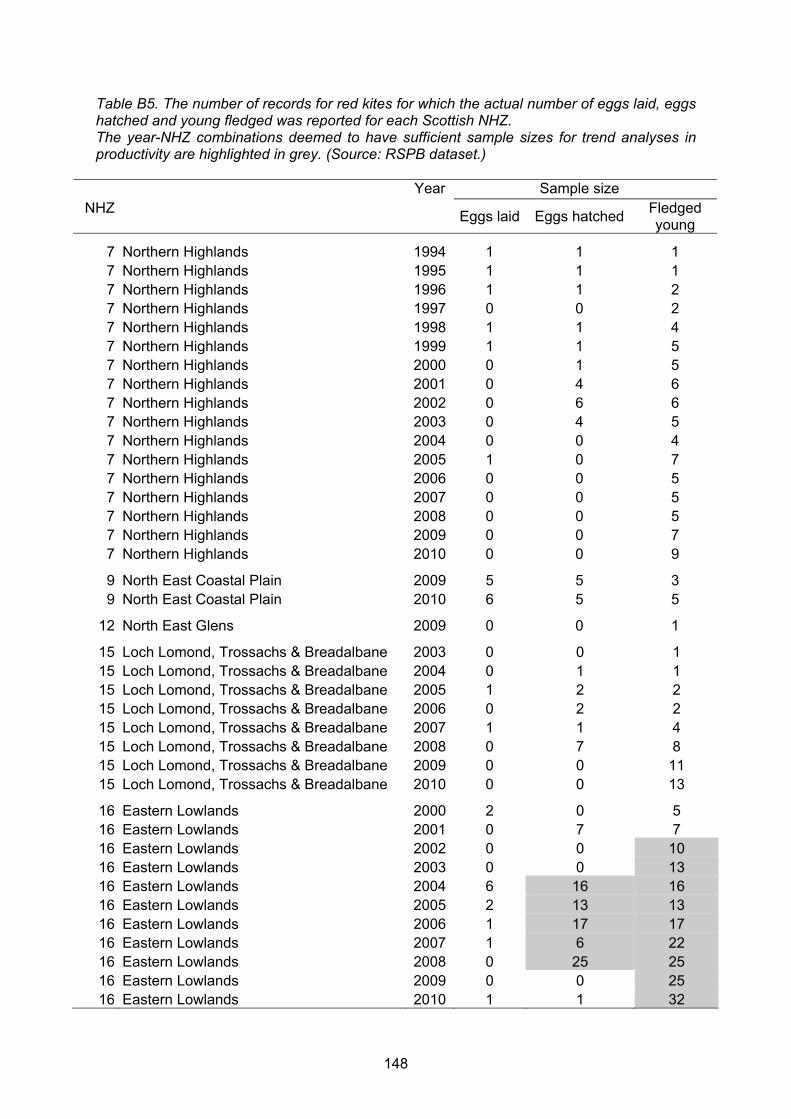
148
Table B5. The number of records for red kites for which the actual number of eggs laid, eggs hatched and young fledged was reported for each Scottish NHZ. The year-NHZ combinations deemed to have sufficient sample sizes for trend analyses in productivity are highlighted in grey. (Source: RSPB dataset.)
NHZ
Year Sample size
Eggs laid Eggs hatched Fledged young
7 Northern Highlands 1994 1 1 1 7 Northern Highlands 1995 1 1 1 7 Northern Highlands 1996 1 1 2 7 Northern Highlands 1997 0 0 2 7 Northern Highlands 1998 1 1 4 7 Northern Highlands 1999 1 1 5 7 Northern Highlands 2000 0 1 5 7 Northern Highlands 2001 0 4 6 7 Northern Highlands 2002 0 6 6 7 Northern Highlands 2003 0 4 5 7 Northern Highlands 2004 0 0 4 7 Northern Highlands 2005 1 0 7 7 Northern Highlands 2006 0 0 5 7 Northern Highlands 2007 0 0 5 7 Northern Highlands 2008 0 0 5 7 Northern Highlands 2009 0 0 7 7 Northern Highlands 2010 0 0 9
9 North East Coastal Plain 2009 5 5 3 9 North East Coastal Plain 2010 6 5 5
12 North East Glens 2009 0 0 1
15 Loch Lomond, Trossachs & Breadalbane 2003 0 0 1 15 Loch Lomond, Trossachs & Breadalbane 2004 0 1 1 15 Loch Lomond, Trossachs & Breadalbane 2005 1 2 2 15 Loch Lomond, Trossachs & Breadalbane 2006 0 2 2 15 Loch Lomond, Trossachs & Breadalbane 2007 1 1 4 15 Loch Lomond, Trossachs & Breadalbane 2008 0 7 8 15 Loch Lomond, Trossachs & Breadalbane 2009 0 0 11 15 Loch Lomond, Trossachs & Breadalbane 2010 0 0 13
16 Eastern Lowlands 2000 2 0 5 16 Eastern Lowlands 2001 0 7 7 16 Eastern Lowlands 2002 0 0 10 16 Eastern Lowlands 2003 0 0 13 16 Eastern Lowlands 2004 6 16 16 16 Eastern Lowlands 2005 2 13 13 16 Eastern Lowlands 2006 1 17 17 16 Eastern Lowlands 2007 1 6 22 16 Eastern Lowlands 2008 0 25 25 16 Eastern Lowlands 2009 0 0 25 16 Eastern Lowlands 2010 1 1 32

149
Table B5 Continued.
NHZ Year Sample size
Eggs laid Eggs hatched Fledged young
18 Wigtown Machairs & Outer Solway Coast 2009 1 0 0 18 Wigtown Machairs & Outer Solway Coast 2010 1 1 1
19 W Southern Uplands & Inner Solway 2003 4 1 1 19 W Southern Uplands & Inner Solway 2004 3 2 2 19 W Southern Uplands & Inner Solway 2005 12 10 10 19 W Southern Uplands & Inner Solway 2006 17 14 14 19 W Southern Uplands & Inner Solway 2007 21 19 19 19 W Southern Uplands & Inner Solway 2008 30 27 25 19 W Southern Uplands & Inner Solway 2009 39 33 31 19 W Southern Uplands & Inner Solway 2010 50 47 46
21 Moray Firth 1992 1 1 1 21 Moray Firth 1993 5 3 3 21 Moray Firth 1994 9 6 6 21 Moray Firth 1995 8 10 9 21 Moray Firth 1996 13 11 13 21 Moray Firth 1997 10 7 17 21 Moray Firth 1998 9 9 16 21 Moray Firth 1999 7 5 17 21 Moray Firth 2000 6 6 24 21 Moray Firth 2001 3 12 25 21 Moray Firth 2002 1 23 26 21 Moray Firth 2003 1 11 27 21 Moray Firth 2004 4 2 26 21 Moray Firth 2005 1 1 29 21 Moray Firth 2006 3 5 31 21 Moray Firth 2007 3 4 23 21 Moray Firth 2008 0 0 33 21 Moray Firth 2009 0 0 34 21 Moray Firth 2010 0 0 29
Total 294 398 853

150
Table B6. The number of records for red kites for which the actual number of eggs laid, eggs hatched and young fledged was reported from the whole of Scotland. The years deemed to have sufficient sample sizes for trend analyses in productivity are highlighted in grey. Despite the high numbers of records for the variables Eggs Laid and Eggs Hatched, the sample sizes from some of the contributing areas were low, and there was a risk of biasing the national trends towards the sub-population in Dumfries & Galloway (cf. Table B 3); we therefore decided not to produce a national trend for these variables. (Source: RSPB dataset.)
Year Sample size
Eggs Laid Eggs hatched Fledged young
1992 1 1 1 1993 5 3 3 1994 10 7 7 1995 9 11 10
1996 14 12 15 1997 10 7 19 1998 10 10 20 1999 8 6 22 2000 8 7 34
2001 3 23 38 2002 1 29 42 2003 5 16 47 2004 13 21 49 2005 17 26 61
2006 21 38 69 2007 26 30 73 2008 30 59 96 2009 45 38 112 2010 58 54 135
Total 294 398 853
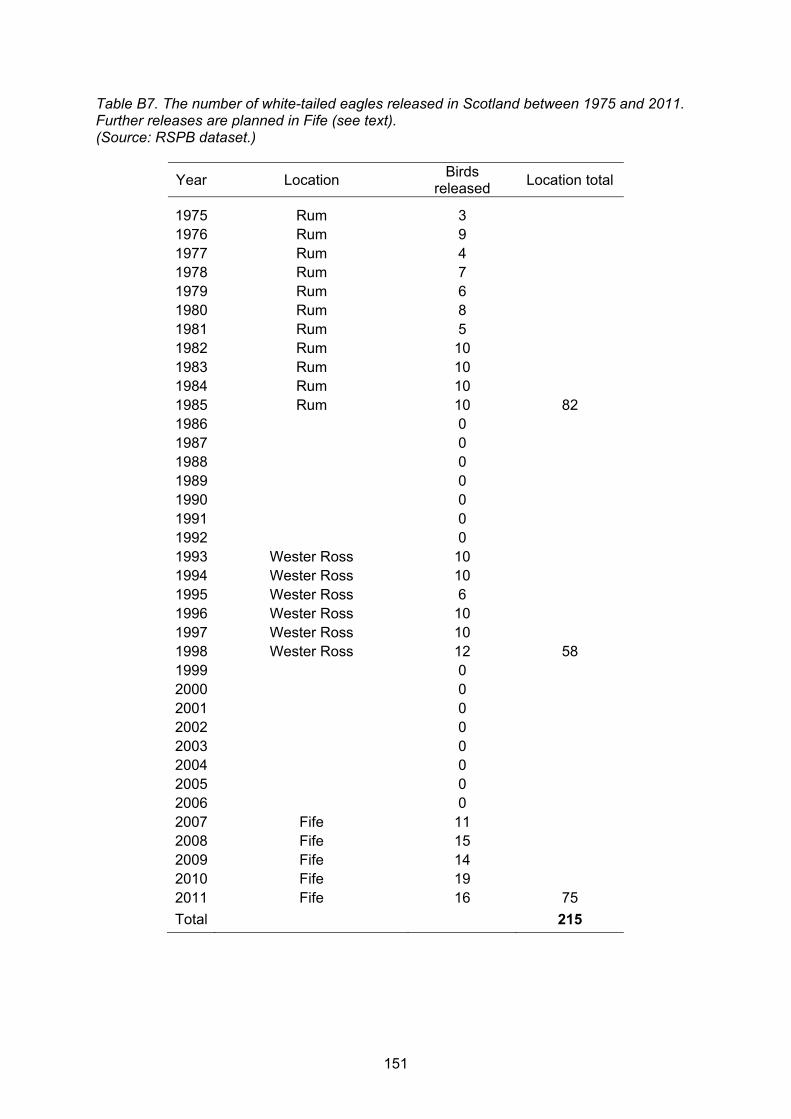
151
Table B7. The number of white-tailed eagles released in Scotland between 1975 and 2011. Further releases are planned in Fife (see text). (Source: RSPB dataset.)
Year Location Birds
released Location total
1975 Rum 3 1976 Rum 9 1977 Rum 4 1978 Rum 7 1979 Rum 6 1980 Rum 8 1981 Rum 5 1982 Rum 10 1983 Rum 10 1984 Rum 10 1985 Rum 10 82 1986 0 1987 0 1988 0 1989 0 1990 0 1991 0 1992 0 1993 Wester Ross 10 1994 Wester Ross 10 1995 Wester Ross 6 1996 Wester Ross 10 1997 Wester Ross 10 1998 Wester Ross 12 58 1999 0 2000 0 2001 0 2002 0 2003 0 2004 0 2005 0 2006 0 2007 Fife 11 2008 Fife 15 2009 Fife 14 2010 Fife 19 2011 Fife 16 75
Total 215

152
Table B8. The number of white-tailed eagle nest sites that were checked for occupancy in Scotland between 1981 and 2010. (Source: RSPB dataset.)
Year NHZ Total
3 4 6 7 8 13 14
Coll, Tiree and the Western
Isles
North West
Seaboard
Western Seaboard
Northern Highlands
Western Highlands
East Lochaber
Argyll West and
Islands
1981 0 0 1 0 0 0 0 1 1982 0 0 1 0 0 0 0 1 1983 1 0 2 0 0 0 0 3 1984 1 0 4 0 0 0 0 5 1985 1 0 5 0 0 0 0 6
1986 1 0 6 0 0 0 0 7 1987 1 0 8 0 0 0 0 9 1988 1 1 9 0 0 0 0 11 1989 1 1 8 0 0 0 0 10 1990 1 0 8 0 0 0 0 9
1991 1 0 8 0 0 0 0 9 1992 1 0 8 0 0 0 0 9 1993 1 0 9 0 0 0 0 10 1994 2 0 9 0 0 0 0 11 1995 4 0 9 0 0 0 0 13
1996 4 0 9 0 0 0 0 13 1997 4 0 11 0 0 0 0 15 1998 3 2 15 0 0 0 0 20 1999 3 2 15 0 1 0 0 21 2000 5 2 15 0 1 0 0 23
2001 5 2 15 0 2 0 0 24 2002 6 2 19 0 1 0 0 28 2003 6 3 21 0 1 0 0 31 2004 7 3 21 0 1 0 0 32 2005 8 3 19 0 3 0 0 33
2006 10 3 20 0 2 1 0 36 2007 12 3 26 1 0 0 2 44 2008 13 4 26 1 0 1 1 46 2009 13 5 26 1 1 1 1 48 2010 14 5 26 1 4 1 3 54
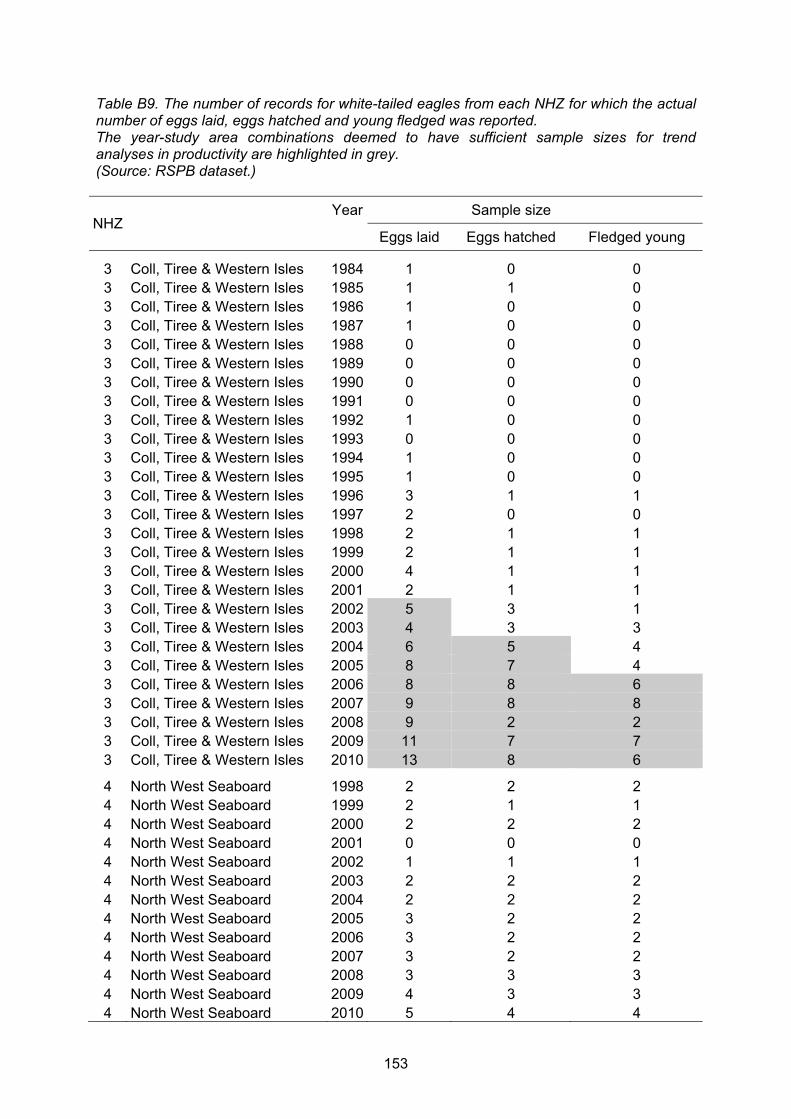
153
Table B9. The number of records for white-tailed eagles from each NHZ for which the actual number of eggs laid, eggs hatched and young fledged was reported. The year-study area combinations deemed to have sufficient sample sizes for trend analyses in productivity are highlighted in grey. (Source: RSPB dataset.)
NHZ Year Sample size
Eggs laid Eggs hatched Fledged young
3 Coll, Tiree & Western Isles 1984 1 0 0 3 Coll, Tiree & Western Isles 1985 1 1 0 3 Coll, Tiree & Western Isles 1986 1 0 0 3 Coll, Tiree & Western Isles 1987 1 0 0 3 Coll, Tiree & Western Isles 1988 0 0 0 3 Coll, Tiree & Western Isles 1989 0 0 0 3 Coll, Tiree & Western Isles 1990 0 0 0 3 Coll, Tiree & Western Isles 1991 0 0 0 3 Coll, Tiree & Western Isles 1992 1 0 0 3 Coll, Tiree & Western Isles 1993 0 0 0 3 Coll, Tiree & Western Isles 1994 1 0 0 3 Coll, Tiree & Western Isles 1995 1 0 0 3 Coll, Tiree & Western Isles 1996 3 1 1 3 Coll, Tiree & Western Isles 1997 2 0 0 3 Coll, Tiree & Western Isles 1998 2 1 1 3 Coll, Tiree & Western Isles 1999 2 1 1 3 Coll, Tiree & Western Isles 2000 4 1 1 3 Coll, Tiree & Western Isles 2001 2 1 1 3 Coll, Tiree & Western Isles 2002 5 3 1 3 Coll, Tiree & Western Isles 2003 4 3 3 3 Coll, Tiree & Western Isles 2004 6 5 4 3 Coll, Tiree & Western Isles 2005 8 7 4 3 Coll, Tiree & Western Isles 2006 8 8 6 3 Coll, Tiree & Western Isles 2007 9 8 8 3 Coll, Tiree & Western Isles 2008 9 2 2 3 Coll, Tiree & Western Isles 2009 11 7 7 3 Coll, Tiree & Western Isles 2010 13 8 6
4 North West Seaboard 1998 2 2 2 4 North West Seaboard 1999 2 1 1 4 North West Seaboard 2000 2 2 2 4 North West Seaboard 2001 0 0 0 4 North West Seaboard 2002 1 1 1 4 North West Seaboard 2003 2 2 2 4 North West Seaboard 2004 2 2 2 4 North West Seaboard 2005 3 2 2 4 North West Seaboard 2006 3 2 2 4 North West Seaboard 2007 3 2 2 4 North West Seaboard 2008 3 3 3 4 North West Seaboard 2009 4 3 3 4 North West Seaboard 2010 5 4 4

154
Table B9 Continued.
NHZ Year Sample size
Eggs laid Eggs hatched Fledged young
6 Western Seaboard 1983 2 0 0 6 Western Seaboard 1984 1 0 0 6 Western Seaboard 1985 3 2 1 6 Western Seaboard 1986 4 1 1 6 Western Seaboard 1987 5 2 2 6 Western Seaboard 1988 6 2 1 6 Western Seaboard 1989 5 3 3 6 Western Seaboard 1990 8 2 2 6 Western Seaboard 1991 7 4 4 6 Western Seaboard 1992 6 4 4 6 Western Seaboard 1993 5 4 4 6 Western Seaboard 1994 8 4 4 6 Western Seaboard 1995 7 6 5 6 Western Seaboard 1996 8 7 6 6 Western Seaboard 1997 8 6 5 6 Western Seaboard 1998 12 6 6 6 Western Seaboard 1999 11 7 4 6 Western Seaboard 2000 11 7 4 6 Western Seaboard 2001 12 8 5 6 Western Seaboard 2002 15 10 6 6 Western Seaboard 2003 19 15 11 6 Western Seaboard 2004 17 12 9 6 Western Seaboard 2005 14 12 11 6 Western Seaboard 2006 17 14 12 6 Western Seaboard 2007 20 17 13 6 Western Seaboard 2008 20 13 12 6 Western Seaboard 2009 20 14 12 6 Western Seaboard 2010 19 13 13
7 Northern Highlands 2007 1 1 0 7 Northern Highlands 2008 1 1 1 7 Northern Highlands 2009 1 0 0 7 Northern Highlands 2010 1 1 1
8 Western Highlands 2000 1 1 1 8 Western Highlands 2001 2 1 1 8 Western Highlands 2002 1 1 0 8 Western Highlands 2003 0 0 0 8 Western Highlands 2004 1 0 0 8 Western Highlands 2005 1 0 0 8 Western Highlands 2006 2 2 0 8 Western Highlands 2007 0 0 0 8 Western Highlands 2008 0 0 0 8 Western Highlands 2009 1 1 1 8 Western Highlands 2010 4 4 4

155
Table B9 Continued.
NHZ
Year Sample size
Eggs laid Eggs hatched Fledged young
13 East Lochaber 2006 1 1 1 13 East Lochaber 2007 0 0 0 13 East Lochaber 2008 1 1 1 13 East Lochaber 2009 1 0 0 13 East Lochaber 2010 1 0 0
14 Argyll West and Islands 2007 2 2 1 14 Argyll West and Islands 2008 1 1 1 14 Argyll West and Islands 2009 1 1 1 14 Argyll West and Islands 2010 3 3 3
Total 445 300 249

156
Table B10. The number of records for white-tailed eagles for which the actual number of eggs laid, eggs hatched and young fledged was reported for the whole of Scotland. The years deemed to have sufficient sample sizes for trend analyses in productivity are highlighted in grey. (Source: RSPB dataset.)
Year Sample size
Eggs Laid
Eggs hatched Fledged young
1981 0 0 0 1982 0 0 0 1983 2 0 0 1984 2 0 0 1985 4 3 1
1986 5 1 1 1987 6 2 2 1988 6 2 1 1989 5 3 3 1990 8 2 2
1991 7 4 4 1992 7 4 4 1993 5 4 4 1994 9 4 4 1995 8 6 5
1996 11 8 7 1997 10 6 5 1998 16 9 9 1999 15 9 6 2000 18 11 8
2001 16 10 7 2002 22 15 8 2003 25 20 16 2004 26 19 15 2005 26 21 17
2006 31 27 21 2007 35 30 24 2008 35 21 20 2009 39 26 24 2010 46 33 31
Total 445 300 249
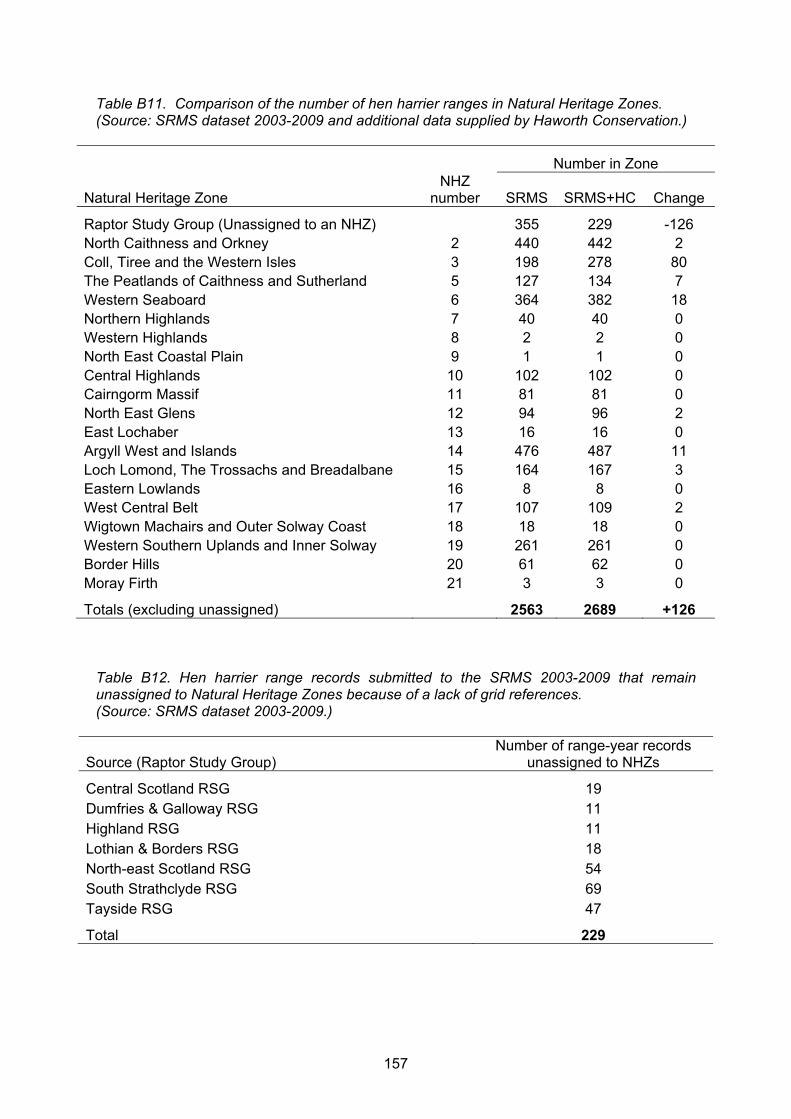
157
Table B11. Comparison of the number of hen harrier ranges in Natural Heritage Zones. (Source: SRMS dataset 2003-2009 and additional data supplied by Haworth Conservation.)
Number in Zone
Natural Heritage Zone NHZ
number SRMS SRMS+HC Change
Raptor Study Group (Unassigned to an NHZ) 355 229 -126 North Caithness and Orkney 2 440 442 2 Coll, Tiree and the Western Isles 3 198 278 80 The Peatlands of Caithness and Sutherland 5 127 134 7 Western Seaboard 6 364 382 18 Northern Highlands 7 40 40 0 Western Highlands 8 2 2 0 North East Coastal Plain 9 1 1 0 Central Highlands 10 102 102 0 Cairngorm Massif 11 81 81 0 North East Glens 12 94 96 2 East Lochaber 13 16 16 0 Argyll West and Islands 14 476 487 11 Loch Lomond, The Trossachs and Breadalbane 15 164 167 3 Eastern Lowlands 16 8 8 0 West Central Belt 17 107 109 2 Wigtown Machairs and Outer Solway Coast 18 18 18 0 Western Southern Uplands and Inner Solway 19 261 261 0 Border Hills 20 61 62 0 Moray Firth 21 3 3 0
Totals (excluding unassigned) 2563 2689 +126 Table B12. Hen harrier range records submitted to the SRMS 2003-2009 that remain unassigned to Natural Heritage Zones because of a lack of grid references. (Source: SRMS dataset 2003-2009.)
Source (Raptor Study Group) Number of range-year records
unassigned to NHZs
Central Scotland RSG 19 Dumfries & Galloway RSG 11 Highland RSG 11 Lothian & Borders RSG 18 North-east Scotland RSG 54 South Strathclyde RSG 69 Tayside RSG 47
Total 229
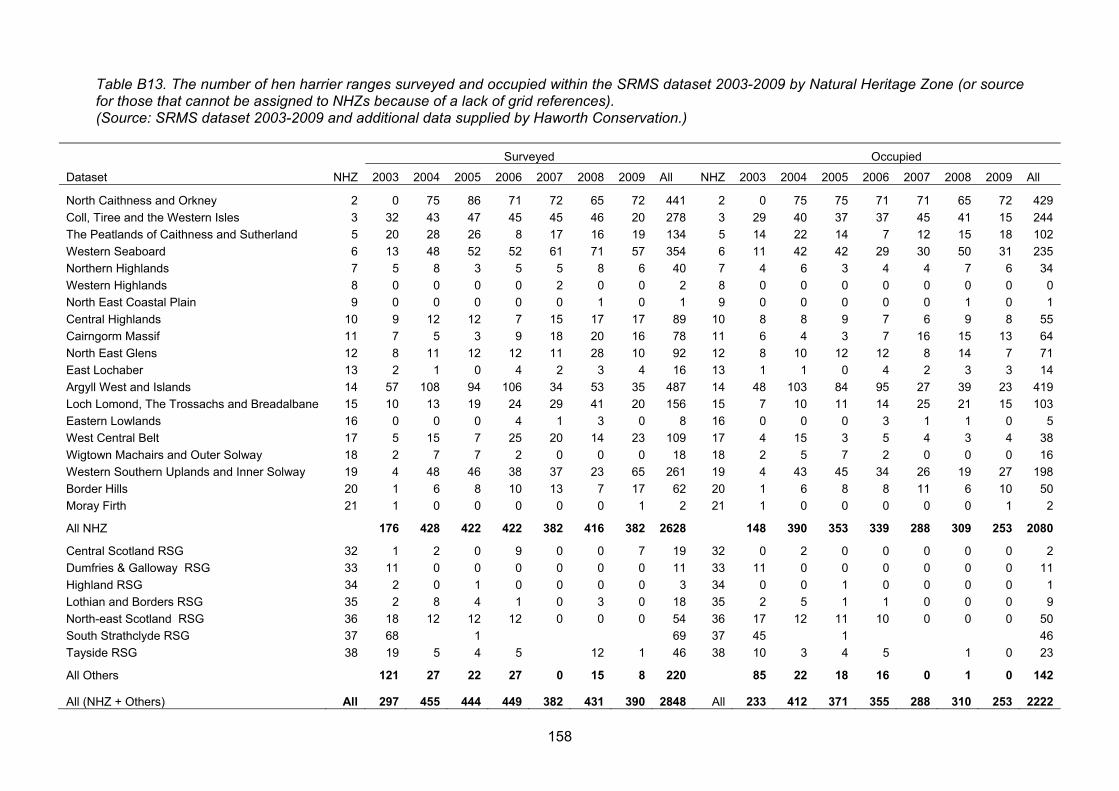
158
Table B13. The number of hen harrier ranges surveyed and occupied within the SRMS dataset 2003-2009 by Natural Heritage Zone (or source for those that cannot be assigned to NHZs because of a lack of grid references). (Source: SRMS dataset 2003-2009 and additional data supplied by Haworth Conservation.)
Surveyed Occupied
Dataset NHZ 2003 2004 2005 2006 2007 2008 2009 All NHZ 2003 2004 2005 2006 2007 2008 2009 All
North Caithness and Orkney 2 0 75 86 71 72 65 72 441 2 0 75 75 71 71 65 72 429
Coll, Tiree and the Western Isles 3 32 43 47 45 45 46 20 278 3 29 40 37 37 45 41 15 244
The Peatlands of Caithness and Sutherland 5 20 28 26 8 17 16 19 134 5 14 22 14 7 12 15 18 102
Western Seaboard 6 13 48 52 52 61 71 57 354 6 11 42 42 29 30 50 31 235
Northern Highlands 7 5 8 3 5 5 8 6 40 7 4 6 3 4 4 7 6 34
Western Highlands 8 0 0 0 0 2 0 0 2 8 0 0 0 0 0 0 0 0
North East Coastal Plain 9 0 0 0 0 0 1 0 1 9 0 0 0 0 0 1 0 1
Central Highlands 10 9 12 12 7 15 17 17 89 10 8 8 9 7 6 9 8 55
Cairngorm Massif 11 7 5 3 9 18 20 16 78 11 6 4 3 7 16 15 13 64
North East Glens 12 8 11 12 12 11 28 10 92 12 8 10 12 12 8 14 7 71
East Lochaber 13 2 1 0 4 2 3 4 16 13 1 1 0 4 2 3 3 14
Argyll West and Islands 14 57 108 94 106 34 53 35 487 14 48 103 84 95 27 39 23 419
Loch Lomond, The Trossachs and Breadalbane 15 10 13 19 24 29 41 20 156 15 7 10 11 14 25 21 15 103
Eastern Lowlands 16 0 0 0 4 1 3 0 8 16 0 0 0 3 1 1 0 5
West Central Belt 17 5 15 7 25 20 14 23 109 17 4 15 3 5 4 3 4 38
Wigtown Machairs and Outer Solway 18 2 7 7 2 0 0 0 18 18 2 5 7 2 0 0 0 16
Western Southern Uplands and Inner Solway 19 4 48 46 38 37 23 65 261 19 4 43 45 34 26 19 27 198
Border Hills 20 1 6 8 10 13 7 17 62 20 1 6 8 8 11 6 10 50
Moray Firth 21 1 0 0 0 0 0 1 2 21 1 0 0 0 0 0 1 2
All NHZ 176 428 422 422 382 416 382 2628 148 390 353 339 288 309 253 2080
Central Scotland RSG 32 1 2 0 9 0 0 7 19 32 0 2 0 0 0 0 0 2
Dumfries & Galloway RSG 33 11 0 0 0 0 0 0 11 33 11 0 0 0 0 0 0 11
Highland RSG 34 2 0 1 0 0 0 0 3 34 0 0 1 0 0 0 0 1
Lothian and Borders RSG 35 2 8 4 1 0 3 0 18 35 2 5 1 1 0 0 0 9
North-east Scotland RSG 36 18 12 12 12 0 0 0 54 36 17 12 11 10 0 0 0 50
South Strathclyde RSG 37 68 1 69 37 45 1 46
Tayside RSG 38 19 5 4 5 12 1 46 38 10 3 4 5 1 0 23
All Others 121 27 22 27 0 15 8 220 85 22 18 16 0 1 0 142
All (NHZ + Others) All 297 455 444 449 382 431 390 2848 All 233 412 371 355 288 310 253 2222
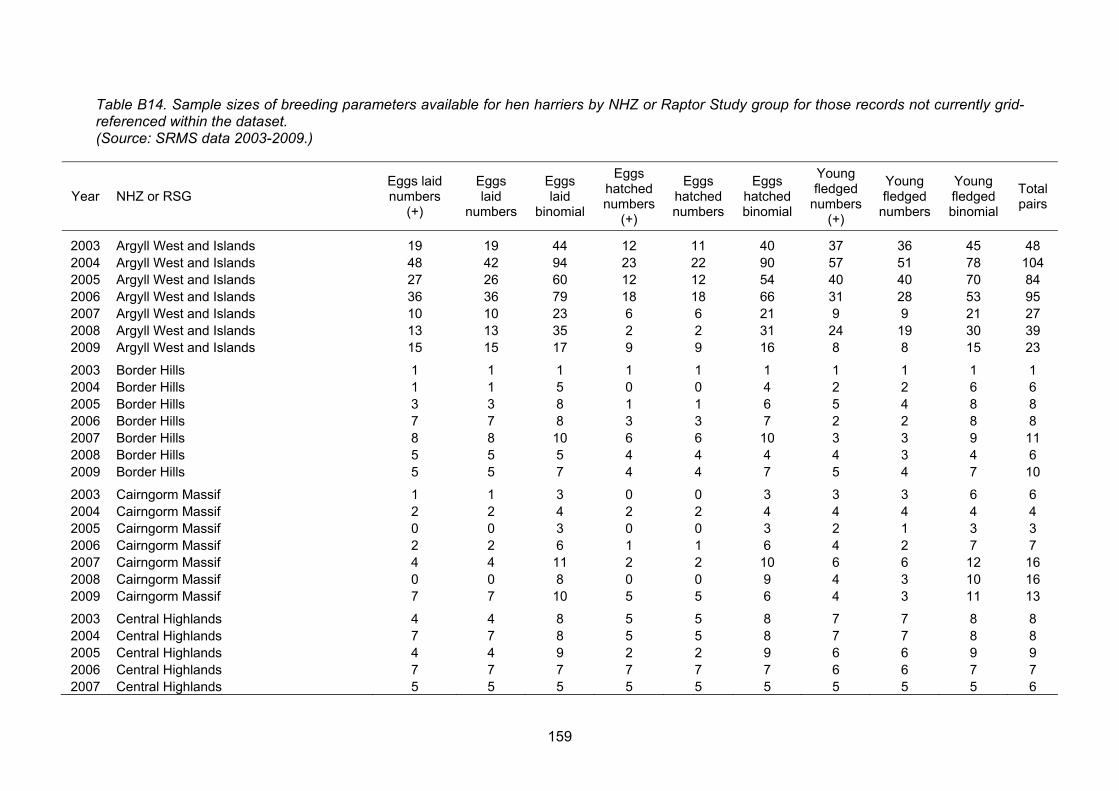
159
Table B14. Sample sizes of breeding parameters available for hen harriers by NHZ or Raptor Study group for those records not currently grid-referenced within the dataset. (Source: SRMS data 2003-2009.)
Year NHZ or RSG Eggs laid numbers
(+)
Eggs laid
numbers
Eggs laid
binomial
Eggs hatched numbers
(+)
Eggs hatched numbers
Eggs hatched binomial
Young fledged
numbers (+)
Young fledged
numbers
Young fledged binomial
Total pairs
2003 Argyll West and Islands 19 19 44 12 11 40 37 36 45 48 2004 Argyll West and Islands 48 42 94 23 22 90 57 51 78 104 2005 Argyll West and Islands 27 26 60 12 12 54 40 40 70 84 2006 Argyll West and Islands 36 36 79 18 18 66 31 28 53 95 2007 Argyll West and Islands 10 10 23 6 6 21 9 9 21 27 2008 Argyll West and Islands 13 13 35 2 2 31 24 19 30 39 2009 Argyll West and Islands 15 15 17 9 9 16 8 8 15 23
2003 Border Hills 1 1 1 1 1 1 1 1 1 1 2004 Border Hills 1 1 5 0 0 4 2 2 6 6 2005 Border Hills 3 3 8 1 1 6 5 4 8 8 2006 Border Hills 7 7 8 3 3 7 2 2 8 8 2007 Border Hills 8 8 10 6 6 10 3 3 9 11 2008 Border Hills 5 5 5 4 4 4 4 3 4 6 2009 Border Hills 5 5 7 4 4 7 5 4 7 10
2003 Cairngorm Massif 1 1 3 0 0 3 3 3 6 6 2004 Cairngorm Massif 2 2 4 2 2 4 4 4 4 4 2005 Cairngorm Massif 0 0 3 0 0 3 2 1 3 3 2006 Cairngorm Massif 2 2 6 1 1 6 4 2 7 7 2007 Cairngorm Massif 4 4 11 2 2 10 6 6 12 16 2008 Cairngorm Massif 0 0 8 0 0 9 4 3 10 16 2009 Cairngorm Massif 7 7 10 5 5 6 4 3 11 13
2003 Central Highlands 4 4 8 5 5 8 7 7 8 8 2004 Central Highlands 7 7 8 5 5 8 7 7 8 8 2005 Central Highlands 4 4 9 2 2 9 6 6 9 9 2006 Central Highlands 7 7 7 7 7 7 6 6 7 7 2007 Central Highlands 5 5 5 5 5 5 5 5 5 6
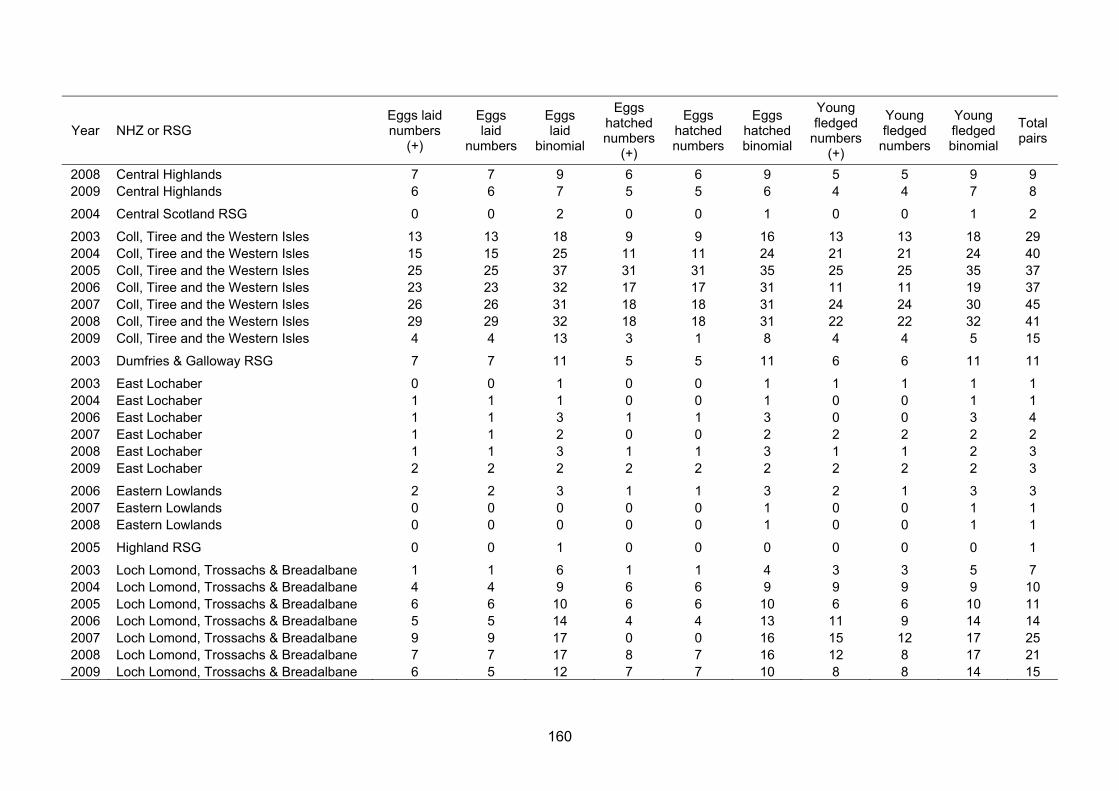
160
Year NHZ or RSG Eggs laid numbers
(+)
Eggs laid
numbers
Eggs laid
binomial
Eggs hatched numbers
(+)
Eggs hatched numbers
Eggs hatched binomial
Young fledged
numbers (+)
Young fledged
numbers
Young fledged binomial
Total pairs
2008 Central Highlands 7 7 9 6 6 9 5 5 9 9 2009 Central Highlands 6 6 7 5 5 6 4 4 7 8
2004 Central Scotland RSG 0 0 2 0 0 1 0 0 1 2
2003 Coll, Tiree and the Western Isles 13 13 18 9 9 16 13 13 18 29 2004 Coll, Tiree and the Western Isles 15 15 25 11 11 24 21 21 24 40 2005 Coll, Tiree and the Western Isles 25 25 37 31 31 35 25 25 35 37 2006 Coll, Tiree and the Western Isles 23 23 32 17 17 31 11 11 19 37 2007 Coll, Tiree and the Western Isles 26 26 31 18 18 31 24 24 30 45 2008 Coll, Tiree and the Western Isles 29 29 32 18 18 31 22 22 32 41 2009 Coll, Tiree and the Western Isles 4 4 13 3 1 8 4 4 5 15
2003 Dumfries & Galloway RSG 7 7 11 5 5 11 6 6 11 11
2003 East Lochaber 0 0 1 0 0 1 1 1 1 1 2004 East Lochaber 1 1 1 0 0 1 0 0 1 1 2006 East Lochaber 1 1 3 1 1 3 0 0 3 4 2007 East Lochaber 1 1 2 0 0 2 2 2 2 2 2008 East Lochaber 1 1 3 1 1 3 1 1 2 3 2009 East Lochaber 2 2 2 2 2 2 2 2 2 3
2006 Eastern Lowlands 2 2 3 1 1 3 2 1 3 3 2007 Eastern Lowlands 0 0 0 0 0 1 0 0 1 1 2008 Eastern Lowlands 0 0 0 0 0 1 0 0 1 1
2005 Highland RSG 0 0 1 0 0 0 0 0 0 1
2003 Loch Lomond, Trossachs & Breadalbane 1 1 6 1 1 4 3 3 5 7 2004 Loch Lomond, Trossachs & Breadalbane 4 4 9 6 6 9 9 9 9 10 2005 Loch Lomond, Trossachs & Breadalbane 6 6 10 6 6 10 6 6 10 11 2006 Loch Lomond, Trossachs & Breadalbane 5 5 14 4 4 13 11 9 14 14 2007 Loch Lomond, Trossachs & Breadalbane 9 9 17 0 0 16 15 12 17 25 2008 Loch Lomond, Trossachs & Breadalbane 7 7 17 8 7 16 12 8 17 21 2009 Loch Lomond, Trossachs & Breadalbane 6 5 12 7 7 10 8 8 14 15

161
Year NHZ or RSG Eggs laid numbers
(+)
Eggs laid
numbers
Eggs laid
binomial
Eggs hatched numbers
(+)
Eggs hatched numbers
Eggs hatched binomial
Young fledged
numbers (+)
Young fledged
numbers
Young fledged binomial
Total pairs
2003 Lothian & Borders RSG 1 1 2 0 0 2 1 1 2 2 2004 Lothian & Borders RSG 0 0 5 0 0 4 4 4 4 5 2005 Lothian & Borders RSG 0 0 0 0 0 0 0 0 0 1 2006 Lothian & Borders RSG 0 0 1 0 0 0 0 0 1 1
2003 Moray Firth 1 1 1 1 1 1 1 1 1 1 2009 Moray Firth 1 0 1 0 0 1 0 0 1 1
2004 North Caithness and Orkney 53 53 66 33 33 67 33 33 70 75 2005 North Caithness and Orkney 57 57 75 32 32 60 32 29 73 75
2006 North Caithness and Orkney 39 39 56 25 25 52 28 28 68 71 2007 North Caithness and Orkney 45 45 61 15 15 51 11 11 44 71 2008 North Caithness and Orkney 38 38 49 11 11 43 4 4 46 65 2009 North Caithness and Orkney 38 32 55 22 17 58 15 9 48 72
2008 North East Coastal Plain 0 0 0 0 0 1 0 0 0 1
2003 North East Glens 6 6 8 0 0 5 5 5 8 8 2004 North East Glens 7 7 7 6 6 7 5 5 7 10 2005 North East Glens 8 8 8 7 7 8 6 6 8 12 2006 North East Glens 8 8 10 6 6 10 8 7 10 12 2007 North East Glens 6 6 7 0 0 7 6 6 7 8 2008 North East Glens 9 9 12 7 7 10 6 6 11 14 2009 North East Glens 4 3 4 4 3 4 3 3 3 7
2003 North-east Scotland RSG 0 0 9 0 0 9 9 9 12 17 2004 North-east Scotland RSG 0 0 6 0 0 7 3 3 9 12 2005 North-east Scotland RSG 0 0 10 0 0 8 8 8 11 12 2006 North-east Scotland RSG 0 0 3 0 0 3 2 2 8 10
2003 Northern Highlands 2 2 3 2 2 3 3 2 4 4 2004 Northern Highlands 3 3 5 2 2 4 3 3 4 6 2005 Northern Highlands 1 1 3 0 0 3 2 2 3 3 2006 Northern Highlands 2 2 3 2 2 3 1 1 1 4

162
Year NHZ or RSG Eggs laid numbers
(+)
Eggs laid
numbers
Eggs laid
binomial
Eggs hatched numbers
(+)
Eggs hatched numbers
Eggs hatched binomial
Young fledged
numbers (+)
Young fledged
numbers
Young fledged binomial
Total pairs
2007 Northern Highlands 1 1 2 0 0 2 1 1 3 4 2008 Northern Highlands 3 3 5 1 1 5 1 1 5 7 2009 Northern Highlands 3 3 6 3 3 5 4 3 6 6
2003 South Strathclyde RSG 14 14 41 10 10 30 18 18 43 45 2005 South Strathclyde RSG 0 0 0 0 0 0 0 0 1 1
2003 Tayside RSG 4 4 10 3 3 8 6 6 10 10 2004 Tayside RSG 1 1 3 0 0 2 1 1 3 3 2005 Tayside RSG 4 4 4 2 2 4 2 2 4 4 2006 Tayside RSG 2 2 2 1 1 2 1 1 3 5 2008 Tayside RSG 0 0 0 0 0 0 0 0 0 1
2003 The Peatlands of Caithness and Sutherland 9 9 13 6 6 13 7 7 14 14
2004 The Peatlands of Caithness and Sutherland 16 16 23 8 8 21 14 14 23 23
2005 The Peatlands of Caithness and Sutherland 8 8 13 4 4 13 8 8 14 14
2006 The Peatlands of Caithness and Sutherland 4 4 6 3 3 6 3 3 6 7
2007 The Peatlands of Caithness and Sutherland 4 4 7 3 3 6 4 4 8 10
2008 The Peatlands of Caithness and Sutherland 6 6 12 3 3 12 6 5 12 15
2009 The Peatlands of Caithness and Sutherland 12 12 15 9 9 13 6 6 17 18
2003 West Central Belt 0 0 4 0 0 4 4 4 4 4 2004 West Central Belt 8 8 14 6 6 14 7 7 15 15 2005 West Central Belt 1 1 3 1 1 3 2 2 3 3 2006 West Central Belt 3 3 4 2 2 3 0 0 4 5 2007 West Central Belt 3 3 3 3 3 3 2 2 3 4 2008 West Central Belt 0 0 2 0 0 2 2 2 3 3 2009 West Central Belt 4 4 4 4 4 4 0 0 4 4
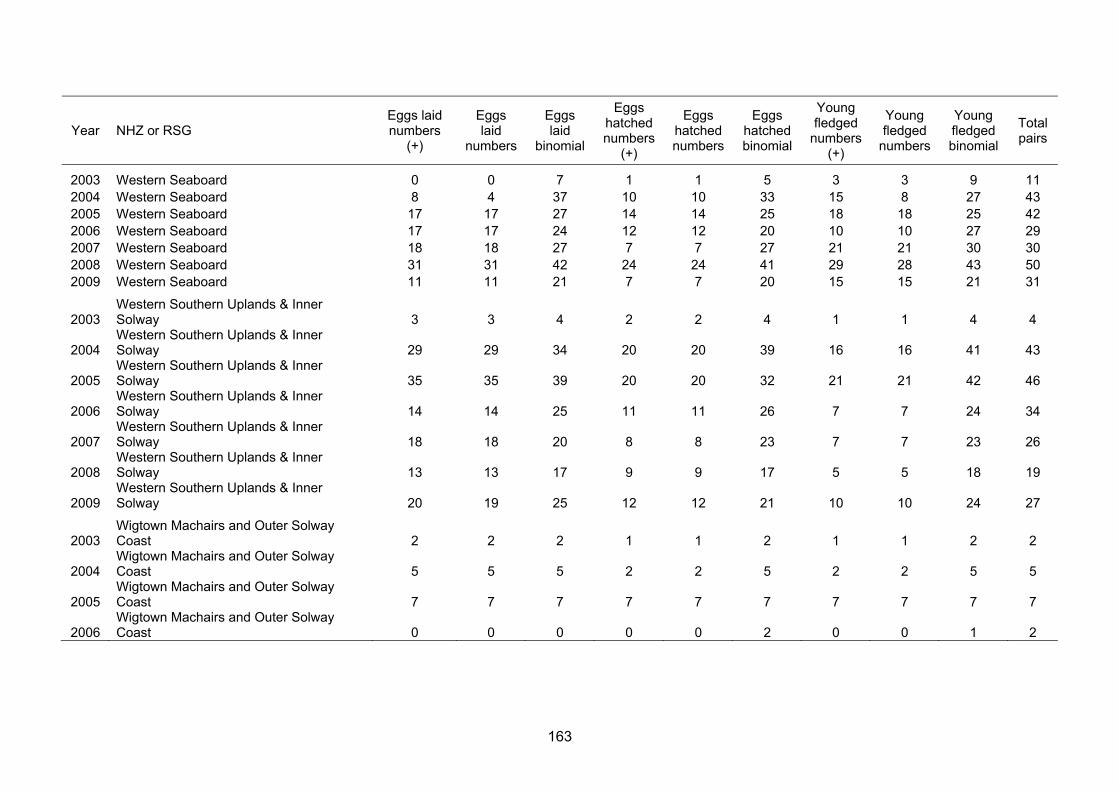
163
Year NHZ or RSG Eggs laid numbers
(+)
Eggs laid
numbers
Eggs laid
binomial
Eggs hatched numbers
(+)
Eggs hatched numbers
Eggs hatched binomial
Young fledged
numbers (+)
Young fledged
numbers
Young fledged binomial
Total pairs
2003 Western Seaboard 0 0 7 1 1 5 3 3 9 11 2004 Western Seaboard 8 4 37 10 10 33 15 8 27 43 2005 Western Seaboard 17 17 27 14 14 25 18 18 25 42 2006 Western Seaboard 17 17 24 12 12 20 10 10 27 29 2007 Western Seaboard 18 18 27 7 7 27 21 21 30 30 2008 Western Seaboard 31 31 42 24 24 41 29 28 43 50 2009 Western Seaboard 11 11 21 7 7 20 15 15 21 31
2003 Western Southern Uplands & Inner Solway 3 3 4 2 2 4 1 1 4 4
2004 Western Southern Uplands & Inner Solway 29 29 34 20 20 39 16 16 41 43
2005 Western Southern Uplands & Inner Solway 35 35 39 20 20 32 21 21 42 46
2006 Western Southern Uplands & Inner Solway 14 14 25 11 11 26 7 7 24 34
2007 Western Southern Uplands & Inner Solway 18 18 20 8 8 23 7 7 23 26
2008 Western Southern Uplands & Inner Solway 13 13 17 9 9 17 5 5 18 19
2009 Western Southern Uplands & Inner Solway 20 19 25 12 12 21 10 10 24 27
2003 Wigtown Machairs and Outer Solway Coast 2 2 2 1 1 2 1 1 2 2
2004 Wigtown Machairs and Outer Solway Coast 5 5 5 2 2 5 2 2 5 5
2005 Wigtown Machairs and Outer Solway Coast 7 7 7 7 7 7 7 7 7 7
2006 Wigtown Machairs and Outer Solway Coast 0 0 0 0 0 2 0 0 1 2
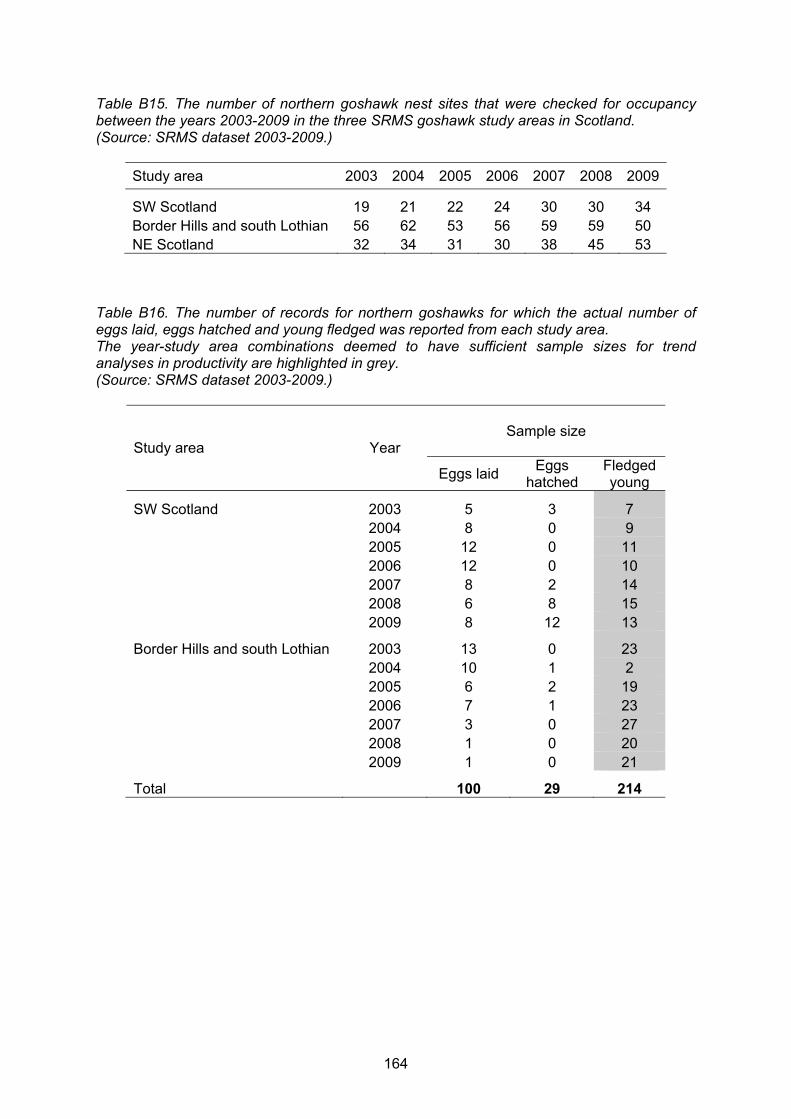
164
Table B15. The number of northern goshawk nest sites that were checked for occupancy between the years 2003-2009 in the three SRMS goshawk study areas in Scotland. (Source: SRMS dataset 2003-2009.)
Study area 2003 2004 2005 2006 2007 2008 2009
SW Scotland 19 21 22 24 30 30 34 Border Hills and south Lothian 56 62 53 56 59 59 50 NE Scotland 32 34 31 30 38 45 53
Table B16. The number of records for northern goshawks for which the actual number of eggs laid, eggs hatched and young fledged was reported from each study area. The year-study area combinations deemed to have sufficient sample sizes for trend analyses in productivity are highlighted in grey. (Source: SRMS dataset 2003-2009.)
Study area Year
Sample size
Eggs laid Eggs
hatched Fledged young
SW Scotland 2003 5 3 7 2004 8 0 9 2005 12 0 11 2006 12 0 10 2007 8 2 14 2008 6 8 15 2009 8 12 13
Border Hills and south Lothian 2003 13 0 23 2004 10 1 2 2005 6 2 19 2006 7 1 23 2007 3 0 27 2008 1 0 20 2009 1 0 21
Total 100 29 214
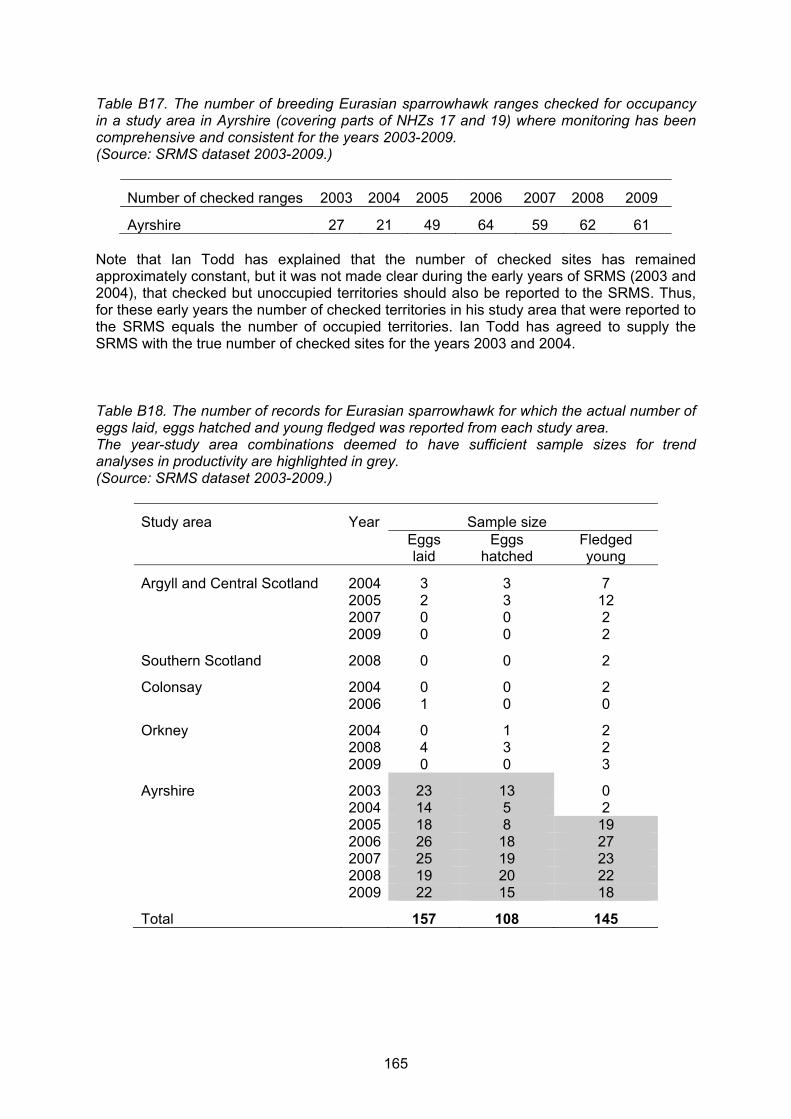
165
Table B17. The number of breeding Eurasian sparrowhawk ranges checked for occupancy in a study area in Ayrshire (covering parts of NHZs 17 and 19) where monitoring has been comprehensive and consistent for the years 2003-2009. (Source: SRMS dataset 2003-2009.)
Number of checked ranges 2003 2004 2005 2006 2007 2008 2009
Ayrshire 27 21 49 64 59 62 61 Note that Ian Todd has explained that the number of checked sites has remained approximately constant, but it was not made clear during the early years of SRMS (2003 and 2004), that checked but unoccupied territories should also be reported to the SRMS. Thus, for these early years the number of checked territories in his study area that were reported to the SRMS equals the number of occupied territories. Ian Todd has agreed to supply the SRMS with the true number of checked sites for the years 2003 and 2004. Table B18. The number of records for Eurasian sparrowhawk for which the actual number of eggs laid, eggs hatched and young fledged was reported from each study area. The year-study area combinations deemed to have sufficient sample sizes for trend analyses in productivity are highlighted in grey. (Source: SRMS dataset 2003-2009.)
Study area Year Sample size
Eggs laid
Eggs hatched
Fledged young
Argyll and Central Scotland 2004 3 3 7 2005 2 3 12 2007 0 0 2 2009 0 0 2
Southern Scotland 2008 0 0 2
Colonsay 2004 0 0 2 2006 1 0 0
Orkney 2004 0 1 2 2008 4 3 2 2009 0 0 3
Ayrshire 2003 23 13 0 2004 14 5 2 2005 18 8 19 2006 26 18 27 2007 25 19 23 2008 19 20 22 2009 22 15 18
Total 157 108 145

166
Table B19. The number of common buzzard nest sites that were checked for occupancy between 2003 and 2009 in 10 study areas in Scotland. As the sample sizes were low for some studies and some studies were only recently initiated, we decided to analyze trends only for the studies and years highlighted in grey in the table below. (Source: SRMS dataset 2003-2009.)
Study area 2003 2004 2005 2006 2007 2008 2009Cowal and Bute 29 66 64 49 71 72 82Falkirk area 8 0 0 0 0 35 38Assynt 13 10 2 6 11 12 16Moray and Dornoch 61 69 62 63 67 57 60Colonsay 53 52 55 54 58 58 58Aviemore and Kingussie 13 11 9 12 12 16 10Stirling and the Trossachs 21 34 101 125 138 133 142Lothian 32 39 42 36 30 34 32Aberdeen 0 0 0 0 128 104 32Uists 0 8 3 22 29 24 18
Total 230 289 338 367 544 545 488 Note that for several of the studies, the results suggest that in the early years of the SRMS (mainly 2003 and 2004), the raptor workers only submitted records for nests that were occupied. For the study on the Uists, this problem has remained, and because of this lack of "negative reporting" it is difficult to assess the spatial coverage of the monitoring effort on Uist without further consultation with relevant observers.

167
Table B20. The number of records for common buzzard for which the actual number of eggs laid, eggs hatched and young fledged was reported from each study area. The year-study area combinations deemed to have sufficient sample sizes for trend analyses in productivity are highlighted in grey. (Source: SRMS dataset 2003-2009.)
Study area Year Sample size
Eggs laidEggs
hatched Fledged young
Cowal and Bute 2004 9 9 44 2005 2 9 35 2006 5 5 27 2007 3 1 38 2008 0 2 19 2009 3 6 26
Moray and Dornoch 2003 29 21 39 2004 26 21 41 2005 21 17 33 2006 18 17 33 2007 28 25 40 2008 26 23 31 2009 19 14 22
Colonsay 2003 1 2 9 2004 2 0 8 2005 2 1 1 2006 7 8 2 2007 3 4 5 2008 5 4 1 2009 2 1 0
Stirling and the Trossachs 2005 6 7 47 2006 1 1 54 2007 3 3 77 2008 0 0 55 2009 0 0 47
Lothian 2003 4 3 26 2004 28 19 32 2005 33 21 32 2006 31 18 28 2007 24 11 21 2008 24 15 23 2009 25 22 25
Uists 2006 2 1 5 2007 3 0 7 2008 3 2 17 2009 6 7 11
Total 404 320 961

168
Table B21. Comparison of the number of golden eagle ranges in Natural Heritage Zones. (Source: SRMS dataset 2003-2009 and additional information supplied by Haworth Conservation.)
Natural Heritage Zone Number in Zone
Name NHZ number SRMS SRMS+HC Change
Raptor Study Group (Unassigned to an NHZ) 799 151 -648 Coll, Tiree and the Western Isles 3 183 208 25 NorthWest Seaboard 4 55 58 3 The Peatlands of Caithness and Sutherland 5 18 18 0 Western Seaboard 6 92 457 365 Northern Highlands 7 89 90 1 Western Highlands 8 198 200 2 Central Highlands 10 43 46 3 Cairngorm Massif 11 97 107 10 North East Glens 12 16 16 0 East Lochaber 13 31 51 20 Argyll West and Islands 14 113 205 92 Breadalbane and East Argyll 15 32 147 115 Western Southern Uplands and Inner Solway 19 8 12 4 Border Hills 20 3 11 8
Totals (excluding unassigned) 978 1626 +648
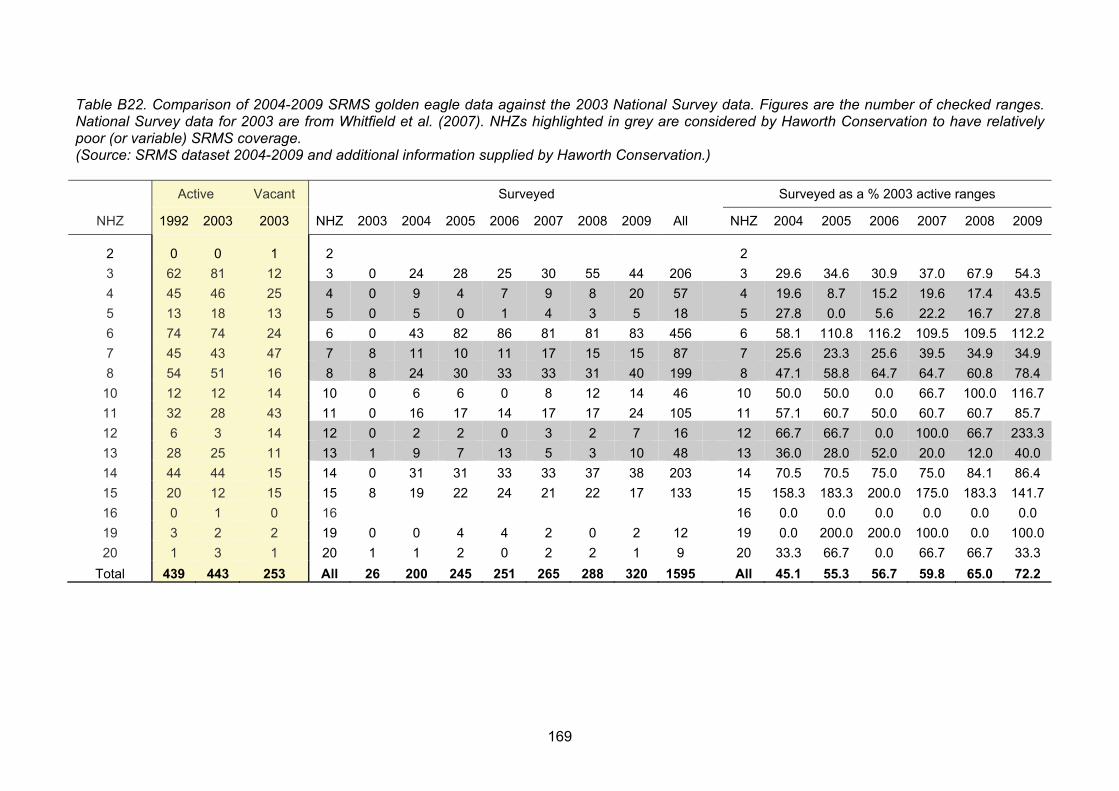
169
Table B22. Comparison of 2004-2009 SRMS golden eagle data against the 2003 National Survey data. Figures are the number of checked ranges. National Survey data for 2003 are from Whitfield et al. (2007). NHZs highlighted in grey are considered by Haworth Conservation to have relatively poor (or variable) SRMS coverage. (Source: SRMS dataset 2004-2009 and additional information supplied by Haworth Conservation.)
Active Vacant Surveyed Surveyed as a % 2003 active ranges
NHZ 1992 2003 2003 NHZ 2003 2004 2005 2006 2007 2008 2009 All NHZ 2004 2005 2006 2007 2008 2009
2 0 0 1 2 2
3 62 81 12 3 0 24 28 25 30 55 44 206 3 29.6 34.6 30.9 37.0 67.9 54.3
4 45 46 25 4 0 9 4 7 9 8 20 57 4 19.6 8.7 15.2 19.6 17.4 43.5
5 13 18 13 5 0 5 0 1 4 3 5 18 5 27.8 0.0 5.6 22.2 16.7 27.8
6 74 74 24 6 0 43 82 86 81 81 83 456 6 58.1 110.8 116.2 109.5 109.5 112.2
7 45 43 47 7 8 11 10 11 17 15 15 87 7 25.6 23.3 25.6 39.5 34.9 34.9
8 54 51 16 8 8 24 30 33 33 31 40 199 8 47.1 58.8 64.7 64.7 60.8 78.4
10 12 12 14 10 0 6 6 0 8 12 14 46 10 50.0 50.0 0.0 66.7 100.0 116.7
11 32 28 43 11 0 16 17 14 17 17 24 105 11 57.1 60.7 50.0 60.7 60.7 85.7
12 6 3 14 12 0 2 2 0 3 2 7 16 12 66.7 66.7 0.0 100.0 66.7 233.3
13 28 25 11 13 1 9 7 13 5 3 10 48 13 36.0 28.0 52.0 20.0 12.0 40.0
14 44 44 15 14 0 31 31 33 33 37 38 203 14 70.5 70.5 75.0 75.0 84.1 86.4
15 20 12 15 15 8 19 22 24 21 22 17 133 15 158.3 183.3 200.0 175.0 183.3 141.7
16 0 1 0 16 16 0.0 0.0 0.0 0.0 0.0 0.0
19 3 2 2 19 0 0 4 4 2 0 2 12 19 0.0 200.0 200.0 100.0 0.0 100.0
20 1 3 1 20 1 1 2 0 2 2 1 9 20 33.3 66.7 0.0 66.7 66.7 33.3
Total 439 443 253 All 26 200 245 251 265 288 320 1595 All 45.1 55.3 56.7 59.8 65.0 72.2

170
Table B23. Sample sizes of breeding parameters available for golden eagles by NHZ or Raptor Study group for those records not currently grid-referenced within the dataset. (Source: SRMS data 2003-2009.)
Year NHZ or RSG
Eggs laid
numbers (+)
Eggs laid
numbers
Eggs laid
binomial
Eggs hatched numbers
(+)
Eggs hatched numbers
Eggs laid
binomial
Young fledged
numbers (+)
Young fledged
numbers
Young Fledged binomial
Total pairs
2004 Argyll West and Islands 0 0 25 0 0 25 19 19 25 25 2005 Argyll West and Islands 3 3 24 5 5 19 9 8 22 25 2006 Argyll West and Islands 5 5 25 5 5 26 11 11 24 27 2007 Argyll West and Islands 2 2 28 2 2 24 17 17 28 28 2008 Argyll West and Islands 3 3 27 7 7 26 18 18 27 32 2009 Argyll West and Islands 4 4 32 2 2 23 12 12 31 34
2005 Argyll RSG 0 0 1 0 0 1 0 0 1 1
2004 Cairngorm Massif 1 1 8 4 4 12 7 7 12 12 2005 Cairngorm Massif 2 2 13 3 3 12 6 6 13 14 2006 Cairngorm Massif 3 3 8 3 3 8 7 7 8 9 2007 Cairngorm Massif 2 2 10 3 3 10 5 5 11 12 2008 Cairngorm Massif 4 4 12 2 2 10 6 6 12 14 2009 Cairngorm Massif 6 3 13 3 0 14 5 5 14 18
2004 Central Highlands 2 2 4 1 1 3 2 2 4 5 2005 Central Highlands 0 0 4 0 0 3 3 3 4 4 2007 Central Highlands 1 1 6 5 5 5 3 3 4 6 2008 Central Highlands 0 0 5 0 0 5 3 3 7 7 2009 Central Highlands 1 1 8 1 1 6 5 5 8 9
2008 Central Scotland RSG 0 0 1 0 0 1 1 1 1 1
2004 Coll, Tiree and the Western Isles 11 11 14 5 5 12 8 8 14 21 2005 Coll, Tiree and the Western Isles 7 7 26 0 0 21 5 5 21 27 2006 Coll, Tiree and the Western Isles 5 5 16 3 3 12 4 4 14 24 2007 Coll, Tiree and the Western Isles 3 3 23 5 5 16 10 10 21 28 2008 Coll, Tiree and the Western Isles 27 27 50 13 13 46 22 19 49 52 2009 Coll, Tiree and the Western Isles 6 6 42 18 15 39 23 23 40 44

171
Year NHZ or RSG
Eggs laid
numbers (+)
Eggs laid
numbers
Eggs laid
binomial
Eggs hatched numbers
(+)
Eggs hatched numbers
Eggs laid
binomial
Young fledged
numbers (+)
Young fledged
numbers
Young Fledged binomial
Total pairs
2003 East Lochaber 0 0 1 0 0 0 0 0 1 1 2004 East Lochaber 2 2 7 1 1 7 4 4 7 7 2005 East Lochaber 0 0 7 1 1 6 2 2 6 7 2006 East Lochaber 0 0 11 0 0 10 1 1 10 11 2007 East Lochaber 0 0 5 0 0 5 3 3 5 5 2008 East Lochaber 0 0 2 0 0 2 2 2 2 2 2009 East Lochaber 1 0 3 1 0 3 1 1 3 6
2005 Highland RSG 0 0 0 0 0 0 0 0 0 1
2003 Lothian & Borders RSG 0 0 1 0 0 1 0 0 1 1 2004 Lothian & Borders RSG 0 0 1 0 0 1 1 1 1 1 2005 Lothian & Borders RSG 1 1 2 0 0 2 1 1 2 2 2006 Lothian & Borders RSG 0 0 3 0 0 1 1 1 3 3
2003 L Lomond, Trossachs & Breadalbane 0 0 5 1 1 3 3 3 5 5 2004 L Lomond, Trossachs & Breadalbane 1 1 11 0 0 8 5 5 10 12 2005 L Lomond, Trossachs & Breadalbane 0 0 16 0 0 11 4 4 15 18 2006 L Lomond, Trossachs & Breadalbane 0 0 12 1 1 11 7 7 14 14 2007 L Lomond, Trossachs & Breadalbane 0 0 13 1 1 12 9 9 15 15 2008 L Lomond, Trossachs & Breadalbane 1 1 15 1 1 11 7 7 16 16 2009 L Lomond, Trossachs & Breadalbane 1 0 11 1 1 5 4 3 12 13
2004 North-east Scotland RSG 0 0 13 1 1 16 9 9 13 16 2005 North-east Scotland RSG 0 0 15 4 4 14 4 4 14 15 2006 North-east Scotland RSG 2 2 16 0 0 16 6 6 15 16 2007 North-east Scotland RSG 0 0 7 7 7 7 4 4 14 15 2008 North-east Scotland RSG 1 1 15 5 5 13 5 5 15 15 2009 North-east Scotland RSG 7 7 13 7 7 13 7 7 13 13
2004 North East Glens 0 0 1 0 0 0 0 0 1 1 2008 North East Glens 0 0 1 0 0 0 0 0 1 1 2009 North East Glens 0 0 1 0 0 2 0 0 0 2

172
Year NHZ or RSG
Eggs laid
numbers (+)
Eggs laid
numbers
Eggs laid
binomial
Eggs hatched numbers
(+)
Eggs hatched numbers
Eggs laid
binomial
Young fledged
numbers (+)
Young fledged
numbers
Young Fledged binomial
Total pairs
2004 North West Seaboard 2 2 6 2 2 5 2 2 6 7 2005 North West Seaboard 0 0 4 0 0 3 1 1 3 4 2006 North West Seaboard 1 1 4 1 1 5 3 3 5 5 2007 North West Seaboard 2 2 4 2 2 2 1 1 4 6 2008 North West Seaboard 0 0 3 2 2 3 2 2 3 4 2009 North West Seaboard 2 2 10 1 1 10 2 2 9 12
2003 Northern Highlands 4 4 4 2 2 4 0 0 6 6 2004 Northern Highlands 1 1 4 1 1 4 4 4 5 5 2005 Northern Highlands 2 2 5 2 2 5 2 2 3 5 2006 Northern Highlands 0 0 5 0 0 5 1 1 5 5 2007 Northern Highlands 2 2 8 5 5 5 4 4 8 9 2008 Northern Highlands 5 5 6 1 1 6 3 3 6 7 2009 Northern Highlands 2 2 7 0 0 3 1 1 7 7
2003 Southern Scotland 2 2 4 1 1 2 1 1 3 4 2004 Southern Scotland 0 0 3 0 0 1 0 0 4 4 2005 Southern Scotland 0 0 1 0 0 0 0 0 1 1 2007 Southern Scotland 1 1 1 0 0 0 0 0 2 2 2008 Southern Scotland 0 0 1 0 0 1 1 1 1 1
2008 Tayside RSG 0 0 1 0 0 0 0 0 0 1
2004 Peatlands of Caithness & Sutherland 0 0 4 0 0 1 1 1 5 5 2006 Peatlands of Caithness & Sutherland 0 0 1 0 0 0 0 0 0 1 2007 Peatlands of Caithness & Sutherland 0 0 3 3 3 3 3 3 3 3 2008 Peatlands of Caithness & Sutherland 0 0 1 0 0 1 0 0 0 1 2009 Peatlands of Caithness & Sutherland 0 0 4 1 1 4 4 4 4 4
2003 Western Highlands 4 4 6 4 4 4 1 1 6 6 2004 Western Highlands 1 1 15 1 1 16 7 7 15 18 2005 Western Highlands 7 7 17 8 8 20 5 5 19 22 2006 Western Highlands 1 1 25 1 1 26 5 5 25 27 2007 Western Highlands 9 9 24 15 15 15 3 3 23 24

173
Year NHZ or RSG
Eggs laid
numbers (+)
Eggs laid
numbers
Eggs laid
binomial
Eggs hatched numbers
(+)
Eggs hatched numbers
Eggs laid
binomial
Young fledged
numbers (+)
Young fledged
numbers
Young Fledged binomial
Total pairs
2008 Western Highlands 3 3 21 2 2 20 6 6 20 21 2009 Western Highlands 2 2 19 2 2 20 3 3 20 27
2004 Western Seaboard 3 3 32 3 3 28 12 12 30 35 2005 Western Seaboard 3 3 49 7 7 48 22 22 67 73 2006 Western Seaboard 0 0 60 2 2 61 18 18 61 78 2007 Western Seaboard 17 17 62 25 25 47 18 18 63 66 2008 Western Seaboard 1 1 33 2 2 32 34 34 66 69 2009 Western Seaboard 2 2 44 3 3 42 24 24 63 69
2005 W Southern Uplands and Inner Solway 0 0 0 0 0 1 0 0 1 1 2006 W Southern Uplands and Inner Solway 0 0 0 0 0 2 0 0 2 2 2007 W Southern Uplands and Inner Solway 1 1 1 0 0 0 0 0 0 1 2009 W Southern Uplands and Inner Solway 1 1 1 0 0 1 1 1 1 1

174
Table B24. The number of common kestrel nest sites that were checked for occupancy between the 2003 and 2009 in an Ayrshire study area. (Source: SRMS dataset 2003-2009.)
Study area 2003 2004 2005 2006 2007 2008 2009
Ayrshire 30 33 35 36 36 43 40
Table B25. The number of records for common kestrel for which the actual number of eggs laid, eggs hatched and young fledged was reported from each study area. The year-study area combinations deemed to have sufficient sample sizes for trend analyses in productivity are highlighted in grey. (Source: SRMS dataset 2003-2009.)
Main observer Year
Sample size
Eggs laid Eggs hatched Fledged young
Stirling and the Trossachs 2004 3 2 2 2005 0 0 1 2007 1 1 1 2009 1 0 0
Ayrshire 2003 14 13 16 2004 25 23 23 2005 14 11 11 2006 17 16 20 2007 12 12 12 2008 18 17 23 2009 10 10 13
Other areas 2003 7 9 15 2004 20 16 43 2005 16 11 35 2006 4 5 17 2007 6 3 21 2008 8 4 25 2009 5 4 26 Dumfries and Galloway 2003 12 13 16 2004 22 20 19 2005 10 9 10 2006 11 9 9 2008 7 5 7
Total 243 213 365
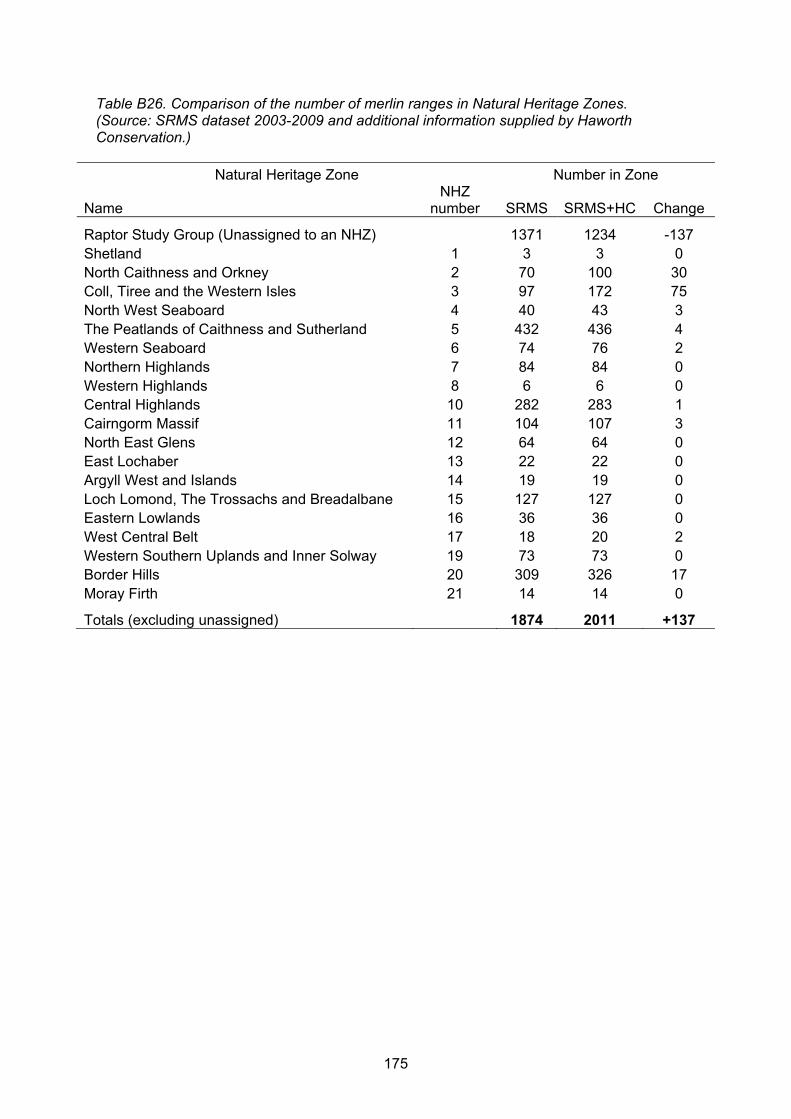
175
Table B26. Comparison of the number of merlin ranges in Natural Heritage Zones. (Source: SRMS dataset 2003-2009 and additional information supplied by Haworth Conservation.)
Natural Heritage Zone Number in Zone
Name NHZ
number SRMS SRMS+HC Change
Raptor Study Group (Unassigned to an NHZ) 1371 1234 -137 Shetland 1 3 3 0 North Caithness and Orkney 2 70 100 30 Coll, Tiree and the Western Isles 3 97 172 75 North West Seaboard 4 40 43 3 The Peatlands of Caithness and Sutherland 5 432 436 4 Western Seaboard 6 74 76 2 Northern Highlands 7 84 84 0 Western Highlands 8 6 6 0 Central Highlands 10 282 283 1 Cairngorm Massif 11 104 107 3 North East Glens 12 64 64 0 East Lochaber 13 22 22 0 Argyll West and Islands 14 19 19 0 Loch Lomond, The Trossachs and Breadalbane 15 127 127 0 Eastern Lowlands 16 36 36 0 West Central Belt 17 18 20 2 Western Southern Uplands and Inner Solway 19 73 73 0 Border Hills 20 309 326 17 Moray Firth 21 14 14 0
Totals (excluding unassigned) 1874 2011 +137
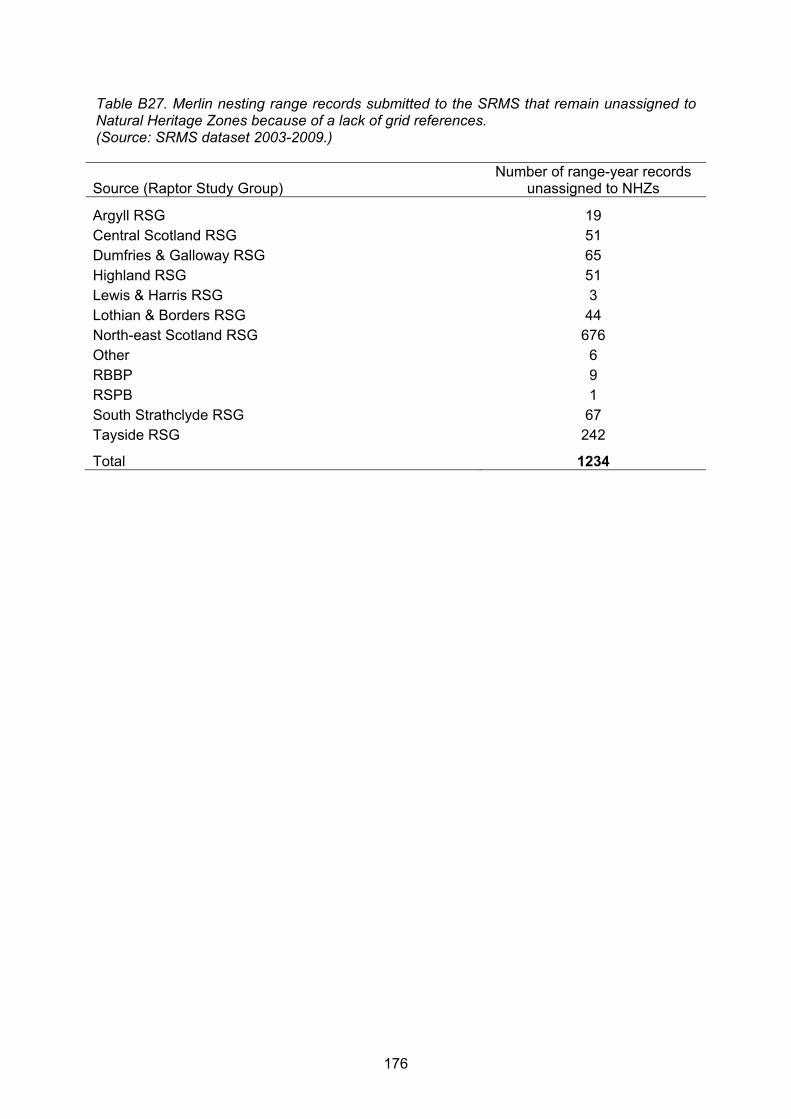
176
Table B27. Merlin nesting range records submitted to the SRMS that remain unassigned to Natural Heritage Zones because of a lack of grid references. (Source: SRMS dataset 2003-2009.)
Source (Raptor Study Group) Number of range-year records
unassigned to NHZs
Argyll RSG 19 Central Scotland RSG 51 Dumfries & Galloway RSG 65 Highland RSG 51 Lewis & Harris RSG 3 Lothian & Borders RSG 44 North-east Scotland RSG 676 Other 6 RBBP 9 RSPB 1 South Strathclyde RSG 67 Tayside RSG 242
Total 1234
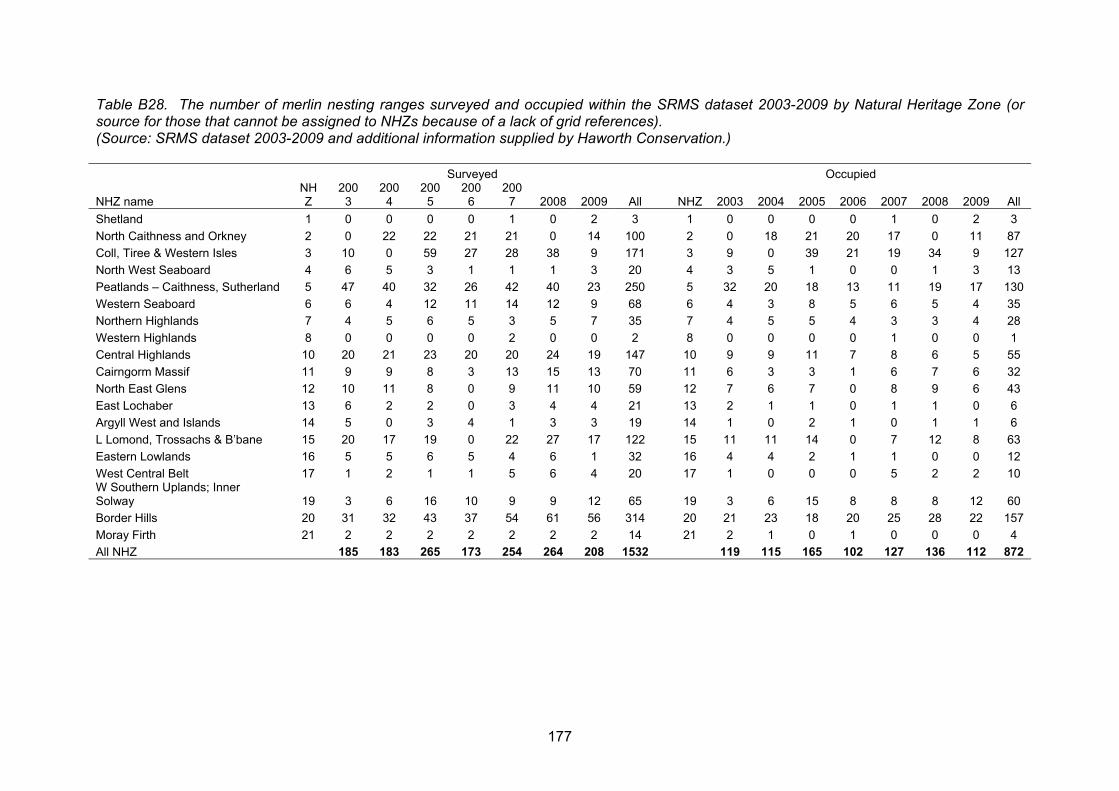
177
Table B28. The number of merlin nesting ranges surveyed and occupied within the SRMS dataset 2003-2009 by Natural Heritage Zone (or source for those that cannot be assigned to NHZs because of a lack of grid references). (Source: SRMS dataset 2003-2009 and additional information supplied by Haworth Conservation.) Surveyed Occupied
NHZ name NHZ
2003
2004
2005
2006
2007 2008 2009 All NHZ 2003 2004 2005 2006 2007 2008 2009 All
Shetland 1 0 0 0 0 1 0 2 3 1 0 0 0 0 1 0 2 3
North Caithness and Orkney 2 0 22 22 21 21 0 14 100 2 0 18 21 20 17 0 11 87
Coll, Tiree & Western Isles 3 10 0 59 27 28 38 9 171 3 9 0 39 21 19 34 9 127
North West Seaboard 4 6 5 3 1 1 1 3 20 4 3 5 1 0 0 1 3 13
Peatlands – Caithness, Sutherland 5 47 40 32 26 42 40 23 250 5 32 20 18 13 11 19 17 130
Western Seaboard 6 6 4 12 11 14 12 9 68 6 4 3 8 5 6 5 4 35
Northern Highlands 7 4 5 6 5 3 5 7 35 7 4 5 5 4 3 3 4 28
Western Highlands 8 0 0 0 0 2 0 0 2 8 0 0 0 0 1 0 0 1
Central Highlands 10 20 21 23 20 20 24 19 147 10 9 9 11 7 8 6 5 55
Cairngorm Massif 11 9 9 8 3 13 15 13 70 11 6 3 3 1 6 7 6 32
North East Glens 12 10 11 8 0 9 11 10 59 12 7 6 7 0 8 9 6 43
East Lochaber 13 6 2 2 0 3 4 4 21 13 2 1 1 0 1 1 0 6
Argyll West and Islands 14 5 0 3 4 1 3 3 19 14 1 0 2 1 0 1 1 6
L Lomond, Trossachs & B’bane 15 20 17 19 0 22 27 17 122 15 11 11 14 0 7 12 8 63
Eastern Lowlands 16 5 5 6 5 4 6 1 32 16 4 4 2 1 1 0 0 12
West Central Belt 17 1 2 1 1 5 6 4 20 17 1 0 0 0 5 2 2 10 W Southern Uplands; Inner Solway 19 3 6 16 10 9 9 12 65 19 3 6 15 8 8 8 12 60
Border Hills 20 31 32 43 37 54 61 56 314 20 21 23 18 20 25 28 22 157
Moray Firth 21 2 2 2 2 2 2 2 14 21 2 1 0 1 0 0 0 4
All NHZ 185 183 265 173 254 264 208 1532 119 115 165 102 127 136 112 872

178
Table B29 Continued. Surveyed Occupied
NHZ name NHZ 2003 2004 2005 2006 2007 2008 2009 All NHZ 2003 2004 2005 2006 2007 2008 2009 All Argyll RSG 31 2 13 1 0 2 1 0 19 31 2 10 0 0 2 0 0 14
Central Scotland RSG 32 0 1 1 0 24 24 1 51 32 0 1 0 0 1 4 1 7
Dumfries & Galloway RSG 33 20 13 1 3 1 2 2 42 33 9 8 1 3 1 2 2 26
Highland RSG 34 2 15 0 1 1 6 0 25 34 1 14 0 1 0 4 0 20
Lewis & Harris RSG 35 0 0 0 0 0 3 0 3 35 0 0 0 0 0 3 0 3
Lothian & Borders RSG 36 14 9 9 9 1 2 0 44 36 11 4 2 3 1 1 0 22 North-east Scotland RSG 37 103 103 90 96 74 74 70 610 37 50 45 39 41 41 0 36 252
Other 38 0 0 1 3 0 2 0 6 38 0 0 1 2 0 2 0 5
RBBP/RSPB 39 0 0 0 0 10 0 0 10 39 0 0 0 0 7 0 0 7 South Strathclyde RSG 40 7 7 11 9 7 8 0 49 40 7 6 7 2 5 6 0 33
Tayside RSG 41 33 39 33 0 30 36 26 197 41 18 21 16 0 13 13 7 88 All RSG Data All 181 200 147 121 150 158 99 1056 All 98 109 66 52 71 35 46 477 All data 366 383 412 294 404 422 307 2588 All 217 224 231 154 198 171 158 1349
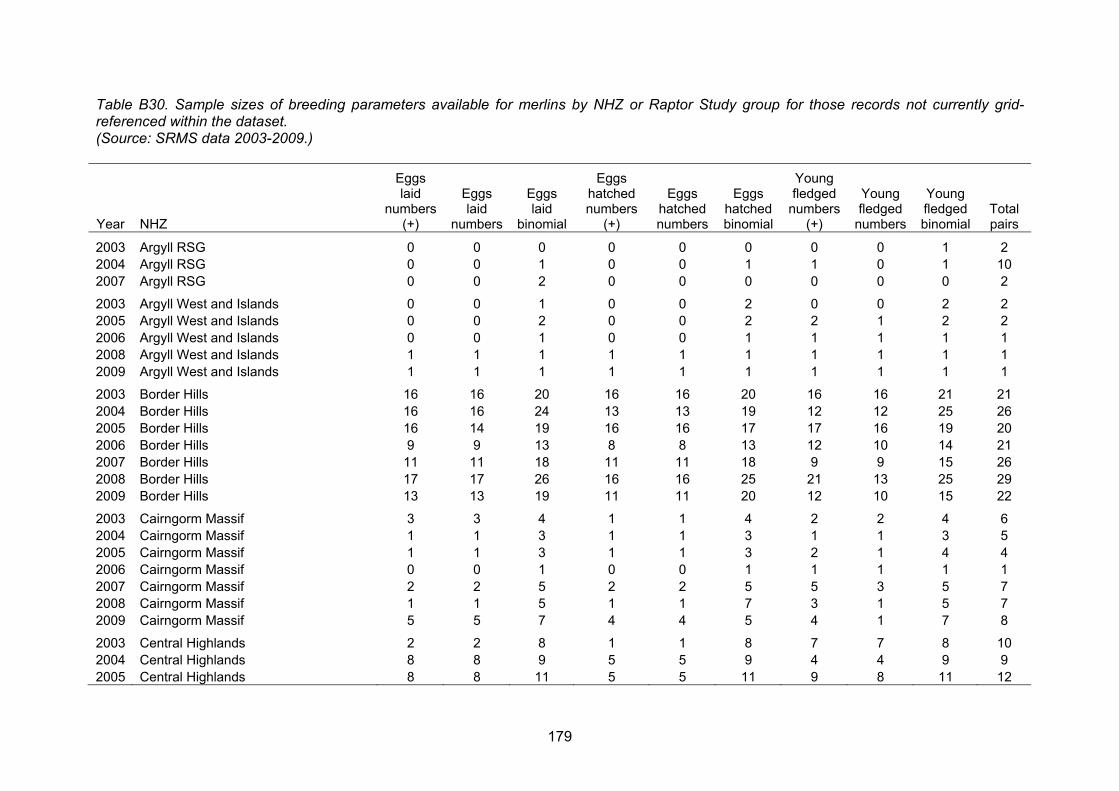
179
Table B30. Sample sizes of breeding parameters available for merlins by NHZ or Raptor Study group for those records not currently grid-referenced within the dataset. (Source: SRMS data 2003-2009.)
Year NHZ
Eggs laid
numbers (+)
Eggs laid
numbers
Eggs laid
binomial
Eggs hatched numbers
(+)
Eggs hatched numbers
Eggs hatched binomial
Young fledged
numbers (+)
Young fledged
numbers
Young fledged binomial
Total pairs
2003 Argyll RSG 0 0 0 0 0 0 0 0 1 2 2004 Argyll RSG 0 0 1 0 0 1 1 0 1 10 2007 Argyll RSG 0 0 2 0 0 0 0 0 0 2
2003 Argyll West and Islands 0 0 1 0 0 2 0 0 2 2 2005 Argyll West and Islands 0 0 2 0 0 2 2 1 2 2 2006 Argyll West and Islands 0 0 1 0 0 1 1 1 1 1 2008 Argyll West and Islands 1 1 1 1 1 1 1 1 1 1 2009 Argyll West and Islands 1 1 1 1 1 1 1 1 1 1
2003 Border Hills 16 16 20 16 16 20 16 16 21 21 2004 Border Hills 16 16 24 13 13 19 12 12 25 26 2005 Border Hills 16 14 19 16 16 17 17 16 19 20 2006 Border Hills 9 9 13 8 8 13 12 10 14 21 2007 Border Hills 11 11 18 11 11 18 9 9 15 26 2008 Border Hills 17 17 26 16 16 25 21 13 25 29 2009 Border Hills 13 13 19 11 11 20 12 10 15 22
2003 Cairngorm Massif 3 3 4 1 1 4 2 2 4 6 2004 Cairngorm Massif 1 1 3 1 1 3 1 1 3 5 2005 Cairngorm Massif 1 1 3 1 1 3 2 1 4 4 2006 Cairngorm Massif 0 0 1 0 0 1 1 1 1 1 2007 Cairngorm Massif 2 2 5 2 2 5 5 3 5 7 2008 Cairngorm Massif 1 1 5 1 1 7 3 1 5 7 2009 Cairngorm Massif 5 5 7 4 4 5 4 1 7 8
2003 Central Highlands 2 2 8 1 1 8 7 7 8 10 2004 Central Highlands 8 8 9 5 5 9 4 4 9 9 2005 Central Highlands 8 8 11 5 5 11 9 8 11 12
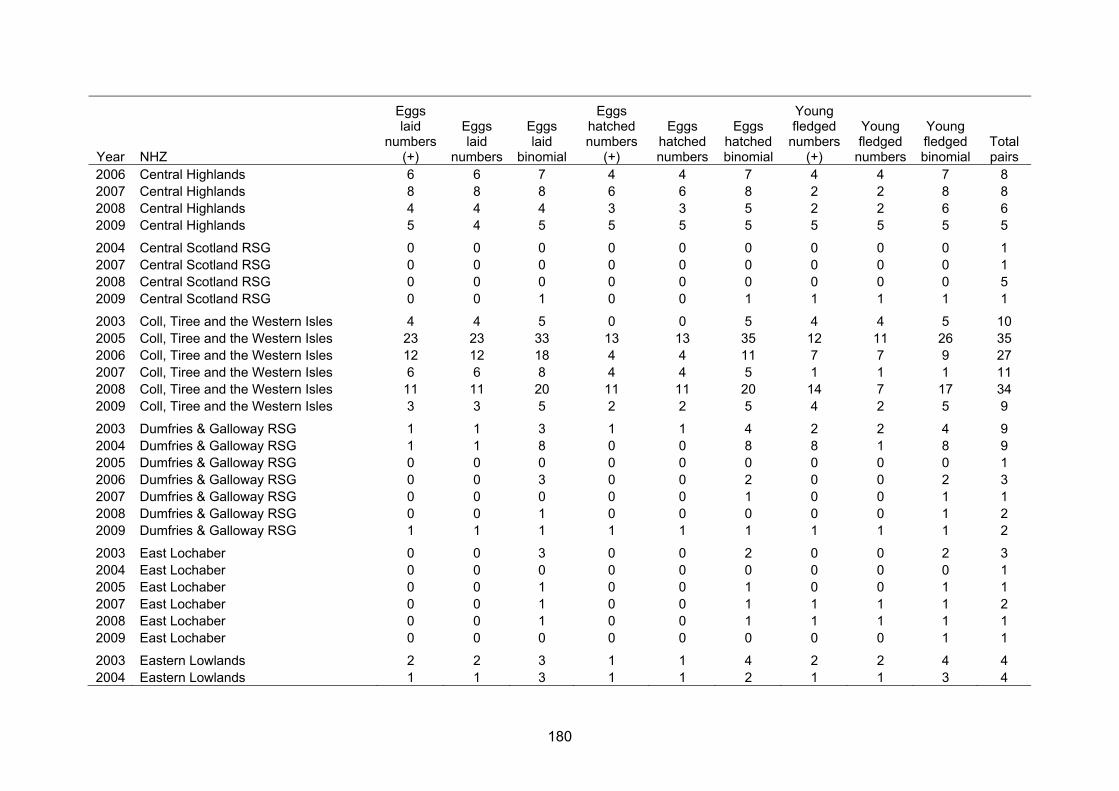
180
Year NHZ
Eggs laid
numbers (+)
Eggs laid
numbers
Eggs laid
binomial
Eggs hatched numbers
(+)
Eggs hatched numbers
Eggs hatched binomial
Young fledged
numbers (+)
Young fledged
numbers
Young fledged binomial
Total pairs
2006 Central Highlands 6 6 7 4 4 7 4 4 7 8 2007 Central Highlands 8 8 8 6 6 8 2 2 8 8 2008 Central Highlands 4 4 4 3 3 5 2 2 6 6 2009 Central Highlands 5 4 5 5 5 5 5 5 5 5
2004 Central Scotland RSG 0 0 0 0 0 0 0 0 0 1 2007 Central Scotland RSG 0 0 0 0 0 0 0 0 0 1 2008 Central Scotland RSG 0 0 0 0 0 0 0 0 0 5 2009 Central Scotland RSG 0 0 1 0 0 1 1 1 1 1
2003 Coll, Tiree and the Western Isles 4 4 5 0 0 5 4 4 5 10 2005 Coll, Tiree and the Western Isles 23 23 33 13 13 35 12 11 26 35 2006 Coll, Tiree and the Western Isles 12 12 18 4 4 11 7 7 9 27 2007 Coll, Tiree and the Western Isles 6 6 8 4 4 5 1 1 1 11 2008 Coll, Tiree and the Western Isles 11 11 20 11 11 20 14 7 17 34 2009 Coll, Tiree and the Western Isles 3 3 5 2 2 5 4 2 5 9
2003 Dumfries & Galloway RSG 1 1 3 1 1 4 2 2 4 9 2004 Dumfries & Galloway RSG 1 1 8 0 0 8 8 1 8 9 2005 Dumfries & Galloway RSG 0 0 0 0 0 0 0 0 0 1 2006 Dumfries & Galloway RSG 0 0 3 0 0 2 0 0 2 3 2007 Dumfries & Galloway RSG 0 0 0 0 0 1 0 0 1 1 2008 Dumfries & Galloway RSG 0 0 1 0 0 0 0 0 1 2 2009 Dumfries & Galloway RSG 1 1 1 1 1 1 1 1 1 2
2003 East Lochaber 0 0 3 0 0 2 0 0 2 3 2004 East Lochaber 0 0 0 0 0 0 0 0 0 1 2005 East Lochaber 0 0 1 0 0 1 0 0 1 1 2007 East Lochaber 0 0 1 0 0 1 1 1 1 2 2008 East Lochaber 0 0 1 0 0 1 1 1 1 1 2009 East Lochaber 0 0 0 0 0 0 0 0 1 1
2003 Eastern Lowlands 2 2 3 1 1 4 2 2 4 4 2004 Eastern Lowlands 1 1 3 1 1 2 1 1 3 4
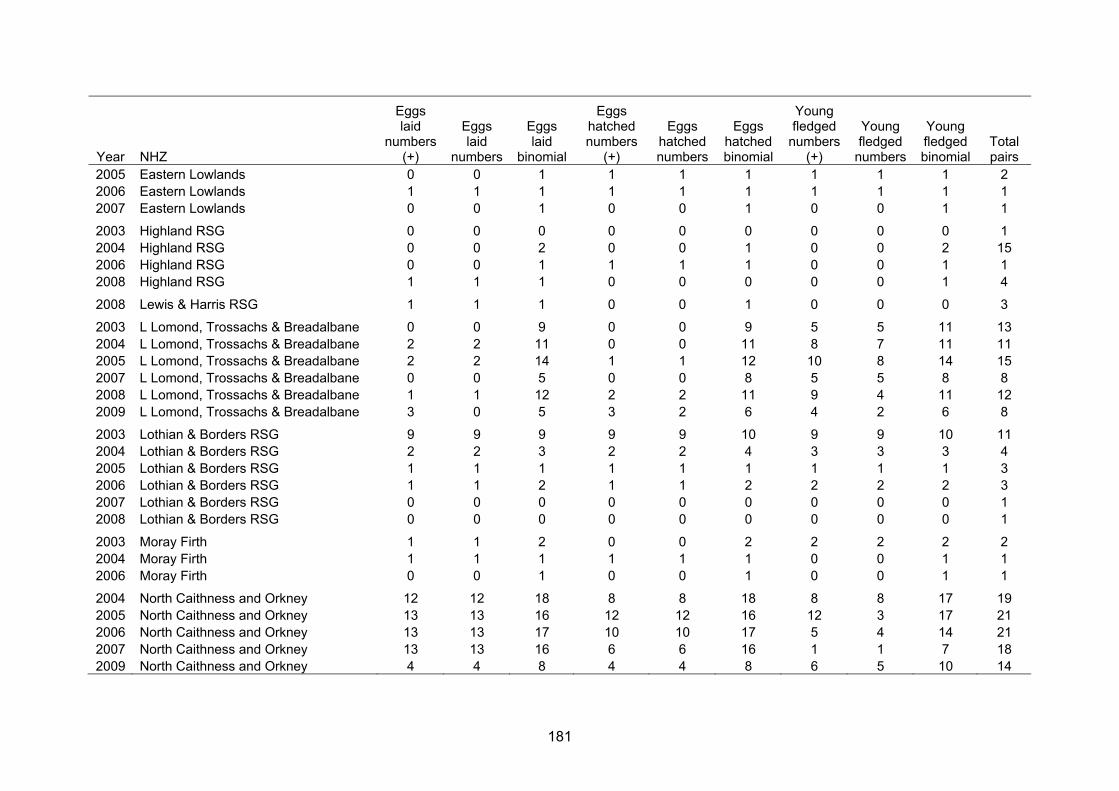
181
Year NHZ
Eggs laid
numbers (+)
Eggs laid
numbers
Eggs laid
binomial
Eggs hatched numbers
(+)
Eggs hatched numbers
Eggs hatched binomial
Young fledged
numbers (+)
Young fledged
numbers
Young fledged binomial
Total pairs
2005 Eastern Lowlands 0 0 1 1 1 1 1 1 1 2 2006 Eastern Lowlands 1 1 1 1 1 1 1 1 1 1 2007 Eastern Lowlands 0 0 1 0 0 1 0 0 1 1
2003 Highland RSG 0 0 0 0 0 0 0 0 0 1 2004 Highland RSG 0 0 2 0 0 1 0 0 2 15 2006 Highland RSG 0 0 1 1 1 1 0 0 1 1 2008 Highland RSG 1 1 1 0 0 0 0 0 1 4
2008 Lewis & Harris RSG 1 1 1 0 0 1 0 0 0 3
2003 L Lomond, Trossachs & Breadalbane 0 0 9 0 0 9 5 5 11 13 2004 L Lomond, Trossachs & Breadalbane 2 2 11 0 0 11 8 7 11 11 2005 L Lomond, Trossachs & Breadalbane 2 2 14 1 1 12 10 8 14 15 2007 L Lomond, Trossachs & Breadalbane 0 0 5 0 0 8 5 5 8 8 2008 L Lomond, Trossachs & Breadalbane 1 1 12 2 2 11 9 4 11 12 2009 L Lomond, Trossachs & Breadalbane 3 0 5 3 2 6 4 2 6 8
2003 Lothian & Borders RSG 9 9 9 9 9 10 9 9 10 11 2004 Lothian & Borders RSG 2 2 3 2 2 4 3 3 3 4 2005 Lothian & Borders RSG 1 1 1 1 1 1 1 1 1 3 2006 Lothian & Borders RSG 1 1 2 1 1 2 2 2 2 3 2007 Lothian & Borders RSG 0 0 0 0 0 0 0 0 0 1 2008 Lothian & Borders RSG 0 0 0 0 0 0 0 0 0 1
2003 Moray Firth 1 1 2 0 0 2 2 2 2 2 2004 Moray Firth 1 1 1 1 1 1 0 0 1 1 2006 Moray Firth 0 0 1 0 0 1 0 0 1 1
2004 North Caithness and Orkney 12 12 18 8 8 18 8 8 17 19 2005 North Caithness and Orkney 13 13 16 12 12 16 12 3 17 21 2006 North Caithness and Orkney 13 13 17 10 10 17 5 4 14 21 2007 North Caithness and Orkney 13 13 16 6 6 16 1 1 7 18 2009 North Caithness and Orkney 4 4 8 4 4 8 6 5 10 14

182
Year NHZ
Eggs laid
numbers (+)
Eggs laid
numbers
Eggs laid
binomial
Eggs hatched numbers
(+)
Eggs hatched numbers
Eggs hatched binomial
Young fledged
numbers (+)
Young fledged
numbers
Young fledged binomial
Total pairs
2003 North East Glens 5 5 7 3 3 6 3 3 7 7 2004 North East Glens 5 5 6 2 2 6 4 4 6 7 2005 North East Glens 4 4 6 5 5 6 6 6 6 7 2007 North East Glens 3 3 7 3 3 7 7 4 7 8 2008 North East Glens 4 4 8 4 4 8 7 5 7 9 2009 North East Glens 4 4 5 3 3 3 3 3 3 6
2003 North West Seaboard 1 1 2 0 0 1 1 1 1 3 2004 North West Seaboard 0 0 3 1 1 3 1 1 2 5 2005 North West Seaboard 0 0 0 0 0 0 0 0 0 1 2008 North West Seaboard 0 0 1 0 0 1 0 0 1 1 2009 North West Seaboard 1 1 3 0 0 3 2 2 3 3
2003 North-east Scotland RSG 39 39 50 36 36 50 39 39 51 51 2004 North-east Scotland RSG 31 31 48 20 20 45 28 28 47 48 2005 North-east Scotland RSG 31 31 40 24 24 38 29 28 40 41 2006 North-east Scotland RSG 25 25 39 24 24 40 33 30 40 41 2007 North-east Scotland RSG 28 28 40 23 23 39 28 28 40 41 2009 North-east Scotland RSG 0 0 36 0 0 36 0 0 5 36
2003 Northern Highlands 1 1 3 1 1 3 3 3 3 4 2004 Northern Highlands 1 1 5 1 1 5 5 5 5 5 2005 Northern Highlands 2 2 5 2 2 5 5 2 5 5 2006 Northern Highlands 2 2 4 1 1 3 2 2 4 4 2007 Northern Highlands 1 1 1 1 1 1 1 1 1 3 2008 Northern Highlands 1 1 3 1 1 3 1 1 3 3 2009 Northern Highlands 1 1 2 0 0 2 1 1 3 4
2005 Other 0 0 0 0 0 0 0 0 0 1 2006 Other 1 1 2 1 1 1 0 0 2 2 2007 Other 3 3 5 1 1 3 0 0 1 7 2008 Other 1 1 1 0 0 1 0 0 1 2
2007 Shetland 1 1 1 0 0 1 0 0 0 1
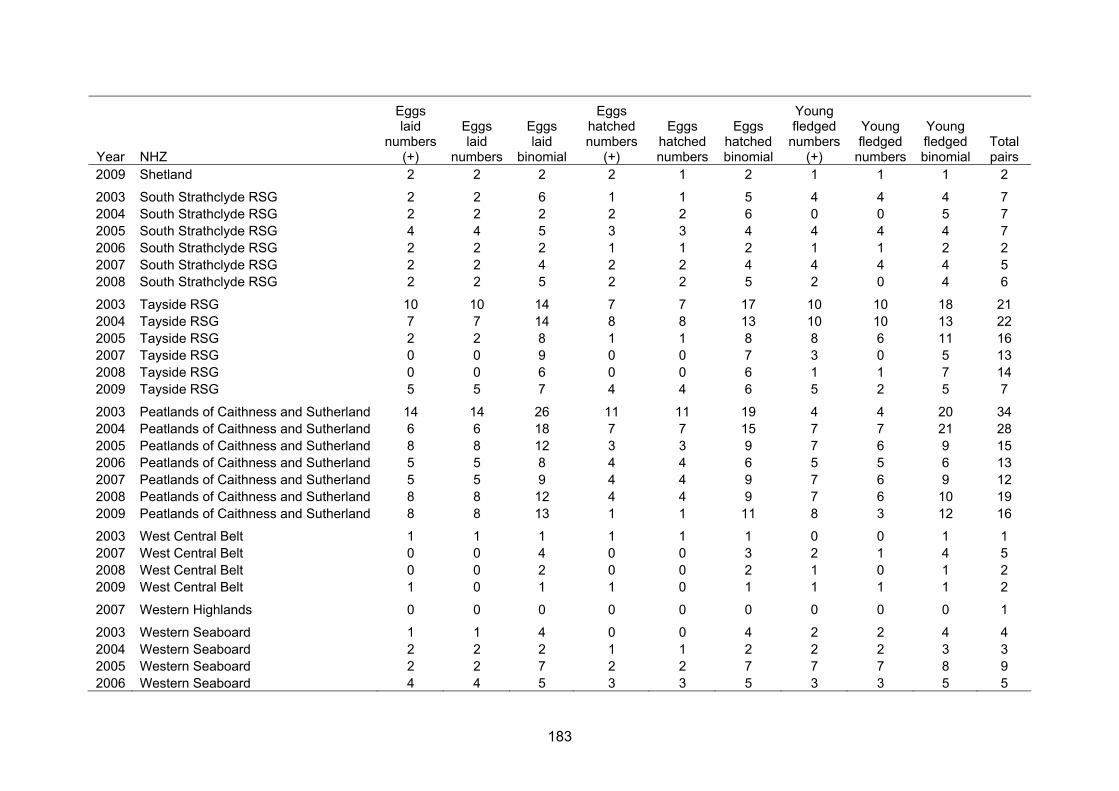
183
Year NHZ
Eggs laid
numbers (+)
Eggs laid
numbers
Eggs laid
binomial
Eggs hatched numbers
(+)
Eggs hatched numbers
Eggs hatched binomial
Young fledged
numbers (+)
Young fledged
numbers
Young fledged binomial
Total pairs
2009 Shetland 2 2 2 2 1 2 1 1 1 2
2003 South Strathclyde RSG 2 2 6 1 1 5 4 4 4 7 2004 South Strathclyde RSG 2 2 2 2 2 6 0 0 5 7 2005 South Strathclyde RSG 4 4 5 3 3 4 4 4 4 7 2006 South Strathclyde RSG 2 2 2 1 1 2 1 1 2 2 2007 South Strathclyde RSG 2 2 4 2 2 4 4 4 4 5 2008 South Strathclyde RSG 2 2 5 2 2 5 2 0 4 6
2003 Tayside RSG 10 10 14 7 7 17 10 10 18 21 2004 Tayside RSG 7 7 14 8 8 13 10 10 13 22 2005 Tayside RSG 2 2 8 1 1 8 8 6 11 16 2007 Tayside RSG 0 0 9 0 0 7 3 0 5 13 2008 Tayside RSG 0 0 6 0 0 6 1 1 7 14 2009 Tayside RSG 5 5 7 4 4 6 5 2 5 7
2003 Peatlands of Caithness and Sutherland 14 14 26 11 11 19 4 4 20 34 2004 Peatlands of Caithness and Sutherland 6 6 18 7 7 15 7 7 21 28 2005 Peatlands of Caithness and Sutherland 8 8 12 3 3 9 7 6 9 15 2006 Peatlands of Caithness and Sutherland 5 5 8 4 4 6 5 5 6 13 2007 Peatlands of Caithness and Sutherland 5 5 9 4 4 9 7 6 9 12 2008 Peatlands of Caithness and Sutherland 8 8 12 4 4 9 7 6 10 19 2009 Peatlands of Caithness and Sutherland 8 8 13 1 1 11 8 3 12 16
2003 West Central Belt 1 1 1 1 1 1 0 0 1 1 2007 West Central Belt 0 0 4 0 0 3 2 1 4 5 2008 West Central Belt 0 0 2 0 0 2 1 0 1 2 2009 West Central Belt 1 0 1 1 0 1 1 1 1 2
2007 Western Highlands 0 0 0 0 0 0 0 0 0 1
2003 Western Seaboard 1 1 4 0 0 4 2 2 4 4 2004 Western Seaboard 2 2 2 1 1 2 2 2 3 3 2005 Western Seaboard 2 2 7 2 2 7 7 7 8 9 2006 Western Seaboard 4 4 5 3 3 5 3 3 5 5
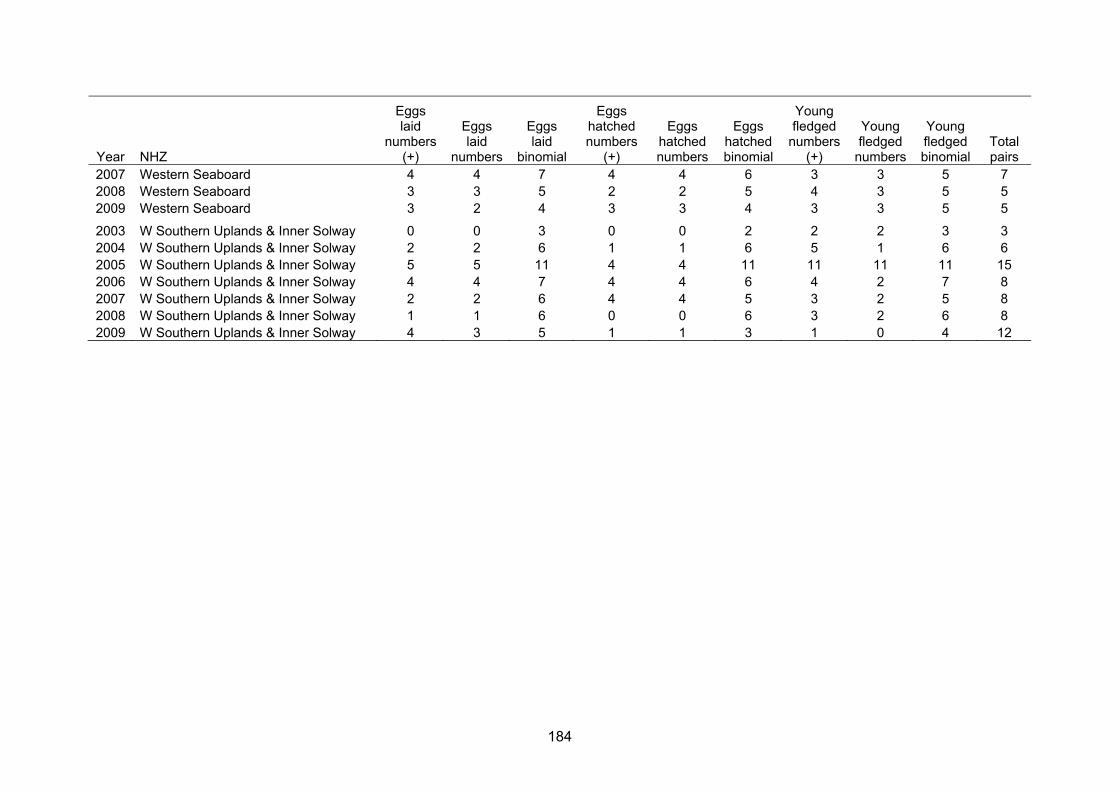
184
Year NHZ
Eggs laid
numbers (+)
Eggs laid
numbers
Eggs laid
binomial
Eggs hatched numbers
(+)
Eggs hatched numbers
Eggs hatched binomial
Young fledged
numbers (+)
Young fledged
numbers
Young fledged binomial
Total pairs
2007 Western Seaboard 4 4 7 4 4 6 3 3 5 7 2008 Western Seaboard 3 3 5 2 2 5 4 3 5 5 2009 Western Seaboard 3 2 4 3 3 4 3 3 5 5
2003 W Southern Uplands & Inner Solway 0 0 3 0 0 2 2 2 3 3 2004 W Southern Uplands & Inner Solway 2 2 6 1 1 6 5 1 6 6 2005 W Southern Uplands & Inner Solway 5 5 11 4 4 11 11 11 11 15 2006 W Southern Uplands & Inner Solway 4 4 7 4 4 6 4 2 7 8 2007 W Southern Uplands & Inner Solway 2 2 6 4 4 5 3 2 5 8 2008 W Southern Uplands & Inner Solway 1 1 6 0 0 6 3 2 6 8 2009 W Southern Uplands & Inner Solway 4 3 5 1 1 3 1 0 4 12
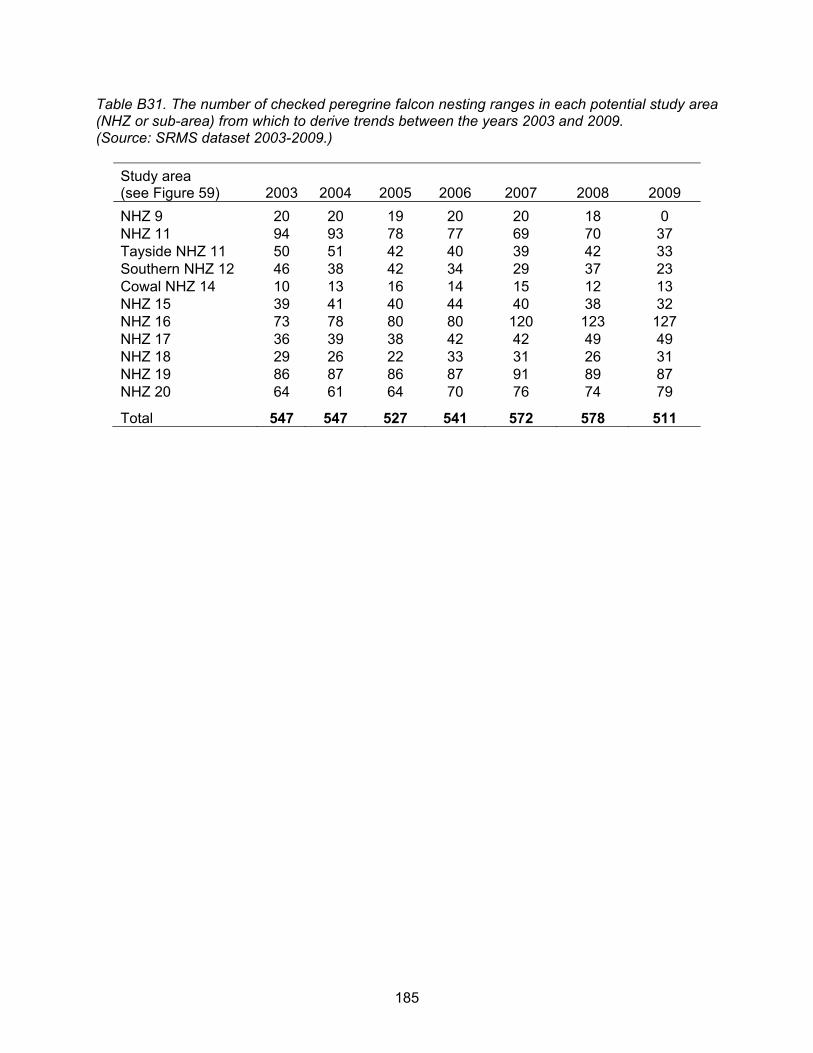
185
Table B31. The number of checked peregrine falcon nesting ranges in each potential study area (NHZ or sub-area) from which to derive trends between the years 2003 and 2009. (Source: SRMS dataset 2003-2009.)
Study area (see Figure 59) 2003 2004 2005 2006 2007 2008 2009
NHZ 9 20 20 19 20 20 18 0 NHZ 11 94 93 78 77 69 70 37 Tayside NHZ 11 50 51 42 40 39 42 33 Southern NHZ 12 46 38 42 34 29 37 23 Cowal NHZ 14 10 13 16 14 15 12 13 NHZ 15 39 41 40 44 40 38 32 NHZ 16 73 78 80 80 120 123 127 NHZ 17 36 39 38 42 42 49 49 NHZ 18 29 26 22 33 31 26 31 NHZ 19 86 87 86 87 91 89 87 NHZ 20 64 61 64 70 76 74 79
Total 547 547 527 541 572 578 511
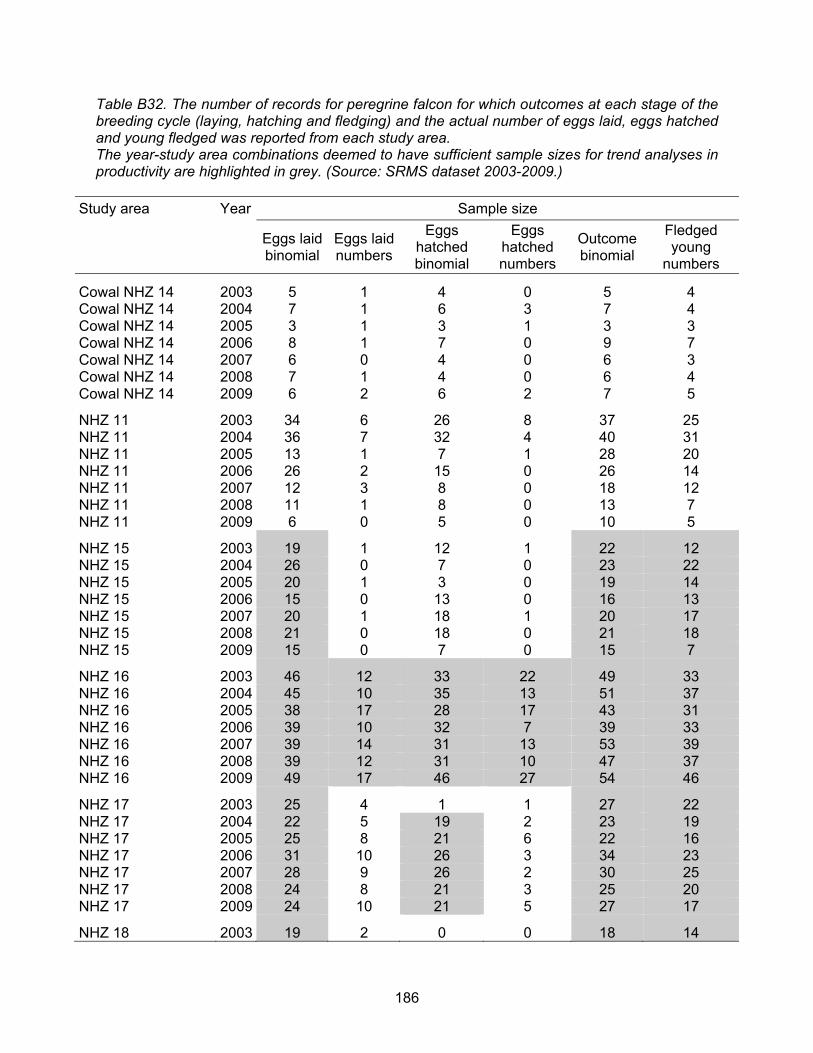
186
Table B32. The number of records for peregrine falcon for which outcomes at each stage of the breeding cycle (laying, hatching and fledging) and the actual number of eggs laid, eggs hatched and young fledged was reported from each study area. The year-study area combinations deemed to have sufficient sample sizes for trend analyses in productivity are highlighted in grey. (Source: SRMS dataset 2003-2009.)
Study area Year Sample size
Eggs laid binomial
Eggs laid numbers
Eggs hatched binomial
Eggs hatched numbers
Outcome binomial
Fledged young
numbers
Cowal NHZ 14 2003 5 1 4 0 5 4 Cowal NHZ 14 2004 7 1 6 3 7 4 Cowal NHZ 14 2005 3 1 3 1 3 3 Cowal NHZ 14 2006 8 1 7 0 9 7 Cowal NHZ 14 2007 6 0 4 0 6 3 Cowal NHZ 14 2008 7 1 4 0 6 4 Cowal NHZ 14 2009 6 2 6 2 7 5
NHZ 11 2003 34 6 26 8 37 25 NHZ 11 2004 36 7 32 4 40 31 NHZ 11 2005 13 1 7 1 28 20 NHZ 11 2006 26 2 15 0 26 14 NHZ 11 2007 12 3 8 0 18 12 NHZ 11 2008 11 1 8 0 13 7 NHZ 11 2009 6 0 5 0 10 5
NHZ 15 2003 19 1 12 1 22 12 NHZ 15 2004 26 0 7 0 23 22 NHZ 15 2005 20 1 3 0 19 14 NHZ 15 2006 15 0 13 0 16 13 NHZ 15 2007 20 1 18 1 20 17 NHZ 15 2008 21 0 18 0 21 18 NHZ 15 2009 15 0 7 0 15 7
NHZ 16 2003 46 12 33 22 49 33 NHZ 16 2004 45 10 35 13 51 37 NHZ 16 2005 38 17 28 17 43 31 NHZ 16 2006 39 10 32 7 39 33 NHZ 16 2007 39 14 31 13 53 39 NHZ 16 2008 39 12 31 10 47 37 NHZ 16 2009 49 17 46 27 54 46
NHZ 17 2003 25 4 1 1 27 22 NHZ 17 2004 22 5 19 2 23 19 NHZ 17 2005 25 8 21 6 22 16 NHZ 17 2006 31 10 26 3 34 23 NHZ 17 2007 28 9 26 2 30 25 NHZ 17 2008 24 8 21 3 25 20 NHZ 17 2009 24 10 21 5 27 17
NHZ 18 2003 19 2 0 0 18 14

187
Study area Year Sample size
Eggs laid binomial
Eggs laid numbers
Eggs hatched binomial
Eggs hatched numbers
Outcome binomial
Fledged young
numbers NHZ 18 2004 18 2 16 2 16 15 NHZ 18 2005 13 2 11 2 13 11 NHZ 18 2006 20 10 16 2 20 14 NHZ 18 2007 16 6 14 6 15 13 NHZ 18 2008 18 8 14 5 12 9 NHZ 18 2009 18 6 14 8 18 13
NHZ 19 2003 34 12 1 0 36 15 NHZ 19 2004 39 19 29 8 42 27 NHZ 19 2005 32 11 19 5 33 21 NHZ 19 2006 35 22 26 1 36 24 NHZ 19 2007 32 21 26 17 34 24 NHZ 19 2008 28 13 19 7 35 19 NHZ 19 2009 25 12 20 10 29 16
NHZ 20 2003 34 28 17 14 38 20 NHZ 20 2004 26 18 20 18 29 20 NHZ 20 2005 27 25 21 12 28 19 NHZ 20 2006 32 26 24 17 33 22 NHZ 20 2007 25 23 19 12 26 17 NHZ 20 2008 25 21 21 15 25 18 NHZ 20 2009 31 26 24 19 30 22
NHZ 9 2003 8 2 5 1 16 6 NHZ 9 2004 13 2 13 0 14 13 NHZ 9 2005 0 0 0 0 15 8 NHZ 9 2006 8 0 8 0 8 8 NHZ 9 2007 0 0 0 0 12 5 NHZ 9 2008 2 2 3 3 2 0
Southern NHZ 12 2003 13 3 12 0 15 12 Southern NHZ 12 2004 14 2 12 0 17 11 Southern NHZ 12 2005 4 0 4 0 15 11 Southern NHZ 12 2006 12 1 11 3 11 10 Southern NHZ 12 2007 2 1 2 1 7 6 Southern NHZ 12 2008 8 2 5 0 6 5 Southern NHZ 12 2009 7 2 6 2 9 6
Tayside NHZ 11 2003 22 4 17 5 22 16 Tayside NHZ 11 2004 24 4 21 3 25 20 Tayside NHZ 11 2005 13 1 7 1 17 12 Tayside NHZ 11 2006 19 2 8 0 19 8 Tayside NHZ 11 2007 12 3 8 0 12 8 Tayside NHZ 11 2008 8 0 6 0 12 6 Tayside NHZ 11 2009 6 0 5 0 10 5
Total 1532 520 1108 351 1705 1194
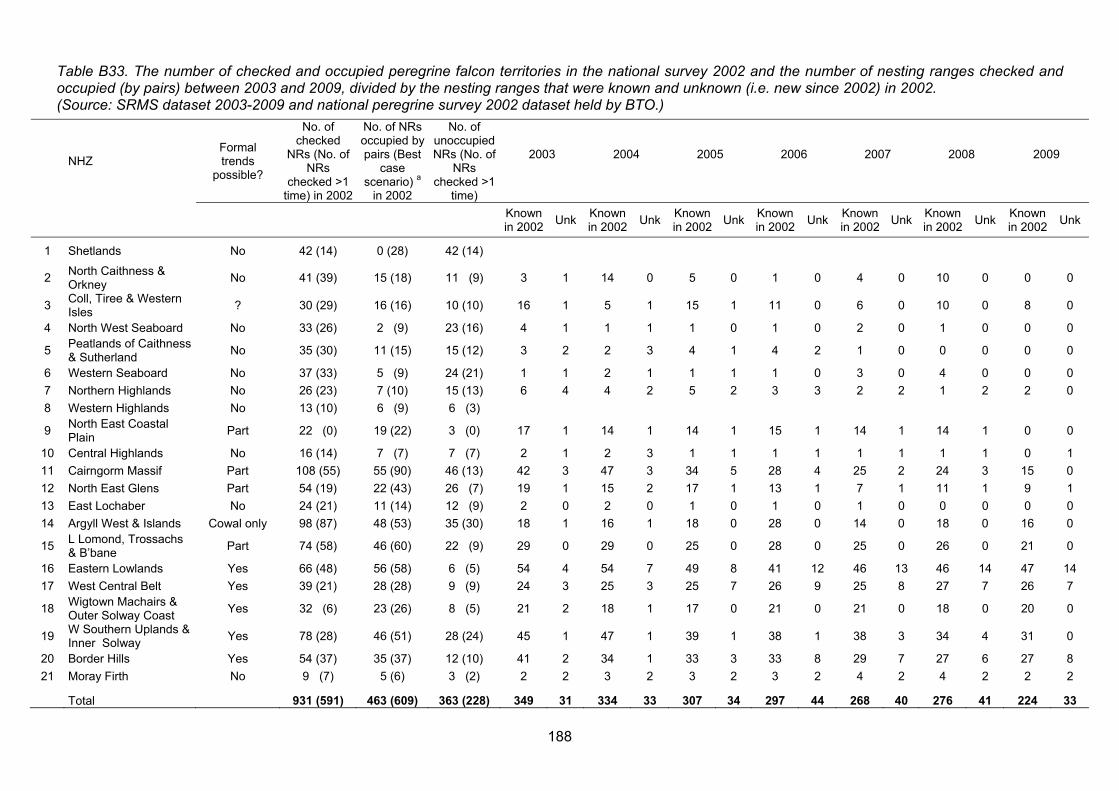
188
Table B33. The number of checked and occupied peregrine falcon territories in the national survey 2002 and the number of nesting ranges checked and occupied (by pairs) between 2003 and 2009, divided by the nesting ranges that were known and unknown (i.e. new since 2002) in 2002. (Source: SRMS dataset 2003-2009 and national peregrine survey 2002 dataset held by BTO.)
NHZ Formal trends
possible?
No. of checked
NRs (No. of NRs
checked >1 time) in 2002
No. of NRs occupied by pairs (Best
case scenario) a
in 2002
No. of unoccupied NRs (No. of
NRs checked >1
time)
2003
2004
2005
2006
2007
2008
2009
Known in 2002
Unk Known in 2002
Unk Known in 2002
Unk Known in 2002
Unk Known in 2002
Unk Known in 2002
Unk Known in 2002
Unk
1 Shetlands No 42 (14) 0 (28) 42 (14)
2 North Caithness & Orkney
No 41 (39) 15 (18) 11 (9) 3 1 14 0 5 0 1 0 4 0 10 0 0 0
3 Coll, Tiree & Western Isles
? 30 (29) 16 (16) 10 (10) 16 1 5 1 15 1 11 0 6 0 10 0 8 0
4 North West Seaboard No 33 (26) 2 (9) 23 (16) 4 1 1 1 1 0 1 0 2 0 1 0 0 0
5 Peatlands of Caithness & Sutherland
No 35 (30) 11 (15) 15 (12) 3 2 2 3 4 1 4 2 1 0 0 0 0 0
6 Western Seaboard No 37 (33) 5 (9) 24 (21) 1 1 2 1 1 1 1 0 3 0 4 0 0 0
7 Northern Highlands No 26 (23) 7 (10) 15 (13) 6 4 4 2 5 2 3 3 2 2 1 2 2 0
8 Western Highlands No 13 (10) 6 (9) 6 (3)
9 North East Coastal Plain
Part 22 (0) 19 (22) 3 (0) 17 1 14 1 14 1 15 1 14 1 14 1 0 0
10 Central Highlands No 16 (14) 7 (7) 7 (7) 2 1 2 3 1 1 1 1 1 1 1 1 0 1
11 Cairngorm Massif Part 108 (55) 55 (90) 46 (13) 42 3 47 3 34 5 28 4 25 2 24 3 15 0
12 North East Glens Part 54 (19) 22 (43) 26 (7) 19 1 15 2 17 1 13 1 7 1 11 1 9 1
13 East Lochaber No 24 (21) 11 (14) 12 (9) 2 0 2 0 1 0 1 0 1 0 0 0 0 0
14 Argyll West & Islands Cowal only 98 (87) 48 (53) 35 (30) 18 1 16 1 18 0 28 0 14 0 18 0 16 0
15 L Lomond, Trossachs & B’bane
Part 74 (58) 46 (60) 22 (9) 29 0 29 0 25 0 28 0 25 0 26 0 21 0
16 Eastern Lowlands Yes 66 (48) 56 (58) 6 (5) 54 4 54 7 49 8 41 12 46 13 46 14 47 14
17 West Central Belt Yes 39 (21) 28 (28) 9 (9) 24 3 25 3 25 7 26 9 25 8 27 7 26 7
18 Wigtown Machairs & Outer Solway Coast
Yes 32 (6) 23 (26) 8 (5) 21 2 18 1 17 0 21 0 21 0 18 0 20 0
19 W Southern Uplands & Inner Solway
Yes 78 (28) 46 (51) 28 (24) 45 1 47 1 39 1 38 1 38 3 34 4 31 0
20 Border Hills Yes 54 (37) 35 (37) 12 (10) 41 2 34 1 33 3 33 8 29 7 27 6 27 8
21 Moray Firth No 9 (7) 5 (6) 3 (2) 2 2 3 2 3 2 3 2 4 2 4 2 2 2
Total 931 (591) 463 (609) 363 (228) 349 31 334 33 307 34 297 44 268 40 276 41 224 33
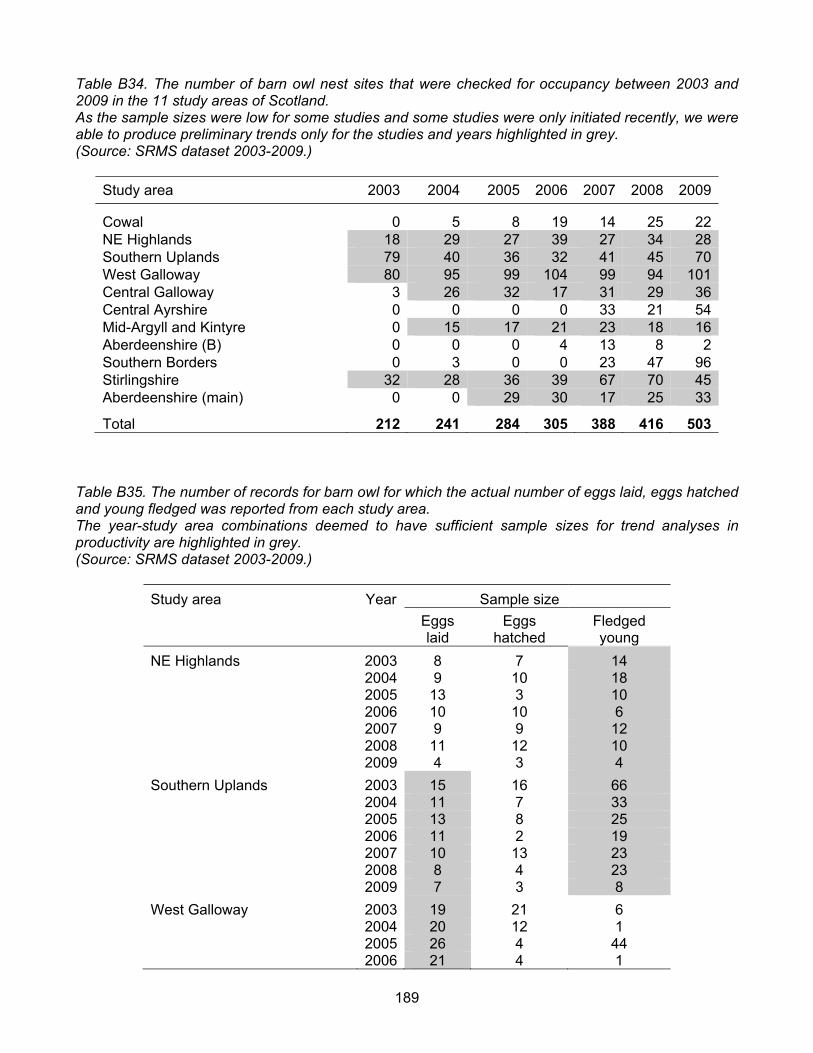
189
Table B34. The number of barn owl nest sites that were checked for occupancy between 2003 and 2009 in the 11 study areas of Scotland. As the sample sizes were low for some studies and some studies were only initiated recently, we were able to produce preliminary trends only for the studies and years highlighted in grey. (Source: SRMS dataset 2003-2009.)
Study area 2003 2004 2005 2006 2007 2008 2009
Cowal 0 5 8 19 14 25 22NE Highlands 18 29 27 39 27 34 28Southern Uplands 79 40 36 32 41 45 70West Galloway 80 95 99 104 99 94 101Central Galloway 3 26 32 17 31 29 36Central Ayrshire 0 0 0 0 33 21 54Mid-Argyll and Kintyre 0 15 17 21 23 18 16Aberdeenshire (B) 0 0 0 4 13 8 2Southern Borders 0 3 0 0 23 47 96Stirlingshire 32 28 36 39 67 70 45Aberdeenshire (main) 0 0 29 30 17 25 33
Total 212 241 284 305 388 416 503 Table B35. The number of records for barn owl for which the actual number of eggs laid, eggs hatched and young fledged was reported from each study area. The year-study area combinations deemed to have sufficient sample sizes for trend analyses in productivity are highlighted in grey. (Source: SRMS dataset 2003-2009.)
Study area Year Sample size
Eggs laid
Eggs hatched
Fledged young
NE Highlands 2003 8 7 14 2004 9 10 18 2005 13 3 10 2006 10 10 6 2007 9 9 12 2008 11 12 10 2009 4 3 4
Southern Uplands 2003 15 16 66 2004 11 7 33 2005 13 8 25 2006 11 2 19 2007 10 13 23 2008 8 4 23 2009 7 3 8
West Galloway 2003 19 21 6 2004 20 12 1 2005 26 4 44 2006 21 4 1
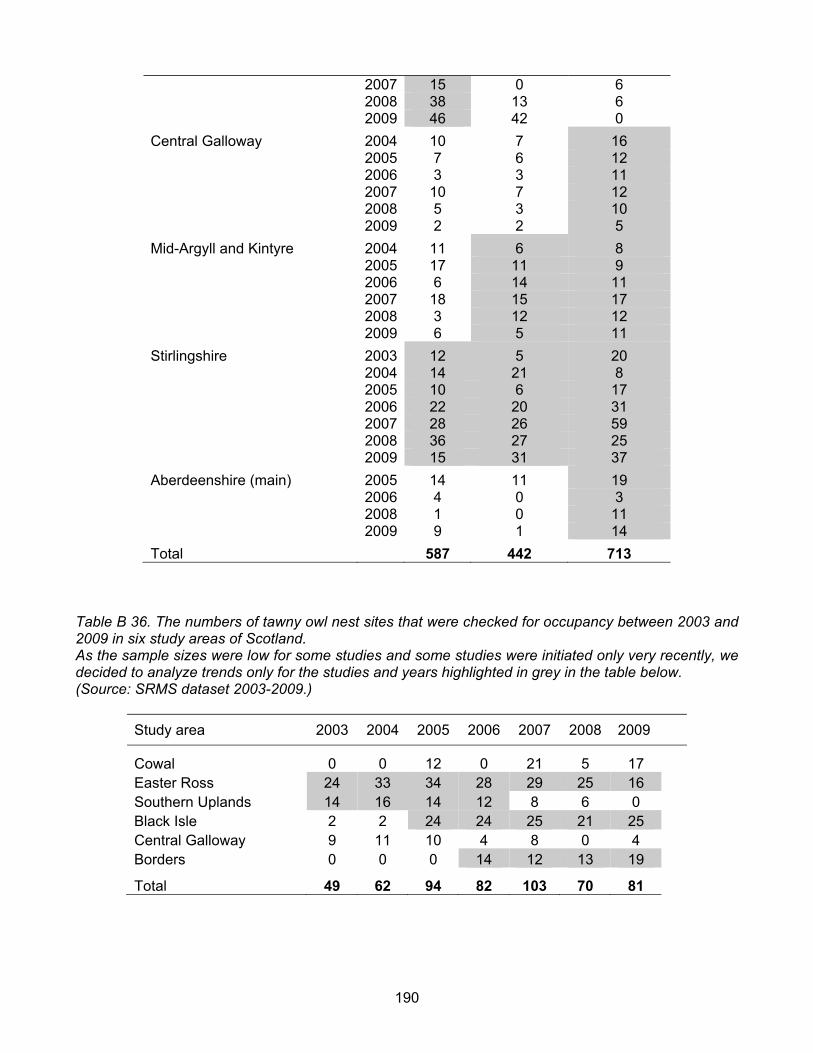
190
2007 15 0 6 2008 38 13 6 2009 46 42 0
Central Galloway 2004 10 7 16 2005 7 6 12 2006 3 3 11 2007 10 7 12 2008 5 3 10 2009 2 2 5
Mid-Argyll and Kintyre 2004 11 6 8 2005 17 11 9 2006 6 14 11 2007 18 15 17 2008 3 12 12 2009 6 5 11
Stirlingshire 2003 12 5 20 2004 14 21 8 2005 10 6 17 2006 22 20 31 2007 28 26 59 2008 36 27 25 2009 15 31 37
Aberdeenshire (main) 2005 14 11 19 2006 4 0 3 2008 1 0 11 2009 9 1 14
Total 587 442 713 Table B 36. The numbers of tawny owl nest sites that were checked for occupancy between 2003 and 2009 in six study areas of Scotland. As the sample sizes were low for some studies and some studies were initiated only very recently, we decided to analyze trends only for the studies and years highlighted in grey in the table below. (Source: SRMS dataset 2003-2009.)
Study area 2003 2004 2005 2006 2007 2008 2009
Cowal 0 0 12 0 21 5 17 Easter Ross 24 33 34 28 29 25 16 Southern Uplands 14 16 14 12 8 6 0 Black Isle 2 2 24 24 25 21 25 Central Galloway 9 11 10 4 8 0 4 Borders 0 0 0 14 12 13 19
Total 49 62 94 82 103 70 81
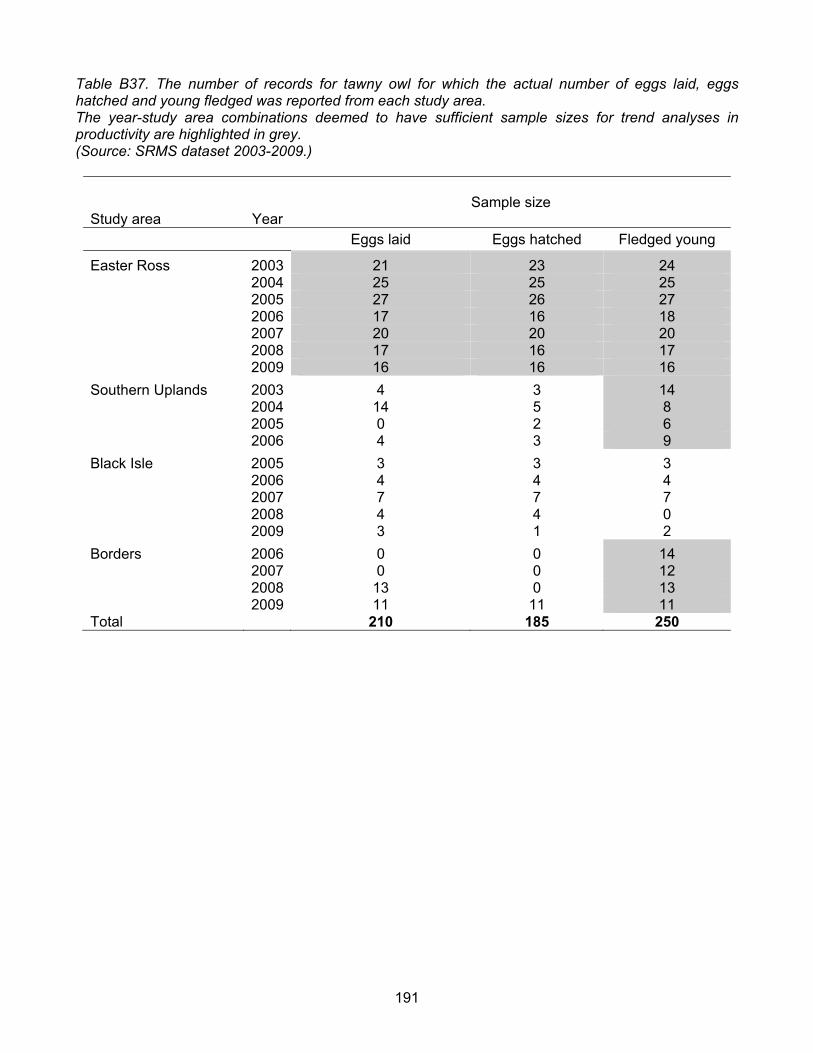
191
Table B37. The number of records for tawny owl for which the actual number of eggs laid, eggs hatched and young fledged was reported from each study area. The year-study area combinations deemed to have sufficient sample sizes for trend analyses in productivity are highlighted in grey. (Source: SRMS dataset 2003-2009.)
Study area Year
Sample size
Eggs laid Eggs hatched Fledged young
Easter Ross 2003 21 23 24 2004 25 25 25 2005 27 26 27 2006 17 16 18 2007 20 20 20 2008 17 16 17 2009 16 16 16
Southern Uplands 2003 4 3 14 2004 14 5 8 2005 0 2 6 2006 4 3 9
Black Isle 2005 3 3 3 2006 4 4 4 2007 7 7 7 2008 4 4 0 2009 3 1 2
Borders 2006 0 0 14 2007 0 0 12 2008 13 0 13 2009 11 11 11 Total 210 185 250
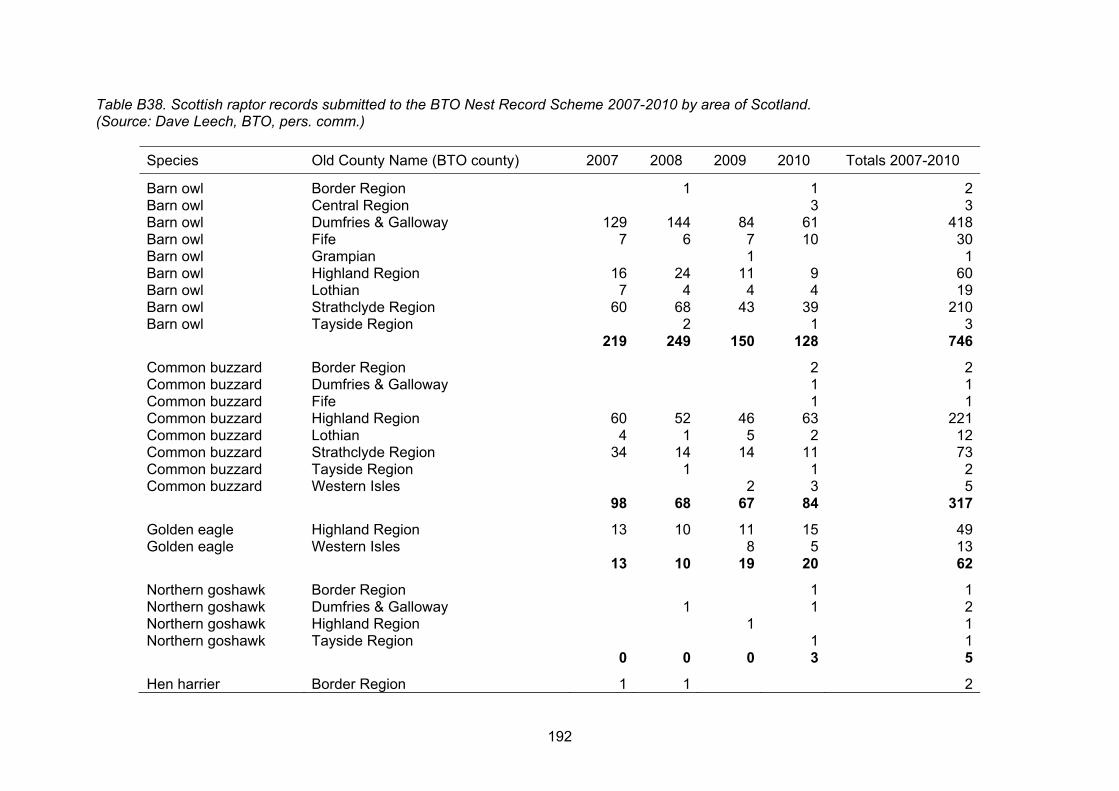
192
Table B38. Scottish raptor records submitted to the BTO Nest Record Scheme 2007-2010 by area of Scotland. (Source: Dave Leech, BTO, pers. comm.)
Species Old County Name (BTO county) 2007 2008 2009 2010 Totals 2007-2010
Barn owl Border Region 1 1 2Barn owl Central Region 3 3Barn owl Dumfries & Galloway 129 144 84 61 418Barn owl Fife 7 6 7 10 30Barn owl Grampian 1 1Barn owl Highland Region 16 24 11 9 60Barn owl Lothian 7 4 4 4 19Barn owl Strathclyde Region 60 68 43 39 210Barn owl Tayside Region 2 1 3 219 249 150 128 746
Common buzzard Border Region 2 2Common buzzard Dumfries & Galloway 1 1Common buzzard Fife 1 1Common buzzard Highland Region 60 52 46 63 221Common buzzard Lothian 4 1 5 2 12Common buzzard Strathclyde Region 34 14 14 11 73Common buzzard Tayside Region 1 1 2Common buzzard Western Isles 2 3 5 98 68 67 84 317
Golden eagle Highland Region 13 10 11 15 49Golden eagle Western Isles 8 5 13 13 10 19 20 62
Northern goshawk Border Region 1 1Northern goshawk Dumfries & Galloway 1 1 2Northern goshawk Highland Region 1 1Northern goshawk Tayside Region 1 1 0 0 0 3 5
Hen harrier Border Region 1 1 2

193
Species Old County Name (BTO county) 2007 2008 2009 2010 Totals 2007-2010
Hen harrier Grampian 1 1Hen harrier Highland Region 2 10 8 4 24Hen harrier Strathclyde Region 7 3 4 5 19
Hen harrier Western Isles 1 1 10 14 13 10 47
Common kestrel Border Region 1 1Common kestrel Central Region 1 1Common kestrel Fife 1 1Common kestrel Grampian 2 2Common kestrel Highland Region 4 7 4 5 20Common kestrel Lothian 1 1Common kestrel Strathclyde Region 1 1 2Common kestrel Tayside Region 3 3 5 12 6 8 31
Long-eared owl Border Region 1 1Long-eared owl Fife 1 1Long-eared owl Grampian 2 2Long-eared owl Highland Region 2 4 1 1 8 4 4 2 2 12
Merlin Border Region 2 5 1 8Merlin Dumfries & Galloway 1 1Merlin Grampian 1 1Merlin Highland Region 5 13 3 2 23Merlin Lothian 3 6 5 14 10 25 9 3 47
Osprey Grampian 1 1 2Osprey Highland Region 3 11 8 12 34Osprey Tayside Region 1 1 3 11 9 14 37
Peregrine falcon Border Region 1 1 2
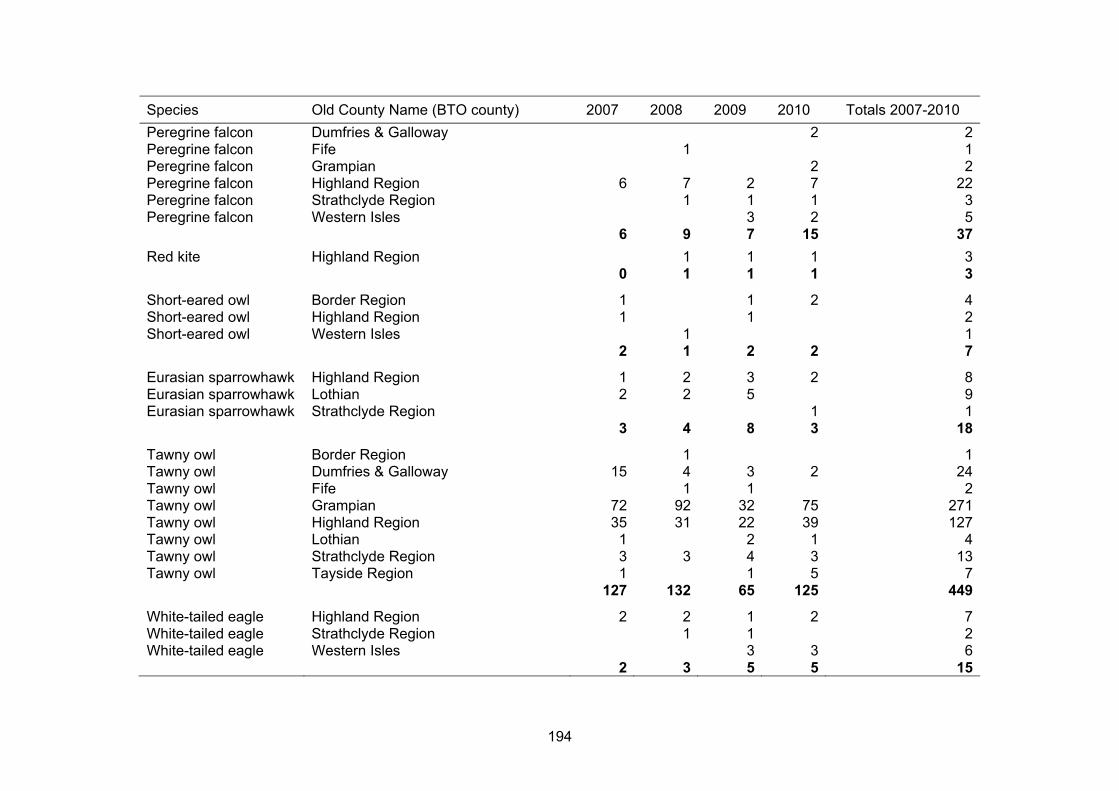
194
Species Old County Name (BTO county) 2007 2008 2009 2010 Totals 2007-2010
Peregrine falcon Dumfries & Galloway 2 2Peregrine falcon Fife 1 1Peregrine falcon Grampian 2 2Peregrine falcon Highland Region 6 7 2 7 22Peregrine falcon Strathclyde Region 1 1 1 3Peregrine falcon Western Isles 3 2 5 6 9 7 15 37
Red kite Highland Region 1 1 1 3 0 1 1 1 3
Short-eared owl Border Region 1 1 2 4Short-eared owl Highland Region 1 1 2Short-eared owl Western Isles 1 1 2 1 2 2 7
Eurasian sparrowhawk Highland Region 1 2 3 2 8Eurasian sparrowhawk Lothian 2 2 5 9Eurasian sparrowhawk Strathclyde Region 1 1 3 4 8 3 18
Tawny owl Border Region 1 1Tawny owl Dumfries & Galloway 15 4 3 2 24Tawny owl Fife 1 1 2Tawny owl Grampian 72 92 32 75 271Tawny owl Highland Region 35 31 22 39 127Tawny owl Lothian 1 2 1 4Tawny owl Strathclyde Region 3 3 4 3 13Tawny owl Tayside Region 1 1 5 7 127 132 65 125 449
White-tailed eagle Highland Region 2 2 1 2 7White-tailed eagle Strathclyde Region 1 1 2White-tailed eagle Western Isles 3 3 6 2 3 5 5 15

195
ANNEX C: AN EMPIRICAL TEST OF MONITORING EFFORT FOR GOLDEN EAGLES
From Fielding, A.H., Haworth, P.F. and Whitfield, D.R.A. 2002. ANALYTICAL FOUNDATION FOR CONSERVATION FRAMEWORK FOR THE GOLDEN EAGLE (Oct 31st 2002). CONTRACT NO: BAT/AC309/01/02/46 (Note this section is not in SNH report 193). C.1 Background The lack of any systematic national monitoring programme makes it very difficult to obtain precise, unbiased estimates of population parameters or to identify regional and temporal differences that can be attributed to particular processes. While it is unrealistic, and possibly unethical (because of the increased disturbance), to expect an annual national census, it is possible to determine the resources needed to achieve an accurate, precise and efficient monitoring programme. C.2 Method C.2.1 Data Comprehensive breeding data are available for >100 ranges from Argyll, Mull, Lochaber and Skye (Figure C1). The coverage is so good that they approximate to 20 consecutive annual censuses. Using these data different sampling strategies can be simulated and the results compared to the reality. In this way it should be possible to rank different strategies and determine the required sampling effort.
Figure C1. Mean number fledged per pair between 1982 and 1999 for 110 ranges in Argyll, Mull, Lochaber and Skye C.2.2 Sampling strategies In a simple random sampling approach each range should have an equal chance of being included in the sample. The probability that a range will be included should be 1/N where N is the number of ranges. Thus, each range should have a 1/673 chance of being included. Random sampling is easy to implement when the sampling frame is explicit, i.e. we have a list of ranges.
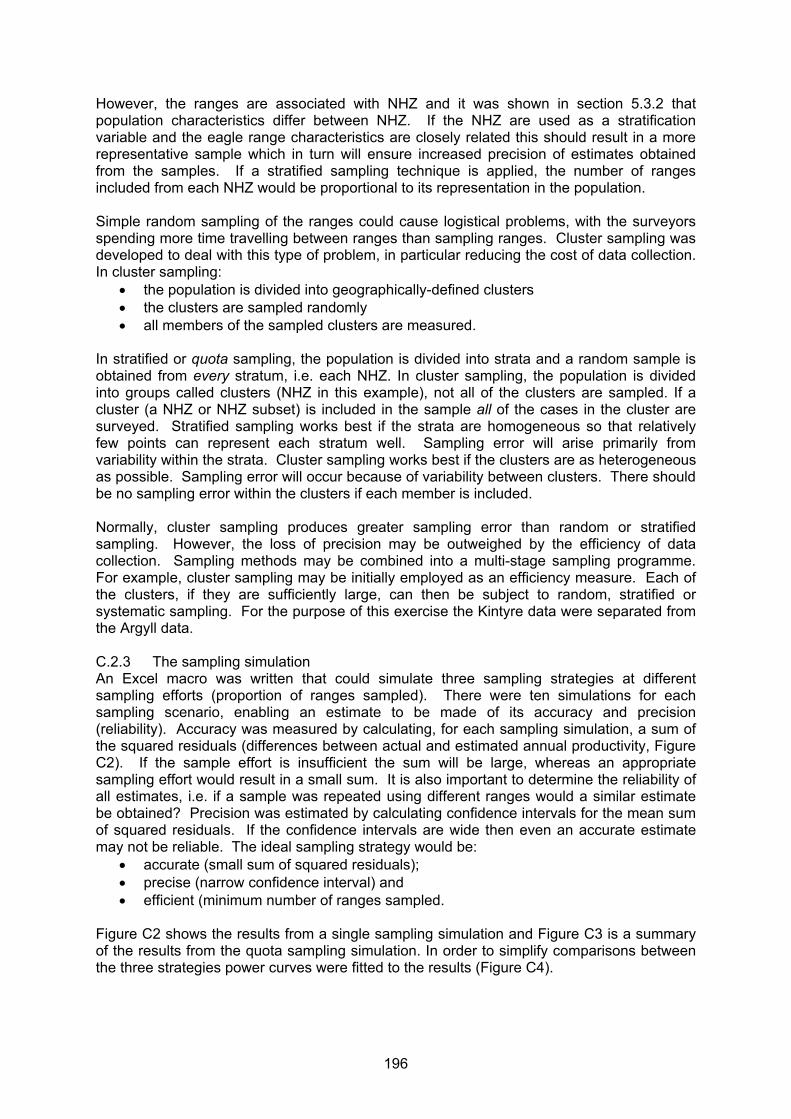
196
However, the ranges are associated with NHZ and it was shown in section 5.3.2 that population characteristics differ between NHZ. If the NHZ are used as a stratification variable and the eagle range characteristics are closely related this should result in a more representative sample which in turn will ensure increased precision of estimates obtained from the samples. If a stratified sampling technique is applied, the number of ranges included from each NHZ would be proportional to its representation in the population. Simple random sampling of the ranges could cause logistical problems, with the surveyors spending more time travelling between ranges than sampling ranges. Cluster sampling was developed to deal with this type of problem, in particular reducing the cost of data collection. In cluster sampling:
the population is divided into geographically-defined clusters the clusters are sampled randomly all members of the sampled clusters are measured.
In stratified or quota sampling, the population is divided into strata and a random sample is obtained from every stratum, i.e. each NHZ. In cluster sampling, the population is divided into groups called clusters (NHZ in this example), not all of the clusters are sampled. If a cluster (a NHZ or NHZ subset) is included in the sample all of the cases in the cluster are surveyed. Stratified sampling works best if the strata are homogeneous so that relatively few points can represent each stratum well. Sampling error will arise primarily from variability within the strata. Cluster sampling works best if the clusters are as heterogeneous as possible. Sampling error will occur because of variability between clusters. There should be no sampling error within the clusters if each member is included. Normally, cluster sampling produces greater sampling error than random or stratified sampling. However, the loss of precision may be outweighed by the efficiency of data collection. Sampling methods may be combined into a multi-stage sampling programme. For example, cluster sampling may be initially employed as an efficiency measure. Each of the clusters, if they are sufficiently large, can then be subject to random, stratified or systematic sampling. For the purpose of this exercise the Kintyre data were separated from the Argyll data. C.2.3 The sampling simulation An Excel macro was written that could simulate three sampling strategies at different sampling efforts (proportion of ranges sampled). There were ten simulations for each sampling scenario, enabling an estimate to be made of its accuracy and precision (reliability). Accuracy was measured by calculating, for each sampling simulation, a sum of the squared residuals (differences between actual and estimated annual productivity, Figure C2). If the sample effort is insufficient the sum will be large, whereas an appropriate sampling effort would result in a small sum. It is also important to determine the reliability of all estimates, i.e. if a sample was repeated using different ranges would a similar estimate be obtained? Precision was estimated by calculating confidence intervals for the mean sum of squared residuals. If the confidence intervals are wide then even an accurate estimate may not be reliable. The ideal sampling strategy would be:
accurate (small sum of squared residuals); precise (narrow confidence interval) and efficient (minimum number of ranges sampled.
Figure C2 shows the results from a single sampling simulation and Figure C3 is a summary of the results from the quota sampling simulation. In order to simplify comparisons between the three strategies power curves were fitted to the results (Figure C4).

197
Figure C2. Simple random sampling simulation results.
Figure C3. Results from the quota sampling simulation with fitted power curve
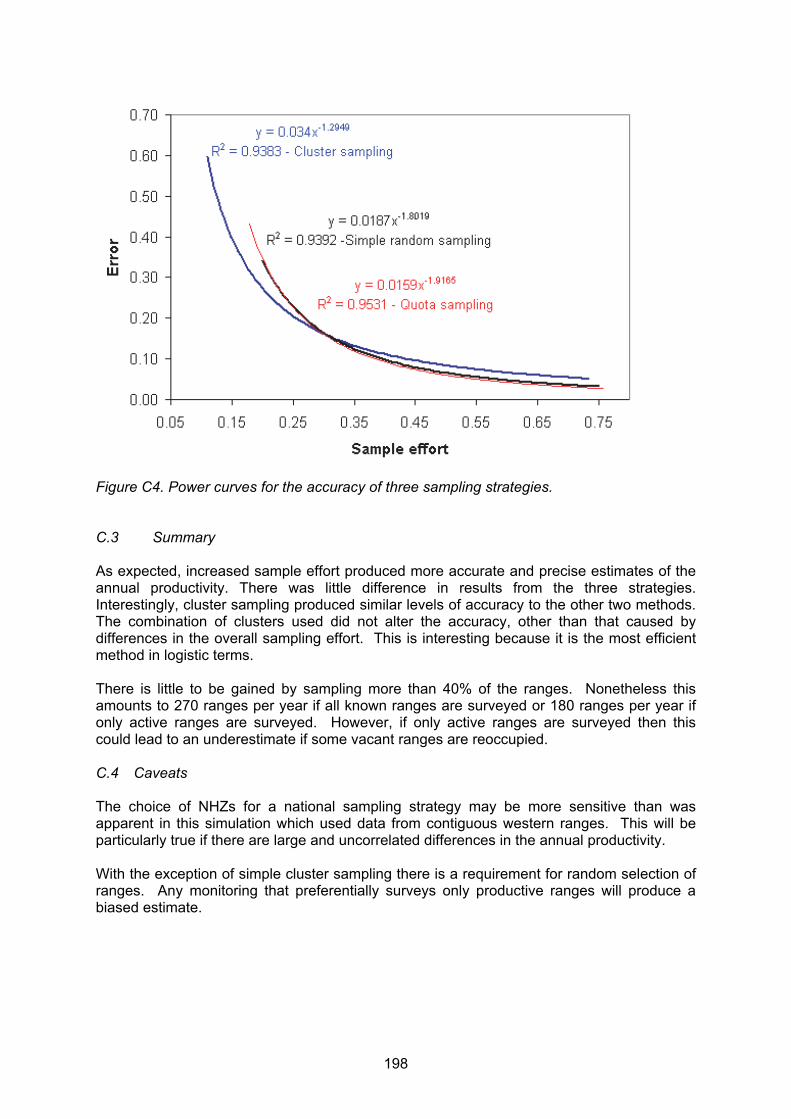
198
Figure C4. Power curves for the accuracy of three sampling strategies. C.3 Summary As expected, increased sample effort produced more accurate and precise estimates of the annual productivity. There was little difference in results from the three strategies. Interestingly, cluster sampling produced similar levels of accuracy to the other two methods. The combination of clusters used did not alter the accuracy, other than that caused by differences in the overall sampling effort. This is interesting because it is the most efficient method in logistic terms. There is little to be gained by sampling more than 40% of the ranges. Nonetheless this amounts to 270 ranges per year if all known ranges are surveyed or 180 ranges per year if only active ranges are surveyed. However, if only active ranges are surveyed then this could lead to an underestimate if some vacant ranges are reoccupied. C.4 Caveats The choice of NHZs for a national sampling strategy may be more sensitive than was apparent in this simulation which used data from contiguous western ranges. This will be particularly true if there are large and uncorrelated differences in the annual productivity. With the exception of simple cluster sampling there is a requirement for random selection of ranges. Any monitoring that preferentially surveys only productive ranges will produce a biased estimate.
199
ANNEX D: FURTHER BACKGROUND INFORMATION ON INDICATORS
D.1 Introduction to biological / environmental indicators A common definition of an indicator is as a surrogate for a parameter that is too ephemeral or too difficult technically, practically or too expensive, to measure directly (Landres et al. 1988, Hilty and Merenlender 2000, Lindenmeyer et al. 2000, Gregory et al. 2005). Good examples are lichens indicating air quality (McClenahen et al. 2007), plant species indicating soil moisture or soil fertility, or birds of prey populations reflecting pesticide contamination (Furness and Greenwood 1993). Such indicators are often used in research and wildlife management as diagnostic tools to gain specific knowledge about the environment. Currently, however, the terms indicator, indicator species, signal species, bio-indicator or bio-monitor, can have different meanings and functions, which can be confused (Caro & O'Doherty 1999, Hilty & Merenlender 2000, Landres et al. 1988, Lindenmayer et al. 2000, Gregory et al. 2005, 2007). A review by Simberloff (1998) found no consensus on what they are supposed to indicate. Leader-Williams and Dublin (2000) recognise two types of indicator: (i) one that reflects community composition, and (ii) one that reflects environmental change. A frequently used categorisation in a more legislative context is the DSR model, where indicators are described as driving force indicators (D), state indicators (S) or response indicators (R). Of these, state indicators, which measure the quality of the environment or ecosystem, are most relevant in the context of assessing the impact of a suite of ecological and environmental pressures on a particular species, group of species, or habitat. Driving force indicators are used to assess the pressures that might conceivably cause these effects, whilst response indicators are more process-oriented, for example reflecting the actions being taken by policy makers to respond to driving forces. Another distinction followed by some authors (e.g. Jones et al. 2009) is to categorise indicators as biological, ecological or environmental. Biological, or biodiversity, indicators capture the responses of a range of taxa and reflect components of biological diversity such as species richness, species diversity, and evenness. Ecological indicators consist of taxa or assemblages that are sensitive to identified environmental factors, that demonstrate the effects of those factors on biota, and whose responses reflect the responses of at least a subset of other taxa present. Environmental indicators respond in predictable ways to specific environmental disturbances, for example, the presence of dung beetle assemblages in savannahs (McGeoch, 1998). Many of the indicators used to assess the condition or quality of aquatic ecosystems (see Adams, 2002; Everard, 2008) fall into this category. Many biological indicators are based on ‘surrogate species’ selected to reflect different aspects of ecosystem structure, function or stress. These include ‘keystone species’ (Paine, 1969), ‘flagship species’ (Dayton, 1972), ‘core species’ and ‘satellite species’ (Hanski, 1982), ‘dominant species’ (Grime, 1984), ‘structural species’ (Huston, 1994), ‘ecosystem engineers’ (Jones et al., 1994) and ‘cultural keystone species’ (Garibaldi and Turner, 2004) and the relative value of predator or prey species as best indicators of ecosystem health (Sergio et al., 2008). The theory is that indicator species, through their distribution, presence, changing numbers, size, etc, provide us with a means to determine ecosystem health, since their life cycles, habitat, and responses to a variety of conditions have already been intensively studied and are well known. Caro and O'Doherty (1999) review the relevance of many of these surrogate species to different ecological problems.
200
The plethora of definitions aside, indicators have assumed significance in conservation and land-use management as they synthesise simplified and useful information from complex systems, often integrating multiple sources of data (Jackson et al. 2000). They help to guide decision-making as well as monitoring and evaluation, but despite their increasing influence in management and policy-making at all scales, the lack of formal criteria often applied to the selection of ecological indicators potentially compromises their utility as analytical tools (Niemeijer and de Groot, 2007). Birds are widely seen as appropriate for use in indicators of the quality of different environments based on a number of factors including their conspicuousness, mobility across landscapes and hence rapid response to pressures, place near the top of food chains, diversity of species, appeal to the public, availability of data and potential loyalty to specific habitat types (Gregory et al., 2004; Gregory et al., 2005). D.2 Bird indicators already in use in the UK In the UK, the idea of developing a wildlife indicator came from an expert group set up by the Department of Environment, Food and Rural Affairs (Defra) to review suitable indicators to underpin the 1999 UK Sustainable Development Strategy (Gregory et al. 2004). This group identified a number of wildlife indicators reflecting traditional conservation issues, such as the number and condition of special sites, the number and status of priority species and habitats, and so forth. A key gap, however, was the lack of broader indicators reflecting the general health of common and widespread wildlife in the countryside. Although initial discussions focussed on target-based indicators (Bibby et al. 1999), the Royal Society for the Protection of Birds (RSPB), the British Trust for Ornithology (BTO) and Defra developed the idea to create a state indicator: one that reflected the broad state of nature without requiring targets for individual species. Birds were chosen because they are regarded as good general indicators of the state of wildlife; they were wide-ranging in habitat use and tend to be at, or near, the top of the food chain; there is good trend information available from the early 1960s; and they have great public resonance, and hence were judged to be an excellent way to raise awareness for biodiversity issues. These indicators, first adopted by the UK in 1999 and subsequently by the devolved governments (e.g. Scotland), are comprised of population trends of bird species aggregated according to their associations with broad habitats such as farmland, woodland and uplands. Methods are described in Gregory et al. (2003). Data for constituent species are analysed, usually in a GLM modelling framework, to provide annual parameter estimates of abundance. Values for missing years are estimated by interpolation and values for years outside the period covered by the survey are estimated by extrapolation, using pre-defined rules to maintain sufficient robustness. The annual indices for each species are then standardised to a common start year, and the annual indicator values are determined from the geometric mean of the constituent species values. Geometric means are used so that an index change from 100 to 200 (a doubling) is equivalent, but opposite to, an index change from 100 to 50 (a halving). Arguably, one of the weaknesses of the current indicators in terms of biodiversity as a whole is that the rare and scarce species are underrepresented. In the wild bird indicators developed in the UK and Europe, rare species are excluded because: (i) they are found in relatively few locations and hence do not represent broader biodiversity; and/or (ii) their population status is likely to be more strongly influenced by dedicated conservation action rather than the drivers affecting all species (Gregory et al. 2003). Currently, the UK Biodiversity Indicators exclude all species with a national population of fewer than 500 pairs, and species with fewer than 300 pairs are excluded from the England Biodiversity Strategy and Scottish Terrestrial bird indicators. These thresholds for excluding species are clearly arbitrary, and when developing bird indicators for the scarcer habitats, it might be appropriate to include rare but characteristic species of these habitats such as great bittern and Eurasian marsh harrier for reed beds in England. However, it does mean that the

201
current wild bird indicator misses an important component of biodiversity, emphasising the need for complementary measures that focus on rare species (e.g. van Strien 1999, Butchart et al. 2004, 2007). In fact, a rare bird indicator developed by Gregory et al. (2003) showed populations to have more than doubled in the UK in the last thirty years, reflecting considerable investment of time and money in proactive and largely successful conservation initiatives. It would therefore be misleading to assume that rare bird populations are representative of the countryside in general. In summary, wild bird indicators composed of the trends of species associated with key British landscapes (such as farmland and woodland) are reported annually by the UK government and have raised public awareness about the conservation problems which many of these species face, in particular as a result of agricultural change. Another key pattern that has emerged is the difference between increases among the generalist species and declines in the specialists in a process called biotic homogenisation. D.3 Other methodological considerations A range of methods have been used to date to produce biological indicators. Most wild bird indicators currently produced in the UK are composite indicators constructed from national or regional population trends in bird numbers. One of the benefits of this approach is that diverse data sources and census methodologies among species can be easily accommodated. The approach can be modified however, to produce indicators designed for particular threats or ecological niches. For Terrestrial Breeding Birds in the Scottish Biodiversity Indicator set, separate habitat-specific trends are generated and used for species that occupy more than one habitat (e.g. song thrushes Turdus philomelos in woodland versus those on farmland). In the UK, this approach was taken further in a comparison of habitat-specific indicators constructed solely from habitat-specific trends with standard composite indicators. In Scotland, a Wintering Waterbird Indicator has been developed to allow for habitat and regional biases in data collection (Austin et al. 2007), as well as a novel ‘conservation performance indicator’ to assess the relative contribution of a focal region in terms of national or international biodiversity. Other potential approaches to indicator development trialled by the BTO have included those based on land designations (e.g. national parks or designated sites), woodland type (broadleaved versus coniferous woodland), or ecological groupings such as residents versus migrants (see Noble et al. 2007). It is also possible to construct more sophisticated indicators of impact by weighting the constituent species trends by the strength of the relationship (positive or negative) to particular drivers, as for climate change indicators used in Europe and being developed in the UK. Lastly, where appropriate, the method of combining constituent species trends can be dropped in favour of constructing indicators directly from aggregated data across species within ecological groupings. The manner in which composite indicators are constructed is open to modification. The population trends for Defra’s farmland and woodland birds composite indicators reflect the average behaviour of their constituent species, all of which are weighted equally (Gregory et al. 2004). Weighting by population size or conservation status would have led the indicator into being dominated by the most abundant species or by those judged to be the most threatened. Indicators of wintering waterbirds developed for the Scottish Biodiversity Strategy, for example, include a provisional version based on ‘conservation value’ as measured by the proportion of the flyway population (Austin et al. 2007), but these have not yet been adopted. Other possible criteria for weighting include level of precision and degree of habitat specialisation. However, given that many of these criteria could change over the time series, neutral weighting appears to best serve the purpose of a general ‘barometer’ of broad-scale change in the countryside.
202
Another possibility is a return to ideas based on an approach of combining data series reflecting ‘distance to target’ for key species and habitats (Bibby 1999). One of the advantages of the distance to target approach is that it allows data on different taxa to be combined with data on the condition of different habitats. Another advantage is that it is possible to set targets for both increase and decrease (for example for when we judge populations are too large), or for pest species, which may even benefit from modifications in the landscape (McKinney & Lockwood 1999). The disadvantages include the need to define targets, which are problematical both on theoretical and practical grounds, and the need for high quality trend data for a range of species and habitats. Underhill and Crawford (2005) successfully used a target-based approach to index environmental health for breeding seabirds in the Benguela ecosystem. Similarly, van Strien (1999) and Ten Brink (2000) described an Ecological Capital Index that combined information on the quality and quantity of a habitat in a single statistic. Rare and common species were included and their current densities were contrasted with a reference situation in the past, which is equivalent to the distance to target indices above. Two of the practical issues with this index were the choice of the reference period, which must to some degree to be a subjective judgement, and the selection of the habitat-specific species.

www.snh.gov.uk© Scottish Natural Heritage 2015 ISBN: 978-1-85397-911-8
Policy and Advice Directorate, Great Glen House,Leachkin Road, Inverness IV3 8NWT: 01463 725000
You can download a copy of this publication from the SNH website.