snh commissioned report 479: the use of camera … for future monitoring efforts of the scottish...
TRANSCRIPT
Scottish Natural HeritageCommissioned Report No. 479
The use of camera trapping as a method to survey for the Scottish wildcat
i
C O M M I S S I O N E D R E P O R T
Commissioned Report No. 479
The use of camera trapping as a method to survey for the Scottish wildcat
For further information on this report please contact:
Jenny Bryce Scottish Natural Heritage Great Glen House INVERNESS IV3 8NW Telephone: 01463-725000 E-mail: [email protected]
This report should be quoted as:
Kilshaw, K. & Macdonald, D.W. (2011). The use of camera trapping as a method to survey for the Scottish wildcat. Scottish Natural Heritage Commissioned Report No. 479.
This report, or any part of it, should not be reproduced without the permission of Scottish Natural Heritage.
This permission will not be withheld unreasonably. The views expressed by the author(s) of this report
should not be taken as the views and policies of Scottish Natural Heritage.
© Scottish Natural Heritage 2011.

ii
The use of camera trapping as a method to survey for the Scottish wildcat
Commissioned Report No. 479 (iBids No. 479) Contractor: Kerry Kilshaw and David Macdonald Year of publication: 2011 SUMMARY The Scottish wildcat, Felis silvestris grampia, is currently endangered by a variety of factors including hybridisation with and disease transmission from the feral cat, F. catus, habitat loss and fragmentation, and persecution (e.g. Macdonald et al., 2004). To assess the status of the population, the Scottish wildcat needs rigorous monitoring of population densities and demographic trends. Most surveys to date have used road traffic accident surveys, live trapping and/or questionnaires and interviews to collect data. The aim of this project was to determine whether camera trapping could be an effective method for future monitoring efforts of the Scottish wildcat. Main findings Camera trapping did capture “wild-living” cats in an area where they were known to occur based on
previous sightings
A total of 13 individual “wild-living” cats were captured; 4 wildcats and 9 hybrids. Individuals could be identified by their pelage markings
No feral cats were caught on camera
No cat carcasses were found on roads surrounding and bisecting the study area during the trapping period
No “wild-living” cats were seen by the keepers on the estate during the trapping period
The use of bait did result in increased capture rates
The use of Valerian lure did not result in increased capture rates and the development or identification of a suitable scent lure should be pursued
The study indicated that some changes should be made to the camera trapping method in order to increase the capture success; these are to reduce the space between camera trap stations to ≤ 1km, use of bait to attract cats to the cameras and increase the survey length to 2 months or 60 days.
Density estimates could be obtained using the data collected and these estimates were comparable to those from other studies indicating that camera trapping could be a useful tool for monitoring of the Scottish wildcat.
COMMISSIONED REPORT
Summary

iii
For further information on this project contact: Jenny Bryce
Tel: 01463 725249 For further information on the SNH Research & Technical Support Programme contact:
DSU (Policy & Advice Directorate), Scottish Natural Heritage, Great Glen House, Inverness, IV3 8NW. Tel: 01463 725000 or research @snh.gov.uk

iv
1. INTRODUCTION ................................................................................................................................................... 1
2. AIMS AND OBJECTIVES ..................................................................................................................................... 2
3. METHODOLOGY .................................................................................................................................................. 3
3.1. Study area ...................................................................................................................................................... 3
3.2. Camera trapping............................................................................................................................................. 4
3.3. Camera trap surveys...................................................................................................................................... 5
3.4. Wildcat identification....................................................................................................................................... 6
3.5. Road Traffic Accident Surveys....................................................................................................................... 9
4. DATA ANALYSIS................................................................................................................................................. 9
4.1. Trap nights (TN) ............................................................................................................................................. 9
4.2. Capture events ............................................................................................................................................... 9
4.3. Capture frequency.......................................................................................................................................... 9
4.4. Capture probability and abundance estimate: Programme CAPTURE ......................................................... 9
4.5. Density estimates ......................................................................................................................................... 10 4.5.1. CAPTURE............................................................................................................................................. 10 4.5.2. SPACECAP .......................................................................................................................................... 11
5. RESULTS ............................................................................................................................................................ 14
5.1. Survey 1: Camera trapping without bait ....................................................................................................... 15
5.2. Survey 2: Camera trapping with bait ............................................................................................................ 15
* neck stripes that couldn’t been seen clearly were given a more conservative score....................................... 18
5.3. Capture probability and abundance estimate: Programme CAPTURE ....................................................... 19
5.4. Density estimates ......................................................................................................................................... 22
5.4.2. SPACECAP............................................................................................................................................... 22
6. DISCUSSION AND RECOMMENDATIONS....................................................................................................... 23
6.1. Number of camera traps, camera station layout and survey length ............................................................ 23
6.2. Use of bait/lure ............................................................................................................................................. 24
6.3. Abundance and Density Estimates .............................................................................................................. 25
6.4. Layout and height of camera traps............................................................................................................... 26
6.5. Battery duration and checking the camera traps ......................................................................................... 26
7. ACKNOWLEDGEMENTS ................................................................................................................................... 27
8. REFERENCES .................................................................................................................................................... 28
9. APPENDIX 1: Height of camera traps and distance from each other, bait or lure...................................... 32
1
1. INTRODUCTION
The Scottish wildcat (Felis silvestris grampia, Miller 1907) is Britain’s only surviving native felid (Macdonald et al., 2004) and is currently classified as Least Concern (IUCN, 2011). Previously widespread across the UK, the Scottish wildcat is now thought to be limited to the north of Scotland (Balharry & Daniels, 1998; Davies et al., 2010) with a population estimate possibly as low as 400 individuals remaining (Macdonald et al., 2004). The decline of the wildcat has been attributed partially to habitat loss, in particular loss of forested areas, and partially to hunting for its fur and persecution (Kitchener, 1995). The development of sporting estates in Scotland from the mid-19th century increased the rate of decline (Langley & Yalden, 1977; Tapper 1992). The current threats are thought to be mainly hybridisation with and disease transfer from domestic/feral cats (F. catus L. 1758), habitat loss and human persecution (Hubbard et al., 1992; McOrist et al., 1991; Nowell & Jackson, 1996). As a species vulnerable to extinction, monitoring of numbers of Scottish wildcat is required with sufficient sensitivity in order to accurately detect changes and trends in populations. To date a combination of road traffic accident (RTA) surveys, live trapping and interviews and questionnaires have been used to collect data on “wild-living” cats in Scotland including wildcats and feral cats (Easterbee et al., 1991; Daniels, 1997; Balharry & Daniels, 1998; Davies et al., 2010). Although these methods can generate a variety of useful data, each has it limitations. For example, RTAs are thought to be biased towards hybrids and feral cats as domestic cats are likely to be concentrated near urban areas (A. Kitchener pers comm. 2008), and are therefore more likely to suffer a RTA than a wildcat (BTO, 1999). Live trapping is very time consuming and requires both licensing and experience and in general the information collected using questionnaires and interviews is dependent on how visible the cat was to the viewer at the time (Davis et al., 2010). Given the limitations of the existing methods, examining the potential use of other survey methodologies such as camera trapping is important as a means of assessing population trends and in assessing whether current estimates of the Scottish wildcat population (c.400) are accurate. Camera trapping has been widely used to monitor rare and elusive species such as carnivores, which are generally difficult to observe directly (e.g. Griffiths & Van Schaick, 1993; Jones & Raphael, 1993; Carbone et al., 2001; Karanth & Nichols, 1998). Camera trapping can provide detailed knowledge on several ecological components relating to the behavioural ecology of highly mobile cryptic species (Griffiths & Van Schaick, 1993; Jones & Raphael, 1993; Karanth & Nichols, 1998; Carbone et al., 2001; Karanth & Nichols, 2002). These include presence/absence data, spatial distribution, relative abundance and population-density estimates, habitat use in space and time, and, if individuals can be identified or marked, population-size estimates and home-range sizes can also be established. In recent years, studies on the European wildcat (F. s. silvestris), which is closely related to the Scottish wildcat (Yalden, 1982; Yamaguchi et al., 2004; Driscoll et al., 2007) have indicated that camera trapping can be used to some extent to determine the presence and abundance of this species and that individuals are identifiable based on their morphology (Monterroso et al., 2006; Anile et al., 2007). It was therefore expected that individual identification of Scottish wildcats would also be possible using camera trap methodology and hence abundance and density estimates could be obtained.

2
2. AIMS AND OBJECTIVES
The aim of the pilot study was to determine whether camera trapping was a feasible method for monitoring the Scottish wildcat and to establish the most appropriate camera trapping protocol for future surveys. The following questions were examined:
1) Can camera trapping detect wildcats in areas where they are known to occur based on existing data such as sightings or RTA data?
2) Can individual wildcats be identified from the photographs?
3) Is the placement of the camera traps used here (e.g. height and distance from one another)
suitable to produce clear photographs of wildcats?
4) How many camera traps are needed and what size survey area is most appropriate in order to collect enough data for mark-recapture analysis?
5) Does baiting or the use of scent lures increase capture probabilities?
6) How long should the camera trapping survey be carried out for?
7) Can camera trapping be used to provide density estimates?
8) How often should the camera traps be visited for routine maintenance?
3
3. METHODOLOGY
3.1. Study area
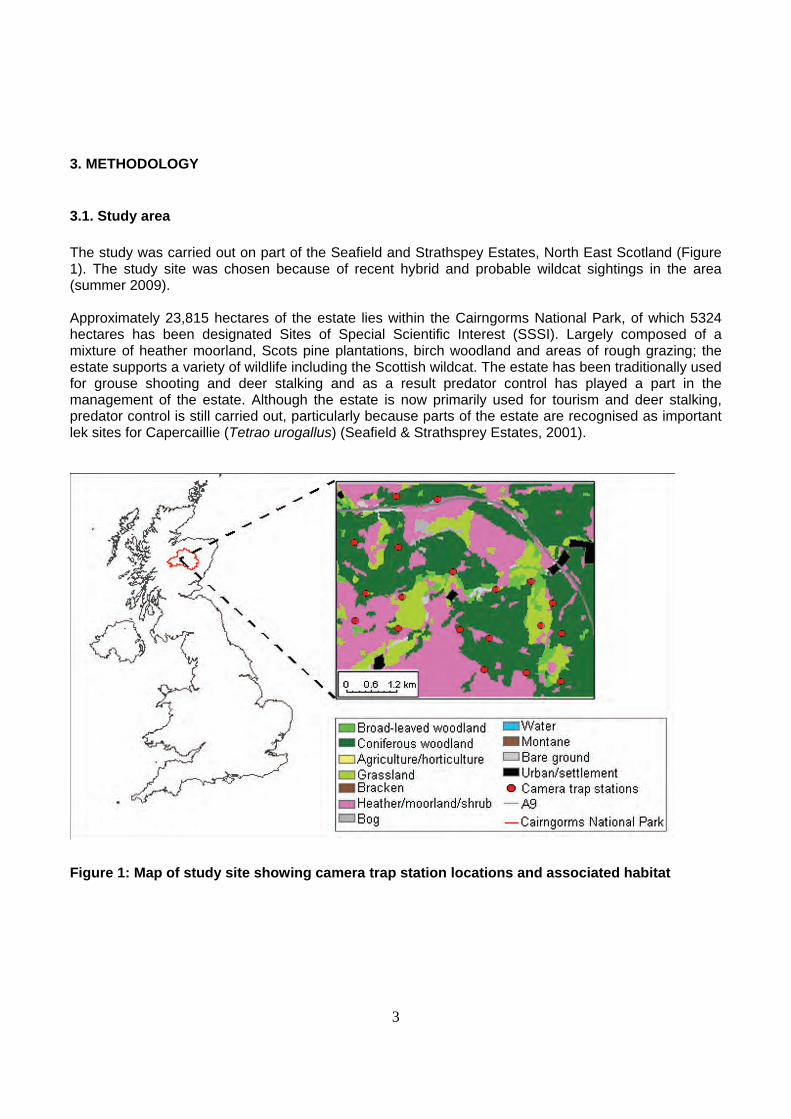
The study was carried out on part of the Seafield and Strathspey Estates, North East Scotland (Figure 1). The study site was chosen because of recent hybrid and probable wildcat sightings in the area (summer 2009). Approximately 23,815 hectares of the estate lies within the Cairngorms National Park, of which 5324 hectares has been designated Sites of Special Scientific Interest (SSSI). Largely composed of a mixture of heather moorland, Scots pine plantations, birch woodland and areas of rough grazing; the estate supports a variety of wildlife including the Scottish wildcat. The estate has been traditionally used for grouse shooting and deer stalking and as a result predator control has played a part in the management of the estate. Although the estate is now primarily used for tourism and deer stalking, predator control is still carried out, particularly because parts of the estate are recognised as important lek sites for Capercaillie (Tetrao urogallus) (Seafield & Strathsprey Estates, 2001).
Figure 1: Map of study site showing camera trap station locations and associated habitat

4
3.2. Camera trapping
Camera trapping was carried out using Cuddeback ® Capture 3.0 megapixel camera traps. These digital cameras use detectors to measure motion and changes in temperature within a detection zone of 422 ft2. When an animal passes in front of the camera, the sensors detect the movement and increase in temperature and are triggered to take a photograph. Although this model has a relatively narrow detection band compared to other camera traps, it was chosen because it uses an incandescent flash rather than an infra-red flash which results in better quality and colour photographs at night. The benefits of this are that it should make identification of individual wildcats easier, although there is a chance that the flash would scare some animals away from the camera trap and use of a flash also increases the risk of the camera being detected and tampered with. Because this study aimed to determine whether camera trapping was a feasible method for monitoring the Scottish wildcat, it was carried out on an estate where “wild-living” cats had recently been seen and were known to be regularly present (Estate manager, pers comm. 2009). The first camera trap station was located at a site where a cat with wildcat type pelage had recently been live trapped and released as part of standard feral cat control practices on the estate (see Kitchener et al., 2005 for pelage details). From this location, a potential trapping grid was marked out on a map but actual camera trap locations were chosen in the field. The grid was arranged in such a manner that individuals with the smallest recorded home range had a >0 probability of capture. Radio tracking studies have shown that a female wildcat has the smallest recorded home range of 1.72-1.75 km2 (Corbett, 1969; Daniels, 1997). Camera-trap stations were therefore located at a distance of ≤1.5 km apart (diameter of a circle with an area of 1.72-1.75 km2) in order to maximise the probability of capture for all of the individuals in the surveyed area. At each potential station point, an area of approximately 0.25 km2 around each point was surveyed for wildcat signs, these included foot prints, scats, den sites and scrape marks. If no cat signs were seen then stations were located in areas where there was either signs of pine marten, Martes martes (a species with very similar habitat and prey requirements to the Scottish wildcat: Balharry, 1993; Birks et al., 2005) or where there was high evidence of rabbit or hare presence (e.g. burrows, actual sightings or latrine sites). The camera station location should act as a funnel such that if the target species is nearby it will naturally walk past the camera traps because there are no obvious other routes. Animal trails were therefore used preferentially as these were already being used by one species or another, and if more than one route was present, these were blocked with vegetation or branches to ensure that the path past the camera traps offered the least resistance. Two camera traps were situated at each trap station in order to avoid violating the capture-recapture assumptions in the event that one of the camera traps fails (e.g. Silver, 2004). Camera traps were placed between 2.1-10.8m apart (see Appendix 1) and were initially facing each other (but slightly staggered so the flash would not interfere with the photos from the opposite camera) to ensure both sides of the wildcat were photographed for later identification purposes. For the surveys using bait or lure, some of the camera traps were angled or moved slightly so that they were facing the bait or lure rather than each other (Figure 2). Camera traps were attached to a suitable tree or fence post at a height of 20cm – 150cm above ground level in order to determine the best angle for photographing the pelage characteristics needed for identification. Location of each camera trap was checked by crawling or moving in front of the camera to take a photo and examining the photo on site using a Cuddeback viewer. Each camera trap was secured by a wire chain and padlock to reduce theft and labelled to indicate it was being used for a wildcat survey to minimise disturbance.
5
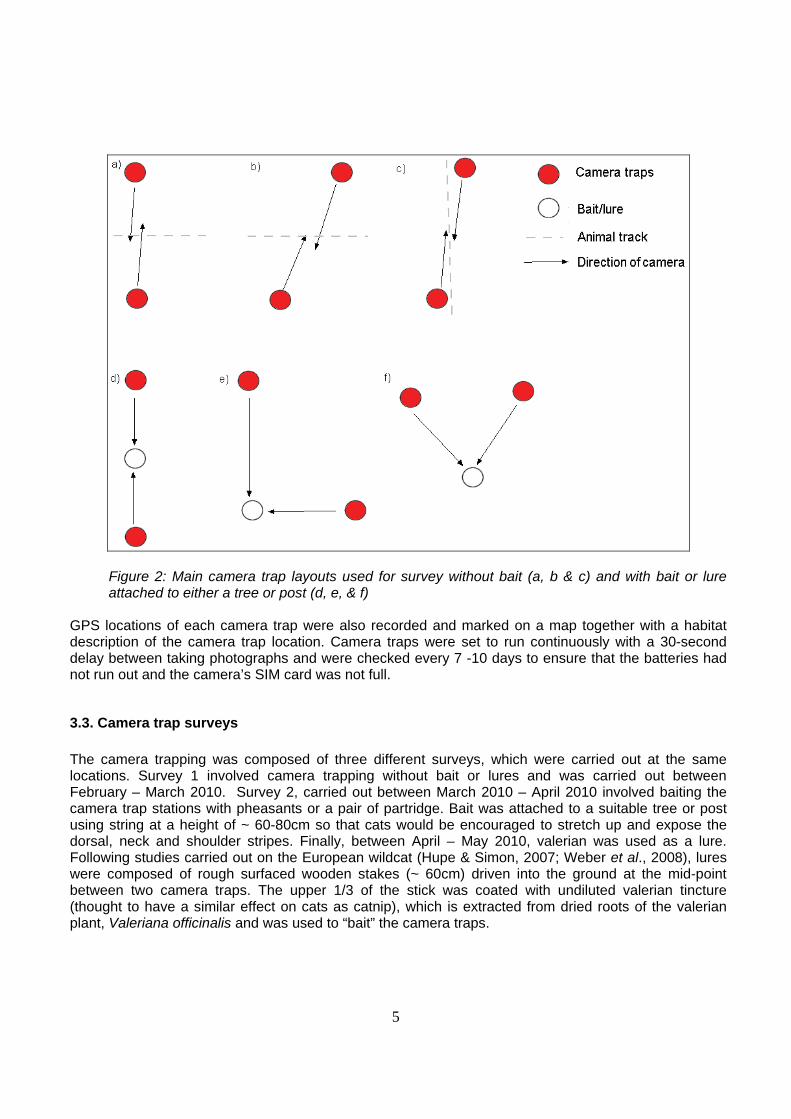
Figure 2: Main camera trap layouts used for survey without bait (a, b & c) and with bait or lure attached to either a tree or post (d, e, & f)
GPS locations of each camera trap were also recorded and marked on a map together with a habitat description of the camera trap location. Camera traps were set to run continuously with a 30-second delay between taking photographs and were checked every 7 -10 days to ensure that the batteries had not run out and the camera’s SIM card was not full.
3.3. Camera trap surveys
The camera trapping was composed of three different surveys, which were carried out at the same locations. Survey 1 involved camera trapping without bait or lures and was carried out between February – March 2010. Survey 2, carried out between March 2010 – April 2010 involved baiting the camera trap stations with pheasants or a pair of partridge. Bait was attached to a suitable tree or post using string at a height of ~ 60-80cm so that cats would be encouraged to stretch up and expose the dorsal, neck and shoulder stripes. Finally, between April – May 2010, valerian was used as a lure. Following studies carried out on the European wildcat (Hupe & Simon, 2007; Weber et al., 2008), lures were composed of rough surfaced wooden stakes (~ 60cm) driven into the ground at the mid-point between two camera traps. The upper 1/3 of the stick was coated with undiluted valerian tincture (thought to have a similar effect on cats as catnip), which is extracted from dried roots of the valerian plant, Valeriana officinalis and was used to “bait” the camera traps.
6
3.4. Wildcat identification
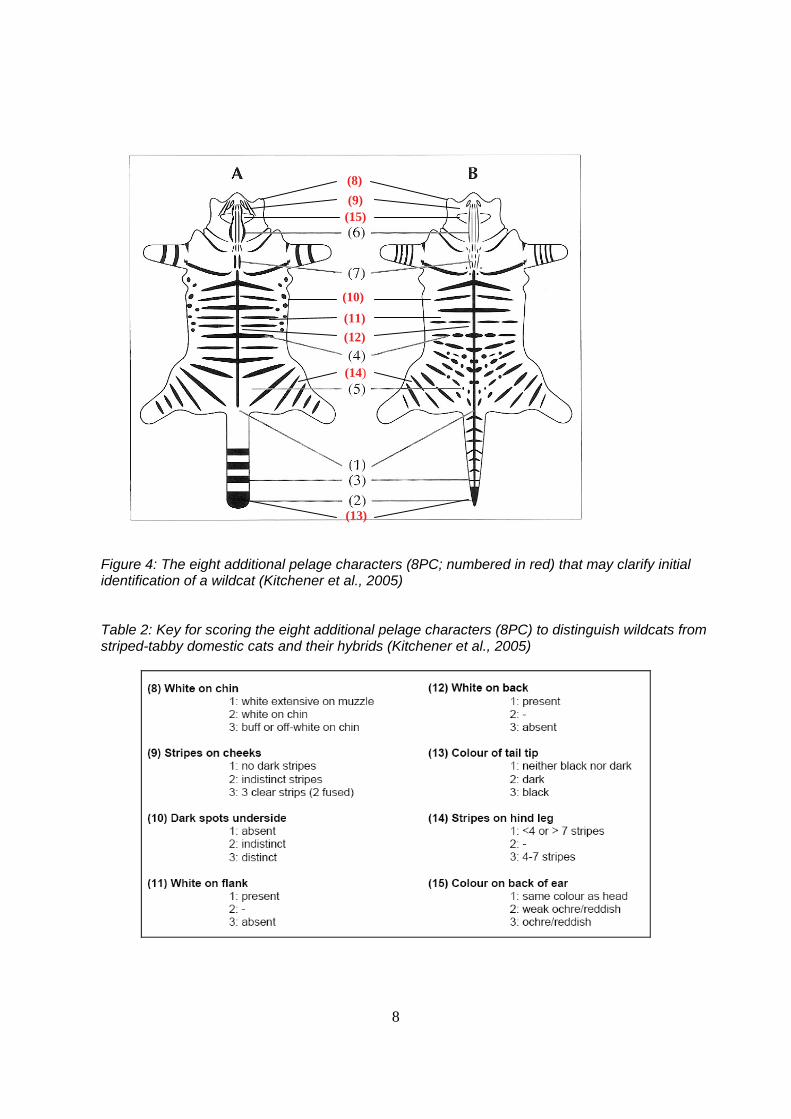
In Scotland, the Scottish wildcat is thought to have experienced a high level of hybridisation which has in the past made it difficult to accurately identify individuals in the field (Hubbard et al., 1992, Beaumont et al., 2001). Recently, Kitchener et al., (2005) developed a pelage scoring system that defined the Scottish wildcat based on 7 different pelage markings which are used to give individuals a Seven Pelage Score (7PS) (Table 1; Figure 3). Kitchener et al., (2005) suggested that any cat with a total score of 19 or more for the 7PS and with no scores of 1 should be regarded as a wildcat unless other data conflict with this. However, this definition could exclude many cats that may have a high proportion of wildcat genes that may usefully contribute to the restoration of the wildcat (Kitchener et al., 2005). Therefore, a more relaxed definition was also proposed whereby any cat that has a minimum 7PS of 14 and does not have a score of 1 for any of the seven pelage characteristics or for an additional eight pelage characters (white on chin, stripes on cheek, dark spots on underside, white on flank, white on back, colour of tail tip, stripes on hind leg and colour of the back of the ear) (Table 2; Figure 4) could be considered a wildcat (Kitchener et al., 2005). These additional eight pelage characters are classified as 8PC hereafter. These pelage markings were used to give each cat a 7PS score as much as the photo enabled, in order to classify each individual as either wildcat, hybrid or feral cat based on the following criteria. Scores were also given for the 8PC to confirm the initial identification. Both the 7PS and 8PC were given a score of 1 = domestic; 2 = intermediate (hybrid); 3 = wildcat. Where the character could not be determined from the photograph, it was scored as unknown (U/K). Based on the pelage scores each cat was classified as “wildcat”, “hybrid” or “domestic” using the following definitions; a strict definition (Strict ID), and a more relaxed definition (Relaxed ID), described above as follows: Strict ID
1. Wildcat = 7PS score of 19 or more, no scores of 1 for any of the 7PS characters and no scores of 1 for any of the 8PC.
2. Hybrid = scores 3 for one or more of the 7PS characters, but may also score 1 for one or more
of these characters and may score 1 for one or more of the 8PC.
3. Domestic = no scores of 3 for any of the 7PS characteristics and scores of 1 or 2 in the other
characteristics.
Relaxed ID
Wildcat = 7PS score of 14 or more with no scores of 1 for any of the 7PS characters and no scores of 1 for any of the 8PC.
The scoring system used here means that under the Strict ID, no individuals identified as wildcats will display any domestic cat traits and no domestic cats will display any wildcat traits. Under the Relaxed ID, wildcats will still have no domestic cat characteristics but may have some hybrid traits.

7
Figure 3: A comparison of the seven key pelage characters (7PS) that distinguish a striped-tabby
domestic cat (B) from a Scottish wildcat (A) (Adapted from Kitchener et al., 2005 in Macdonald
et al., 2004)
Table 1: Key to the seven pelage characteristics (7PS) (Adapted from Kitchener et al., 2005 in Macdonald et al., 2004)
8
Figure 4: The eight additional pelage characters (8PC; numbered in red) that may clarify initial identification of a wildcat (Kitchener et al., 2005) Table 2: Key for scoring the eight additional pelage characters (8PC) to distinguish wildcats from striped-tabby domestic cats and their hybrids (Kitchener et al., 2005)
(8)
(9)
(11)
(10)
(15)
(12)
(14)
(13)
9
3.5. Road Traffic Accident Surveys
Roads surrounding and bisecting the survey area were checked for cat carcasses every 10 – 14 days whilst the camera traps were being checked.
4. DATA ANALYSIS
Data from the camera traps were managed in the programme Camera Base (Copyright 2007 Mathias Tobler; http://www.atrium-biodiversity.org/tools/camerabase/). As well as many other features, Camera Base allows the user to manage multiple surveys in one database. Data were displayed in ArcGIS 9.3 and analysed using SPSS 16.0. Non-parametric tests were used where appropriate as data were not distributed normally (p <0.05; Kolmogorov-Smirnov).
4.1. Trap nights (TN)
Trap nights were calculated as the total number of days/nights or in this case, 24hr periods, that all camera trap stations were active for (see Table 8).
4.2. Capture events
A capture event was defined as the capture of an individual at a camera trap station within a 24hr period. If more than one photograph of the same individual was taken within the 24hr period, it was considered one capture event. If the specimen was not individually identifiable, or difficult to identify, and captured within a short time period (for this study an arbitrary 30-minute time gap was chosen), then this was assumed to be the same individual and it was not counted as a multiple capture event.
4.3. Capture frequency
Capture frequencies of wildcats, hybrids or feral cats were calculated as the total number of capture events/100 trap nights (Lynam, 2001). Because the capture frequency takes into account the number of trap nights each survey is carried out for, capture frequencies of wildcats from different surveys carried out over varying periods of time can still be compared.
4.4. Capture probability and abundance estimate: Programme CAPTURE
Capture probability and abundance were calculated using the programme CAPTURE (White et al., 1978; Rexstad & Burnham, 1991). CAPTURE carries out mark-recapture analysis, using closed or open population models, to estimate abundance from capture records. We used a closed-population model which assumes that the composition of the population remains constant for the duration of the study (Rexstad & Burnham, 1991). For reliable estimation of animal abundance using camera traps (see White et al., 1982; Pollock et al., 1990), we need to be able to assume that:
10
1. The population is closed so that N (total population) is constant. No immigration, emigration, deaths or births can occur during the survey period.
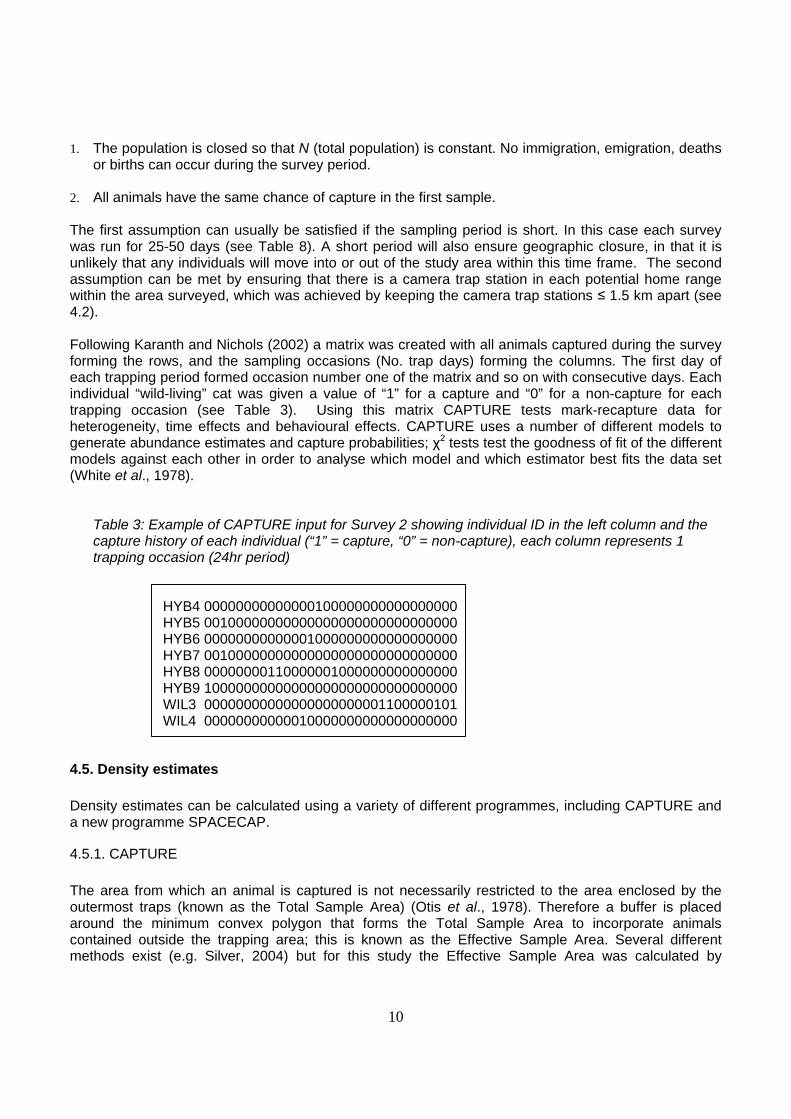
2. All animals have the same chance of capture in the first sample. The first assumption can usually be satisfied if the sampling period is short. In this case each survey was run for 25-50 days (see Table 8). A short period will also ensure geographic closure, in that it is unlikely that any individuals will move into or out of the study area within this time frame. The second assumption can be met by ensuring that there is a camera trap station in each potential home range within the area surveyed, which was achieved by keeping the camera trap stations ≤ 1.5 km apart (see 4.2). Following Karanth and Nichols (2002) a matrix was created with all animals captured during the survey forming the rows, and the sampling occasions (No. trap days) forming the columns. The first day of each trapping period formed occasion number one of the matrix and so on with consecutive days. Each individual “wild-living” cat was given a value of “1” for a capture and “0” for a non-capture for each trapping occasion (see Table 3). Using this matrix CAPTURE tests mark-recapture data for heterogeneity, time effects and behavioural effects. CAPTURE uses a number of different models to generate abundance estimates and capture probabilities; χ2 tests test the goodness of fit of the different models against each other in order to analyse which model and which estimator best fits the data set (White et al., 1978).
Table 3: Example of CAPTURE input for Survey 2 showing individual ID in the left column and the capture history of each individual (“1” = capture, “0” = non-capture), each column represents 1 trapping occasion (24hr period)
HYB4 00000000000000100000000000000000 HYB5 00100000000000000000000000000000 HYB6 00000000000001000000000000000000 HYB7 00100000000000000000000000000000 HYB8 00000000110000001000000000000000 HYB9 10000000000000000000000000000000 WIL3 00000000000000000000001100000101 WIL4 00000000000010000000000000000000
4.5. Density estimates
Density estimates can be calculated using a variety of different programmes, including CAPTURE and a new programme SPACECAP.
4.5.1. CAPTURE
The area from which an animal is captured is not necessarily restricted to the area enclosed by the outermost traps (known as the Total Sample Area) (Otis et al., 1978). Therefore a buffer is placed around the minimum convex polygon that forms the Total Sample Area to incorporate animals contained outside the trapping area; this is known as the Effective Sample Area. Several different methods exist (e.g. Silver, 2004) but for this study the Effective Sample Area was calculated by
11
introducing a buffer distance to the Total Sample Area equal to the half mean maximum distance (km) moved (½MMDM) by all individuals within the species (Karanth & Nichols, 2002). This merged area will provide a useful check on the validity of camera trap spacing as the mean maximum distance moved can also be considered to be a measure of the diameter of the home range (Karanth & Nichols, 2002). Density estimates can then be obtained by dividing the abundance estimates generated by the programme CAPTURE by the Effective Sample Area to generate an estimate of the number of individuals/100km2. Density estimates cannot effectively be calculated using CAPTURE data if the capture probability is <0.1 (Otis et al., 1978).
4.5.2. SPACECAP
SPACECAP (Singh et al., 2010) which was run from R 2.11.0 (The R Foundation for statistical computing © 2010), is a software package that has been designed specifically to estimate animal densities using closed capture-recapture models using photographic captures. Spatially explicit capture-recapture models implemented in SPACECAP directly estimate animal density by using the information on capture histories in combination with spatial locations of captures under a unified Bayesian modelling framework (Royle et al., 2009; Singh et al., 2010). SPACECAP has several advantages over camera trap analysis using traditional programmes such as CAPTURE: 1) it avoids the need to convert abundance estimates into density estimates using the effective sampling area or ½ MMDM approach which does not accurately represent the distance an individual may have moved and often results in violation of the closure assumption because individuals most likely move on and off the putative sampling area (Royle et al., 2009), 2) deals with problems posed by individual heterogeneity in capture probabilities in conventional capture-recapture analyses, 3) it also offers non-asymptotic inferences which are more appropriate for small samples of capture data typical of photo-capture studies. The hierarchical model used in SPACECAP recognizes that individual trap encounter histories are the outcome of two processes: distribution of individuals across the landscape and an encounter process that describes whether or not individuals are encountered by traps as a function of their location (Singh et al., 2010). SPACECAP can be run with a minimum number of 10-15 individuals and a minimum of 3-5 recaptures (A.Gopalaswamy pers comm. 2011). It should be noted that SPACECAP is a relatively new programme but is likely to be more accurate in estimating densities using camera trapping data than CAPTURE for the reasons described above. However, it currently takes a long time to run (>11hrs) per simulation, therefore the data was also analyzed in CAPTURE so that different simulations could be modelled quickly to examine what effect reducing the length of the survey time would have etc. The data for SPACECAP were prepared in 3 steps:
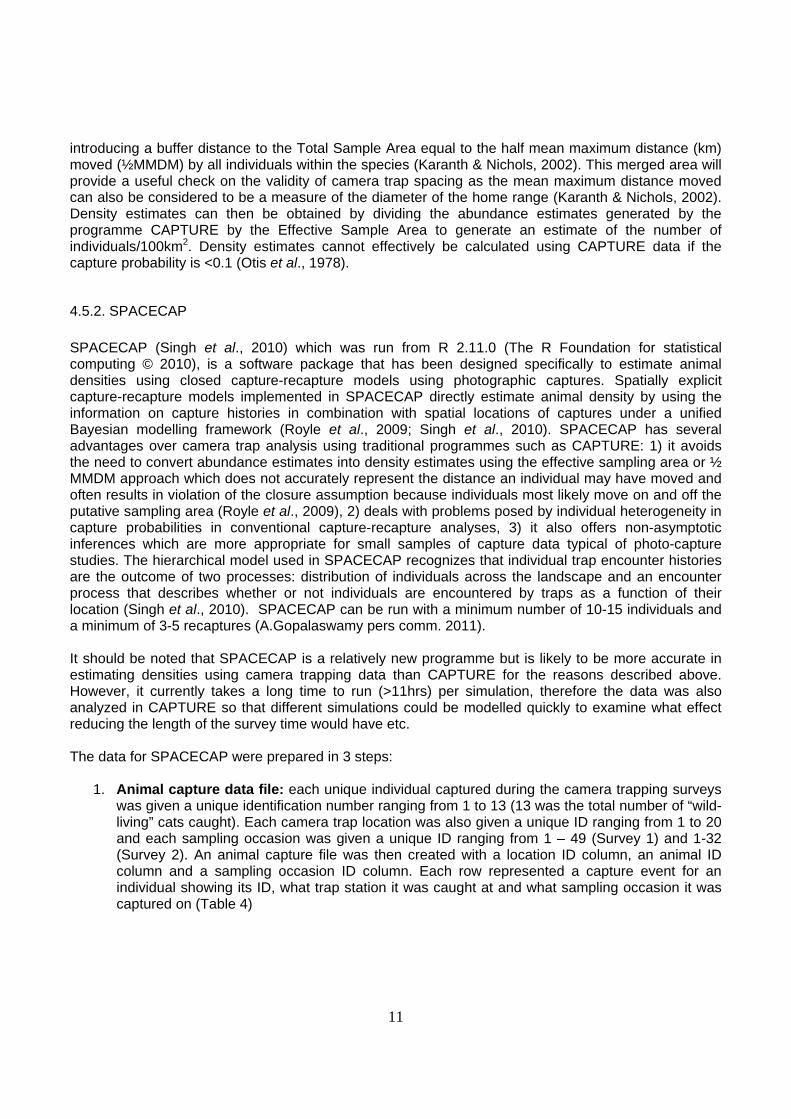
1. Animal capture data file: each unique individual captured during the camera trapping surveys was given a unique identification number ranging from 1 to 13 (13 was the total number of “wild-living” cats caught). Each camera trap location was also given a unique ID ranging from 1 to 20 and each sampling occasion was given a unique ID ranging from 1 – 49 (Survey 1) and 1-32 (Survey 2). An animal capture file was then created with a location ID column, an animal ID column and a sampling occasion ID column. Each row represented a capture event for an individual showing its ID, what trap station it was caught at and what sampling occasion it was captured on (Table 4)
12
Table 4: Example of an animal capture data file taken from Singh et al., (2010) showing the trap location (LOC_ID) and sampling occasion (SO) at which 6 different individuals (ANIMAL_ID) were caught
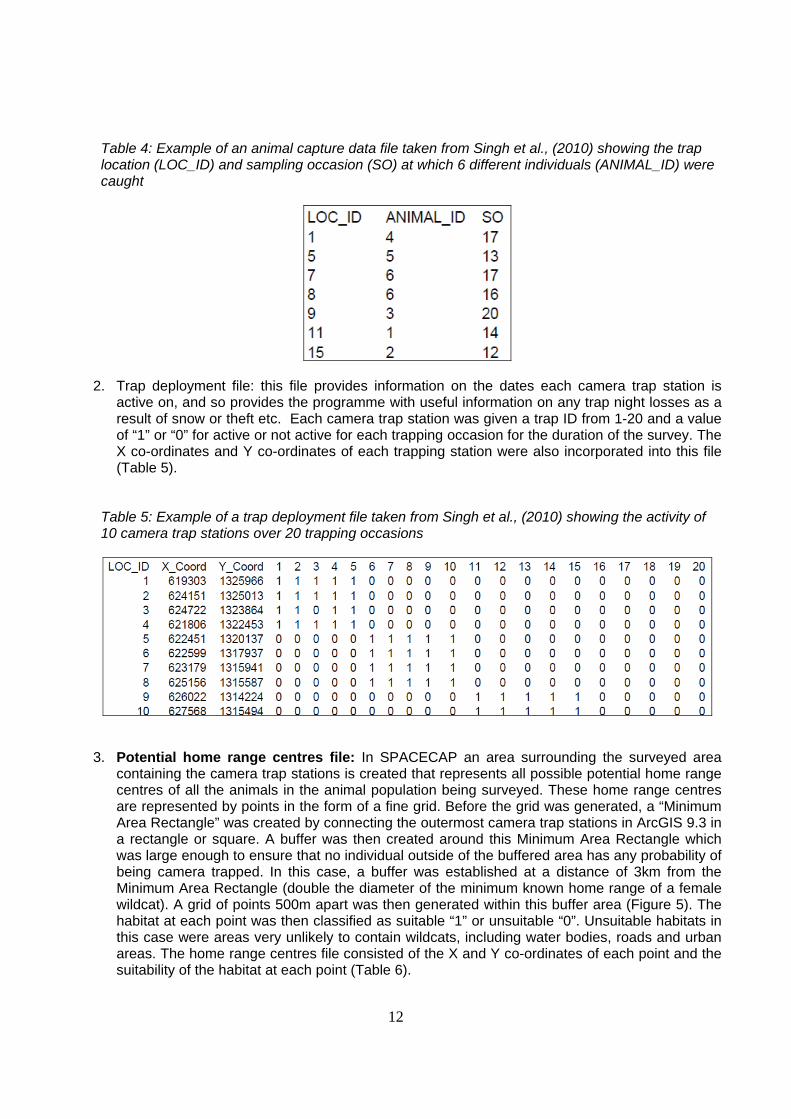
2. Trap deployment file: this file provides information on the dates each camera trap station is active on, and so provides the programme with useful information on any trap night losses as a result of snow or theft etc. Each camera trap station was given a trap ID from 1-20 and a value of “1” or “0” for active or not active for each trapping occasion for the duration of the survey. The X co-ordinates and Y co-ordinates of each trapping station were also incorporated into this file (Table 5).
Table 5: Example of a trap deployment file taken from Singh et al., (2010) showing the activity of 10 camera trap stations over 20 trapping occasions
3. Potential home range centres file: In SPACECAP an area surrounding the surveyed area containing the camera trap stations is created that represents all possible potential home range centres of all the animals in the animal population being surveyed. These home range centres are represented by points in the form of a fine grid. Before the grid was generated, a “Minimum Area Rectangle” was created by connecting the outermost camera trap stations in ArcGIS 9.3 in a rectangle or square. A buffer was then created around this Minimum Area Rectangle which was large enough to ensure that no individual outside of the buffered area has any probability of being camera trapped. In this case, a buffer was established at a distance of 3km from the Minimum Area Rectangle (double the diameter of the minimum known home range of a female wildcat). A grid of points 500m apart was then generated within this buffer area (Figure 5). The habitat at each point was then classified as suitable “1” or unsuitable “0”. Unsuitable habitats in this case were areas very unlikely to contain wildcats, including water bodies, roads and urban areas. The home range centres file consisted of the X and Y co-ordinates of each point and the suitability of the habitat at each point (Table 6).

13
Figure 5: Home range centres grid showing camera trap locations, with the Minimum Area Rectangle and associated buffer Table 6: example of a home range centre file taken from Singh et al. (2010) showing the activity of X and Y co-ordinates of each grid point and its habitat suitability
Once the three files had been collated, SPACECAP was run under the Spatial Capture-Recapture model with no trap response for 50000 iterations with a burn-in period of 1000. The thinning rate was set to the default value of 1 and the data augmentation value was set to 60 (approximately 5-6 times the total number of individuals captured). SPACECAP generates density estimates of individuals/100 km2.
14
5. RESULTS
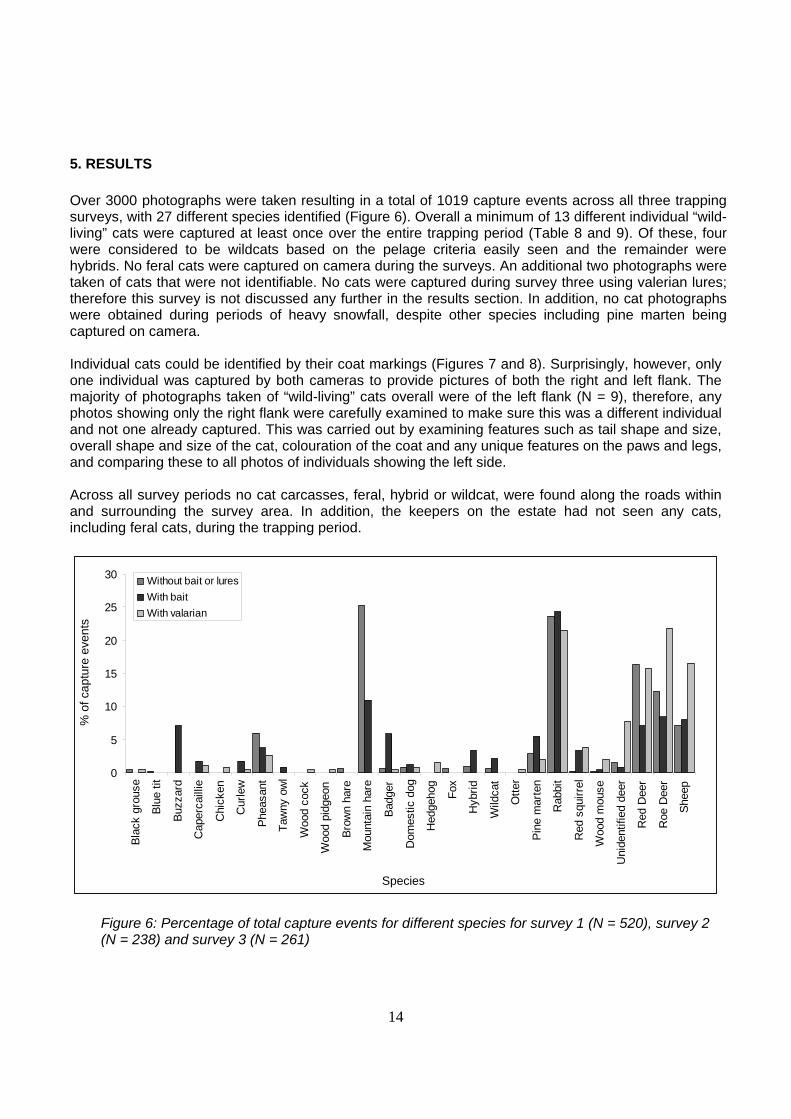
Over 3000 photographs were taken resulting in a total of 1019 capture events across all three trapping surveys, with 27 different species identified (Figure 6). Overall a minimum of 13 different individual “wild-living” cats were captured at least once over the entire trapping period (Table 8 and 9). Of these, four were considered to be wildcats based on the pelage criteria easily seen and the remainder were hybrids. No feral cats were captured on camera during the surveys. An additional two photographs were taken of cats that were not identifiable. No cats were captured during survey three using valerian lures; therefore this survey is not discussed any further in the results section. In addition, no cat photographs were obtained during periods of heavy snowfall, despite other species including pine marten being captured on camera. Individual cats could be identified by their coat markings (Figures 7 and 8). Surprisingly, however, only one individual was captured by both cameras to provide pictures of both the right and left flank. The majority of photographs taken of “wild-living” cats overall were of the left flank (N = 9), therefore, any photos showing only the right flank were carefully examined to make sure this was a different individual and not one already captured. This was carried out by examining features such as tail shape and size, overall shape and size of the cat, colouration of the coat and any unique features on the paws and legs, and comparing these to all photos of individuals showing the left side. Across all survey periods no cat carcasses, feral, hybrid or wildcat, were found along the roads within and surrounding the survey area. In addition, the keepers on the estate had not seen any cats, including feral cats, during the trapping period.
0
5
10
15
20
25
30
Bla
ck g
rous
e
Blu
e tit
Buz
zard
Cap
erca
illie
Chi
cken
Cur
lew
Phe
asan
t
Taw
ny o
wl
Woo
d co
ck
Woo
d pi
dgeo
n
Bro
wn
hare
Mou
ntai
n ha
re
Bad
ger
Dom
estic
dog
Hed
geho
g
Fox
Hyb
rid
Wild
cat
Ott
er
Pin
e m
arte
n
Rab
bit
Red
squ
irre
l
Woo
d m
ouse
Uni
dent
ified
dee
r
Red
Dee
r
Roe
Dee
r
She
ep
Species
% o
f ca
ptur
e ev
ents
Without bait or lures
With bait
With valarian
Figure 6: Percentage of total capture events for different species for survey 1 (N = 520), survey 2 (N = 238) and survey 3 (N = 261)
15
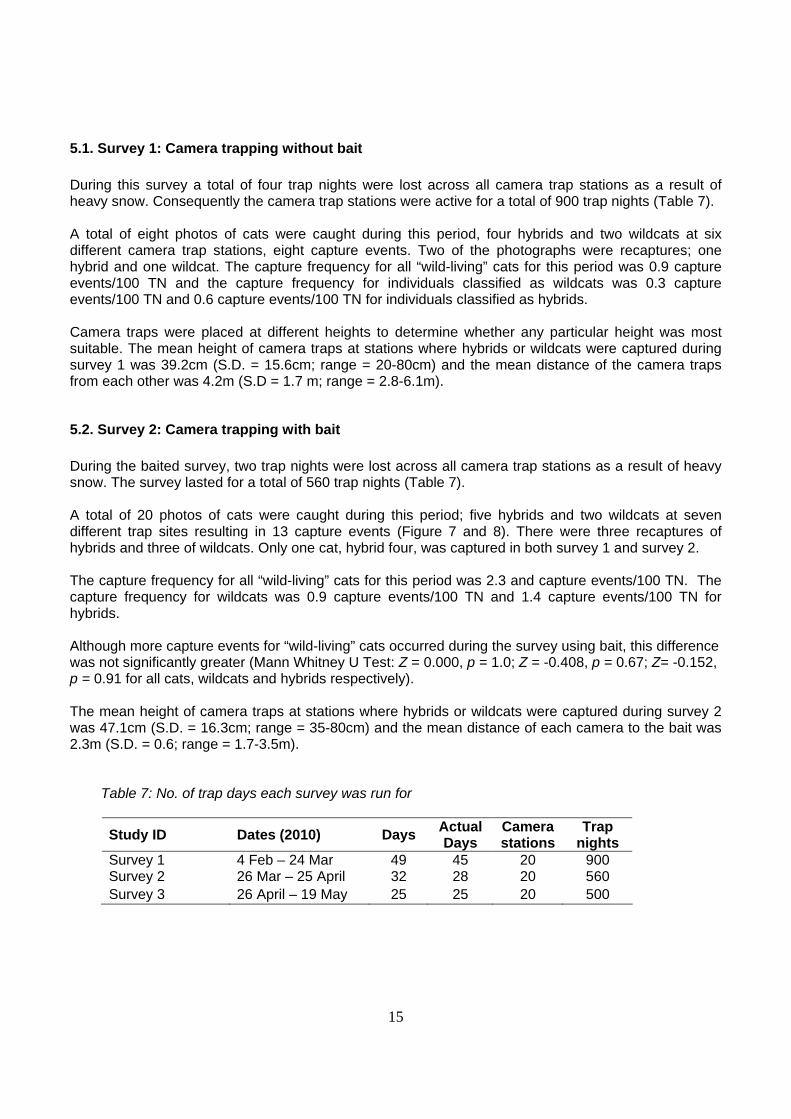
5.1. Survey 1: Camera trapping without bait
During this survey a total of four trap nights were lost across all camera trap stations as a result of heavy snow. Consequently the camera trap stations were active for a total of 900 trap nights (Table 7). A total of eight photos of cats were caught during this period, four hybrids and two wildcats at six different camera trap stations, eight capture events. Two of the photographs were recaptures; one hybrid and one wildcat. The capture frequency for all “wild-living” cats for this period was 0.9 capture events/100 TN and the capture frequency for individuals classified as wildcats was 0.3 capture events/100 TN and 0.6 capture events/100 TN for individuals classified as hybrids. Camera traps were placed at different heights to determine whether any particular height was most suitable. The mean height of camera traps at stations where hybrids or wildcats were captured during survey 1 was 39.2cm (S.D. = 15.6cm; range = 20-80cm) and the mean distance of the camera traps from each other was 4.2m (S.D = 1.7 m; range = 2.8-6.1m).
5.2. Survey 2: Camera trapping with bait
During the baited survey, two trap nights were lost across all camera trap stations as a result of heavy snow. The survey lasted for a total of 560 trap nights (Table 7). A total of 20 photos of cats were caught during this period; five hybrids and two wildcats at seven different trap sites resulting in 13 capture events (Figure 7 and 8). There were three recaptures of hybrids and three of wildcats. Only one cat, hybrid four, was captured in both survey 1 and survey 2. The capture frequency for all “wild-living” cats for this period was 2.3 and capture events/100 TN. The capture frequency for wildcats was 0.9 capture events/100 TN and 1.4 capture events/100 TN for hybrids. Although more capture events for “wild-living” cats occurred during the survey using bait, this difference was not significantly greater (Mann Whitney U Test: Z = 0.000, p = 1.0; Z = -0.408, p = 0.67; Z= -0.152, p = 0.91 for all cats, wildcats and hybrids respectively). The mean height of camera traps at stations where hybrids or wildcats were captured during survey 2 was 47.1cm (S.D. = 16.3cm; range = 35-80cm) and the mean distance of each camera to the bait was 2.3m (S.D. = 0.6; range = 1.7-3.5m).
Table 7: No. of trap days each survey was run for
Study ID Dates (2010) Days Actual Days
Camera stations
Trap nights
Survey 1 4 Feb – 24 Mar 49 45 20 900 Survey 2 26 Mar – 25 April 32 28 20 560 Survey 3 26 April – 19 May 25 25 20 500

16
Table 8: No. of capture events, individuals caught and no. of different trap stations cats were caught at for surveys 1 & 2 and the two surveys combined
* Hybrid 4 was caught in both survey 1 and survey 2
Wildcat 1 Wildcat 2
Hybrid 1 Hybrid 2
Hybrid 3 Hybrid 4
Figure 7: Individual “wild-living” cats caught on camera during survey 1
Study Total
captures & recaptures
Wildcat capture events
Hybrid capture events
No. different
individuals
No. individual wildcats
No. individual hybrids
No different stations
Survey 1 8 3 5 6 2 4 6 Survey 2 13 5 8 8 2 6 7 Combined 21 8 13 13 4 9* 11

17
Wildcat 3 Wildcat 4
Hybrid 5 Hybrid 6
Hybrid 7 Hybrid 8
Hybrid 9
Figure 8: Individual “wild-living” cats caught on camera during survey 2
18
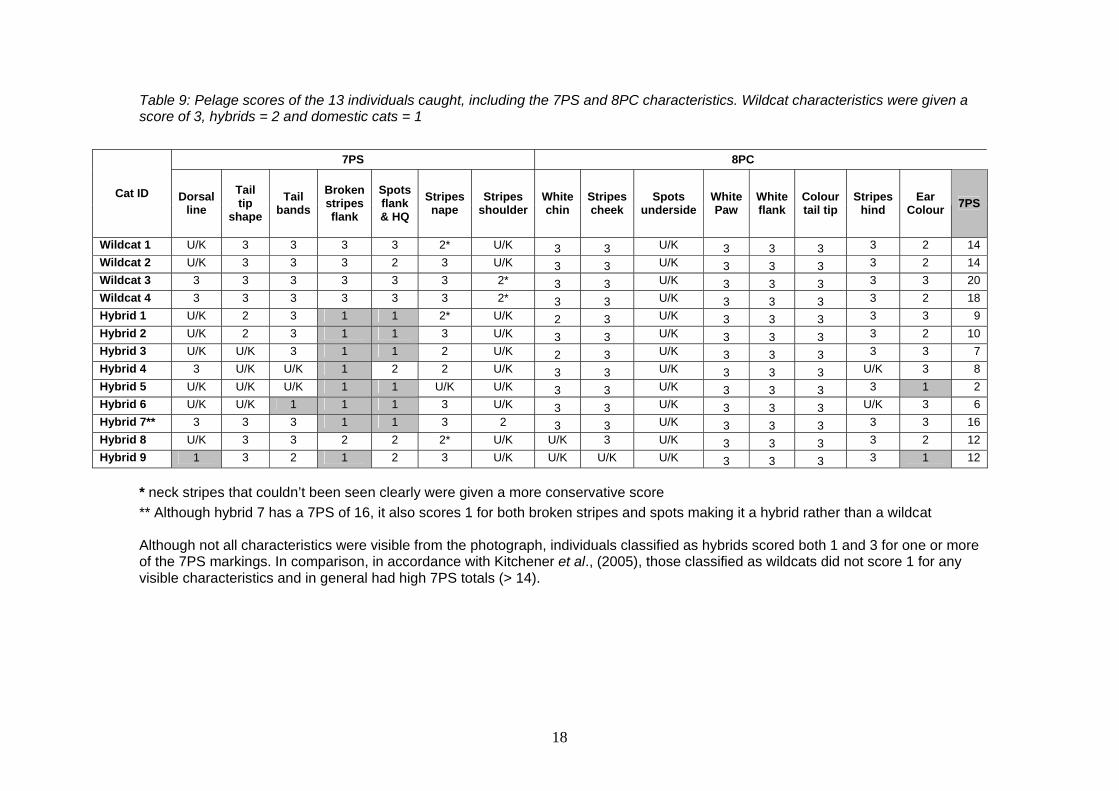
Table 9: Pelage scores of the 13 individuals caught, including the 7PS and 8PC characteristics. Wildcat characteristics were given a score of 3, hybrids = 2 and domestic cats = 1
7PS 8PC
Cat ID Dorsal line
Tail tip
shape
Tail bands
Broken stripes flank
Spots flank & HQ
Stripes nape
Stripes shoulder
White chin
Stripes cheek
Spots underside
White Paw
White flank
Colour tail tip
Stripes hind
Ear Colour
7PS
Wildcat 1 U/K 3 3 3 3 2* U/K 3 3 U/K 3 3 3 3 2 14
Wildcat 2 U/K 3 3 3 2 3 U/K 3 3 U/K 3 3 3 3 2 14
Wildcat 3 3 3 3 3 3 3 2* 3 3 U/K 3 3 3 3 3 20
Wildcat 4 3 3 3 3 3 3 2* 3 3 U/K 3 3 3 3 2 18
Hybrid 1 U/K 2 3 1 1 2* U/K 2 3 U/K 3 3 3 3 3 9
Hybrid 2 U/K 2 3 1 1 3 U/K 3 3 U/K 3 3 3 3 2 10
Hybrid 3 U/K U/K 3 1 1 2 U/K 2 3 U/K 3 3 3 3 3 7
Hybrid 4 3 U/K U/K 1 2 2 U/K 3 3 U/K 3 3 3 U/K 3 8
Hybrid 5 U/K U/K U/K 1 1 U/K U/K 3 3 U/K 3 3 3 3 1 2
Hybrid 6 U/K U/K 1 1 1 3 U/K 3 3 U/K 3 3 3 U/K 3 6
Hybrid 7** 3 3 3 1 1 3 2 3 3 U/K 3 3 3 3 3 16
Hybrid 8 U/K 3 3 2 2 2* U/K U/K 3 U/K 3 3 3 3 2 12
Hybrid 9 1 3 2 1 2 3 U/K U/K U/K U/K 3 3 3 3 1 12
* neck stripes that couldn’t been seen clearly were given a more conservative score
** Although hybrid 7 has a 7PS of 16, it also scores 1 for both broken stripes and spots making it a hybrid rather than a wildcat Although not all characteristics were visible from the photograph, individuals classified as hybrids scored both 1 and 3 for one or more of the 7PS markings. In comparison, in accordance with Kitchener et al., (2005), those classified as wildcats did not score 1 for any visible characteristics and in general had high 7PS totals (> 14).

19
5.3. Capture probability and abundance estimate: Programme CAPTURE
Because of the overall low number of captures and recaptures, the data from surveys 1 and 2 were combined in order to carry out the analysis on abundance and densities estimates. Because survey 1 & 2 were run immediately after one another, these data could be treated as one continuous survey. CAPTURE has a limit on the number of trapping occasions x individuals captured that it can analyze, as a result, the data for the two surveys combined were pooled to reduce the number of trapping occasions from 81 occasions of 24hrs each. For example, instead of a trapping occasion being 24 hrs, the number of capture events for each individual every 48 hrs or every 72hrs was put into a CAPTURE matrix. In order to determine which trapping interval best represented the data, CAPTURE was run with the data collated into different trapping intervals (resulting in different numbers of trapping occasions) to see how this affected the abundance estimates and capture probabilities (Figure 9). The abundance estimates and confidence intervals (CI) remained relatively constant as the number of days/trapping occasion increased until the model was run using 11 days/trapping occasion. At this point the abundance estimate greatly increased and the lower CI was 21, much higher than the minimum number of individuals known to be present in the study area. The capture probabilities (p-hat) were greatest (0.11) when there were 9 days/trapping occasion. Hence, the abundance estimates produced by running CAPTURE at nine trapping occasions of nine days each were therefore used in further analysis.
Figure 9: Variation in abundance estimates (N) showing the lower and upper 95% Confidence Intervals and capture probabilities (p-hat) as the number of days/trapping occasion varied
20
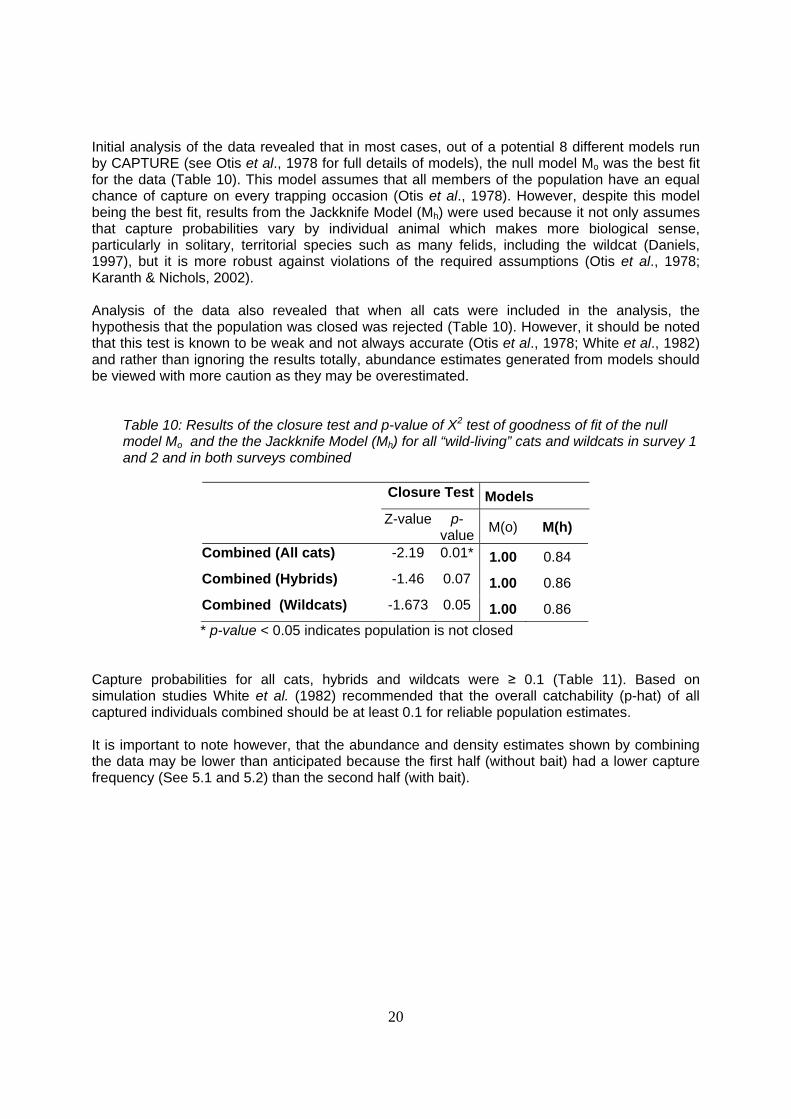
Initial analysis of the data revealed that in most cases, out of a potential 8 different models run by CAPTURE (see Otis et al., 1978 for full details of models), the null model Mo was the best fit for the data (Table 10). This model assumes that all members of the population have an equal chance of capture on every trapping occasion (Otis et al., 1978). However, despite this model being the best fit, results from the Jackknife Model (Mh) were used because it not only assumes that capture probabilities vary by individual animal which makes more biological sense, particularly in solitary, territorial species such as many felids, including the wildcat (Daniels, 1997), but it is more robust against violations of the required assumptions (Otis et al., 1978; Karanth & Nichols, 2002). Analysis of the data also revealed that when all cats were included in the analysis, the hypothesis that the population was closed was rejected (Table 10). However, it should be noted that this test is known to be weak and not always accurate (Otis et al., 1978; White et al., 1982) and rather than ignoring the results totally, abundance estimates generated from models should be viewed with more caution as they may be overestimated.
Table 10: Results of the closure test and p-value of X2 test of goodness of fit of the null model Mo and the the Jackknife Model (Mh) for all “wild-living” cats and wildcats in survey 1 and 2 and in both surveys combined
Closure Test Models
Z-value p-value
M(o) M(h)
Combined (All cats) -2.19 0.01* 1.00 0.84
Combined (Hybrids) -1.46 0.07 1.00 0.86
Combined (Wildcats) -1.673 0.05 1.00 0.86
* p-value < 0.05 indicates population is not closed Capture probabilities for all cats, hybrids and wildcats were ≥ 0.1 (Table 11). Based on simulation studies White et al. (1982) recommended that the overall catchability (p-hat) of all captured individuals combined should be at least 0.1 for reliable population estimates. It is important to note however, that the abundance and density estimates shown by combining the data may be lower than anticipated because the first half (without bait) had a lower capture frequency (See 5.1 and 5.2) than the second half (with bait).

21
Table 11: Abundance estimates and capture probabilities (p-hat) produced using the Jacknife Model (Mh) in CAPTURE. Also shows the Mean Known Number of individuals Alive (MKNA)
Sub sampling of the dataset indicated that the abundance estimates fell below the Known Minimum Number of individuals Alive in the study area (13 individuals) when fewer than 6 trapping occasions of 9 days each (total 54 days) were used despite the fact that capture probabilities increased above the required minimum level of 0.1 (Figure 10). This indicates that surveys should be carried out for at least 60 days (2 months) in order to provide more accurate abundance estimates.
Figure 10: Sub sampling of data to examine changes in abundance estimates and capture
probabilities as the total number of sampling occasions analysed decreased (lower and
upper 95% confidence intervals are also shown).
Study ID Survey 1 & 2 combined MNKA - Total N individuals (Total N captures and recaptures)
13 (22)
MNKA - Total wildcats caught (Total N captures and recaptures)
4 (8)
MNKA - Total hybrids caught (Total N captures and recaptures)
9 (14)
p-hat wildcats 0.11 Abundance wildcats (± s.e.) 6 (1.91) 95% CI range 5-13 p-hat hybrids 0.10 Abundance hybrids (± s.e.) 13 (3.53) 95% CI range 10-27 p-hat all cats 0.11 Abundance all cats (± s.e.) 18 (3.92) 95% CI range 15-32

22
5.4. Density estimates
5.4.1. CAPTURE In order to calculate density from the abundance estimates generated by CAPTURE, the Effective Sample Area needs to be calculated. The Effective Sampling Area would ideally be calculated from the ½ MMDM (Mean Maximum Distance Moved) of individuals caught at 3 or more stations. However, in this study no individuals were caught at >2 stations and several individuals were caught only once or repeatedly at the same station and therefore could not be included in the calculation of ½ MMDM. In addition, this method can often overestimate population densities because it underestimates the maximum distances moved (Soisalo and Cavalcanti, 2006). As a result of these caveats, density was not estimated using the abundance data generated by CAPTURE. The ½ MMDM of individuals captured at least twice are however presented below for later discussion.
Table 12: showing the Maximum Distance Moved (MDM) by each individual, mean of the MDM and the ½ MMDM of survey 1 & 2 combined
5.4.2. SPACECAP
Because only four cats caught on camera were identified as wildcats, population density estimates using SPACECAP were estimated for all “wild-living” cats caught in survey 1 & 2 combined (Table 13), which requires a minimum of 10-15 individuals and 3-5 recaptures in order to accurately analyse the data. Table 13: Density estimates calculated using SPACECAP for all wild-living cats showing density, s.e. and 95% Lower and Upper Higher Posterior Density (HPD) levels
Individual ID MDM (m) Mean (m)½ MMDM
(m)
HYB8 894 2216 1108.0 WILD1 894 WILD4 4860
Survey Density No. Ind/100km2
S.E. 95% LowerHPD
95% Upper HPD
Density (No. ind./10 km2)
Combined: All cats 28.75 12.90 11.11 54.70 2.9

23
6. DISCUSSION AND RECOMMENDATIONS
The results from the study indicate that camera trapping can detect wildcats and “wild-living” cats in areas where they are known to occur and that individual cats are identifiable based on their pelage markings. Because individuals can be identified, it may be possible to estimate population densities provided that a sufficient number of individuals are caught and a sufficient number of recaptures occur. In addition, based on the RTA surveys carried out during the camera trapping surveys, initial results indicate that camera trapping is not only suitable for surveying for the Scottish wildcat but it may be more effective than RTA surveys. However, the study also highlighted that some changes could be made to the methodology in order to improve capture rates; these are discussed in more detail below.
6.1. Number of camera traps, camera station layout and survey length
A total of 20 camera trap stations were used and it is recommended that this is the minimum number of stations used in future survey efforts. In addition, the area covered by this survey, using 20 trap stations did result in the minimum recommended capture probability of all individuals of 0.1; it is therefore recommended that the area covered by 20 trap stations is the minimum area used and that ideally more camera tap stations should be incorporated into the study if possible. Capture success may increase with increased number of traps to cover a greater survey area. It is recommended that two camera traps should be used at each station to increase the chances of both capturing a cat and getting photos of both sides of the animal. In general, both camera traps at each station did trigger as expected when other species of a similar size were detected (e.g. badger [Meles meles], pine marten and fox [Vulpes vulpes]). Because of this and because of the lack of dual photographs for most of the individual cats captured, it is suspected that “wild-living” cats in the area may be particularly alarmed by the flash of the cameras and as a result, once they have triggered one camera, may turn away rather than continue along the same direction, thus not triggering the other camera. For this reason, the use of two camera trap are recommended, to double the chances of obtaining a photograph and the use of bait appeared to encourage the cat to stay in the area long enough to get a better photograph. Only one individual was caught in both survey 1 and survey 2. This suggests that the length of the camera trapping survey should be increased to improve the chances of all individuals within the study site being captured at least once. Sub-sampling of the dataset in CAPTURE indicated that a survey length of at least 60 days is required; therefore, we recommend that future surveys are carried out for 2 months. The MMDM values overall were lower than expected, indicating that in this study area at least, the home range of wildcats (as estimated from previous radio tracking studies e.g. Corbett 1979; Daniels, 1997) could be less than anticipated, although this should be viewed with caution as a result of the low sample size. The MMDM can be considered to be a measure of the diameter of an individuals home range (Karanth & Nichols, 2002), in this case, the MMDM from 2 individuals was < 1km, suggesting a possible home range of 0.8 km2. To improve capture probabilities, it is recommended that the camera trap stations are placed between 1-1.5km apart. The camera trapping for this study was carried out over late winter/spring. There is no reason to suggest that the method would not work equally well at other times of the year, for example
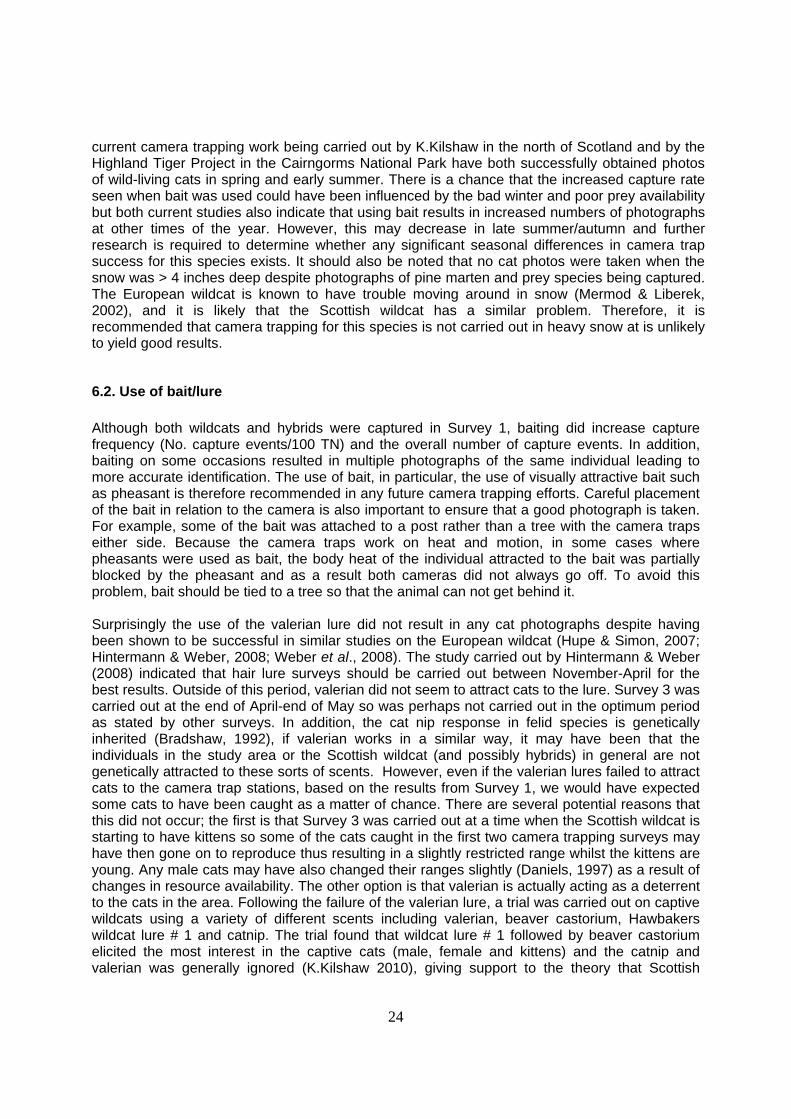
24
current camera trapping work being carried out by K.Kilshaw in the north of Scotland and by the Highland Tiger Project in the Cairngorms National Park have both successfully obtained photos of wild-living cats in spring and early summer. There is a chance that the increased capture rate seen when bait was used could have been influenced by the bad winter and poor prey availability but both current studies also indicate that using bait results in increased numbers of photographs at other times of the year. However, this may decrease in late summer/autumn and further research is required to determine whether any significant seasonal differences in camera trap success for this species exists. It should also be noted that no cat photos were taken when the snow was > 4 inches deep despite photographs of pine marten and prey species being captured. The European wildcat is known to have trouble moving around in snow (Mermod & Liberek, 2002), and it is likely that the Scottish wildcat has a similar problem. Therefore, it is recommended that camera trapping for this species is not carried out in heavy snow at is unlikely to yield good results.
6.2. Use of bait/lure
Although both wildcats and hybrids were captured in Survey 1, baiting did increase capture frequency (No. capture events/100 TN) and the overall number of capture events. In addition, baiting on some occasions resulted in multiple photographs of the same individual leading to more accurate identification. The use of bait, in particular, the use of visually attractive bait such as pheasant is therefore recommended in any future camera trapping efforts. Careful placement of the bait in relation to the camera is also important to ensure that a good photograph is taken. For example, some of the bait was attached to a post rather than a tree with the camera traps either side. Because the camera traps work on heat and motion, in some cases where pheasants were used as bait, the body heat of the individual attracted to the bait was partially blocked by the pheasant and as a result both cameras did not always go off. To avoid this problem, bait should be tied to a tree so that the animal can not get behind it. Surprisingly the use of the valerian lure did not result in any cat photographs despite having been shown to be successful in similar studies on the European wildcat (Hupe & Simon, 2007; Hintermann & Weber, 2008; Weber et al., 2008). The study carried out by Hintermann & Weber (2008) indicated that hair lure surveys should be carried out between November-April for the best results. Outside of this period, valerian did not seem to attract cats to the lure. Survey 3 was carried out at the end of April-end of May so was perhaps not carried out in the optimum period as stated by other surveys. In addition, the cat nip response in felid species is genetically inherited (Bradshaw, 1992), if valerian works in a similar way, it may have been that the individuals in the study area or the Scottish wildcat (and possibly hybrids) in general are not genetically attracted to these sorts of scents. However, even if the valerian lures failed to attract cats to the camera trap stations, based on the results from Survey 1, we would have expected some cats to have been caught as a matter of chance. There are several potential reasons that this did not occur; the first is that Survey 3 was carried out at a time when the Scottish wildcat is starting to have kittens so some of the cats caught in the first two camera trapping surveys may have then gone on to reproduce thus resulting in a slightly restricted range whilst the kittens are young. Any male cats may have also changed their ranges slightly (Daniels, 1997) as a result of changes in resource availability. The other option is that valerian is actually acting as a deterrent to the cats in the area. Following the failure of the valerian lure, a trial was carried out on captive wildcats using a variety of different scents including valerian, beaver castorium, Hawbakers wildcat lure # 1 and catnip. The trial found that wildcat lure # 1 followed by beaver castorium elicited the most interest in the captive cats (male, female and kittens) and the catnip and valerian was generally ignored (K.Kilshaw 2010), giving support to the theory that Scottish
25
wildcats are not attracted to valerian. Current camera trapping work are now using a combination of Hawbakers wildcat lure # 1 and # 2 and pheasant bait which seems to help attract cats to the camera stations.
6.3. Abundance and Density Estimates
Individuals were recognisable from their pelage patterns and therefore population density estimates rather than just relative abundance estimates could be calculated. The number of captures and recaptures required to estimate densities accurately varies dependent on the programme used. In this case, insufficient capture and recaptures were obtained for CAPTURE and SPACECAP, hence combining the results from Survey 1 & 2. SPACECAP can surmount several of the problems associated with CAPTURE and using the ½ MMDM method, in particular, lack of population closure and heterogeneity in capture probabilities (Royle et al., 2009) and has been designed with camera trapping of low density species in mind. SPACECAP may therefore be more suitable for a rare and cryptic species such as the Scottish wildcat which is likely to have a low capture rate. Population density was estimated at 28.75 individual “wild-living” cats/100km2 (2.9 individuals/10km2) with a 95% probability that the true density estimate for this sample falls within the credible intervals (upper and lower HPD) of 11-55 individuals/100km2. A limited number of existing density estimates exist for the Scottish wildcat; these are 0.1 individuals/10km2 in the west of Scotland (Scott, 1993) and 3 individuals/10km2 in the east of Scotland (Corbett, 1979). Although it should be noted that in both these studies, it is unclear whether the individuals used to provide population density estimates were wildcats or a mixture of wildcats and hybrids as these studies were carried out before the pelage criteria had been established (Kitchener et al., 2005). The density estimate obtained in this study from the east of Scotland was based on hybrids and wildcats combined and is comparable to the density estimate obtained by Corbett (1979). However, it should also be noted that this particular estate is considered to be of good habitat for wildcats and camera trapping in other sites may not generate sufficient captures to estimate density from. One solution to this, particularly in areas of less optimal habitat, could be to increase the size of the camera trapping grid so more cameras are being used. Alternatively, if there is a limit to the number of camera traps available trap lines or smaller grid blocks within a larger grid can be established which are run for a shorter period of time consecutively but cover a greater area,(e.g. Karanth et al., 2004). In addition, in order to monitor the wildcat population at any one site in the long-term requires us to be able to determine the statistical power of this method i.e. the probability that camera trapping can detect a change in population density over time. A test with power greater than 0.8 is generally considered statistically powerful (Lenth 2001). For example, based on the density estimate collected by this study, if a subsequent survey had the same standard error (s.e. = 12.9) then it would only have a low power (0.3) or low probability of correctly detecting a 50% decrease in mean density. A decrease in mean density by 75% would have a slightly greater probability of detection (power = 0.5). If the standard error was halved, then camera trapping would have a very high probability of picking up a 75% change in population density (power = 0.95) and a relatively high probability of detecting a 50% change in population density (power = 0.72). Decreasing the standard error therefore is important in order to increase statistical power of this method. In addition to increasing the number of camera traps used or the size of the area covered, as mentioned previously, detection success can also be increased by using bait and scent lures and increasing the survey length to 60 days. Subsequent survey work will also help establish whether camera trapping during a particular season has any effect on detection rate.

26
However, it should also be noted that the effectiveness of camera trapping in detecting population change can be more accurately modelled once more data on the variance of density estimates has been collected using this method. This is best achieved by repeated camera trapping on the same grid within the same season or over a few consecutive seasons (Gibbs & Ene, 2010).
6.4. Layout and height of camera traps
Based on the trap layouts shown in Figure 2, the best photographs were taken when cameras were set out as layout a (opposite each other and perpendicular to the animal trail) when no bait or lure was used. If the cameras were not perpendicular to the trail or were too close to the trail then a full view of the animal was not always obtained, making identification difficult (e.g. photograph of hybrid 4 in Figure 7). It is therefore recommended that camera traps are placed at a minimum of 1m away from an animal trail to prevent individuals passing too close to the camera. If bait or lures are used, it is recommended that either layouts e or f are used and that the bait or lure should be attached to a tree where possible (see 6.2. for more detail). No cat photographs were obtained from camera traps set higher than 80cm. However, in all cases where one of the camera traps was set high, the other camera trap was set at 20-40cm high in order to maximise capture success. It is therefore unlikely that cats were not caught at these stations because one of the cameras was too high to be triggered by a passing individual. Camera trap height placement of between 20-80cm from ground level appeared to be suitable for obtaining clear photographs of a cat, particularly if the traps were placed ≥1m away from the animal trail or bait. Ideally, in order to obtain a photo of the dorsal stripe and neck stripes, the camera traps could be placed about 40cm height off the ground but facing slightly downhill (e.g. hybrid 8); the use of bait attached to a tree also generated good photographs of individuals at different angles (e.g. wildcat 3).
6.5. Battery duration and checking the camera traps
Camera traps were checked every 7 -10 days to ensure the batteries were still functioning. Despite temperatures falling to -16oC in February, all cameras maintained function and the batteries were only changed once during the entire 3 camera trapping surveys. Batteries used were Duracell Ultra and the maximum number of photographs taken on one camera trap before the batteries were changed was > 400. It should be noted that this may have been sooner if all these photographs had been taken using the flash and will vary with different camera trap and batteries makes. It is therefore likely that during a 2-month survey, the batteries would not need to be changed. However, it is still important to check the camera traps at least every 2 weeks in case the cameras malfunction or have been dislodged by an animal and need re-aligning. In addition, if using bait, the camera traps should be checked every 7-10 days, particularly during summer, to replace the bait.

27
7. ACKNOWLEDGEMENTS
We would like to thank the staff of Seafield and Strathspey Estates for their assistance and co-operation, Dr. David Hetherington (Cairngorms Wildcat Project), Keith Duncan and Dr. Mairi Cole (SNH) for their assistance in finding a suitable study site. We would also like to thank Neil Anderson for providing information on wildcats in the area and Dr. Paul Johnson (WildCRU), Dr. Mairi Cole, Dr. Jenny Bryce (SNH) and Dr Andrew Kitchener (National Museums of Scotland) for their comments on the report. Finally, we would like to thank Scottish Natural Heritage (SNH) for jointly funding this project.
28
8. REFERENCES
Anile, S., Bizzarri, L. & Ragni, B. 2007. Experiences obtained from camera trapping the wildcat in Sicily (Italy). Hystrix Italian Journal of Mammalogy Supplement V European Congress of Mammalogy, 294. Balharry, D. 1993. Factors affecting the distribution and population density of pine martens (Martes martes L.) in Scotland. University of Aberdeen, Aberdeen, UK. Balharry, D. & Daniels, M. J. 1998. Wild living cats in Scotland. Scottish Natural Heritage Research, Survey and Monitoring Report No. 23. Edinburgh, Scotland . Beaumont, M., Barratt, E. M., Gottelli, D., Kitchener, A. C., Daniels, M. J., Pritchard, J. K. & Bruford, M. W. 2001. Genetic diversity and introgression in the Scottish wildcat. Molecular Ecology, 10, 319-336. Birks, J. D. S., Messenger, J. E. & Halliwell, E. C. 2005. Diversity of den sites used by pine martens Martes martes: A response to the scarcity of arboreal cavities? Mammal Review, 35, 313-320. Bradshaw, J.W.S. 1992. The Behaviour of the Domestic Cat. C.A.B International UK. BTO, 1999. PART IV: Schemes for Individual Species. pp. 210. British Trust for Ornithology. Carbone, C., Coulson, T., Christie, S., Conforti, K., Seidensticker, J., Franklin, N., Tilson, R., Ginsberg, J. R., Kinnaird, M., Laidlaw, R., Lynam, A., O'Brien, T., Wan Shahruddin, W. N., Griffiths, M., Holden, J., Martyr, D., Kawanishi, K., Sunquist, M., Macdonald, D. W., Nath, L., McDougal, C. & Smith, D. J. L. 2001. The use of photographic rates to estimate densities of tigers and other cryptic mammals. Animal Conservation, 4, 75-79. Corbett, L. K. 1979. Feeding ecology and social organization of wild cats (Felis silvestris) and domestic cats (Felis catus) in Scotland. University of Aberdeen, Aberdeen, UK. Daniels, M. J. 1997. The biology and conservation of the wildcat in Scotland., pp. 207. University of Oxford. Davies, A. R. and D. Gray 2010. The distribution of Scottish wildcats (Felis silvestris) in Scotland (2006-2008), Natural Heritage Commissioned Report No. 360: 60. Driscoll, C. A., Menotti-Raymond, M., Roca, A. L., Hupe, K., Johnson, W. E., Geffen, E., Harley, E. H., Delibes, M., Pontier, D., Kitchener, A. C., Yamaguchi, N., O’Brien, S. J. & Macdonald, D. W. 2007. The Near Eastern Origin of Cat Domestication. Science, 317, 519-523 Driscoll, C. & Nowell, K. 2009. Felis silvestris. In: IUCN 2011. IUCN Red List of Threatened Species. Version 2011.1. <www.iucnredlist.org>. Downloaded on 13 September 2011. Easterbee, N., Hepburn, L. V. & Jefferies, D. J. 1991. Survey of the status and distribution of the wildcat in Scotland, 1983-1987. Nature Conservancy Council for Scotland, Edinburgh.

29
Gibbs, J. P., & Ene, E. 2010. Program Monitor: Estimating the statistical power of ecological monitoring programs. Version 11.0.0. Griffiths, M. & Van Schaick, V. 1993. Camera trapping: a new tool for the study of elusive rain forest animals. Tropical Biodiversity, 1, 131-135. Hintermann & Weber, A. 2008. Entwicklung und Anwendung einer neuen Wildkatzen-Nachweismethode (Development and application of a new method of detecting wildcats. In German). pp. 29. Hubbard, A. L., McOrist, S., Jones, T. W., Boid, R., Scott, R. & Easterbee, N. 1992. Is survival of European wildcats Felis silvestris in Britain threatened by interbreeding with domestic cats? Biological Conservation, 61, 203-208. Hupe, K & Simon, O. 2007. Untersuchung zum Vorkommen derWildkatze (Felis silvestris silvestris) in Wäldern und bewaldeten Höhenzügen zwischen Solling und Hainberg im Hinblick auf eine mögliche Vernetzung der Harz- und Sollingpopulation. Inform.d. Naturschutz Niedersachs, 27, 38 – 45. Jones, L. L. C. & Raphael, M. G. 1993. Inexpensive camera systems for detecting martens, fishers, and other animals: guidelines for use and standardization. General Technical Report. US Department of Agriculture, Forest Service, Pacific Northwest Research Station, Portland, Oregon. Karanth, K. U. & Nichols, J. D. 1998. Estimation of tiger denstiies in India using photographic captures and recaptures. Ecology, 79, 2852-2862. Karanth, K. U. & Nichols, J. D. 2002. Monitoring tigers and their prey. Centre for Wildlife Studies, India. Karanth, K. U., Chundawat, R. S., Nichols, J. D. & Kumar, N. S. 2004. Estimation of tiger densities in the tropical dry forests of Panna, Central India, using photographic capture-recapture sampling. Animal Conservation, 7, 285-290. Kitchener, A. C. 1995. The Wildcat, The Mammal Society. Kitchener, A. C., Yamaguchi, N., Ward, J. M. & Macdonald, D. W. 2005. A diagnosis for the Scottish wildcat (Felis silvestris): A tool for conservation action for a critically-endangered felid. Animal Conservation, 8, 223-237. Langley, P. J. W. & Yalden, D. W. 1977. The decline of the rarer carnivores in Great Britain during the nineteenth century. Mammal Review, 18, 741-760. Lynam, A. J., Kreetiyutanont, K., & Mather, R. 2001. Conservation status and distribution of the Indochinese tiger (Panthera tigris corbetti) and other large mammals in a forest complex in northeastern Thailand. Natural History Bulletin Siam Society, 49, 61-75. Macdonald, D. W., Daniels, M. J., Driscoll, C., Kitchener, A. & Yamaguchi, N. 2004. The Scottish Wildcat: Analyses for Conservation and an Action Plan., pp. 67. Wildlife Conservation Research Unit, University of Oxford.

30
Maffei, L. & Noss, A. J. 2008. How small is too small? Camera trap survey areas and density estimates for ocelots in the Bolivian Chaco. Biotropica, 40, 71-75. Mermod, C. P. & Liberek, M. 2002. The role of snowcover for European wildcat in switzerland. Zeitschrift fur Jagdwissenschaft, 48, 17-24. Monterroso, P., Sarmento, P., Ferreras, P. & Alves, P. C. 2005. Spatial distribution of the European wildcat (Felis silvestris) in Vale do Guadiana Natural Park, South Portugal. Symposium: Biology and Conservation of the European Wildcat (Felis silvestris silvestris) (ed M. Herrmann), pp. 17. NABU, Germany, January 21st –23rd 2005. Nowell, K. & Jackson, P. 1996. Status Survey and Conservation Action Plan: Wild Cats. IUCN, Gland, Swtzerland. McOrist, S., Boid, R., Jones, T. W., Easterbee, N., Hubbard, A. L. & Jarrett, O. 1991. Some viral and protozool diseases in the European wildcat (Felis silvestris). Journal of Wildlife Diseases, 27, 693-696. Otis, D. L., Burnham, K. P., White, G. C. & Anderson, D. R. 1978. Statistical inference from capture data on closed populations. Wildlife Monographs, 62, 1-135. Pollock, K. H., Nichols, J. D., Brownie, C. & Hines, J. E. 1990. Statistical inference from capture-recapture experiments. Wildlife Monographs, 107, 1-97. Rexstad, E. & Burnham, K. P. 1991. User’s guide for interactive program CAPTURE. Abundance estimation of closed animal populations., Colorado State University, Fort Collins, USA. Royle, J., Nichols, J., Karanth, K. & Gopalaswamy, A. 2009. A hierarchical model for estimating density in camera-trap studies. Journal of Applied Ecology, 46, 118-127. Seafield and Strathsprey Estates, 2001. News Review. Issue 2, February 2001. http://www.seafield-estate.co.uk/seafield.pdf Silver, S. 2004. Assessing jaguar abundance using remotely triggered cameras., pp. 25. Wildlife Conservation Society. Singh, P., Gopalaswamy, A.M., Royle, A.J., Kumar, N.J. & Karanth, K.U. 2010. SPACECAP: A Program to Estimate Animal Abundance and Density using Bayesian Spatially-Explicit Capture-Recapture Models. Wildlife Conservation Society - India Program, Centre for Wildlife Studies, Bangalure, India. Version 1.0. Soisalo, M. K. & Cavalcanti, S. M. C. 2006. Estimating the density of a jaguar population in the Brazilian Pantanal using camera-traps and capture–recapture sampling in combination with GPS radio-telemetry. Biological Conservation, 129, 487-496. Tapper, S. 1992. Game Heritage, The Game Conservancy: Fordingbridge. Weber, D. 2008. Monitoring Wildcats (Felis silvestris silvestris) Guidance for a systematic survey of the distribution of wildcats and for monitoring population changes over time (Translated by Hannes Schnell, Helen Armour and Ruth Maier).

31
White, G. C., Burnham, K. P., Otis, D. L. & Anderson, D. R. 1978. User's Manual for Program CAPTURE, Utah State Univ. Press,, Logan, Utah. White, G. C., Anderson, D. R., Burnham, K. P. & Otis, D. L. 1982. Capture–recapture and removal methods for sampling closed populations. Los Alamos National Laboratory Publication LA- 8787-NERP., Los Alamos, New Mexico. Yalden, D. W. 1982. When did the mammal fauna of the British Isles arrive? Mammal Review, 12, 1-57. Yamaguchi, N., Driscoll, C. A., Macdonald, D. W., Kitchener, A. C. & Ward, J. M. 2004. Craniological differentiation between European wildcats (Felis silvestris silvestris), African wildcats (F. s. lybica) and Asian wildcats (F. s. ornata): Implications for their evolution and conservation. Biological Journal of the Linnean Society, 83, 47-63.

32
9. APPENDIX 1: Height of camera traps and distance from each other, bait or lure
Survey 1 Survey 2 Survey 3
StationCamera height (cm)
Distance apart (m)
Camera height (cm)
Distance to bait
Camera height (cm)
Distance to lure
1 2 1 2 Camera 1 Camera 2 1 2 Camera 1 Camera 21 40 80 3.5 40 80 2.3 2 40 80 2.3 2 2 40 40 2.1 40 40 2 2 40 40 2 2 3 40 80 5.4 40 80 1.8 3.1 40 80 2.7 3.9 4 50 50 6.2 50 50 2.5 2.7 50 50 2.5 2.7 5 147 150 10.8 147 150 4.6 6.2 147 150 4.6 6.2 6 50 50 2.4 50 50 1.8 2.9 50 50 1.3 2.9 7 40 50 6.6 180 50 1.4 6 50 50 3.2 3.5 8 40 40 4.2 40 40 2.7 2.8 40 40 2.7 2.8 9 80 20 6.5 80 20 4.3 2.8 80 20 4.3 2.8
10 60 70 3.2 60 70 1.9 2.5 60 70 1.9 2.5 11 20 30 3.5 20 30 2 2.1 20 30 2 2.1 12 40 80 10.8 40 80 5 5.8 40 80 5 5.8 13 30 30 2.8 30 30 2.8 2.4 30 30 2.8 2.4 14 40 40 6.1 40 60 6.1 2.7 40 60 6.1 2.7 15 40 40 3.4 40 40 2.2 2.4 40 40 2.2 2.4 16 30 35 2.3 60 35 1.7 3.5 60 35 1.7 3.5 17 20 30 2.8 180 30 2 2.8 20 30 1.9 2 19 40 40 2.9 40 40 1.7 2.5 40 40 1.7 2.5 20 30 50 2.7 30 50 2.3 2.4 30 50 2.3 2.4

www.snh.gov.uk© Scottish Natural Heritage 2011ISBN: 978-1-85397-798-5
Policy and Advice Directorate, Great Glen House,Leachkin Road, Inverness IV3 8NWT: 01463 725000
You can download a copy of this publication from the SNH website.