snap specs
DESCRIPTION
Ritech 5000 specification and user manual to test and use the pulser as per needs. Its a ultrasonic pulse generator of high amplitude and frequency.TRANSCRIPT
RITEC, Inc. 60 Alhambra Rd., Suite 5 Warwick, RI 02886 (401) 738-3660 FAX (401) 738-3661
www.RitecInc.com
The Global Leader in High Power Ultrasonics
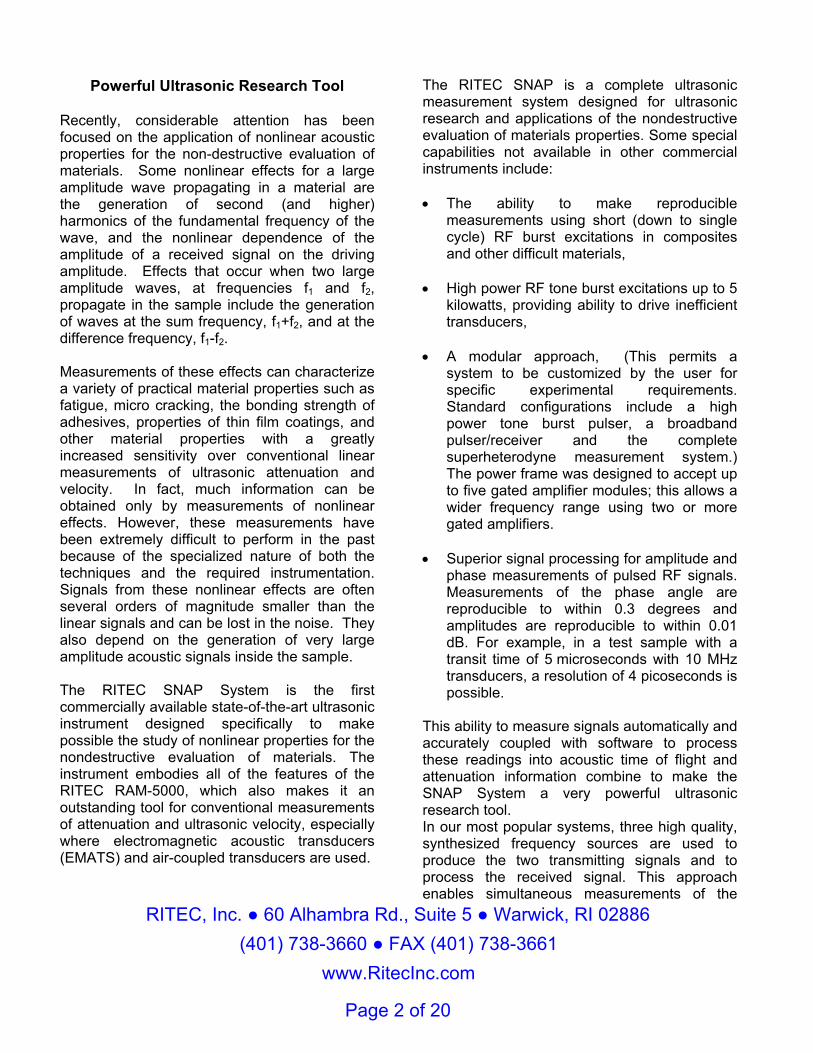
RITEC SNAP System
Versatile Computer Controlled Ultrasonic System:
• High power RF tone burst outputs as high as 5 kilowatts for frequencies up to 7 MHz.
• A phase-sensitive superheterodyne receiver provides the ability to extract otherwise undetectable signals from the noise.
• Characterize materials by measuring nonlinear properties.
• Examine harmonic frequencies for increased sensitivity in material evaluation.
• Two gated amplifiers provide a variety of nonlinear measurements such as beam mixing with the nonlinear generation of sum and difference frequencies.
• Unique Design with three direct digital synthesizers provides complete flexibility in measurements.
RITEC, Inc. 60 Alhambra Rd., Suite 5 Warwick, RI 02886 (401) 738-3660 FAX (401) 738-3661
www.RitecInc.com
Page 2 of 20
Powerful Ultrasonic Research Tool
Recently, considerable attention has been focused on the application of nonlinear acoustic properties for the non-destructive evaluation of materials. Some nonlinear effects for a large amplitude wave propagating in a material are the generation of second (and higher) harmonics of the fundamental frequency of the wave, and the nonlinear dependence of the amplitude of a received signal on the driving amplitude. Effects that occur when two large amplitude waves, at frequencies f1 and f2, propagate in the sample include the generation of waves at the sum frequency, f1+f2, and at the difference frequency, f1-f2. Measurements of these effects can characterize a variety of practical material properties such as fatigue, micro cracking, the bonding strength of adhesives, properties of thin film coatings, and other material properties with a greatly increased sensitivity over conventional linear measurements of ultrasonic attenuation and velocity. In fact, much information can be obtained only by measurements of nonlinear effects. However, these measurements have been extremely difficult to perform in the past because of the specialized nature of both the techniques and the required instrumentation. Signals from these nonlinear effects are often several orders of magnitude smaller than the linear signals and can be lost in the noise. They also depend on the generation of very large amplitude acoustic signals inside the sample. The RITEC SNAP System is the first commercially available state-of-the-art ultrasonic instrument designed specifically to make possible the study of nonlinear properties for the nondestructive evaluation of materials. The instrument embodies all of the features of the RITEC RAM-5000, which also makes it an outstanding tool for conventional measurements of attenuation and ultrasonic velocity, especially where electromagnetic acoustic transducers (EMATS) and air-coupled transducers are used.
The RITEC SNAP is a complete ultrasonic measurement system designed for ultrasonic research and applications of the nondestructive evaluation of materials properties. Some special capabilities not available in other commercial instruments include: • The ability to make reproducible
measurements using short (down to single cycle) RF burst excitations in composites and other difficult materials,
• High power RF tone burst excitations up to 5
kilowatts, providing ability to drive inefficient transducers,
• A modular approach, (This permits a
system to be customized by the user for specific experimental requirements. Standard configurations include a high power tone burst pulser, a broadband pulser/receiver and the complete superheterodyne measurement system.) The power frame was designed to accept up to five gated amplifier modules; this allows a wider frequency range using two or more gated amplifiers.
• Superior signal processing for amplitude and
phase measurements of pulsed RF signals. Measurements of the phase angle are reproducible to within 0.3 degrees and amplitudes are reproducible to within 0.01 dB. For example, in a test sample with a transit time of 5 microseconds with 10 MHz transducers, a resolution of 4 picoseconds is possible.
This ability to measure signals automatically and accurately coupled with software to process these readings into acoustic time of flight and attenuation information combine to make the SNAP System a very powerful ultrasonic research tool. In our most popular systems, three high quality, synthesized frequency sources are used to produce the two transmitting signals and to process the received signal. This approach enables simultaneous measurements of the
RITEC, Inc. 60 Alhambra Rd., Suite 5 Warwick, RI 02886 (401) 738-3660 FAX (401) 738-3661
www.RitecInc.com
Page 3 of 20
phase and the amplitude as well as making the linearity of the system essentially independent of the signal level.
A Modular Approach The instrumentation for this sophisticated, complete ultrasonic system has been divided into functional modules. Each module performs a specific task and can be understood, tested, and modified individually. This approach offers a number of advantages. 1. Each module can be developed individually and modified for special requirements. 2. Not all applications require the same functional arrangement. For example, while the full harmonic measurement application requires the complete SNAP system, some conventional applications require only the broadband receiver, and a broadband pulser/receiver system can be purchased without the additional modules for the superheterodyne phase sensitive receiver. 3. New modules may be added to meet the needs of a particular custom application at a fraction of the development cost of a complete system. 4. Modules may be replaced as needed to keep the system current with new developments in measurement technology. This modular approach maximizes RITEC's ability to make state-of-the-art instrumentation available and gives the user the best possibility of keeping his system current. These advantages result in greatly increased capability, more flexibility, and a lower price as compared with non-modularized stand-alone systems or those created from components purchased from several manufacturers. The SNAP system consists of the following elements in conjunction with the power frame:
I. A broadband, high power gated amplifier for producing RF bursts, derived from a direct digital RF source, to drive various types of transducers, including piezo-electric, air-coupled and, electromagnetic acoustic transducers (EMATs).
II. Three accurate direct digital synthesizers
(DDS) for high-resolution frequency control and the ability for rapid frequency sweeps. The module also includes the timing to produce the gates required to turn the synthesizers on and off coherently and to produce the gates required to turn the amplifier on and off coherently with the synthesizer outputs.
III. A broadband receiver stage to amplify
ultrasonic signals either from the transmitting transducer, using a diplexer, or from a separate receiving transducer.
IV. The broadband receiver is typically
followed by superheterodyne phase-sensitive receiver stages to improve the detection of received signals in noisy environments.
V. A pair of integrators that are gated on and
off to process the information from the phase sensitive receiver outputs for precise measurements of the phase and amplitude.
VI. A RF modulator module to allow the output
from two of the synthesizers to be combined and sent to the first gated amplifier. The two synthesizers may be added for a linear combination or multiplied (with an appropriate offset) to produce a Hanning modulated burst.
All control and measurement functions are under computer control and software is provided for many of the more standard measurement techniques used in ultrasonics. The most common SNAP system configurations are listed below.
RITEC, Inc. 60 Alhambra Rd., Suite 5 Warwick, RI 02886 (401) 738-3660 FAX (401) 738-3661
www.RitecInc.com
Page 4 of 20
SNAP-IV-G1 The single channel
broadband SNAP Mark IV configuration, consists of a single gated amplifier, the power frame, the triple synthesizer/ timing module and the broadband receiver module. While this system does not offer the same measurement flexibility as the full SNAP system, it can be easily upgraded with the addition of a second gated amplifier and then with the addition of the superheterodyne modules to a complete SNAP system.
SNAP-G1 The single channel SNAP with
the full super-heterodyne phase sensitive measurement system utilizes the elements listed above, but with only one gated amplifier. It does contain the RF modulator to combine two frequencies into one high power RF output from the gated amplifier.
SNAP-G2 The dual channel SNAP super-
heterodyne phase sensitive measurement system utilizes the elements listed above, including a second gated amplifier to allow for beam mixing applications.
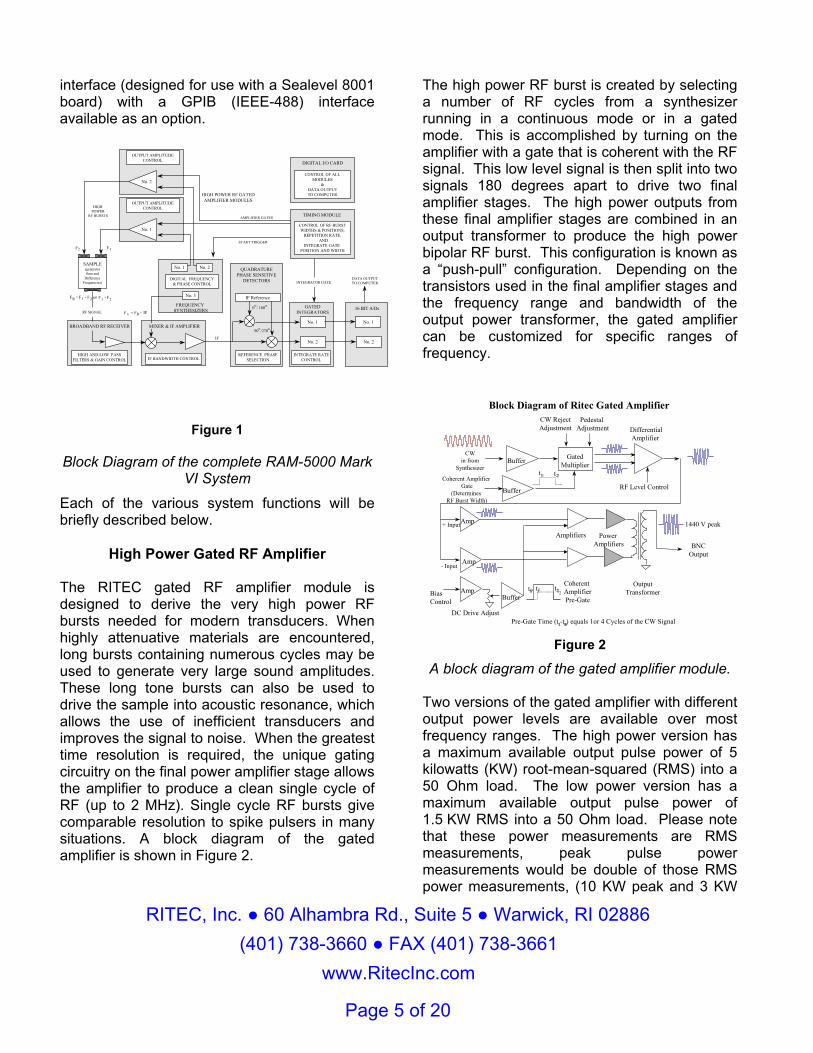
The complete SNAP System, which is shown in a block diagram in Figure 1, is ideal for the nonlinear measurements listed above because the gated amplifiers can provide up to 5 KW RMS pulse power. Because the generation of the sum and difference frequencies in a sample typically requires waves of different frequencies, two direct digital synthesizers have been provided in the SNAP system for precise control of both frequency and phase. The outputs from these synthesizers can be combined to drive one transducer through one gated amplifier or each can be fed to a separate gated amplifier to drive two independent transmitting transducers in experimental situations where a third transducer is used as a receiver. Where only one driving transducer is used, all of the sample material in the acoustic beam will contribute to the generation of the sum or difference
frequency signals. Where two transducers are used to produce two acoustic beams, only the sample material located within the intersection of these beams will contribute to the generation of nonlinear signals. By adjusting the timing of the two gated amplifiers, the intersection of the two beams can be positioned along the length of the sample. Because the signals of interest, which are produced by the nonlinearity of the sample, can occur at frequencies different from that of the transmitted signal, the receiving system must be capable of selecting specific frequencies of interest and rejecting others, which may be much larger in amplitude. To accomplish this goal a superheterodyne receiver has been used in the SNAP system. In a superheterodyne receiver incoming signals are typically first amplified and then converted to an intermediate frequency (IF) through a mixing process with a signal from a third direct digital synthesizer (the local oscillator or LO). There are many advantages to the superheterodyne technique: noise rejection by the IF filter and amplifier, fast selection of incoming signals by the tuning of the LO, convenient shaping of the receiver band pass filters by adjustment of the IF filter, and quadrature phase sensitive detection at a fixed frequency. Phase detection at a single frequency (the IF) reduces the phase errors in the system to approximately 0.3 degrees, instead of the 3 degree (or greater) phase error that occurs in a broadband receiver. Input signals often buried in broadband noise can be easily detected by this receiver permitting the calculation of both the amplitude and phase of the signal. Further noise rejection is provided by feeding the phase detected signals into a matched pair of gated integrators where the gate selects the particular signal to be examined. Following integration the resulting DC voltages, which represent the real and imaginary components of the Fourier transform at the frequency selected by the receiver LO, are digitized in 16 bit analog-to-digital converters for transfer to the computer for analysis. The SNAP system has a 32-bit digital
RITEC, Inc. 60 Alhambra Rd., Suite 5 Warwick, RI 02886 (401) 738-3660 FAX (401) 738-3661
www.RitecInc.com
Page 5 of 20
interface (designed for use with a Sealevel 8001 board) with a GPIB (IEEE-488) interface available as an option.
IF Reference
No. 1
No. 2
No. 1
No. 2
HIGH AND LOW PASSFILTERS & GAIN CONTROL IF BANDWIDTH CONTROL
REFERENCE PHASESELECTION
INTEGRATE RATECONTROL
DIGITAL FREQUENCY& PHASE CONTROL
OUTPUT AMPLITUDECONTROL
90 /270o
o0 / 180
No. 1
HIGH POWER RF GATEDAMPLIFIER MODULES
FREQUENCY SYNTHESIZERS
MIXER & IF AMPLIFIER
QUADRATUREPHASE SENSITIVE
DETECTORS
GATEDINTEGRATORS
16 BIT A/Ds
SAMPLE(generatesSum and
DifferenceFrequencies)
CONTROL OF ALLMODULES
&DATA OUTPUTTO COMPUTER
START TRIGGER
AMPLIFIER GATES
INTEGRATOR GATE
HIGH POWER
RF BURSTS
DIGITAL I/O CARD
o
o
DATA OUTPUTTO COMPUTER
No. 1 No. 2
No. 3
CONTROL OF RF BURSTWIDTHS & POSITIONS,
REPETITION RATE,AND
INTEGRATE GATE POSITION AND WIDTH
TIMING MODULE
OUTPUT AMPLITUDECONTROL
No. 2
F 1F2
IF
= FR + IFF 3
F1 - F2=FR F1 +F2or
BROADBAND RF RECEIVER
RF SIGNAL
Figure 1
Block Diagram of the complete RAM-5000 Mark VI System
Each of the various system functions will be briefly described below.
High Power Gated RF Amplifier
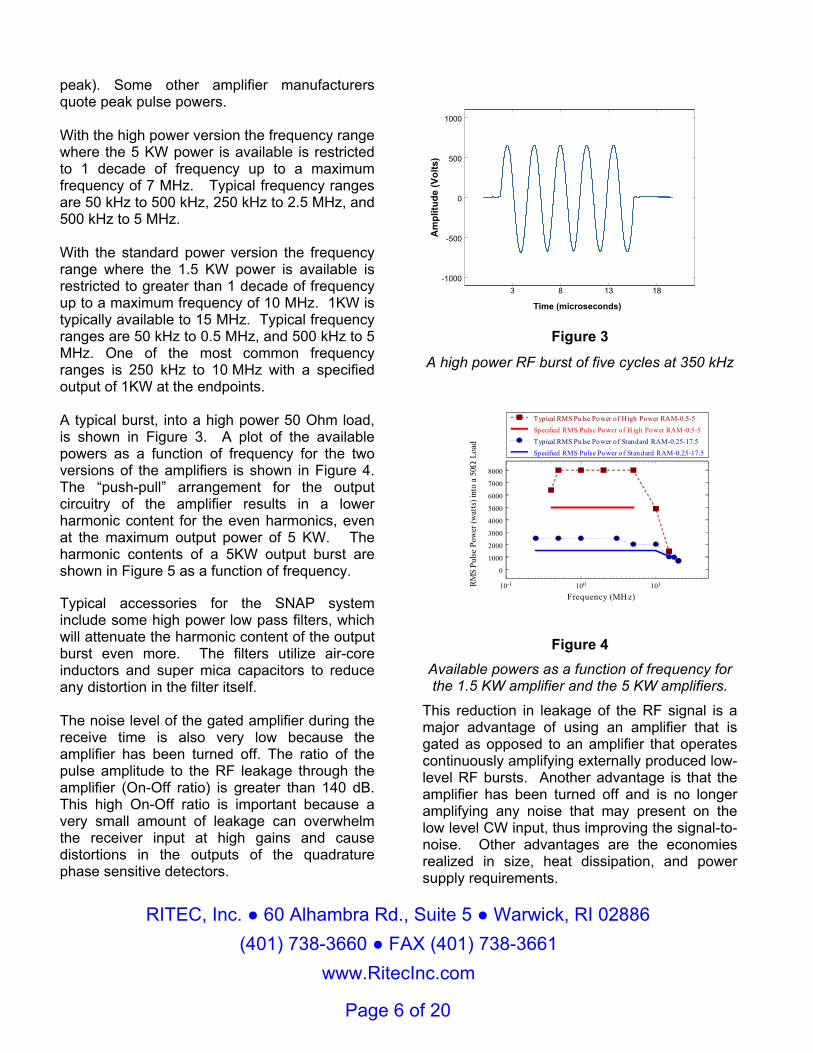
The RITEC gated RF amplifier module is designed to derive the very high power RF bursts needed for modern transducers. When highly attenuative materials are encountered, long bursts containing numerous cycles may be used to generate very large sound amplitudes. These long tone bursts can also be used to drive the sample into acoustic resonance, which allows the use of inefficient transducers and improves the signal to noise. When the greatest time resolution is required, the unique gating circuitry on the final power amplifier stage allows the amplifier to produce a clean single cycle of RF (up to 2 MHz). Single cycle RF bursts give comparable resolution to spike pulsers in many situations. A block diagram of the gated amplifier is shown in Figure 2.
The high power RF burst is created by selecting a number of RF cycles from a synthesizer running in a continuous mode or in a gated mode. This is accomplished by turning on the amplifier with a gate that is coherent with the RF signal. This low level signal is then split into two signals 180 degrees apart to drive two final amplifier stages. The high power outputs from these final amplifier stages are combined in an output transformer to produce the high power bipolar RF burst. This configuration is known as a “push-pull” configuration. Depending on the transistors used in the final amplifier stages and the frequency range and bandwidth of the output power transformer, the gated amplifier can be customized for specific ranges of frequency.
Pre-Gate Time (t -t ) equals 1or 4 Cycles of the CW Signal
BNCOutput
BufferCW
in fromSynthesizer
GatedMultiplier
CW RejectAdjustment
Pedestal Adjustment
RF Level Control
DifferentialAmplifier
Buffer
Coherent Amplifier Gate
(Determines RF Burst Width)
AmpBuffer
DC Drive Adjust
Coherent AmplifierPre-Gate
Amplifiers Power Amplifiers
OutputTransformer
1440 V peakAmp
Amp
+ Input
- Input
t1 t2
t2t1t0
01
Block Diagram of Ritec Gated Amplifier
BiasControl
1 0
1022
21
Figure 2
A block diagram of the gated amplifier module.
Two versions of the gated amplifier with different output power levels are available over most frequency ranges. The high power version has a maximum available output pulse power of 5 kilowatts (KW) root-mean-squared (RMS) into a 50 Ohm load. The low power version has a maximum available output pulse power of 1.5 KW RMS into a 50 Ohm load. Please note that these power measurements are RMS measurements, peak pulse power measurements would be double of those RMS power measurements, (10 KW peak and 3 KW
RITEC, Inc. 60 Alhambra Rd., Suite 5 Warwick, RI 02886 (401) 738-3660 FAX (401) 738-3661
www.RitecInc.com
Page 6 of 20
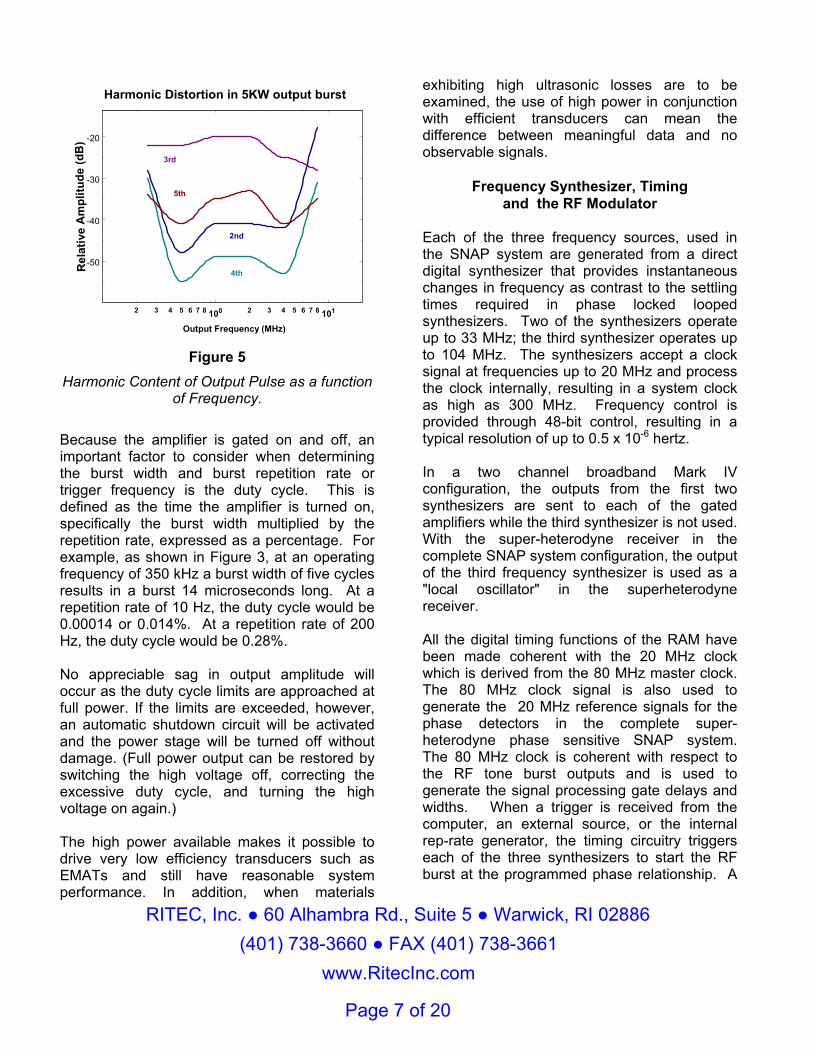
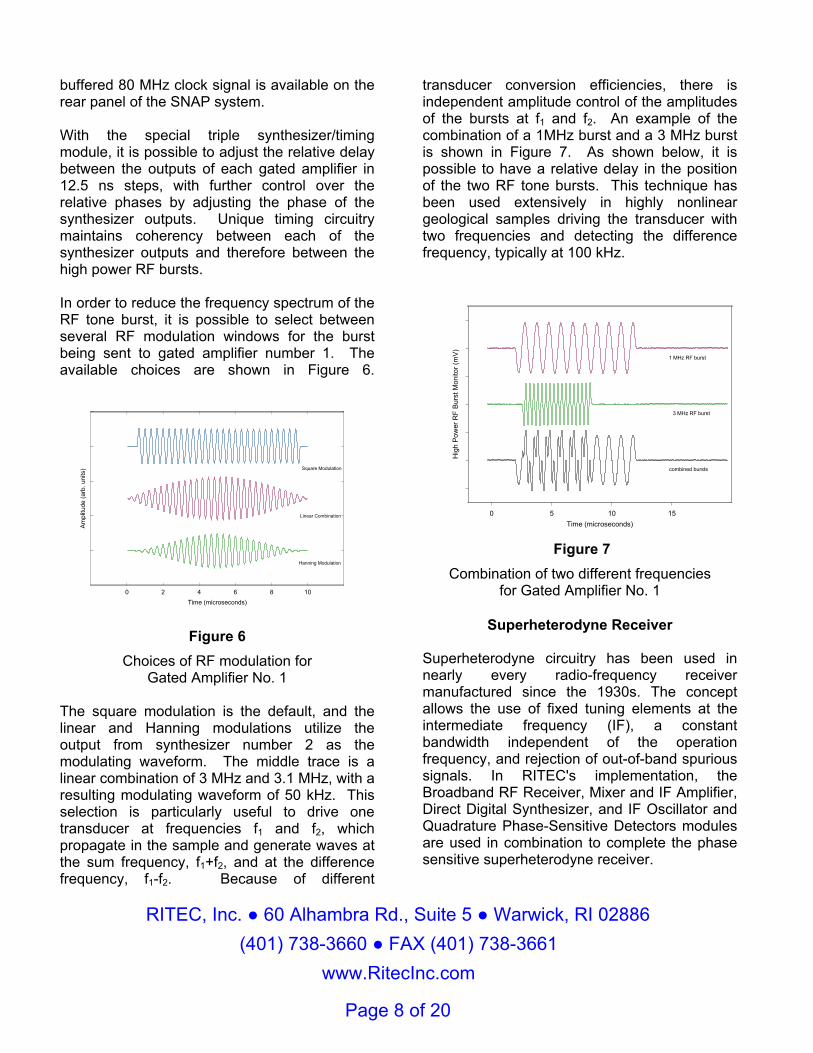
peak). Some other amplifier manufacturers quote peak pulse powers. With the high power version the frequency range where the 5 KW power is available is restricted to 1 decade of frequency up to a maximum frequency of 7 MHz. Typical frequency ranges are 50 kHz to 500 kHz, 250 kHz to 2.5 MHz, and 500 kHz to 5 MHz. With the standard power version the frequency range where the 1.5 KW power is available is restricted to greater than 1 decade of frequency up to a maximum frequency of 10 MHz. 1KW is typically available to 15 MHz. Typical frequency ranges are 50 kHz to 0.5 MHz, and 500 kHz to 5 MHz. One of the most common frequency ranges is 250 kHz to 10 MHz with a specified output of 1KW at the endpoints. A typical burst, into a high power 50 Ohm load, is shown in Figure 3. A plot of the available powers as a function of frequency for the two versions of the amplifiers is shown in Figure 4. The “push-pull” arrangement for the output circuitry of the amplifier results in a lower harmonic content for the even harmonics, even at the maximum output power of 5 KW. The harmonic contents of a 5KW output burst are shown in Figure 5 as a function of frequency. Typical accessories for the SNAP system include some high power low pass filters, which will attenuate the harmonic content of the output burst even more. The filters utilize air-core inductors and super mica capacitors to reduce any distortion in the filter itself. The noise level of the gated amplifier during the receive time is also very low because the amplifier has been turned off. The ratio of the pulse amplitude to the RF leakage through the amplifier (On-Off ratio) is greater than 140 dB. This high On-Off ratio is important because a very small amount of leakage can overwhelm the receiver input at high gains and cause distortions in the outputs of the quadrature phase sensitive detectors.
3 8 13 18
Time (microseconds)
-1000
-500
0
500
1000
Am
plitu
de (V
olts
)
Figure 3
A high power RF burst of five cycles at 350 kHz
10-1 100 101
Frequency (MH z)
0
1000
2000
3000
4000
5000
6000
7000
8000RM
S Pu
lse P
ower
(wat
ts) i
nto
a 50
Ω L
oad
Typical RMS Pulse Power of H igh Power RAM-0.5-5Specified RMS Pulse Power of H igh Power RAM-0.5-5Typical RMS Pulse Power of Standard RAM-0.25-17.5Specified RMS Pulse Power of Standard RAM-0.25-17.5
Figure 4 Available powers as a function of frequency for the 1.5 KW amplifier and the 5 KW amplifiers.
This reduction in leakage of the RF signal is a major advantage of using an amplifier that is gated as opposed to an amplifier that operates continuously amplifying externally produced low-level RF bursts. Another advantage is that the amplifier has been turned off and is no longer amplifying any noise that may present on the low level CW input, thus improving the signal-to-noise. Other advantages are the economies realized in size, heat dissipation, and power supply requirements.
RITEC, Inc. 60 Alhambra Rd., Suite 5 Warwick, RI 02886 (401) 738-3660 FAX (401) 738-3661
www.RitecInc.com
Page 7 of 20
100 1012 3 4 5 6 7 8 2 3 4 5 6 7 8
Output Frequency (MHz)
-50
-40
-30
-20
Rel
ativ
e A
mpl
itude
(dB
)
3rd
5th
2nd
4th
Harmonic Distortion in 5KW output burst
Figure 5
Harmonic Content of Output Pulse as a function of Frequency.
Because the amplifier is gated on and off, an important factor to consider when determining the burst width and burst repetition rate or trigger frequency is the duty cycle. This is defined as the time the amplifier is turned on, specifically the burst width multiplied by the repetition rate, expressed as a percentage. For example, as shown in Figure 3, at an operating frequency of 350 kHz a burst width of five cycles results in a burst 14 microseconds long. At a repetition rate of 10 Hz, the duty cycle would be 0.00014 or 0.014%. At a repetition rate of 200 Hz, the duty cycle would be 0.28%. No appreciable sag in output amplitude will occur as the duty cycle limits are approached at full power. If the limits are exceeded, however, an automatic shutdown circuit will be activated and the power stage will be turned off without damage. (Full power output can be restored by switching the high voltage off, correcting the excessive duty cycle, and turning the high voltage on again.) The high power available makes it possible to drive very low efficiency transducers such as EMATs and still have reasonable system performance. In addition, when materials
exhibiting high ultrasonic losses are to be examined, the use of high power in conjunction with efficient transducers can mean the difference between meaningful data and no observable signals.
Frequency Synthesizer, Timing
and the RF Modulator
Each of the three frequency sources, used in the SNAP system are generated from a direct digital synthesizer that provides instantaneous changes in frequency as contrast to the settling times required in phase locked looped synthesizers. Two of the synthesizers operate up to 33 MHz; the third synthesizer operates up to 104 MHz. The synthesizers accept a clock signal at frequencies up to 20 MHz and process the clock internally, resulting in a system clock as high as 300 MHz. Frequency control is provided through 48-bit control, resulting in a typical resolution of up to 0.5 x 10⁻⁶ hertz. In a two channel broadband Mark IV configuration, the outputs from the first two synthesizers are sent to each of the gated amplifiers while the third synthesizer is not used. With the super-heterodyne receiver in the complete SNAP system configuration, the output of the third frequency synthesizer is used as a "local oscillator" in the superheterodyne receiver. All the digital timing functions of the RAM have been made coherent with the 20 MHz clock which is derived from the 80 MHz master clock. The 80 MHz clock signal is also used to generate the 20 MHz reference signals for the phase detectors in the complete super-heterodyne phase sensitive SNAP system. The 80 MHz clock is coherent with respect to the RF tone burst outputs and is used to generate the signal processing gate delays and widths. When a trigger is received from the computer, an external source, or the internal rep-rate generator, the timing circuitry triggers each of the three synthesizers to start the RF burst at the programmed phase relationship. A
RITEC, Inc. 60 Alhambra Rd., Suite 5 Warwick, RI 02886 (401) 738-3660 FAX (401) 738-3661
www.RitecInc.com
Page 8 of 20
buffered 80 MHz clock signal is available on the rear panel of the SNAP system. With the special triple synthesizer/timing module, it is possible to adjust the relative delay between the outputs of each gated amplifier in 12.5 ns steps, with further control over the relative phases by adjusting the phase of the synthesizer outputs. Unique timing circuitry maintains coherency between each of the synthesizer outputs and therefore between the high power RF bursts. In order to reduce the frequency spectrum of the RF tone burst, it is possible to select between several RF modulation windows for the burst being sent to gated amplifier number 1. The available choices are shown in Figure 6.
0 2 4 6 8 10Time (microseconds)
Ampl
itude
(arb
. uni
ts) Square Modulation
Linear Combination
Hanning Modulation
Figure 6
Choices of RF modulation for Gated Amplifier No. 1
The square modulation is the default, and the linear and Hanning modulations utilize the output from synthesizer number 2 as the modulating waveform. The middle trace is a linear combination of 3 MHz and 3.1 MHz, with a resulting modulating waveform of 50 kHz. This selection is particularly useful to drive one transducer at frequencies f1 and f2, which propagate in the sample and generate waves at the sum frequency, f1+f2, and at the difference frequency, f1-f2. Because of different
transducer conversion efficiencies, there is independent amplitude control of the amplitudes of the bursts at f1 and f2. An example of the combination of a 1MHz burst and a 3 MHz burst is shown in Figure 7. As shown below, it is possible to have a relative delay in the position of the two RF tone bursts. This technique has been used extensively in highly nonlinear geological samples driving the transducer with two frequencies and detecting the difference frequency, typically at 100 kHz.
0 5 10 15Time (microseconds)
Hig
h Po
wer
RF
Burs
t Mon
itor (
mV)
combined bursts
1 MHz RF burst
3 MHz RF burst
Figure 7 Combination of two different frequencies
for Gated Amplifier No. 1
Superheterodyne Receiver Superheterodyne circuitry has been used in nearly every radio-frequency receiver manufactured since the 1930s. The concept allows the use of fixed tuning elements at the intermediate frequency (IF), a constant bandwidth independent of the operation frequency, and rejection of out-of-band spurious signals. In RITEC's implementation, the Broadband RF Receiver, Mixer and IF Amplifier, Direct Digital Synthesizer, and IF Oscillator and Quadrature Phase-Sensitive Detectors modules are used in combination to complete the phase sensitive superheterodyne receiver.
RITEC, Inc. 60 Alhambra Rd., Suite 5 Warwick, RI 02886 (401) 738-3660 FAX (401) 738-3661
www.RitecInc.com
Page 9 of 20
The adjustment of the phase sensitive detection circuitry is also simplified because the multiplication process occurs at the fixed IF frequency. Specifically, the reference outputs from the IF oscillator are adjusted as closely as possible to quadrature (90º) before being applied to the phase sensitive detection multiplier circuits.
Broadband Receiver
The digital control of gain in two dB steps makes possible accurate, repeatable measurements of signal strength, and low noise, high gain external pre-amplifiers are available for use when weak signals are encountered. The addition of adjustable high-pass (typically at either 50 kHz or 250 kHz, depending on the frequency configuration, 1 and 4 MHz), and low-pass filters, (typically at 20, 40 and 80 MHz) makes this one of the most versatile receiving systems available for ultrasonic research.
Quadrature Phase Sensitive Detection and Analog Integration
One of the significant innovations of the SNAP is a signal processing technique that involves the use of both quadrature phase sensitive detection and gated analog integrators. Quadrature detection allows signals to be processed in much the same way as is done with a vector voltmeter. The two detector (multiplier) circuits produce two orthogonal vector components (real and imaginary) of the signal from which the amplitude and phase angle can be calculated. To gain more insight into the operation of the phase-sensitive receiver circuitry, it is instructive to consider the received ultrasonic information as a monochromatic signal at frequency (fr) modulated by a term, which defines the width, amplitude, and shape of the received signal, Ar(t). ) + tf(2(t)A = f(t) rrr φπsin (1)
After conversion to the intermediate frequency, the received signal can be processed in the phase detectors. The output of the Phase Detector No. 1 is given by: φ rr3 (t)Ag =tD sin)(1 (2) where the total gain and conversion efficiencies are all included in the term g3. The output of Phase Detector No. 2 is given by:
φ rr3 (t)Ag =tD cos)(2 (3)
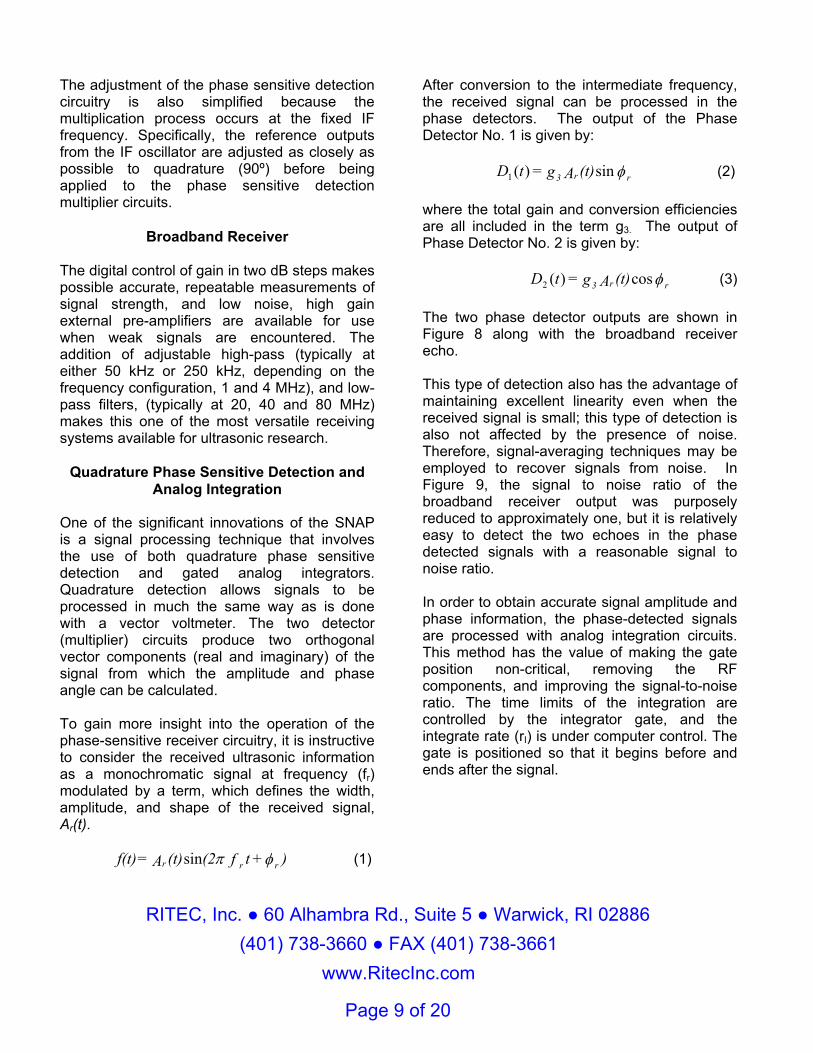
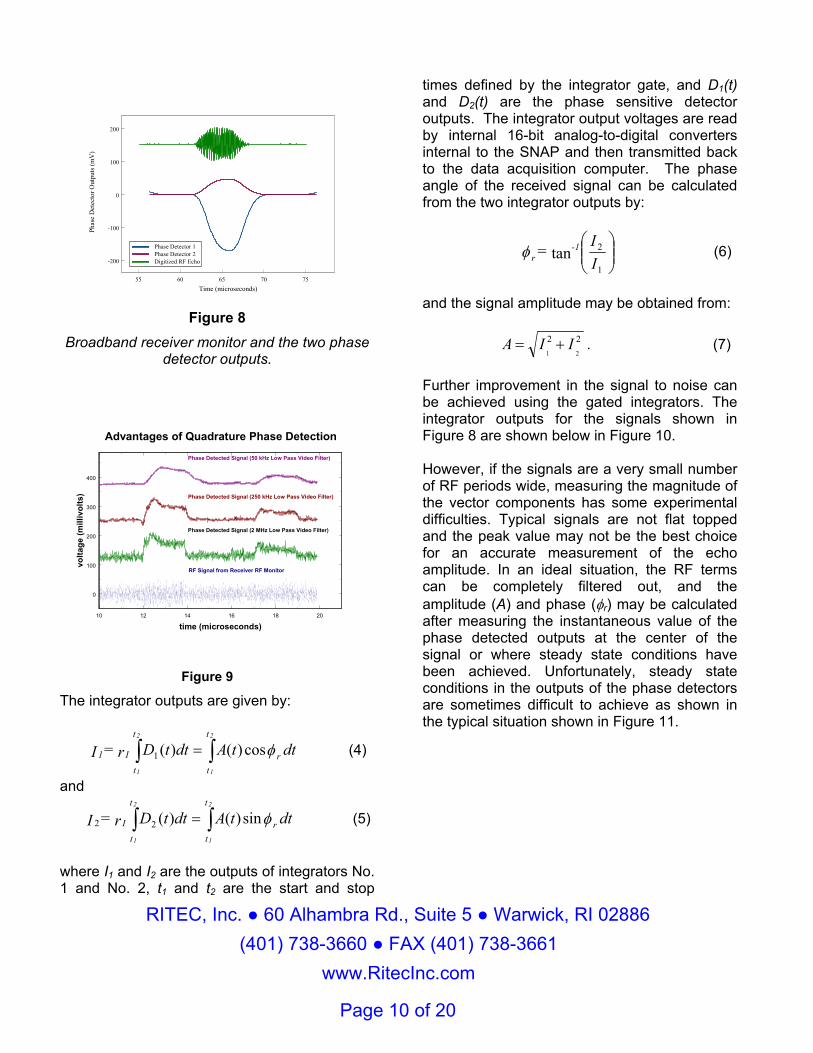
The two phase detector outputs are shown in Figure 8 along with the broadband receiver echo. This type of detection also has the advantage of maintaining excellent linearity even when the received signal is small; this type of detection is also not affected by the presence of noise. Therefore, signal-averaging techniques may be employed to recover signals from noise. In Figure 9, the signal to noise ratio of the broadband receiver output was purposely reduced to approximately one, but it is relatively easy to detect the two echoes in the phase detected signals with a reasonable signal to noise ratio. In order to obtain accurate signal amplitude and phase information, the phase-detected signals are processed with analog integration circuits. This method has the value of making the gate position non-critical, removing the RF components, and improving the signal-to-noise ratio. The time limits of the integration are controlled by the integrator gate, and the integrate rate (rI) is under computer control. The gate is positioned so that it begins before and ends after the signal.
RITEC, Inc. 60 Alhambra Rd., Suite 5 Warwick, RI 02886 (401) 738-3660 FAX (401) 738-3661
www.RitecInc.com
Page 10 of 20
55 60 65 70 75Time (microseconds)
-200
-100
0
100
200
Phas
e D
etec
tor O
utpu
ts (m
V)
Phase Detector 1Phase Detector 2Digitized RF Echo
Figure 8
Broadband receiver monitor and the two phase detector outputs.
10 12 14 16 18 20
time (microseconds)
0
100
200
300
400
volta
ge (m
illiv
olts
)
RF Signal from Receiver RF Monitor
Phase Detected Signal (2 MHz Low Pass Video Filter)
Phase Detected Signal (250 kHz Low Pass Video Filter)
Phase Detected Signal (50 kHz Low Pass Video Filter)
Advantages of Quadrature Phase Detection
Figure 9 The integrator outputs are given by:
dttAdttD r = I r
t
t
t
t
I1
2
1
2
1
φcos)()(1 ∫∫ = (4)
and
dttAdttD r = I r
t
t
t
t
I
2
1
2
1
φsin)()(22 ∫∫ = (5)
where I1 and I2 are the outputs of integrators No. 1 and No. 2, t1 and t2 are the start and stop
times defined by the integrator gate, and D1(t) and D2(t) are the phase sensitive detector outputs. The integrator output voltages are read by internal 16-bit analog-to-digital converters internal to the SNAP and then transmitted back to the data acquisition computer. The phase angle of the received signal can be calculated from the two integrator outputs by:
1
2tanII = 1-
rφ (6)
and the signal amplitude may be obtained from: 22
21IIA += . (7)
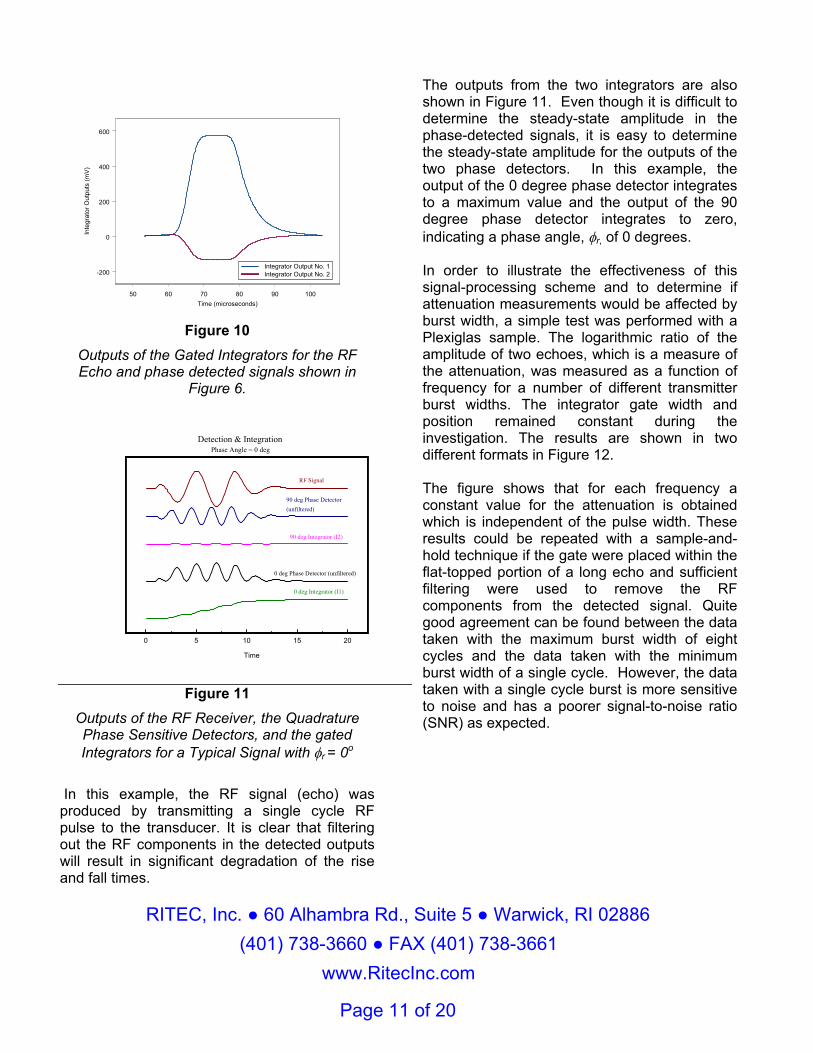
Further improvement in the signal to noise can be achieved using the gated integrators. The integrator outputs for the signals shown in Figure 8 are shown below in Figure 10. However, if the signals are a very small number of RF periods wide, measuring the magnitude of the vector components has some experimental difficulties. Typical signals are not flat topped and the peak value may not be the best choice for an accurate measurement of the echo amplitude. In an ideal situation, the RF terms can be completely filtered out, and the amplitude (A) and phase (φr) may be calculated after measuring the instantaneous value of the phase detected outputs at the center of the signal or where steady state conditions have been achieved. Unfortunately, steady state conditions in the outputs of the phase detectors are sometimes difficult to achieve as shown in the typical situation shown in Figure 11.
RITEC, Inc. 60 Alhambra Rd., Suite 5 Warwick, RI 02886 (401) 738-3660 FAX (401) 738-3661
www.RitecInc.com
Page 11 of 20
50 60 70 80 90 100Time (microseconds)
-200
0
200
400
600
Inte
grat
or O
utpu
ts (m
V)
Integrator Output No. 1Integrator Output No. 2
Figure 10 Outputs of the Gated Integrators for the RF Echo and phase detected signals shown in
Figure 6.
0 5 10 15 20
Time
RF Signal
90 deg Phase Detector (unfiltered)
90 deg Integrator (I2)
0 deg Integrator (I1)
0 deg Phase Detector (unfiltered)
Detection & IntegrationPhase Angle = 0 deg
Figure 11 Outputs of the RF Receiver, the Quadrature Phase Sensitive Detectors, and the gated Integrators for a Typical Signal with φr = 0o
In this example, the RF signal (echo) was produced by transmitting a single cycle RF pulse to the transducer. It is clear that filtering out the RF components in the detected outputs will result in significant degradation of the rise and fall times.
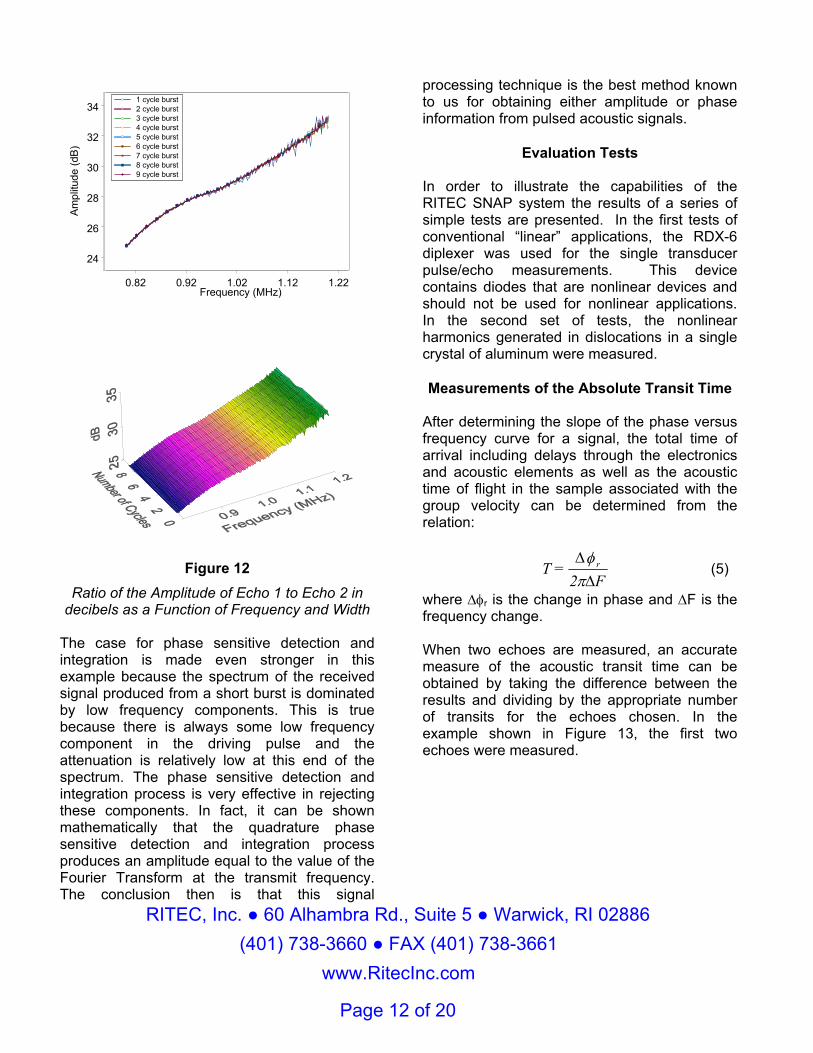
The outputs from the two integrators are also shown in Figure 11. Even though it is difficult to determine the steady-state amplitude in the phase-detected signals, it is easy to determine the steady-state amplitude for the outputs of the two phase detectors. In this example, the output of the 0 degree phase detector integrates to a maximum value and the output of the 90 degree phase detector integrates to zero, indicating a phase angle, φr, of 0 degrees. In order to illustrate the effectiveness of this signal-processing scheme and to determine if attenuation measurements would be affected by burst width, a simple test was performed with a Plexiglas sample. The logarithmic ratio of the amplitude of two echoes, which is a measure of the attenuation, was measured as a function of frequency for a number of different transmitter burst widths. The integrator gate width and position remained constant during the investigation. The results are shown in two different formats in Figure 12. The figure shows that for each frequency a constant value for the attenuation is obtained which is independent of the pulse width. These results could be repeated with a sample-and-hold technique if the gate were placed within the flat-topped portion of a long echo and sufficient filtering were used to remove the RF components from the detected signal. Quite good agreement can be found between the data taken with the maximum burst width of eight cycles and the data taken with the minimum burst width of a single cycle. However, the data taken with a single cycle burst is more sensitive to noise and has a poorer signal-to-noise ratio (SNR) as expected.
RITEC, Inc. 60 Alhambra Rd., Suite 5 Warwick, RI 02886 (401) 738-3660 FAX (401) 738-3661
www.RitecInc.com
Page 12 of 20
0.82 0.92 1.02 1.12 1.22Frequency (MHz)
24
26
28
30
32
34
Ampl
itude
(dB)
1 cycle burst2 cycle burst3 cycle burst4 cycle burst5 cycle burst6 cycle burst7 cycle burst8 cycle burst9 cycle burst
Figure 12
Ratio of the Amplitude of Echo 1 to Echo 2 in decibels as a Function of Frequency and Width
The case for phase sensitive detection and integration is made even stronger in this example because the spectrum of the received signal produced from a short burst is dominated by low frequency components. This is true because there is always some low frequency component in the driving pulse and the attenuation is relatively low at this end of the spectrum. The phase sensitive detection and integration process is very effective in rejecting these components. In fact, it can be shown mathematically that the quadrature phase sensitive detection and integration process produces an amplitude equal to the value of the Fourier Transform at the transmit frequency. The conclusion then is that this signal
processing technique is the best method known to us for obtaining either amplitude or phase information from pulsed acoustic signals.
Evaluation Tests
In order to illustrate the capabilities of the RITEC SNAP system the results of a series of simple tests are presented. In the first tests of conventional “linear” applications, the RDX-6 diplexer was used for the single transducer pulse/echo measurements. This device contains diodes that are nonlinear devices and should not be used for nonlinear applications. In the second set of tests, the nonlinear harmonics generated in dislocations in a single crystal of aluminum were measured.
Measurements of the Absolute Transit Time
After determining the slope of the phase versus frequency curve for a signal, the total time of arrival including delays through the electronics and acoustic elements as well as the acoustic time of flight in the sample associated with the group velocity can be determined from the relation:
F2
= T r
∆∆π
φ (5)
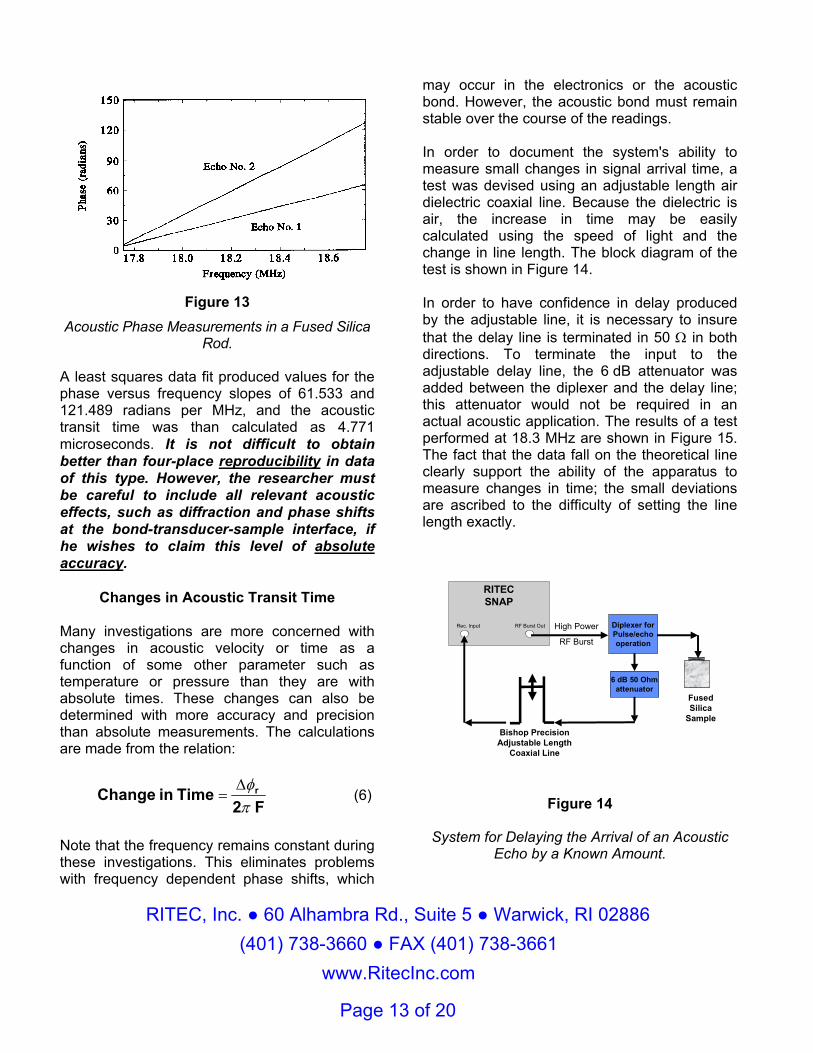
where ∆φr is the change in phase and ∆F is the frequency change. When two echoes are measured, an accurate measure of the acoustic transit time can be obtained by taking the difference between the results and dividing by the appropriate number of transits for the echoes chosen. In the example shown in Figure 13, the first two echoes were measured.
RITEC, Inc. 60 Alhambra Rd., Suite 5 Warwick, RI 02886 (401) 738-3660 FAX (401) 738-3661
www.RitecInc.com
Page 13 of 20
Figure 13
Acoustic Phase Measurements in a Fused Silica Rod.
A least squares data fit produced values for the phase versus frequency slopes of 61.533 and 121.489 radians per MHz, and the acoustic transit time was than calculated as 4.771 microseconds. It is not difficult to obtain better than four-place reproducibility in data of this type. However, the researcher must be careful to include all relevant acoustic effects, such as diffraction and phase shifts at the bond-transducer-sample interface, if he wishes to claim this level of absolute accuracy.
Changes in Acoustic Transit Time
Many investigations are more concerned with changes in acoustic velocity or time as a function of some other parameter such as temperature or pressure than they are with absolute times. These changes can also be determined with more accuracy and precision than absolute measurements. The calculations are made from the relation:
F2
TimeinChange r
πφ∆
= (6)
Note that the frequency remains constant during these investigations. This eliminates problems with frequency dependent phase shifts, which
may occur in the electronics or the acoustic bond. However, the acoustic bond must remain stable over the course of the readings. In order to document the system's ability to measure small changes in signal arrival time, a test was devised using an adjustable length air dielectric coaxial line. Because the dielectric is air, the increase in time may be easily calculated using the speed of light and the change in line length. The block diagram of the test is shown in Figure 14. In order to have confidence in delay produced by the adjustable line, it is necessary to insure that the delay line is terminated in 50 Ω in both directions. To terminate the input to the adjustable delay line, the 6 dB attenuator was added between the diplexer and the delay line; this attenuator would not be required in an actual acoustic application. The results of a test performed at 18.3 MHz are shown in Figure 15. The fact that the data fall on the theoretical line clearly support the ability of the apparatus to measure changes in time; the small deviations are ascribed to the difficulty of setting the line length exactly.
RITECSNAP
Rec. Input RF Burst Out Diplexer forPulse/echooperation
6 dB 50 Ohmattenuator
Bishop Precision Adjustable Length
Coaxial Line
Fused Silica
Sample
High Power
RF Burst
Figure 14
System for Delaying the Arrival of an Acoustic Echo by a Known Amount.
RITEC, Inc. 60 Alhambra Rd., Suite 5 Warwick, RI 02886 (401) 738-3660 FAX (401) 738-3661
www.RitecInc.com
Page 14 of 20
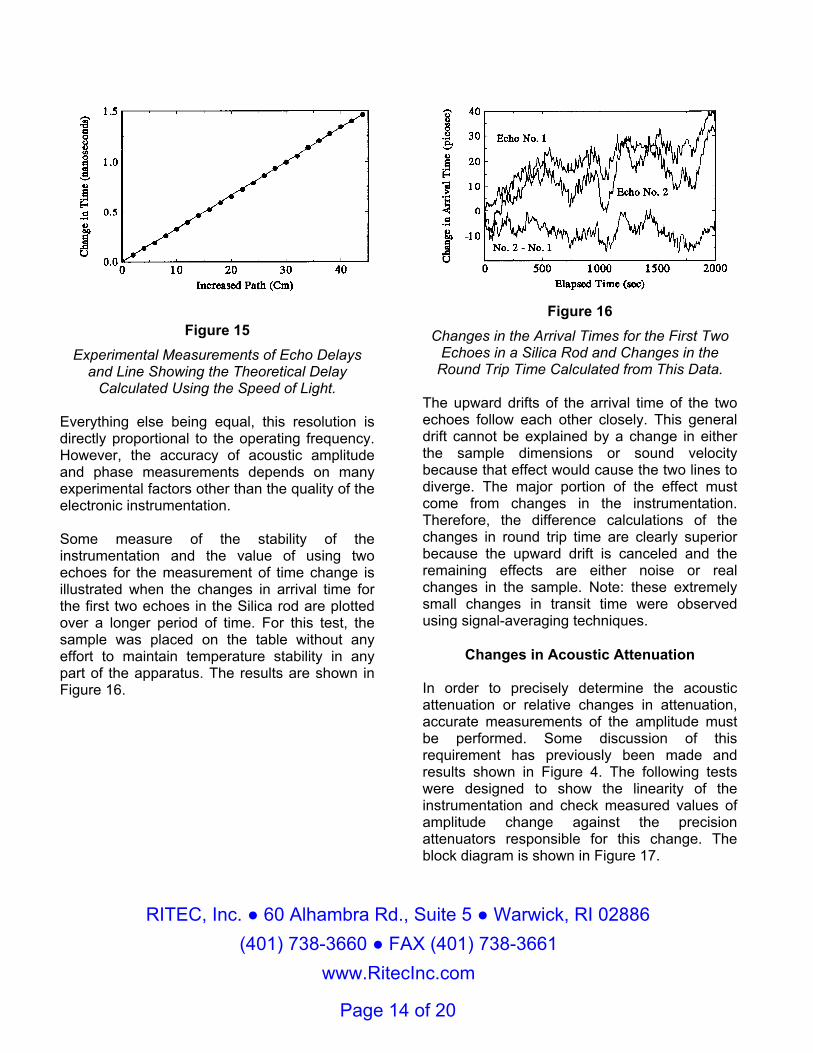
Figure 15 Experimental Measurements of Echo Delays
and Line Showing the Theoretical Delay Calculated Using the Speed of Light.
Everything else being equal, this resolution is directly proportional to the operating frequency. However, the accuracy of acoustic amplitude and phase measurements depends on many experimental factors other than the quality of the electronic instrumentation. Some measure of the stability of the instrumentation and the value of using two echoes for the measurement of time change is illustrated when the changes in arrival time for the first two echoes in the Silica rod are plotted over a longer period of time. For this test, the sample was placed on the table without any effort to maintain temperature stability in any part of the apparatus. The results are shown in Figure 16.
Figure 16
Changes in the Arrival Times for the First Two Echoes in a Silica Rod and Changes in the
Round Trip Time Calculated from This Data. The upward drifts of the arrival time of the two echoes follow each other closely. This general drift cannot be explained by a change in either the sample dimensions or sound velocity because that effect would cause the two lines to diverge. The major portion of the effect must come from changes in the instrumentation. Therefore, the difference calculations of the changes in round trip time are clearly superior because the upward drift is canceled and the remaining effects are either noise or real changes in the sample. Note: these extremely small changes in transit time were observed using signal-averaging techniques.
Changes in Acoustic Attenuation In order to precisely determine the acoustic attenuation or relative changes in attenuation, accurate measurements of the amplitude must be performed. Some discussion of this requirement has previously been made and results shown in Figure 4. The following tests were designed to show the linearity of the instrumentation and check measured values of amplitude change against the precision attenuators responsible for this change. The block diagram is shown in Figure 17.

RITEC, Inc. 60 Alhambra Rd., Suite 5 Warwick, RI 02886 (401) 738-3660 FAX (401) 738-3661
www.RitecInc.com
Page 15 of 20
RITECSNAP
Rec. Input RF Burst Out Diplexer forPulse/echooperation
6 dB 50 Ohmattenuator
Precision Adjustable Attenuator
Fused Silica
Sample
High Power
RF Burst
Figure 17 Setup for Producing Calibrated Changes in
Echo Amplitude In the first test, the attenuator was a precision adjustable wave-guide operating beyond cut-off with an insertion loss of 34 dB and a resolution of 0.02 dB. The data shown in Figure 18 fall close to the theoretical line and agree within the resolution of the attenuator.
Figure 18
Measured Signal Change and Line Showing Expected Result over a 1 dB Range.
The second test was performed using switched attenuators with 10 dB steps and a 0 dB insertion loss. These results are shown in Figure 19.
Figure 19
Measured Signal Change and Line Showing Expected Result over an 80 dB Range.
In this case, the data deviates from what is theoretically expected when a large attenuation is switched into the system. The reason for this discrepancy is most likely improper compensation for CW leakage. However, the signal size with 80 dB inserted is more than an order of magnitude smaller than the bit size of the A/D converter and even with averaging some error is expected.
System Setup for the Measurement of
Harmonics
One important nonlinear acoustic property of materials is the production of higher frequency harmonics from an applied acoustic wave of some fundamental frequency. Typically, for most materials, this fundamental wave has significant finite amplitude. Then as the initially sinusoidal wave propagates, it will distort, generating the second and higher harmonics of the fundamental frequency. Measurements of the amplitudes of these harmonics provide information on the third (and higher) order elastic constants. (Common examples of harmonic generation are the production of sonic booms from supersonic aircraft, large amplitude sound waves in the atmosphere, (so called “N” waves), or thunder from lightning storms.) The measurement of harmonics generated in materials is one of the applications for which the
RITEC, Inc. 60 Alhambra Rd., Suite 5 Warwick, RI 02886 (401) 738-3660 FAX (401) 738-3661
www.RitecInc.com
Page 16 of 20
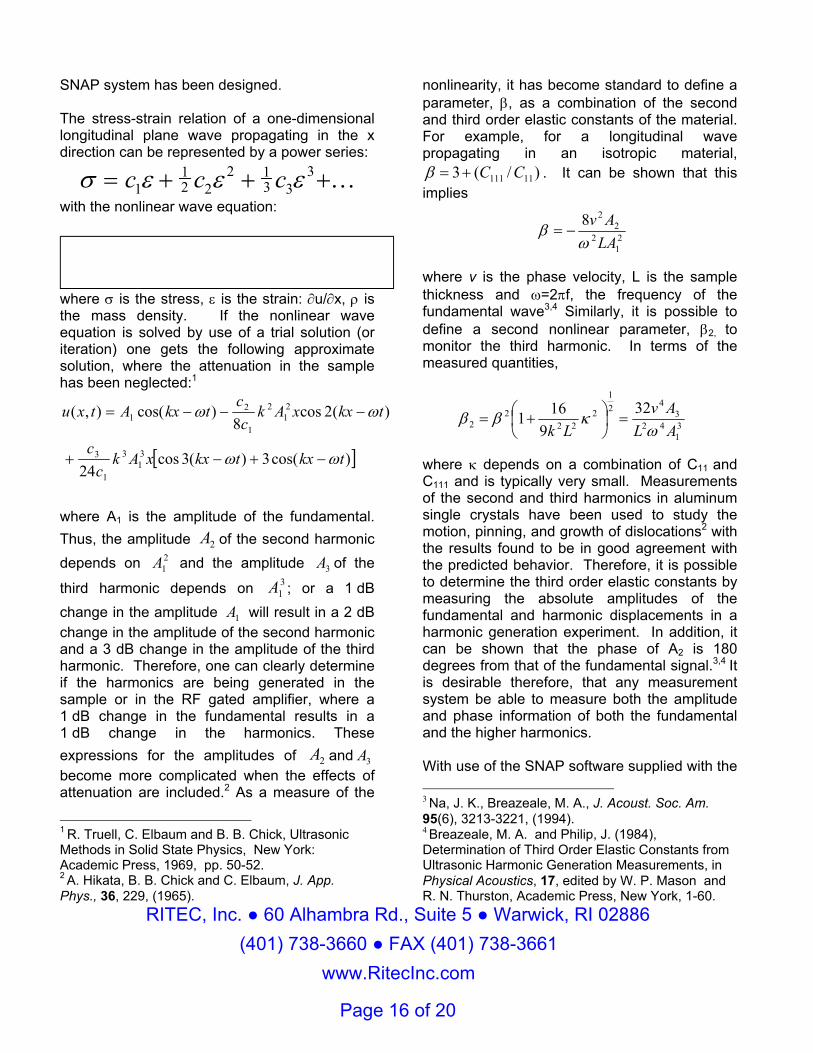
SNAP system has been designed. The stress-strain relation of a one-dimensional longitudinal plane wave propagating in the x direction can be represented by a power series:
σ ε ε ε= + + +c c c112 2
2 13 3
3 K with the nonlinear wave equation:
where σ is the stress, ε is the strain: ∂u/∂x, ρ is the mass density. If the nonlinear wave equation is solved by use of a trial solution (or iteration) one gets the following approximate solution, where the attenuation in the sample has been neglected:1
[ ])cos(3)(3cos24
)(2cos8
)cos(),(
31
3
1
3
21
2
1
21
tkxtkxxAkc
c
tkxxAkc
ctkxAtxu
ωω
ωω
−+−+
−−−=
where A1 is the amplitude of the fundamental. Thus, the amplitude A2 of the second harmonic depends on A1
2 and the amplitude A3 of the
third harmonic depends on A13 ; or a 1 dB
change in the amplitude A1 will result in a 2 dB change in the amplitude of the second harmonic and a 3 dB change in the amplitude of the third harmonic. Therefore, one can clearly determine if the harmonics are being generated in the sample or in the RF gated amplifier, where a 1 dB change in the fundamental results in a 1 dB change in the harmonics. These expressions for the amplitudes of A2 and A3 become more complicated when the effects of attenuation are included.2 As a measure of the
1 R. Truell, C. Elbaum and B. B. Chick, Ultrasonic Methods in Solid State Physics, New York: Academic Press, 1969, pp. 50-52. 2 A. Hikata, B. B. Chick and C. Elbaum, J. App. Phys., 36, 229, (1965).
nonlinearity, it has become standard to define a parameter, β, as a combination of the second and third order elastic constants of the material. For example, for a longitudinal wave propagating in an isotropic material,
)/(3 11111 CC+=β . It can be shown that this implies
where v is the phase velocity, L is the sample thickness and ω=2πf, the frequency of the fundamental wave3,4 Similarly, it is possible to define a second nonlinear parameter, β2, to monitor the third harmonic. In terms of the measured quantities,
where κ depends on a combination of C11 and C111 and is typically very small. Measurements of the second and third harmonics in aluminum single crystals have been used to study the motion, pinning, and growth of dislocations2 with the results found to be in good agreement with the predicted behavior. Therefore, it is possible to determine the third order elastic constants by measuring the absolute amplitudes of the fundamental and harmonic displacements in a harmonic generation experiment. In addition, it can be shown that the phase of A2 is 180 degrees from that of the fundamental signal.3,4 It is desirable therefore, that any measurement system be able to measure both the amplitude and phase information of both the fundamental and the higher harmonics. With use of the SNAP software supplied with the 3 Na, J. K., Breazeale, M. A., J. Acoust. Soc. Am. 95(6), 3213-3221, (1994). 4 Breazeale, M. A. and Philip, J. (1984), Determination of Third Order Elastic Constants from Ultrasonic Harmonic Generation Measurements, in Physical Acoustics, 17, edited by W. P. Mason and R. N. Thurston, Academic Press, New York, 1-60.
21
22
28LAAv
ωβ −=
31
423
421
222
22
329
161ALAv
Lk ωκββ =
+=
RITEC, Inc. 60 Alhambra Rd., Suite 5 Warwick, RI 02886 (401) 738-3660 FAX (401) 738-3661
www.RitecInc.com
Page 17 of 20
instrument, one can make measurements of both the fundamental frequency in the frequency range of .1 MHz to 20 MHz and a harmonic, typically the second or third harmonic, in the frequency range of 0.2 MHz to 44 MHz.
RITECSNAP SYSTEM
Block Diagram for Measurement of the Second and/or Third Harmonics
High Pass Filter forthe Third Harmonic
Low PassFilter
Sample
Third Harmonic
Second Harmonic
-40dBSignal
Sampler
Rec Inputs#1 #2
RA-310 to 7dB in1dB steps
High ZPre-Amp
Ritec Filter DiplexerLow Pass
Filter
RL-50High Power
50 OhmTerm.
RA-320 to 40dB in8 dB steps
RA-6High Power
6 dB
FundamentalFrequency
HarmonicFrequency
RL-50 and RA-6 are necessary for the proper termination of the attenuators.
High PowerRF Pulse Out
Out to Receiver
FromPulser
Out toTrans.
Fundamental andThird Harmonic
Lithium Niobate Single Crystal Transducer for Frequency of the Second Harmonic
Lithium Niobate Single Crystal Transducer for the Fundamental Frequency
Manually select either the Second Harmonic or the Third Harmonic.
-40dB Out
High PassFilter
Second Harmonic
Figure 20
Block Diagram for the Measurement of the Second or Third Harmonics using the Ritec
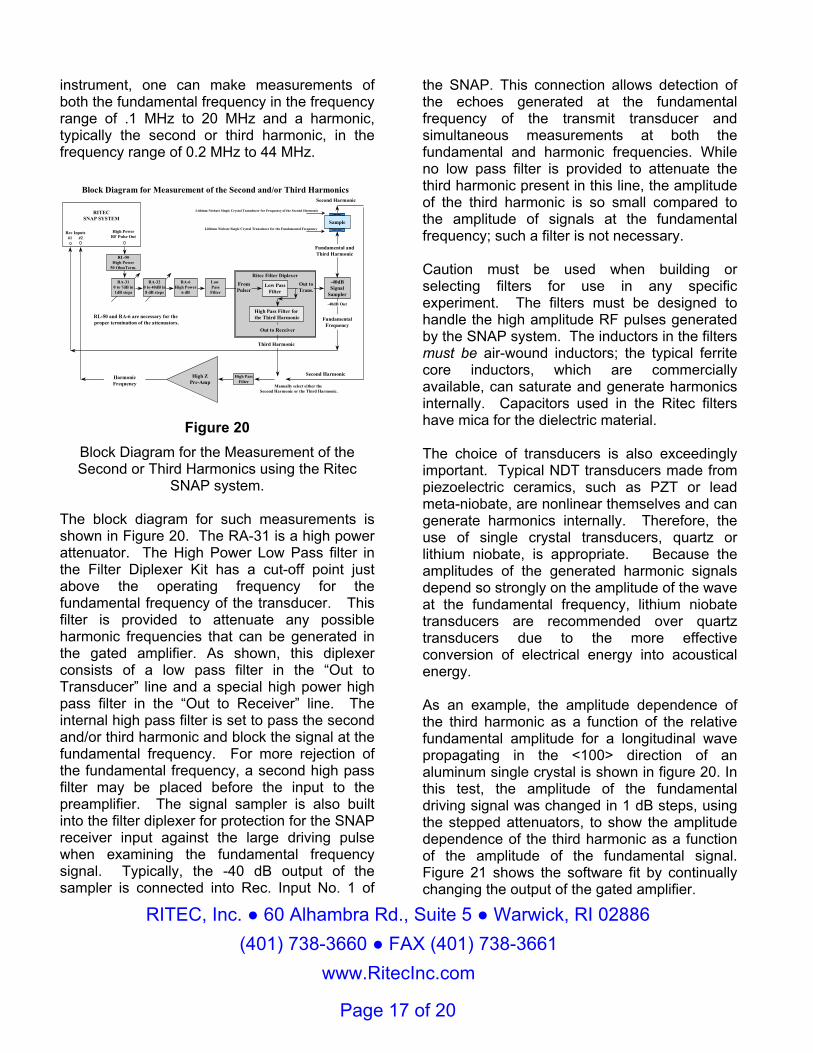
SNAP system. The block diagram for such measurements is shown in Figure 20. The RA-31 is a high power attenuator. The High Power Low Pass filter in the Filter Diplexer Kit has a cut-off point just above the operating frequency for the fundamental frequency of the transducer. This filter is provided to attenuate any possible harmonic frequencies that can be generated in the gated amplifier. As shown, this diplexer consists of a low pass filter in the “Out to Transducer” line and a special high power high pass filter in the “Out to Receiver” line. The internal high pass filter is set to pass the second and/or third harmonic and block the signal at the fundamental frequency. For more rejection of the fundamental frequency, a second high pass filter may be placed before the input to the preamplifier. The signal sampler is also built into the filter diplexer for protection for the SNAP receiver input against the large driving pulse when examining the fundamental frequency signal. Typically, the -40 dB output of the sampler is connected into Rec. Input No. 1 of
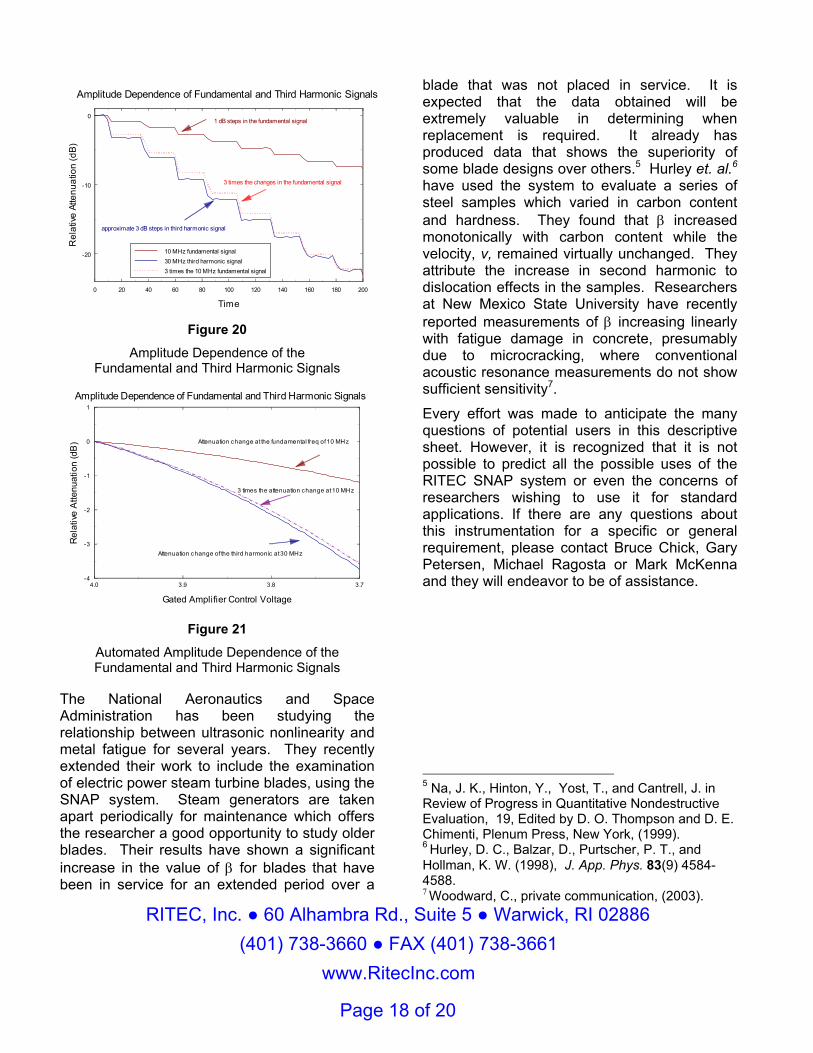
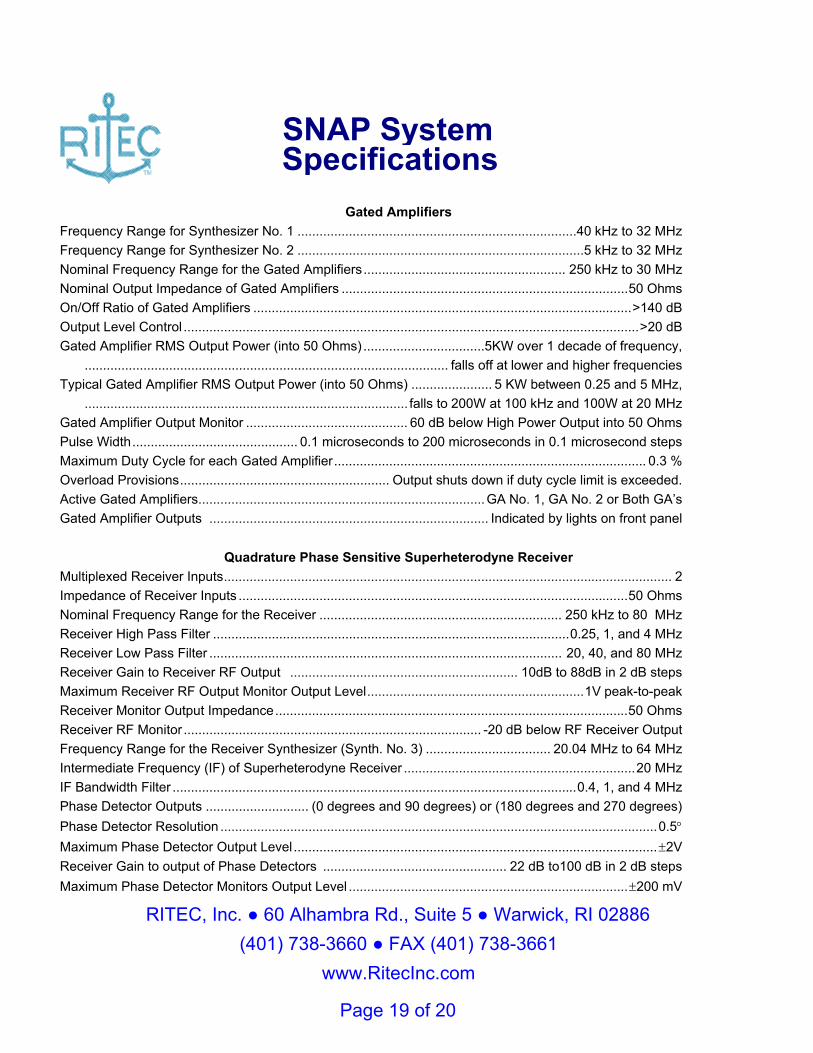
the SNAP. This connection allows detection of the echoes generated at the fundamental frequency of the transmit transducer and simultaneous measurements at both the fundamental and harmonic frequencies. While no low pass filter is provided to attenuate the third harmonic present in this line, the amplitude of the third harmonic is so small compared to the amplitude of signals at the fundamental frequency; such a filter is not necessary. Caution must be used when building or selecting filters for use in any specific experiment. The filters must be designed to handle the high amplitude RF pulses generated by the SNAP system. The inductors in the filters must be air-wound inductors; the typical ferrite core inductors, which are commercially available, can saturate and generate harmonics internally. Capacitors used in the Ritec filters have mica for the dielectric material. The choice of transducers is also exceedingly important. Typical NDT transducers made from piezoelectric ceramics, such as PZT or lead meta-niobate, are nonlinear themselves and can generate harmonics internally. Therefore, the use of single crystal transducers, quartz or lithium niobate, is appropriate. Because the amplitudes of the generated harmonic signals depend so strongly on the amplitude of the wave at the fundamental frequency, lithium niobate transducers are recommended over quartz transducers due to the more effective conversion of electrical energy into acoustical energy. As an example, the amplitude dependence of the third harmonic as a function of the relative fundamental amplitude for a longitudinal wave propagating in the <100> direction of an aluminum single crystal is shown in figure 20. In this test, the amplitude of the fundamental driving signal was changed in 1 dB steps, using the stepped attenuators, to show the amplitude dependence of the third harmonic as a function of the amplitude of the fundamental signal. Figure 21 shows the software fit by continually changing the output of the gated amplifier.
RITEC, Inc. 60 Alhambra Rd., Suite 5 Warwick, RI 02886 (401) 738-3660 FAX (401) 738-3661
www.RitecInc.com
Page 18 of 20
0 20 40 60 80 100 120 140 160 180 200
Time
-20
-10
0
Rel
ative
Atte
nuat
ion
(dB)
1 dB steps in the fundamental signal
approximate 3 dB steps in third harmonic signal
Amplitude Dependence of Fundamental and Third Harmonic Signals
3 times the changes in the fundamental signal
10 MHz fundamental signal30 MHz third harmonic signal3 times the 10 MHz fundamental signal
Figure 20
Amplitude Dependence of the Fundamental and Third Harmonic Signals
4.0 3.9 3.8 3.7
Gated Amplifier Control Voltage
-4
-3
-2
-1
0
1
Rel
ativ
e A
ttenu
atio
n (d
B)
Amplitude Dependence of Fundamental and Third Harmonic Signals
Attenuation change at the fundamental freq of 10 MHz
Attenuation change of the third harmonic at 30 MHz
3 times the attenuation change at 10 MHz
Figure 21
Automated Amplitude Dependence of the Fundamental and Third Harmonic Signals
The National Aeronautics and Space Administration has been studying the relationship between ultrasonic nonlinearity and metal fatigue for several years. They recently extended their work to include the examination of electric power steam turbine blades, using the SNAP system. Steam generators are taken apart periodically for maintenance which offers the researcher a good opportunity to study older blades. Their results have shown a significant increase in the value of β for blades that have been in service for an extended period over a
blade that was not placed in service. It is expected that the data obtained will be extremely valuable in determining when replacement is required. It already has produced data that shows the superiority of some blade designs over others.5 Hurley et. al.6 have used the system to evaluate a series of steel samples which varied in carbon content and hardness. They found that β increased monotonically with carbon content while the velocity, v, remained virtually unchanged. They attribute the increase in second harmonic to dislocation effects in the samples. Researchers at New Mexico State University have recently reported measurements of β increasing linearly with fatigue damage in concrete, presumably due to microcracking, where conventional acoustic resonance measurements do not show sufficient sensitivity7. Every effort was made to anticipate the many questions of potential users in this descriptive sheet. However, it is recognized that it is not possible to predict all the possible uses of the RITEC SNAP system or even the concerns of researchers wishing to use it for standard applications. If there are any questions about this instrumentation for a specific or general requirement, please contact Bruce Chick, Gary Petersen, Michael Ragosta or Mark McKenna and they will endeavor to be of assistance.
5 Na, J. K., Hinton, Y., Yost, T., and Cantrell, J. in Review of Progress in Quantitative Nondestructive Evaluation, 19, Edited by D. O. Thompson and D. E. Chimenti, Plenum Press, New York, (1999). 6 Hurley, D. C., Balzar, D., Purtscher, P. T., and Hollman, K. W. (1998), J. App. Phys. 83(9) 4584-4588. 7 Woodward, C., private communication, (2003).
RITEC, Inc. 60 Alhambra Rd., Suite 5 Warwick, RI 02886 (401) 738-3660 FAX (401) 738-3661
www.RitecInc.com
Page 19 of 20
SNAP System Specifications
Gated Amplifiers Frequency Range for Synthesizer No. 1 ............................................................................40 kHz to 32 MHz Frequency Range for Synthesizer No. 2 ..............................................................................5 kHz to 32 MHz Nominal Frequency Range for the Gated Amplifiers....................................................... 250 kHz to 30 MHz Nominal Output Impedance of Gated Amplifiers ..............................................................................50 Ohms On/Off Ratio of Gated Amplifiers .......................................................................................................>140 dB Output Level Control ............................................................................................................................>20 dB Gated Amplifier RMS Output Power (into 50 Ohms) .................................5KW over 1 decade of frequency, ................................................................................................... falls off at lower and higher frequencies Typical Gated Amplifier RMS Output Power (into 50 Ohms) ...................... 5 KW between 0.25 and 5 MHz, ........................................................................................ falls to 200W at 100 kHz and 100W at 20 MHz Gated Amplifier Output Monitor ............................................ 60 dB below High Power Output into 50 Ohms Pulse Width............................................. 0.1 microseconds to 200 microseconds in 0.1 microsecond steps Maximum Duty Cycle for each Gated Amplifier..................................................................................... 0.3 % Overload Provisions......................................................... Output shuts down if duty cycle limit is exceeded. Active Gated Amplifiers..............................................................................GA No. 1, GA No. 2 or Both GA’s Gated Amplifier Outputs ............................................................................ Indicated by lights on front panel
Quadrature Phase Sensitive Superheterodyne Receiver
Multiplexed Receiver Inputs.......................................................................................................................... 2 Impedance of Receiver Inputs ..........................................................................................................50 Ohms Nominal Frequency Range for the Receiver .................................................................. 250 kHz to 80 MHz Receiver High Pass Filter .................................................................................................0.25, 1, and 4 MHz Receiver Low Pass Filter ................................................................................................ 20, 40, and 80 MHz Receiver Gain to Receiver RF Output .............................................................. 10dB to 88dB in 2 dB steps Maximum Receiver RF Output Monitor Output Level...........................................................1V peak-to-peak Receiver Monitor Output Impedance................................................................................................50 Ohms Receiver RF Monitor ................................................................................. -20 dB below RF Receiver Output Frequency Range for the Receiver Synthesizer (Synth. No. 3) .................................. 20.04 MHz to 64 MHz Intermediate Frequency (IF) of Superheterodyne Receiver ...............................................................20 MHz IF Bandwidth Filter ..............................................................................................................0.4, 1, and 4 MHz Phase Detector Outputs ............................ (0 degrees and 90 degrees) or (180 degrees and 270 degrees) Phase Detector Resolution .......................................................................................................................0.5° Maximum Phase Detector Output Level ...................................................................................................±2V Receiver Gain to output of Phase Detectors .................................................. 22 dB to100 dB in 2 dB steps Maximum Phase Detector Monitors Output Level ............................................................................±200 mV
RITEC, Inc. 60 Alhambra Rd., Suite 5 Warwick, RI 02886 (401) 738-3660 FAX (401) 738-3661
www.RitecInc.com
Page 20 of 20
Phase Detector Video Low Pass Filters ............................................... 50 kHz, 100 kHz, 150 kHz, 250 kHz, ...................................................................................................400 kHz, 800 kHz, 1.5 MHz, 2 MHz Integration Ranges for Gated Integrators ............................................................................. 454 Hz, 769 Hz, ................................. 1.4, 2.4, 4.1, 7.3, 12.2, 21.3, 37, 66.7, 110, 196, 348, 617, 1100 or 2000 kHz Maximum Gated Integrators Output Level................................................................................................±5V Maximum Gated Integrator Output Monitor Level ............................................................................±500 mV
Timing
Synthesizer Clock Frequency.............................................................................................................80 MHz Time Base Frequency (derived from Synthesizer Clock) ...................................................................20 MHz Trigger Source ...............................................................................................Internal, External, or Computer Maximum Internal Trigger Rate ........................................................................................................... 10 kHz Internal Trigger Rate................................................0.17 Hz to 10 kHz in 20 steps (1, 1.7, 2.5, 5 sequence) External Trigger Input ................................................................................................................. Positive TTL Trigger Output............................................................. Positive 5 Volt trigger coherent with start of RF Burst Integrator Gate Width...................................................0.1 to 6,553 microseconds in 0.1 microsecond steps Integrator Gate Delay...................................................0.1 to 6,553 microseconds in 0.1 microsecond steps Integrator Gate Monitor............................................................................................................... Positive TTL Delays for Gated Amplifiers .......................................0.1 to 6,554 microseconds in 0.1 microseconds steps
Measurement Circuits
Measurement Analog-to-Digital Converters (for Measuring Integrator Outputs) ......................................... 3 Resolution (self-calibrating) ....................................................................................................16 bits Diagnostic Analog-to-Digital Converter ........................................................................................................ 1 Multiplexed Inputs ............................................................................................................................ 8 Resolution ..................................................................................................................................8 bits External Sensor Analog Inputs ..................................................................................................................... 2 Maximum External Sensor Input Levels .................................................................................................±5 V
Computer Interface Digital Interface ...................................................................................32-bit TTL (16 bit Input, 16 bit Output) Data Acquisition Card ............................................................................................. Sealevel 8001 PCI board Connector to Digital Interface ................................................................................................D-37 Connector
Cabinet and Power Supply
Cabinet Style ................................................................................ 19-inch rack mount; side panels provided Dimensions .............................................17.5" (44.5 cm) wide, 10.5" (26.7 cm) high, 17.2" (43.7 cm) deep Shipping Weight ......................................................................................... Approximately 50 pounds (23kg) AC Power Requirements ................................................................85 to 240 Volts RMS, 50-60 Hz, ∼200 W AC Power Factor.................................................................................................................................... >99% Auxiliary Power Outputs (-18V,-8V,+8V,+18V,+48V) ................................................................................... 2