smu journal of research
DESCRIPTION
This journal focuses, but is not limited to, the works of our undergraduate body. Created and Published by SMU Honors Research Association.TRANSCRIPT

SMURESEARCH
JournalOf
ISSUE I | 2015

ABOUT the JOURNAL
SMU Honors Research Association, in conjuction with the university’s research community, has come together to highlight the novel works that are found from the stu-dents on our very own campus - students from all interests, backgrounds, and majors. Our organization’s initial goal was to foster a research community at SMU by creating discus-sion and offering opportunities to those interested or already involved in research. Now, as we move into the second anniversary of our organization, we want to begin showcasing the accomplishments of our student body. With this, we welcome you to our first ever SMU Journal of Research.
Special thanks to the SMU Department of Research, Office of Engaged Learning, Dr. Kehoe, Dr. Vik, Mohammad-Hopkins Foundation, and everyone who has helped us
tremendously along the way.

Ideas
are Endless

Founders of SMU Honors Research Association
We started this organization with our own passions and interests at mind. We both began our journey as BRITE Research Scholars here at SMU, which ultimately pushed us into the world of research. Both of us grew in love with Chemistry and its application, with much due credit to our advisors, Dr. Tsarevsky (Zoya’s advisor) and Dr. Zoltowski (Hilary’s advisor). However, at SMU, we often noticed that the spotlight was pointed to athletics, business, or engineering. This often left the truly ingenious researching happening in all fields - in labs and places in every building on campus - in the shadows, unnoticed by students, and underfunded by administration. Our college careers were molded by our research experience, and we want-ed every student to be aware of the research opportunities afforded to them at SMU. For those already involved in research, we wanted to build a community. With this in mind, we set off.
SMU Honors Research Association started with an information session in May 2013. Expecting upwards to (maybe) twenty people, we were extremely shocked that our informa-tional drew in close to a hundred! Fast-foward to today and we are celebrating our second anniversary with this journal and a chartered organization our senior year.
As we pass on this organization and its initiatives to future students, we hope our passion remains embodied in this foundation and our legacy continue to help future students. Research is just a funny way of saying “to search for solutions, create innovation, and answer universal questions”. Immerse yourself in it!
Cheers,
Zoya Mohammad & Hilary HopkinsFounders/Co-Presidents, SMU HRA

Zoya Mohammad is a senior here at Southern Methodist University and will be graduating May 2015. She is a double major in Biology and Chemistry, with a minor in Photography. Her research involved controlled polymer manipula-tion for both biological and commercial applica-tion. She will be attending medical school this Fall at The University of Texas at Houston as a MD/MPH candidate.
Hilary Hopkins is a senior here at Southern Methodist University and will be graduating
May 2015. She is majoring in Biochemistry, with a minor in English. Her research involved the
study of the circadian rythm under biochemical means. She will be attending medical school this Fall at The University of Texas at San Antonio as
a MD/MPH candidate.
ZOYA
Hilary

2014-2015 SMU Honors Research Association
OFFICER BOARD &RESEARCH COUNCIL
MARMcCREARY(Not Pictured)
Mar is the Head of Research Council. She oversees the tasks of the council and works to create the research database.
NEHARAO(Not Pictured)
Neha is the Secretary of HRA. She collects meeting minutes and oversees advertising. She is a environmental engineering major.
My name is Daehee Kim and I am studying Mechanical Engineer-ing with a Pre-Medicine Specialization. I was the Treasurer for SMU Honor Research Association for the 2014-2015 year.
My name is Brooke Davis. I am the Psychol-ogy/Statistics Chair for the Honors Research Association. I am majoring in Psycholo-gy, double minoring in Biomedical Anthropology and Statistics, as well as on the Pre-Veterinary track.
Hi! I’m Purnima, currently a freshman majoring in Biochemistry and Eco-nomics. I served as the Physics Chair for HRA this year and am thrilled to continue my associa-tion with the organization for the years to come!
Kenny is a first-year pre-medical student major-ing in music and English. He has enjoyed working to promote research in the arts and humanities through his position as Liberal Arts Research Co-Chair.

Ben is a Freshman Math and Chemistry double major who is currently the Chemistry chair of HRA. He is also very interested in compu-tational chemistry and biomedical research.
My name is Patrick Arraj. I am a first-year biochemistry major on the pre-med track and I am interested in minoring in Psychology. I am one of the 2014-2015 Liberal Arts Research Chairs in the Honors Research Association and look forward to exposing more SMU students to research opportunities!
AryaMcCARTHY(Not Pictured)
Arya is the Math and Computer Science Chair of the Honors Research Council. Aside from his role as a chair, he is heavily involved in the works of this journal and the organization. He will continue as the 2015-2016 Co-President of HRA.
Sasha is the Biology Chair of the Honors Research Association. She is a double major in Biology and Chemistry. She will continue as the 2015-2016 Co-President of HRA.
2015-2016 Officers Co-Presidents - Sasha Mohammad & Arya McCarthy
Vice President - Daehee KimTreasurer - Hamza Malik
Secretary - Ben Chi
Applications for Research Council chair positions go out in the Fall.

Want to publish or collaborate with this Journal?Need to contact someone who is mentioned in this journal?
Want to publish on the SMU Department of Research blog?Want to learn more about Honors Research Association?
Want to apply to be on the Research Council?Want to become a member?
Email [email protected] are an interdisciplinary organization that supports people of all majors! Ideas are
not limited to science, math, and engineering. We are a community of students in-volved in research or are interested in undergraduate research. Further, SMU has many
sources to fund your ideas to allow them to fruitition. We can help you connect with the right people.

Characterizing Aging Pathways in a Rapid-Aging
Peroxiredoxin MutantKyle Nakatsuka Olena Odnokoz Sveta Radyuk William Orr
Characterizing Aging Pathways in a Rapid-Aging
Peroxiredoxin Mutant
Kyle [email protected]
Olena [email protected]
Sveta [email protected]
William [email protected]
Abstract
Recent developments implicate redox stress as a key regulator of agingvia effects in signaling pathways of molecules with altered redox state.This research investigates the mechanisms of the redox stress theory ofaging in a Drosophila melanogaster model of rapid aging in which twoperodiredoxin genes, dPrx3 and dPrx5, are knocked down. Using age-acquired, temperature-sensitive paralysis experiments, a novel biomarkerof aging adapted from Reenan and Rogina [6], we show that both thedouble mutants and the wild type controls undergo little to no change intemperature sensativity until a marked increase at 50% of age (10 days).These data coincide with our data from lifespan and other biomarkersof aging in double mutants. Since shifts in redox state can affect path-way signaling through modification of signaling molecules, we assayedtranscriptome-wide gene expression using RNAseq to identify any changesin signaling pathways in the double mutants. Functional clustering of genesthat are significantly altered in dPrx3/dPrx5 double mutants comparedto wild type controls shows that the double mutants have altered expres-sion in biological functions relating to immune response, triacylglycerolmetabolism, carbohydrate metabolism, heavy metal processing, and heatshock response. Among genes that fall into these clusters, we identifiednine candidate genes for further investigation by qPCR. The results ofthese experiments may identify the key mechanistic pathways that describehow redox state regulates the aging process.
1 Introduction
As the average human lifespan has increased steadily over the last century, ourpopulation has witnessed a corresponding increase in rates of age-related disease,driving strong interest in the fundamental process underlying aging. Agingentails an accumulation of damage to cells, tissues, and organs, accompanied byincreased frailty and a decline in physiological functions. Research into the cellsignaling pathways associated with aging in several model organisms has revealed

a complex process that intersects with multiple other systems including immunity,circadian rhythms, cancer, and redox state. Multidisciplinary approaches tounderstanding the aging process—organismal biology, cell biology, genetics, andbiochemistry—promise a better understanding of the aging process, which inturn could eventually help to extend lifespan and health in humans [3].
One promising approach to investigating the aging process is to study or-ganisms with altered rates of aging. Genetic mutations that result in rapidor slowed aging allow an investigator to study the role of discrete processes(e.g. the mutated gene/pathway) in aging. This approach has been used inmultiple organisms including D. melanogaster to elucidate the mechanisms ofboth targeted and previously unknown mechanisms [1].
The premise of studying rapid or delayed-aging mutants is that these organ-isms, easily identified by their aberrant lifespan, can reveal difficult-to-predictmechanisms that control the rate of aging in “normal”, wild-type organisms.The mutation offers a replicable experimental “treatment” that can be comparedwith wild-type controls identify phenotypic differences driven by the mutation.Studying the nature of those phenotypic differences can give valuable insightsinto the mechanisms by which mutated gene or pathway affect the rate of aging.
We utilize this approach to investigate an interesting rapid-aging Drosophilamelanogaster genetic mutant discovered in our lab. In these flies, the knockdownof two mitochondrial peroxiredoxins 3 and 5 (dPrx3, dPrx5) by RNAi and geneknockout, respectively, results in a dramatic reduction in lifespan (Figure 1).These peroxiredoxins regulate mitochondrial and cellular redox state throughcatalytic removal of hydrogen and organic peroxides, and seem to play a majorrole in the redox stress theory of aging [7]. The popular redox stress theory ofaging suggests that reactive oxygen species generated in the mitochondria duringcellular respiration drive aging by causing oxidative damage and disrupting redoxsignaling. Peroxiredoxins stem the disruptive effect of reactive oxygen species,but downregulating them in our double mutants may be accelerating the agingprocess through some yet unknown mechanisms [5, 7].
Based on this information, this research attempts to better understand themechanisms by which these peroxiredoxin double mutations lead to the observedshort-lifespan phenotype. Here, we present two approaches to understandingthe mechanisms of aging in the peroxiredoxin double mutant. First, we pro-vide a physiological measure of age-associated neurodegeneration in the doublemutants through a temperature-sensitive paralysis assay adapted from Reenanand Rogina [6]. Second, we look at genome-wide changes in expression in thedouble mutants to identify the functional pathways that are altered in doublemutants. This genome-wide approach, enabled by RNAseq and the Database forAnnotation, Visualization and Integrated Discovery (DAVID) allow us to identifythe genes and pathways responsible for rapid aging in the double mutants. Inthis way, we hope to better understand exactly how peroxiredoxins may be linkedto aging, which will offer us a better understanding of the redox signaling theoryof aging.

Figure 1: Time to recovery from temperature-sensitive paralysis increases across anorganisms lifetime in all three strains tested. The experimental dPrx3/dPrx5 doublemutants (red) demonstrate a dramatic increase at 10 days, around 45% of lifespan,while a background-matched wt/da,dPrx5 control and yellow white control flies show agradual increase across their lifespan. Error bars represent 95% confidence intervals(df = 10).
2 Results
We characterized the aging process across the lifespan of our short-lived per-oxiredoxin double mutants on an organismal level by a temperature sensitiveparalysis assay and on a molecular level by RNAseq.
2.1 Temperature-Sensitive Paralysis
As organisms age, they become more susceptible to paralysis as a result ofdeclining voltage-gated sodium channel transmission. We adapted an organismalbiomarker of neurodegeneration from Reenan and Rogina [6] to measure thischange in voltage-gated sodium channel transmission over time. While Reenanand Rogina’s assay measures temperature-sensitive paralysis by counting thenumber of flies paralyzed after 30 seconds at elevated temperature, we adaptedthe assay to measure the time it took for flies to recover from paralysis after 30seconds at an elevated temperature. Using time to recovery instead of numberof flies puts our variable of interest on a more meaningful interval scale, ratherthan the categorical scale of the original method.
Using this new adapted method, we determined that double mutant fliesdemonstrated little change in temperature-sensitive paralysis from days 1–9, butexperienced a dramatic increase at 10 days, or around 50% of their maximallifespan. This pattern is somewhat similar to the background-matched control(wt/da,dPrx5) and yellow white flies, which demonstrated gradual increase acrossthree time points (Figure 1). Low sample sizes and non-matching time points

prevented statistical tests of significance, but ongoing tests on a larger scaleseem to confirm the data so far. These data demonstrate that aging across thelifespan of the double mutants is comparable to wild type controls.
2.2 Genome-wide RNA Expression Assay
The key challenge in identifying mechanisms of accelerated aging in dPrx3/dPrx5double mutants is that we cannot easily predict the effects of peroxiredoxinunderexpression because dPrx3 and dPrx5 reducing activity includes such abroad set of targets. To determine how the peroxiredoxin mutation affects geneexpression across all ≈14,000 genes in the Drosophila melanogaster genome, weconducted an RNA sequencing (RNAseq) assay to measure transcriptome-widechanges in mRNA (Figure 1).
Two biological replicates of dPrx3/dPrx5 double mutants and background-matched wt/dPrx5 controls were submitted for RNAseq library preparation(Illumina TruSeq mRNA-seq) and sequencing by the University of RochesterGenomics Resource Center (URGRC). The URGRC performed differential ex-pression analysis by cuffdiff2 [8] with an FDR cutoff of 0.05 (95% confidenceinterval).
The differential expression analysis yielded 193 genes with significantly al-tered expression relative to controls in either of the two biological replicates.Among those 193 significantly altered genes, 90 were upregulated, and 103 weredownregulated.
To determine the functional outcome of these shifts in expression, the 193genes were submitted to the Database for Annotation, Visualization, and In-tegrated Discovery (DAVID) functional clustering web tool [4]. Functionalclustering yielded 41 genes in the immune response pathway, 9 genes in triacyl-glycerol metabolism, 12 genes in carbohydrate metabolism, 8 genes in heavymetal processing, and 21 genes in heat shock response.
To determine which of those 193 genes are involved in aging, the genes werecompared to a dataset of 40d aged Canton S flies from Girardot et al. [2]. Thecomparison yielded 24 genes specifically involved in aging (Figure 2).
3 Discussion
This research characterizes of the aging process in a rapid aging dPrx3 anddPrx5 double mutant and offers insight into the signaling mechanisms behindthat rapid aging process. The results support the hypothesis that dPrx3 anddPrx5 are important regulators of aging. Using temperature-sensitive paralysisas a biomarker of neurodegeneration, we demonstrate that at the organismallevel, double mutants age in a pattern comparable to the wild type controls.However, the delayed increase in temperature-sensitive paralysis shows that D.melanogaster are able to cope with the loss of peroxiredoxins in early stages,which suggests that their cells may in fact be able to maintain redox balance inspite of lost peroxiredoxin 3 and 5 function until they reach a certain critical

Figure 2: Comparison of genes significantly altered in dPrx3/dPrx5 double mutants(relative to wt/da,dPrx5 control flies) and genes significantly altered in aged (40 dayold) Canton S flies (relative to 3 day old flies).
point at which redox balance is lost. Unpublished data on other biomarkers ofaging suggest a similar result, and our earlier data on GSH:GSSG ratios acrossthe double mutant lifespan seem to support this hypothesis [5], but require moreprecise day-by-day testing to confirm.
Transcriptome-wide expression data gives a more precise look at exactly whatchanges are occurring at the cellular level, identifying 193 genes significantlyaltered in our double mutants. Large numbers of these genes were involved in afew important functional pathways, suggesting that the peroxiredoxin mutationsare indeed driving meaningful changes in cell signaling, consistent with the redoxtheory of aging. However, more precise gene signaling analysis is required todetermine the exact way in which alterations in these pathways drive aging.Notably, the fact that only 24 of these genes coincide with genes in an agingfly dataset suggest that the peroxiredoxin mutation may be having most of itseffect on pathways independent of aging.
Future work will focus on continuing to characterize the signaling networksof the genes altered in our peroxiredoxin mutants. Understanding the role ofperoxiredoxin 3 and 5 will involve separate analyses of both aging and aging-independent effects. In either case, we will gain a better understanding ofprecisely how redox signaling drives aging. These findings will carry out on thepromise of aging research: to provide better understandings of biological systemsand perhaps to bring us one step closer to extending lifespan and benefitinghealth in humans.
4 Materials and Methods
All experiments were conducted in the Orr/Radyuk fly lab in Dallas, TX formaximally controlled conditions across treatments and experiments.
Fly Strains and Procedures
As described in Radyuk et al. [5], flies under-expressing both dPrx3 and dPrx5were generated in yellow-white (yw) background by expressing the RNAi-dPrx3hairpin construct (5ds), using the ubiquitous Da-GAL4 driver in the dPrx5 –/–mutant background. The genotypes of the generated flies were yw; yw/da,dPrx5,and dPrx5/5ds/da.dPrx5. The Da,dPrx5 and dPrx5, RNAi-dPrx3 (5ds) configu-rations were obtained by recombination. In all experimental studies, flies were col-lected within 1–2 days after hatching and reared on a standard sucrose-cornmealmedium at 25 ◦C. Flies were kept at environmentally controlled conditions, andmedia were changed daily until the age indicated for each experiment.
Temperature-Sensitive Paralysis
Flies were aged according to the procedure above until the appropriate age foreach experiment. Ten flies each were transferred to watertight 3 mL vials andsubmerged in water at 45.5 ◦C for 30 seconds. Flies were removed from the vialand time to recovery was measured by the time it took for each fly to fully standupright. Double mutant flies were tested at 3, 6, 9, 10 and 11 days. Wt/da,dPrx5flies were tested at 13, 29, and 45 days. Yellow-white flies were tested at 13, 30,41 and 47 days. Sample size was ≈100 flies (10 vials) per time point.
RNAseq
RNA samples from two biological replicates of dPrx3/dPrx5 double mutants andbackground-matched wt/dPrx5 controls were treated with Promega RQ1 DNAse(≈1 u/µg RNA), then submitted for RNAseq library preparation by IlluminaTruSeq mRNA-seq and sequencing by the University of Rochester GenomicsResource Center (URGRC). The URGRC performed differential expressionanalysis by cuffdiff2 [8] with an FDR curoff of 0.05 (95% confidence interval).
References
[1] Finch, C. E., and Austad, S. N. Primate aging in the mammalian scheme:the puzzle of extreme variation in brain aging. Age (Dordr) (Jan 5 2012).
[2] Girardot, F., Lasbleiz, C., Monnier, V., and Tricoire, H. Spe-cific age related signatures in drosophila body parts transcriptome. BMCGenomics 7, 1 (2006), 69.
[3] Heemels, M.-T. Ageing. Nature 464, 7288 (03 2010), 503–503.

[4] Huang, D. W., Sherman, B. T., and Lempicki, R. A. Systematic andintegrative analysis of large gene lists using david bioinformatics resources.Nat. Protocols 4, 1 (12 2008), 44–57.
[5] Radyuk, S. N., Rebrin, I., Klichko, V. I., Sohal, B. H., Michalak,K., Benes, J., Sohal, R. S., and Orr, W. C. Mitochondrial peroxiredox-ins are critical for the maintenance of redox state and the survival of adultdrosophila. Free Radical Biology and Medicine 49, 12 (2010), 1892 – 1902.
[6] Reenan, R. A., and Rogina, B. Acquired temperature-sensitive paralysisas a biomarker of declining neuronal function in aging drosophila. Aging Cell7, 2 (2008), 179–186.
[7] Sohal, R. S., and Orr, W. C. The redox stress hypothesis of aging. FreeRadical Biology and Medicine 52, 3 (2012), 539 – 555.
[8] Trapnell, C., Hendrickson, D. G., Sauvageau, M., Goff, L., Rinn,J. L., and Pachter, L. Differential analysis of gene regulation at transcriptresolution with rna-seq. Nat Biotech 31, 1 (01 2013), 46–53.

High-Throughput Screening System for
P-glycoprotein Inhibition
Collette Marchesseault

High-Throughput Screening System for
P-glycoprotein Inhibition
Collette [email protected]
Abstract
Many scientists are studying the membrane protein P-glycoprotein (P-gp), because of its role multi-drug resistance, causing some cancer cells tobecome resistant to chemotherapeutics. Search for a new drug that wouldinhibit this membrane pump is underway; such a drug would re-sensitizetumors that were considered untreatable by chemotherapy. However, itis expensive and arduous to study this membrane protein in human celllines. Therefore, it was proposed to transfer the P-gp gene to a strain ofE. coli that is better suited to rigorous experimentation. This clone wassuccessfully generated in a plasmid, proved by DNA sequencing. Furtherwork to induce expression of P-gp in E. coli has begun.
1 Introduction and Motivation
Chemotherapeutics are among the strongest drugs developed in recent years andhave saved countless lives that otherwise would have been claimed by cancer.However, this treatment is useless if the cells develop chemotherapeutic resis-tance. The protein that is responsible for about 40% of chemotherapy failuresin recurring cancers is the multi-drug resistance P-glycoprotein. The protein’sfunction in cellular transport is exporting toxins, here chemotherapeutics, outof the cell. P-glycoprotein (P-gp) is comprised of a single polypeptide with twotrans-membrane domains, each comprised of six helices which together bind anddischarge compounds outside the cell.
While expression is necessary in maintaining the blood brain barrier andperforming other functions, the overexpression of this protein leads to cells re-sistant to chemotherapeutics. If there are copious amounts of the protein in thecell membrane, any chemotherapeutic that enters the cell will potentially bepumped out, thereby lowering the intracellular concentration of the therapeuticto levels too low to negatively affect the cancer cell. Higher and higher dosesof chemotherapeutics are then necessary to suppress the growth of the tumoreventually reaching the point where the patient can no longer withstand thetreatment. This is especially common with recurring cancers, as recurrencesoften correlate with higher expression of P-gp. The need today is to find a way

to re-sensitize cancer cells to chemotherapeutics in order to allow patients withrecurring metastases a viable treatment option.
One approach to this problem has been to search for inhibitors of P-gp thatcould be administered to a patient in combination with a chemotherapeutic. IfP gp activity was inhibited, then the chemotherapeutic would remain in the celland the cancer cells would die.
The main complication in finding an effective inhibitor is that P-gp has anon-specific toxin or drug binding site. This allows it to bind and remove manychemically different toxins. Though useful when the protein is protecting thebody from toxins, this is problematic when attempting to design an inhibitor toblock this action. High doses of inhibitory drugs must be administered in orderto achieve competitive inhibition, which in the past has produced serious detri-mental side effects in clinical trials. To reduce the dosage needed for effectiveinhibition, the drug could target the ATPase binding site (the power unit for Pgp). If ATP is unable to bind or be utilized because of the presence of a drug,then the pump has no energy source and is effectively inhibited. Because this isnon-competitive inhibition at the toxin binding site, a significantly smaller dosewould be sufficient to inhibit P-gp.
Dr. John Wise at Southern Methodist University has spearheaded the effortto screen possible P-gp inhibitors through the use of targeted molecular dynamictechniques. The computer modeling has unearthed possible inhibitors of P-gp that have begun to be tested using mammalian cells. However, given thehigh financial costs, as well as many hours needed, I propose to find a moreefficient way to screen compounds for inhibition of P-gp. This would drasticallyincrease the number of compounds that could be screened, providing a larger andwider data set with which to search for effective inhibitors. A high-throughputscreening method would be highly beneficial moving forward in the search ofP-gp inhibitors and could exponentially speed both my own further research,as well as well as the work of several graduate students in our lab and wouldeliminate the tedious process that our undergraduates (myself included) performin purifying P-gp from yeast cells.
Since the fall of 2012, I have been working on the project of transformingthe P-gp gene into E. coli under the guidance of Dr. John Wise. This meansthat the E. coli would express the human protein so that we could study itin a simpler model. By using a bacterial model, the speed and number ofcompounds that could be screened would increase dramatically. However, dueto the complexity of the P-gp gene and other factors, basic cloning techniqueshad proved unsuccessful. Although a clone was generated, the gene appearedto become scrambled after it entered the bacterial cell. Therefore, this summerI shifted my efforts to attack the problem from a different angle.
2 Methodology and Results
The goal was to clone the MDR1 (human P-gp) into a bacterial model to createthe high-throughput screening system. Because of the size and composition

of the MDR1 gene, it was beneficial to create a fusion protein with a glyceroluptake facilitator protein, called glpF. GlpF has been used as fusion protein toassist in cloning difficult genes. The glpF gene was inserted first into the plasmidand then the MDR1 sequence aligned directly behind the glpF gene. Therefore,when the glpF gene is transcribed, the P-gp gene will also be transcribed. Thiswill also aid in making sure that P-gp is inserted into the membrane duringtranslation. The cloning was completed using a bacterial plasmid, or smallpiece of circular DNA, in this case the pet24a plasmid. The plasmid and theglpF gene were cut with the same enzymes, rendering the ends complementary.The plasmid and glpF gene were then mixed together, allowing the plasmidto take up the glpF gene and re-circularize. The glpF gene was checked forproper insertion by transformation into E. coli cells, and plasmid isolation.DNA sequencing by an outside company verified the results. This plasmid wasnamed CM1 and can be seen in Figure 1.
The same techniques were then repeated using the CM1 plasmid and MDR1gene. Because of the large size of the MDR1 gene, almost 4000 nucleotides long,the DNA sequencing had to be performed in a series of smaller experiments.For each sequencing run, a PCR reaction was run to generate enough DNAof appropriate length. To do this, eight sets of DNA primers were designedto amplify sequential pieces of DNA throughout MDR1. They were also usedto direct the sequencing to the correct place and direction in the DNA. Thesequence data, in the form of chromatograms, was analyzed and compared thedata to the known sequence of MDR1, shown in Figure 3. Three mutations inthe DNA were identified, with no large deletions or insertions. Two of thesemutations were identified as natural variants of MDR1, and the third was amutation from glutamic acid to cysteine designed in the DNA to render theprotein inactive. Inactive protein is not selected against when the bacteria grow,therefore it is beneficial to clone DNA of an inactive protein. The sequencedata proved that the MDR1 sequence was complete and correct in the newlyengineered bacterial plasmid, named CM2, shown in Figure 2.
This work was done under the supervision of Dr. John Wise and Dr. PiaVogel in the Department of Biological Sciences at SMU.
3 Future Work
Experimentation beyond the cloning has already begun in two areas. First, amutagenesis experiment was begun to mutate the cysteine back to a glutamicacid in order to produce active protein. Second, experimentation to induce ofthe E. coli cells to produce the glpF-MDR1 fusion protein was started. In orderto do this, the bacteria must be grown in the presence of IPTG, a molecule thatbinds to the repressor which had kept the glpf-MDR1 sequence from being tran-scribed. With the repressor removed from the DNA, the fusion protein shouldbe produced. The cells must then be broken open to isolate the membraneswith the fusion protein in them. Using a SDS-Page gel and a Western Blot, theprotein can be isolated and a series of antibodies used to stain the protein for

Figure 1: Plasmid CM1 showing thepet24a plasmid with the glpF gene inbetween the enzyme cut sites for NheIand SacI.
Figure 2: Plasmid CM2 showing thepet24a plasmid with the glpF gene inbetween the enzyme cut sites for NheIand SacI and the MDR1 gene in be-tween the SacI and XhoI cut sites.
Figure 3: Chromatogram data of the DNA sequence of a portion of the MDR1 gene.Each color correlates to a different nucleotide, labelled at the top: Adenine, Guanine,Cytosine or Thymine.

visual analysis.As a scientist interested in a career in biomedical research, it is highly im-
portant to remember the end goal of the research, which in this case, is thedevelopment of a pharmaceutical drug that could save the lives of those whohave been battling cancer. My research could be influential in this process,given the speed at which a large number of compounds could be tested againstP-glycoprotein.
References
[1] Delannoy, S., Urbatsch, I. L., Tombline, G., Senior, A. E., andVogel, P. D. Nucleotide binding to the multidrug resistance p-glycoproteinas studied by esr spectroscopy. Biochemistry 44, 42 (2005), 14010–14019.PMID: 16229490.
[2] Hoffman, A. D., Urbatsch, I. L., and Vogel, P. D. Nucleotide bind-ing to the human multidrug resistance protein 3, MRP3. Protein J. 29, 5(Jul 2010), 373–379.
[3] Neophytou, I., Harvey, R., Lawrence, J., Marsh, P., Panaretou,B., and Barlow, D. Eukaryotic integral membrane protein expressionutilizing the Escherichia coli glycerol-conducting channel protein (GlpF).Appl. Microbiol. Biotechnol. 77, 2 (Nov 2007), 375–381.
[4] Wise, J. G. Catalytic transitions in the human mdr1 p-glycoprotein drugbinding sites. Biochemistry 51, 25 (2012), 5125–5141. PMID: 22647192.

Trekking through the Trees:
Forest Succession at the Trinity River Audubon
Center
E. Jewel Lipps Bonnie F. Jacobs Shannon M. Hart

Trekking through the Trees: Forest Succession at
the Trinity River Audubon Center
E. Jewel [email protected]
Bonnie F. [email protected]
Shannon M. [email protected]
Abstract
The Trinity River Audubon Center in Dallas, TX (TRAC) was es-tablished in an effort to restore land that had a long history of intensehuman disturbance. From the 1960s to 1990s, the site was a large-scaleillegal landfill operation in an old gravel mine. More than 15 hectaresof streamside (riparian) forest along the Trinity River are now protectedand publicly accessible since TRAC’s opening on the remediated land in2008. This study assessed forest composition and successional stages (rel-ative forest age) to inform conservation strategies and educational goalsat TRAC. Six forest stands were delineated based upon existing frag-mentation using aerial photography, and were surveyed in spring 2014 bythe random plot method. Published bottomland forest succession modelswere consulted as standards with which to compare species importancevalues in the study area. Stands exhibit mid-successional, transitioning tolate successional, and late successional stages. None of the study areas isyet in transition to old growth forest. For all stand data combined, sugar-berry, ash, pecan, and cedar elm trees had the highest importance values.Overall, the forest area accessible through TRAC can be characterized asmid-succession transitioning to the late succession sugarberry-Americanelm-green ash community. The Center’s conservation strategy should ac-count for expected changes in forest composition and species dominance,particularly along established trails. Results will be developed into a treeID guide for Center visitors to learn about riparian forests.
1 Introduction
Environmental restoration of the Great Trinity Forest is an initiative of theCity of Dallas for possible recreational and ecological benefits. Since the city’ssettlement in 1841, much of the forest has been disturbed by gravel mining,agriculture, channelization, flood control, and urban development. The Deep-wood Dump operated illegally and hazardously from the 1960s to the 1990s onforested land zoned for residential use in South Dallas. Residents of the nearbyneighborhoods experienced severe adverse effects from the landfill operation andcarried out legal action for the dump’s closure. Remediation occurred in the

2000s, and the Trinity River Audubon Center (TRAC) opened on the site in2008 for continued restoration, community use, and educational outreach.
Dallas County is naturally a blackland prairie ecosystem. However, withinthe prairie region, forests may be found beside streams and rivers. These flood-plain forests are termed bottomland hardwood forest or riparian forest. TheGreat Trinity Forest is at least 6000 acres of continuous bottomland hardwoodforest in South Dallas, and possibly the largest urban riparian forest in the na-tion. Urban forest research suggests that conserved forests provide cities withimproved air quality, water quality, and lower summer temperatures, and offera potential recreational asset for the public. Besides restoring and conservingforest land, the Trinity River Audubon Center serves as a gateway to the GreatTrinity Forest, providing recreational and educational opportunities [3].
This project provides ecological data necessary for conservation planningand education about the riparian forest areas accessible through the TrinityRiver Audubon Center. This study assessed forest composition to determinewhich tree species are currently most important. After disturbances, forestsregenerate in successional stages. The importance of certain tree species changesas the forest grows older. Some important trees grow only during the early ormid successional stage of a forest during recovery from disturbance, and arereplaced by different trees by the late stage. Old growth forests are composedof tree species that replace themselves, and the same tree species remain themost important trees until the next disturbance [6]. The successional stages offorest stands near the Center were determined by comparing species’ importancevalues to published models of bottomland hardwood forest succession.
Since the Great Trinity Forest has been disturbed in several ways, its con-servation strategies must consider that some important trees will decline andbe replaced by different tree species. Forest composition and successional stagedescribe wildlife habitat. For example, bird communities are influenced by bot-tomland hardwood forest successional stage [2].
The Trinity River Audubon Center provides access to the Trinity River andGreat Trinity forest through several trails. Most of the forest stands reportedon here are accessible through a public trail, thus study results pertain to forestareas that Center visitors may enjoy.
2 Methods
2.1 Site Selection
To assess forest composition and successional stage, forest stands of differentdisturbance history were selected for the study. Survey results from sampleplots were used to calculate species importance values.
Using Google Earth aerial images from 1995 through 2013, six forest standswere distinguished for the Trinity River Audubon Center and adjacent property(Figure 1). The aerial images indicated different vegetation cover and distur-bance histories for the chosen stands. Overlook Trail (Stand A) is separated

Figure 1: Aerial photo of the Trinity River Audubon Center from October 18, 2013.Forest stand study areas and vegetation plots are designated.
from Forest Trail (Stand B) by the entrance road into TRAC. These stands aremost accessible to visitors and farthest from the river. All other stands borderthe Trinity River. TRAC Forest (Stand C) is completely within Audubon Cen-ter borders. The stand has no maintained trail or public access. In aerial imagessince 1995, the TRAC Forest stand appears distinctly lighter and thinner thanthe surrounding vegetation, with which it forms a sharp boundary. McCommasBluff West (Stand D) is immediately east of the TRAC Forest stand. It is notaccessible to the public by trail. Aerial images appear dark green and thick.Trinity River Trail (Stand E) is on the south side of the river. Aerial photosfrom 1995 through 2001 show the stand as mostly cleared. Vegetation coverappears to increase from 2007 to 2013. McCommas Bluff East (Stand F) is theonly stand to the east of the concrete trail maintained by the city of Dallas. Theaerial images appear similar to McCommas Bluff West. The McCommas Bluffstands are the property of the City of Dallas, as a 111-acre preserve establishedin 1985 under the Open Space System.
ArcGIS was used to select geographic (GPS) coordinates for vegetation sam-ple plots. Using the software, the stands were overlaid with a grid. Each gridsquare represented a potential sample plot and had an assigned number. Fivepercent of the potential plots in each stand were selected randomly through theMicrosoft Excel random number function. The randomly generated number wasused to retrieve the GPS coordinates for the center of the grid square in ArcGIS.Extra plots were randomly selected as back up, in case a selected plot exhibited

extreme inaccessibility or unsafe location. Coordinate data for each sample plotwere loaded into a GPS device and named so they could be retrieved in thefield.
2.2 Field Procedure
The center coordinates of sample plots were located with Garmin GPSmap60CSx unit. General observations about the site condition, wildlife, ground-cover, seedlings, and any other notable features were written in a field notebook.Percent cover of the invasive species Chinese privet was recorded. Pictures weretaken from the center of the plot in a clockwise rotation with about 2% over-lap. Ten by ten meter square plots were measured with meter tape and markedwith survey flags and flag tape. Each plot was 100 square meters and alignedwith cardinal directions. Within the plot, diameter at breast height (d.b.h.)was recorded in centimeters for every tree greater than 1.4 meters tall. Eachmeasured tree was identified to species. Unknowns were sampled and placed ina plant press for later identification using botanical resources.
2.3 Calculation of Importance Values
The forest composition of each stand is determined with importance values(Figure 2). Relative frequency, relative density, and relative dominance werecalculated for each species by stand. For a given species, frequency (plots ob-served/total plots) was the proportion of plots in which the species was observeddivided by the total number of plots in the stand. The frequencies of all speciesfound within a stand were summed. The sum was used to determine relativefrequency (0-100%) by dividing each species’ frequency by the sum. Density(trees/hectare) for a given species was the quantity of individual trees withineach stand divided by the sampled stand area. The densities of all species weresummed and used to determine relative density (0-100%). Relative dominancewas derived from the d.b.h. value. Measured d.b.h. was converted to metersand used to calculate basal area (square meters) for each individual sampled.Basal areas of the same species within a stand were summed and divided bythe sampled stand area, resulting in species dominance (square meters/hectare).Dominance values for all species in a stand were summed. The sum was usedto find relative dominance (0-100%) for each species. Importance value for eachspecies is the sum of relative frequency, relative density, and relative dominance.It ranges from 0 to 300% with larger numbers indicating higher importance ofthe tree species in the stand.
3 Results and Discussion
The Trinity River Audubon Center accessible forest areas contain at least 21different tree species. In total, 2600 square meters were surveyed for the study,yielding a sample of 625 trees within the plot areas. Of the 625 trees, 464 were

Figure 2: Important trees in the forest near the Trinity River Audubon Center.
saplings (less than 10 cm d.b.h.). Sugarberry, Green Ash, Pecan, and CedarElm have the highest importance values when all data are combined (Figure 2).Two tree species (Paper Mulberry and Silk Tree) are nonnative, but they wereuncommon and have low importance values.
Successional stage can be determined by comparison with other studies andpublished models. The bottomland hardwood forest near Denton, TX on theElm Fork of the Trinity River between Lake Ray Roberts and Lake Lewisvillehas been well studied. It is called the Greenbelt Corridor (GBC). Part of theGBC was classified as transitional old growth. The top five most important treeswere Sugarberry, Cedar Elm, Green Ash, Black Walnut, and Bur Oak [1]. Thesugarberry-elm-ash community represents late succession, while black walnutand oaks represent old growth. Nixon studied succession in the South DallasGreat Trinity Forest [4]. Abandoned gravel pits of known ages were surveyed.In the 5 year old pit, black willow and eastern cottonwood were most important.In the 47 year old pit, juniper and sugarberry were most common. In the un-excavated forest, winged elm, post oak, and Mexican plum were most common.Bottomland hardwood forest succession is described by [6] and [5]. Addition-ally, the U.S. Forest Service classifies juniper as an early/mid succession species,and they have designated sugarberry-elm-ash association. Using these sources,Figure 3 illustrates forest succession in the Great Trinity Forest.
The study results indicate that the forest area as a whole is transitioningfrom mid to late succession. There is a relatively high importance of mid-succession species like pecan, box elder, and juniper, although sugarberry andgreen ash are most important. When each forest stand is considered separately,different tree species are the most important in each (Table 1).
The McCommas Bluff preserve, protected since 1985, represents the oldestand least disturbed forest area near the Center. No oaks were recorded in thisarea, thus the association will remain for the long term. The TRAC Forest willlikely have an increase in sugarberry and elm importance in the coming decades.

Figure 3: Bottomland hardwood forest succession model.
Stand Tree SpeciesImportance
ValueSuccessionalStage
Overlook Trail Cedar Elm 129 MidJuniper (sapling) 68
Forest Trail Juniper 132 Mid
TRAC Forest Green Ash 118 Mid–Late
McCommas Bluff West Sugarberry 72 LateCedar Elm 69Green Ash 52
Trinity River Trail Pecan 124 Mid
McCommas Bluff East Sugarberry 90 LateAmerican Elm 80Green Ash 64
Table 1: Results for forest stands.

In the Forest Trail stand, many juniper trees already appear to be in decline.Juniper should be allowed to die out, to be replaced by green ash and sugarberry.Only the Overlook Trail stand had juniper saplings of high importance, andmay remain in mid-succession. The Trinity River Trail stand had the highestpercentage of saplings. Many will die as they grow and competition increases,changing the composition in the coming decades.
Trinity River Audubon Center conservation strategy should expect juniperdecline and the increased importance of sugarberry, elms, and green ash. Theriparian forest should be monitored for invasive species that may negativelyaffect forest growth. Chinese privet should be removed where it exists. Mon-itoring for Dutch Elm disease, pests, and other health concerns for the mostimportant species will ensure forest longevity and stability of the Great TrinityForest sugarberry-elm-ash community.
References
[1] Barry, D., and Kroll., A. J. A phytosociological description of a rem-nant bottomland hardwood forest in denton county, texas. Texas Journal ofScience 51 (Nov 1999), 309–316.
[2] Buffington, J. M., Kilgo, J. C., Sargent, R. A., Miller, K. V., andChapman, B. R. Comparison of breeding bird communities in bottomlandhardwood forests of different successional stages. The Wilson Bulletin 109,2 (1997), pp. 314–319.
[3] City of Dallas Urban Forest Advisory Committee. Great trinityforest. http://dallastrees.org/?page_id=85.
[4] Nixon, E. S. Successional stages in a hardwood bottomland forest neardallas, texas. The Southwestern Naturalist 20, 3 (1975), pp. 323–335.
[5] Rijal, R. Soil and forest variation by topography and succession stagesin the Greenbelt Corridor, floodplain of the Elm Fork of the Trinity River,North Texas. PhD thesis, University of North Texas, August 2011.
[6] Stanturf, J. A., Schoenholtz, S. H., Schweitzer, C. J., and Shep-ard, J. P. Achieving restoration success: Myths in bottomland hardwoodforests. Restoration Ecology 9, 2 (2001), 189–200.

Forecasting Error inTV Ratings
Hal Hoeppner

Forecasting Error in TV Ratings
1 Introduction
Your attention is a commodity and it is for sale. Television networks sell theirviewers in the form of commercial airtime. Advertisers buy this time, hoping thatit will lead to high future sales. One of the most important factors in determiningthe price of commercial space is the rating, or audience size, of the show it occursduring. However, 80% of advertising space is sold months in advance [1]. Theratings from the previous season can act as guidelines for returning programs,but little is known about new shows at this time. Accurately forecasting ratings—and thus setting the price—for these new shows with minimal information (theschedule and trailer) is important: too low and you’ve lost out on profit, toohigh and you may lose confidence in future dealings.
A show’s ratings are measured two ways in this paper: share and A18-49.Share is the average percentage of TV-watching adults ages 18-49 that watchedthe program and A18-49 is the average percent of TV-owning adults ages 18-49that watched the program. The two are similar and are the most commonlycited Nielson ratings.
2 The Article
In 2001, Philip Napoli looked at the error inherent in forecasting ratings for newprimetime shows in his article “The Unpredictable Audience” [1]. He describeswhat he calls ‘uncertainty factors’, variables that contribute to error: inheritanceeffects, competitive scheduling, quantity of new shows, and the increasing use ofVCRs (which were replaced in favor of DVRs). Inheritance effects come fromthe show directly before (lead-in) and after (lead-out) the selected program andare based on the idea that viewers tend to remain on the same channel througha sitting. Competitive scheduling is a method that networks use to ensure thattheir programs will attract a different segment of the audience and thus minimizethe direct competition between programs. Napoli derived five hypotheses fromhis uncertainty factors:
1. Shows with returning lead-ins will have less forecasting error than thosewithout.

2. Shows with returning lead-outs will have less forecasting error than thosewithout.
3. A higher percentage of new programs will lead to higher forecasting error.
4. The number of new programs a network is trying to produce will also leadto higher forecasting error.
5. Forecasting error is increasing over time.
He was also curious to see if FOX’s error would be different from the ‘BigThree’ networks (CBS, NBC, ABC) since it is the newest and targets a youngeraudience [1].
To test these hypotheses, Napoli used multivariate regression analysis tolook at 157 programs premiering during the 1993–98 seasons from CBS, NBC,ABC, and FOX, though 17 were removed due to schedule shifts. The forecastedratings came from an annual report in Broadcasting & Cable. He chose to usethe average share from episodes two through five1, reported in weekly Nielsenreports, as the show’s actual rating [1].
Error, the response variable, was measured as a percentage of the actualrating. The absolute value of this percentage was used because Napoli wasnot interested in which direction the error occurred but simply how large thevalue was. Dummy (i.e. Boolean) variables represented whether a show’s lead-inand lead-out were returning shows (0=no, 1=yes). Additional dummy variableswere included to denote if the show had a lead-in or lead-out (0=no, 1=yes);shows at the beginning or end of primetime do not. Competitive scheduling, or‘counterprogramming’, was included as the percent of half-hour blocks taken upby new shows out of the available competing primetime half-hour blocks. Thequantity of new shows was simply measured by the number of new programsthat season [1].
Napoli reports finding the type of lead-in and lead-out to be statisticallysignificant predictors of error at the 0.05 level, and that the error was increasingover time, giving support to hypotheses 1, 2, and 5. The number of new showsand percentage of new show programming were not found to be statisticallysignificant, providing no support for hypotheses 3 and 4. He also found thatwhile FOX’s mean error was significantly lower than the other three networks,its dummy variable was not significant in the multivariate regression analysis,providing an unclear response to his original question [1].
3 My Statistics
I wanted to see if Napoli’s findings would hold up over a decade later. Unfortu-nately, Broadcasting & Cable no longer publishes an annual report of forecasted
1Napoli excluded the premiere, believing it not to be an accurate predictor of overall seasonperformance. He did not directly state why he only used four episodes. It may have been toreduce bias against shows cancelled mid-season.
Year N Variable Mean SD Min Max
2011 24 error 0.63 0.42 0.08 1.73% error 29.14 21.69 2.86 85.19
2012 18 error 0.65 0.41 0.00 1.65% error 39.34 26.92 0.00 87.50
2013 22 error 0.48 0.29 0.00 1.15% error 35.46 27.75 0.00 94.59
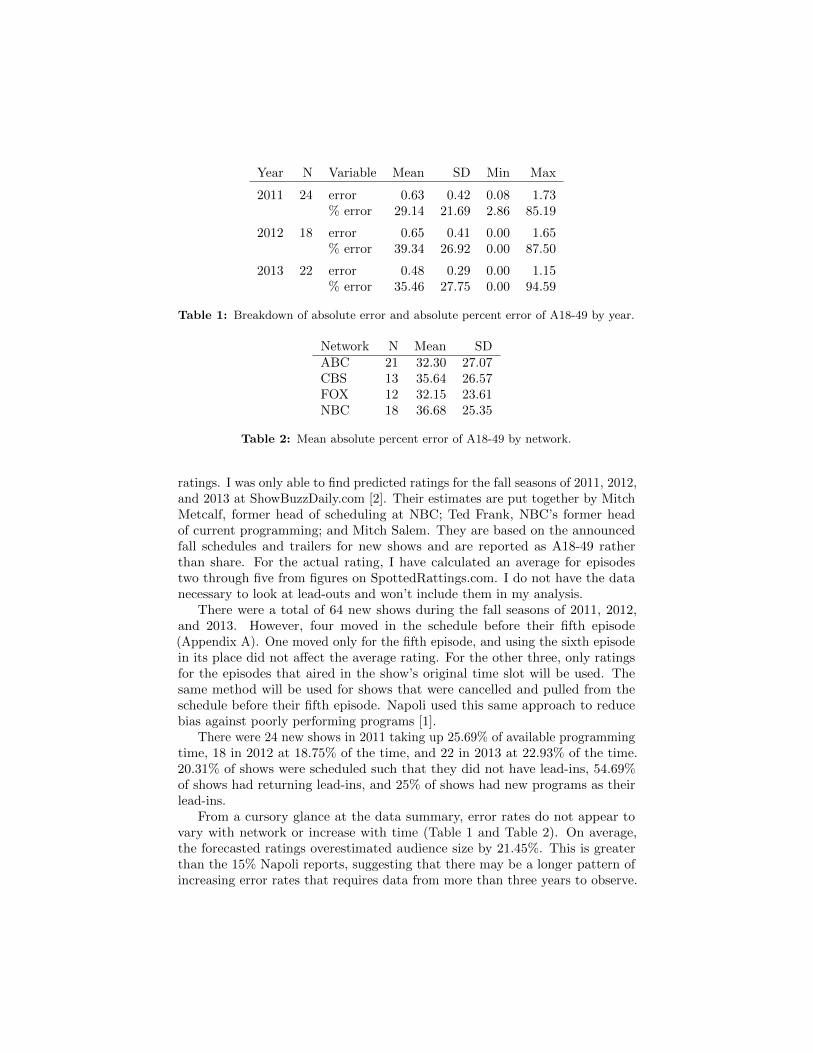
Table 1: Breakdown of absolute error and absolute percent error of A18-49 by year.
Network N Mean SDABC 21 32.30 27.07CBS 13 35.64 26.57FOX 12 32.15 23.61NBC 18 36.68 25.35
Table 2: Mean absolute percent error of A18-49 by network.
ratings. I was only able to find predicted ratings for the fall seasons of 2011, 2012,and 2013 at ShowBuzzDaily.com [2]. Their estimates are put together by MitchMetcalf, former head of scheduling at NBC; Ted Frank, NBC’s former headof current programming; and Mitch Salem. They are based on the announcedfall schedules and trailers for new shows and are reported as A18-49 ratherthan share. For the actual rating, I have calculated an average for episodestwo through five from figures on SpottedRattings.com. I do not have the datanecessary to look at lead-outs and won’t include them in my analysis.
There were a total of 64 new shows during the fall seasons of 2011, 2012,and 2013. However, four moved in the schedule before their fifth episode(Appendix A). One moved only for the fifth episode, and using the sixth episodein its place did not affect the average rating. For the other three, only ratingsfor the episodes that aired in the show’s original time slot will be used. Thesame method will be used for shows that were cancelled and pulled from theschedule before their fifth episode. Napoli used this same approach to reducebias against poorly performing programs [1].
There were 24 new shows in 2011 taking up 25.69% of available programmingtime, 18 in 2012 at 18.75% of the time, and 22 in 2013 at 22.93% of the time.20.31% of shows were scheduled such that they did not have lead-ins, 54.69%of shows had returning lead-ins, and 25% of shows had new programs as theirlead-ins.
From a cursory glance at the data summary, error rates do not appear tovary with network or increase with time (Table 1 and Table 2). On average,the forecasted ratings overestimated audience size by 21.45%. This is greaterthan the 15% Napoli reports, suggesting that there may be a longer pattern ofincreasing error rates that requires data from more than three years to observe.

(a) Residuals vs fitted (b) Normal Q-Q (c) Histogram and normalfunction
Figure 1: Fit diagnostics for percent error.
(a) Residuals vs fitted (b) Normal Q-Q (c) Histogram and normalfunction
Figure 2: Fit diagnostics for log of percent error.
4 Assumption Check
Following Napoli’s method, linear regression will be used to test the significanceof these factors on forecasted ratings error. Regression requires four assumptionsto be met: linearity between dependent and independent variables, independence,constant variance of residuals, and normally distributed residuals. Since theindustry accepts that lead-ins affect ratings, there is a breach of independencefor the 16 shows (25%) that have new programs, which would also be includedin the data, as their lead-in. It should also be noted that my sample size issmaller than one would hope. The ‘rule of thumb’ would be to have at least104 observations (100 + k, where k is the number of predictors) to ensure theproper power; unfortunately, this wasn’t possible due to limited access to ratingpredictions.
The variance of residuals across predicted values (Figure 1a) is not constant;a wave pattern can be seen in the negative residuals. As for normality, theresiduals are not too far off the wanted diagonal line (Figure 1b). At this pointI cannot fix a problem with independence, but performing a transformation onthe data may help with other assumptions.
4

VariableParameter
estimateStandard
error Pr > |t| β pr2 VIFIntercept 60.882 32.07 0.063 0 0Leadin 3.887 9.68 0.689 0.062 0.0027 1.47Rleadin 2.534 7.83 0.747 0.050 0.0018 1.47NewSeas -1.468 1.41 0.303 -0.141 0.0179 1.13PercNew 3.289 15.81 0.836 0.028 0.0007 1.09
Table 3: Results of regression of percent error. ‘Leadin’ represents whether a show hasa lead-in or not. ‘Rleadin’ is the dummy variable for if the lead-in is a returning show.‘NewSeas’ is the number of new shows in a same season. ‘PercNew’ is the percent ofcompeting time taken up by new shows.
Statistic ValueModel Pr > F 0.718R2 0.034Adjusted R2 -0.031
Table 4: Validity of regression model.
Taking the logarithm of percent error has improved the normality of residuals(Figure 2b, Figure 2c). However, it has exacerbated the problem with non-constant residual variance (Figure 2a): what I thought was a wave is now a largeempty space, though this may be purely due to having few observations in thatarea. I will continue with the analysis, regardless of issues with non-constantvariance and independence, using the absolute value of percent error.
5 Regression
Regression was used to test the null hypothesis that all uncertainty factors’slopes are zero, meaning that they have no significant effect on the percent oferror when forecasting ratings.
None of the factors explored are statistically significant regardless of whetherall variables are included or a stepwise selection is used. The model itself is alsonot statistically significant (Table 4); thus, I fail to reject the null hypothesis. Apost-hoc calculation of power results in an acceptable 0.865, meaning that mysample size should be large enough for the model to have picked up on any effectspresent, even though it is smaller than the suggested amount [3]. It appearsthat at least for these three fall seasons, the lead-in type, number of new shows,and scheduling against new shows did not affect the percent error of forecastedratings.

6 Conclusion
Napoli had a good idea: uncertainty is inherent in television and continues togrow today with increasing DVR use, cable use, and fragmentation of audiences.Perhaps with more data and research these uncertainty factors may prove to beimportant to advertisers looking for the most secure bet. For now though, focusshould be placed on improving the underlying predictions.
References
[1] Napoli, P. M. The unpredictable audience: An exploratory analysis offorecasting error for new prime-time network television programs. Journalof Advertising 30, 2 (2001), pp. 53–60.
[2] Salem, M. THE SKED’s Fall TV Ratings Predictions. ShowBuzzDaily . http://www.showbuzzdaily.com/articles/the-sked/tvratings/predictions-tvratings/page/3.
[3] Soper, D. Free post-hoc statistical power calculator for multiple regression.http://www.danielsoper.com/statcalc3/calc.aspx?id=9.
A Shows that moved on or prior to 5th episode
Year Title Change2011 How to Be a Gentleman (CBS) Moved from Thursday to Sat-
urday on 3rd episode.2011 I Hate My Teenage Daughter (FOX) Moved from Wednesday to
Tuesday on 5th episode.2011 Grimm (NBC) 5th episode aired on Thursday
instead of Wednesday; rest ofseason on schedule.
