smog in our brains - izaconference.iza.org/conference_files/environ_2016/chen_x9262.pdf · ̶the...
TRANSCRIPT

Smog in Our BrainsGender Difference in the Impact of Exposures to
Air Pollution on Cognitive Performance
Xi Chen, Yale University and IZAXiaobo Zhang, Peking University and IFPRI
Xin Zhang Peking University

Acknowledgements
2

Motivation
• Large literature examines the effect of air quality on varioushealth outcomes life expectancy, illness and hospitalization rates, child health,
and health behavior• By comparison, the literature on the effect of air pollution on
cognition is limited, but has picked up recently exposure to air pollution in early life leaves a lasting negative
effect on later school performance (Sanders 2012; Bharadwaj etal. 2014; Molina 2016; Marcotte 2016)
contemporaneous exposures to air pollution affect test scores(Ham et al. 2014; Lavy et al. 2014a, 2014b)
• Shed light on burgeoning literature of air pollution onhappiness, mental well-being, worker productivity

Motivation
• EPA’s recent statement on reviewing PM standards –"Additional research is necessary to assess the impact of ambient air pollutants on central nervous system function, such as cognitive processes, especially during critical windows of brain development. To this end, as the number of … studies continue to increase and add to the weight of overall evidence, future National Ambient Air Quality Standards assessments will again assess and address the adequacy of existing standards."

Potential Contribution
• Contribute to the knowledge about environmental stressorsand gender differences in cognition
• several challenges plague the identification of these studies school/school-grade/sibling fixed effect -> individual fixed
effect contemporaneous exposures vs. cumulative exposure ->
both selected groups (military recruits, students) -> nationally
representative sample (respondents older than age 10) average air quality data over a certain period -> matching
daily air quality at the time and place of interview withsurvey responses
developed vs. developing country settings

Potential Mechanisms
• physiological pathways- affect structure and function of brains - affect brain chemistry directly (ozone, PM);- trigger an inflammatory response in the central nervous system (PM)- other physiological pathways: e.g. CO inhibits the body’s ability to release
oxygen
• psychological pathways- headache and head tightness (CO, NO2)- psychiatric distress (SO2), depression (CO, NO2, SO2, ozone, PM)- attention problems- Fatigue

Results Preview
• In the long run: air pollution impedes both word and math scores• In the short term: more evident negative effect on word tests- Heterogeneous effects by gender: men perform worse than women
in both tests when exposed to the same dose of air pollution;- Heterogeneous effects by age: the gender difference in word tests is
more salient among the old cohort, while it is more evident among the young in math tests.

Data
• Cognitive tests China Family Panel Studies (CFPS)A nationally representative survey of Chinese communities,families, and individuals conducted in 2010, 2012 and 2014
standardized mathematics and word recognition questions (2010 & 2014)
obtained from textbooks of different grade levels sorted in ascending order of difficulty the final test score is the rank of the hardest question
the respondent is able to answer correctly

Data
• Air Pollution Index (API) air quality daily report published by the MEP (Ministry of
Environmental Protection) of China covered 369 major cities in 2014 ranging from 0 to 500, generated by a piece-wise linear
transformation from the concentrations of three criteriaair pollutants SO2, NO2 and PM10
a larger number indicating worse air quality
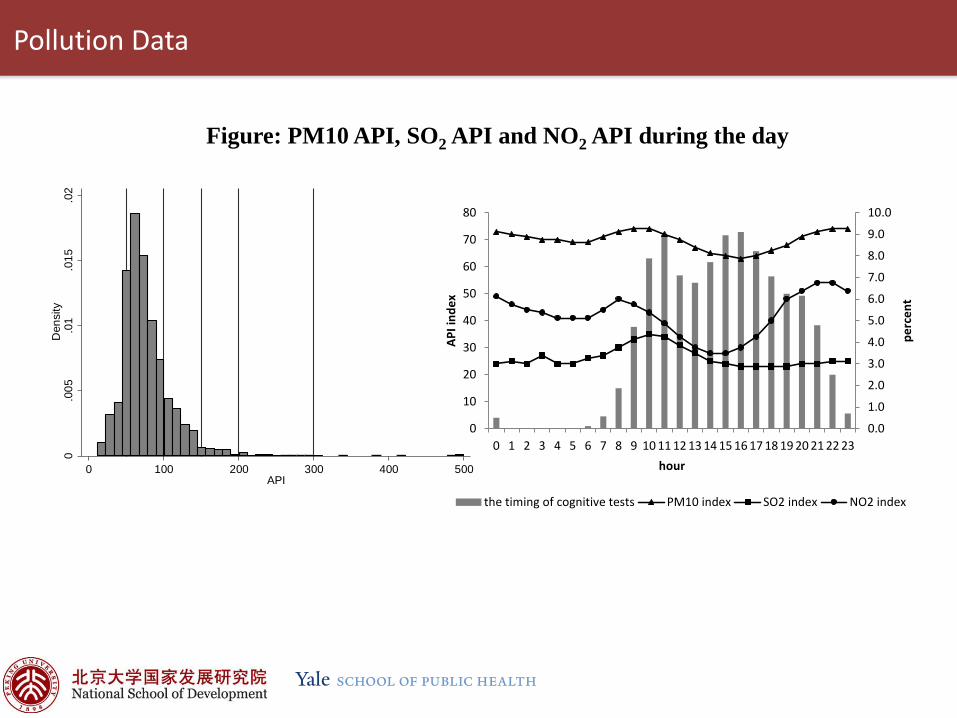
Pollution Data
Figure: PM10 API, SO2 API and NO2 API during the day
0.0
05.0
1.0
15.0
2D
ensi
ty
0 100 200 300 400 500API
0.0
1.0
2.0
3.0
4.0
5.0
6.0
7.0
8.0
9.0
10.0
0
10
20
30
40
50
60
70
80
0 1 2 3 4 5 6 7 8 9 10 11 12 13 14 15 16 17 18 19 20 21 22 23
perc
ent
API i
ndex
hour
the timing of cognitive tests PM10 index SO2 index NO2 index
Data
• Weather the National Climatic Data Center (NCDC) under the
National Oceanic and Atmospheric Administration (NOAA)of the United States
on consecutive days from 402 stations in China including rich weather conditions: mean temperature and
its square term, total precipitation, mean wind speed, anda dummy for bad weather
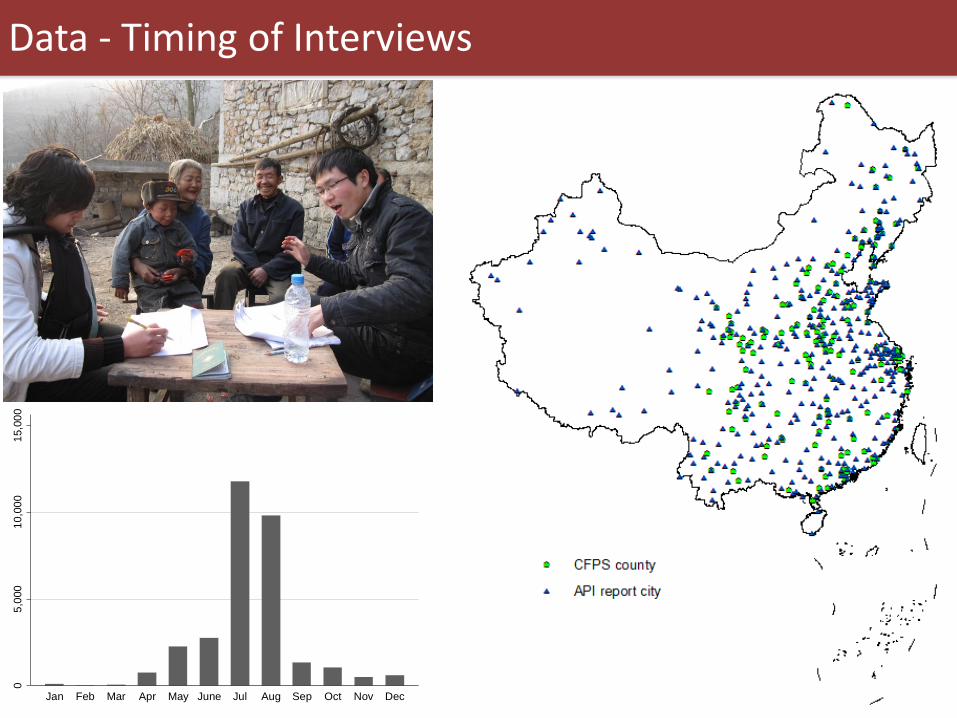
Data - Timing of Interviews0
5,00
010
,000
15,0
00
Jan Feb Mar Apr May June Jul Aug Sep Oct Nov Dec
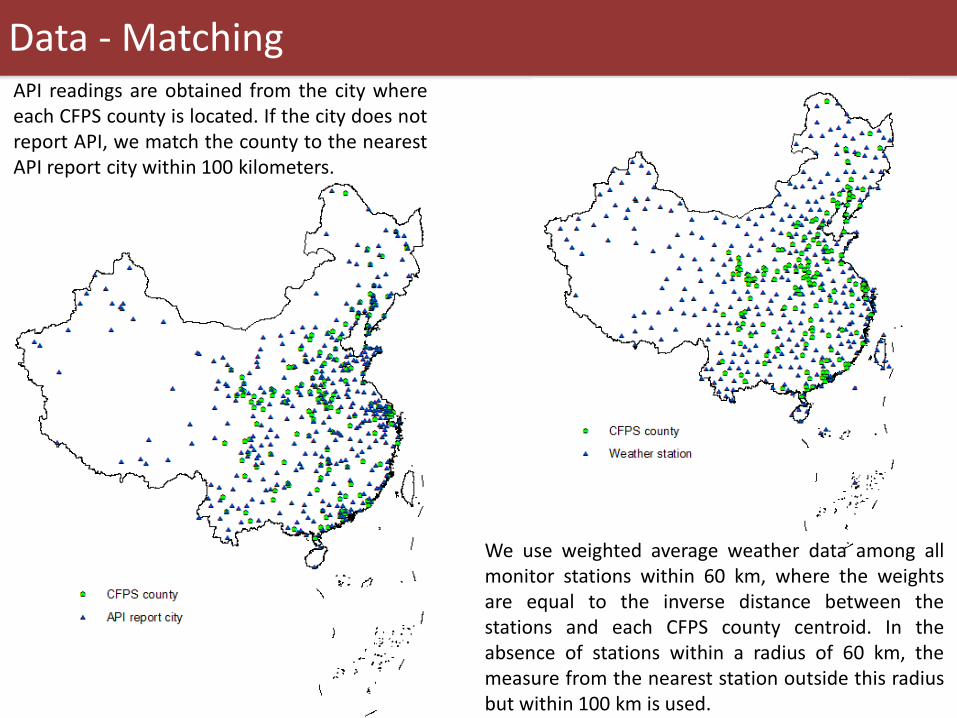
Data - MatchingAPI readings are obtained from the city whereeach CFPS county is located. If the city does notreport API, we match the county to the nearestAPI report city within 100 kilometers.
We use weighted average weather data among allmonitor stations within 60 km, where the weightsare equal to the inverse distance between thestations and each CFPS county centroid. In theabsence of stations within a radius of 60 km, themeasure from the nearest station outside this radiusbut within 100 km is used.

Empirical Strategy
+ ( )ijt jt ijt jt jt i j t ijtScore P X W T f tα β φ γ λ δ η ε′ ′ ′= + + + + + + +
Scoreijt: test scores of respondent i in county j at date tPijt: log form of API in county j at date tXijt: demographic controls: household per capita income (log); gender; age and its square and cubic term; education years; health status; migrationWjt: weather conditions - temperature bins, total precipitation, mean wind speed, and a dummy for bad weather
Tjt: county-level characteristics - GDP per capita, population density and industrial value share𝜆𝜆𝑖𝑖: individual fixed-effect𝛿𝛿𝑗𝑗: county fixed-effect𝜂𝜂𝑡𝑡: year, month, day-of-week and post meridiem hour fixed-effects
f(t): quadratic monthly time trend

Summary Statistics
Variable All Male FemaleMean SD Mean SD Mean SD
word scores 18.018 10.574 19.656 9.512 16.515 11.256math scores 10.381 6.433 11.440 5.956 9.409 6.697API 77.568 36.743 77.226 36.082 77.883 37.3377-day mean API 76.909 24.939 76.704 24.793 77.097 25.07230-day mean API 76.988 20.505 76.816 20.472 77.146 20.53590-day mean API 79.420 19.206 79.263 19.170 79.565 19.239180-day mean API 86.784 23.441 86.492 23.338 87.053 23.5341-year mean API 86.175 22.218 86.011 22.313 86.325 22.1302-year mean API 79.183 16.472 79.027 16.564 79.327 16.3864-year mean API 75.605 12.702 75.432 12.746 75.765 12.659per capita income (log) 8.878 1.160 8.895 1.158 8.862 1.161age 44.638 17.954 44.779 18.237 44.508 17.689self-report health status (1-5) 2.382 1.254 2.273 1.213 2.481 1.283years of education 7.015 4.783 7.752 4.450 6.339 4.975

Summary Statistics – Education and Cognition Scores

Results – word test scores
0
5
10
15
20
25
30
10-14 15-19 20-24 25-29 30-34 35-39 40-44 45-49 50-54 55-59 60-64 65-69 70-
wor
d te
st sc
ores
Panel A: Mean word test scores by age and pollution level
male/less polluted female/less polluted male/more polluted female/more polluted

Results – math test scores
0
2
4
6
8
10
12
14
16
18
10-14 15-19 20-24 25-29 30-34 35-39 40-44 45-49 50-54 55-59 60-64 65-69 70-
mat
h te
st sc
ores
Panel B: Mean math test scores by age and pollution level
male/less polluted female/less polluted male/more polluted female/more polluted

Results – difference in differences
The diff-in-diff calculates gender difference (male-female) indifferences in test scores between polluted and less polluted areas.
-2
-1.5
-1
-0.5
0
0.5
10-14 15-19 20-24 25-29 30-34 35-39 40-44 45-49 50-54 55-59 60-64 65-69 70-
diffe
renc
e in
diff
ernc
esPanel C: diff-in-diff of test scores by age and pollution level
word test scores math test scores

Baseline Results – CS versu FE, controls

Baseline Results – word & math test scores

Results - Gender difference in cognitive tests – word scores
-.15
-.1-.0
50
Subsample Whole sample with an interaction1 7 30 90 180 1 yr 2 yr 4 yr 1 7 30 90 180 1 yr 2 yr 4 yr
male female gender difference

Results - Gender difference in cognitive tests – math scores
-.04
-.03
-.02
-.01
0
Subsample Whole sample with an interaction1 7 30 90 180 1 yr 2 yr 4 yr 1 7 30 90 180 1 yr 2 yr 4 yr
male female gender difference
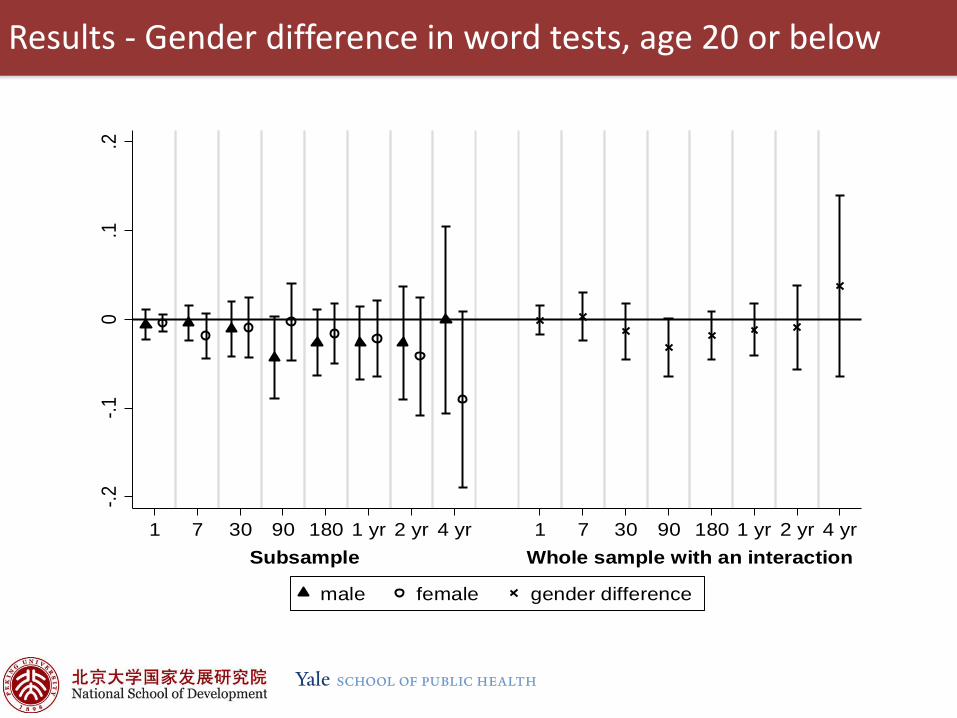
Results - Gender difference in word tests, age 20 or below
-.2-.1
0.1
.2
Subsample Whole sample with an interaction1 7 30 90 180 1 yr 2 yr 4 yr 1 7 30 90 180 1 yr 2 yr 4 yr
male female gender difference

Results - Gender difference in word tests, age 21-59
-.15
-.1-.0
50
.05
Subsample Whole sample with an interaction1 7 30 90 180 1 yr 2 yr 4 yr 1 7 30 90 180 1 yr 2 yr 4 yr
male female gender difference

Results - Gender difference in word tests, age 60 or above
-.3-.2
-.10
.1
Subsample Whole sample with an interaction1 7 30 90 180 1 yr 2 yr 4 yr 1 7 30 90 180 1 yr 2 yr 4 yr
male female gender difference

Results - Gender difference in math tests, age 20 or below
-.15
-.1-.0
50
.05
Subsample Whole sample with an interaction1 7 30 90 180 1 yr 2 yr 4 yr 1 7 30 90 180 1 yr 2 yr 4 yr
male female gender difference

Results - Gender difference in math tests, age 21-59
-.04
-.03
-.02
-.01
0.0
1
Subsample Whole sample with an interaction1 7 30 90 180 1 yr 2 yr 4 yr 1 7 30 90 180 1 yr 2 yr 4 yr
male female gender difference
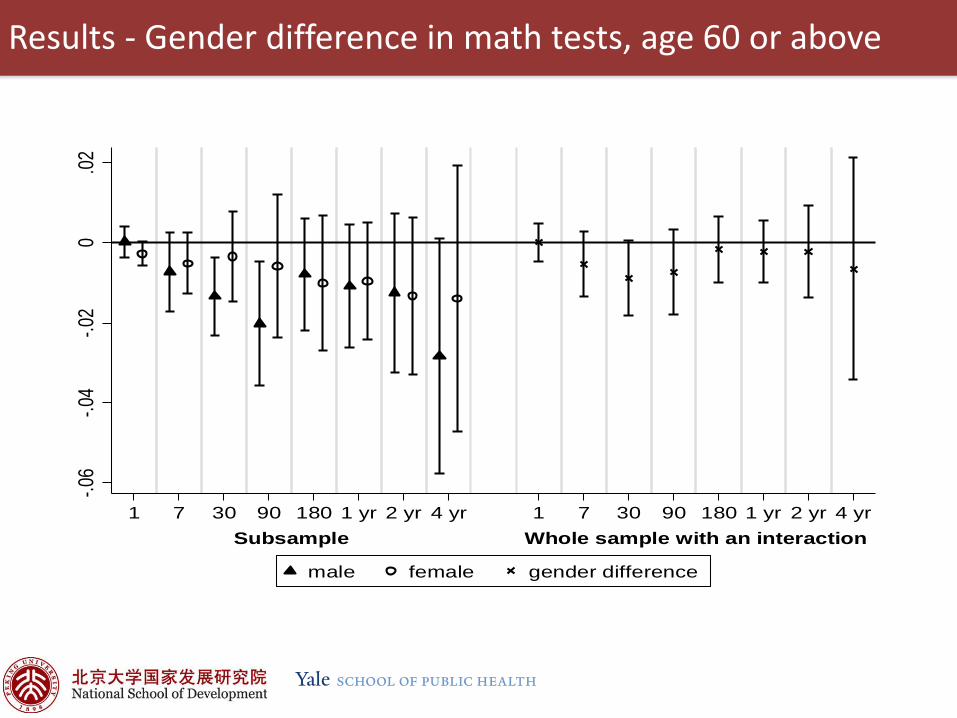
Results - Gender difference in math tests, age 60 or above-.0
6-.0
4-.0
20
.02
Subsample Whole sample with an interaction1 7 30 90 180 1 yr 2 yr 4 yr 1 7 30 90 180 1 yr 2 yr 4 yr
male female gender difference

Results - Gender difference in word tests, primary school or below
-.2-.1
5-.1
-.05
0
Subsample Whole sample with an interaction1 7 30 90 180 1 yr 2 yr 4 yr 1 7 30 90 180 1 yr 2 yr 4 yr
male female gender difference

Results - Gender difference in word tests, middle school
-.2-.1
0
Subsample Whole sample with an interaction1 7 30 90 180 1 yr 2 yr 4 yr 1 7 30 90 180 1 yr 2 yr 4 yr
male female gender difference

Results - Gender difference in word tests, high school or above
-.1-.0
50
.05
Subsample Whole sample with an interaction1 7 30 90 180 1 yr 2 yr 4 yr 1 7 30 90 180 1 yr 2 yr 4 yr
male female gender difference

Results - Gender difference in math tests, primary school or below
-.06
-.04
-.02
0.0
2
Subsample Whole sample with an interaction1 7 30 90 180 1 yr 2 yr 4 yr 1 7 30 90 180 1 yr 2 yr 4 yr
male female gender difference

Results - Gender difference in math tests, middle school
-.06
-.04
-.02
0.0
2
Subsample Whole sample with an interaction1 7 30 90 180 1 yr 2 yr 4 yr 1 7 30 90 180 1 yr 2 yr 4 yr
male female gender difference

Results - Gender difference in math tests, high school or above
-.04
-.02
0.0
2
Subsample Whole sample with an interaction1 7 30 90 180 1 yr 2 yr 4 yr 1 7 30 90 180 1 yr 2 yr 4 yr
male female gender difference
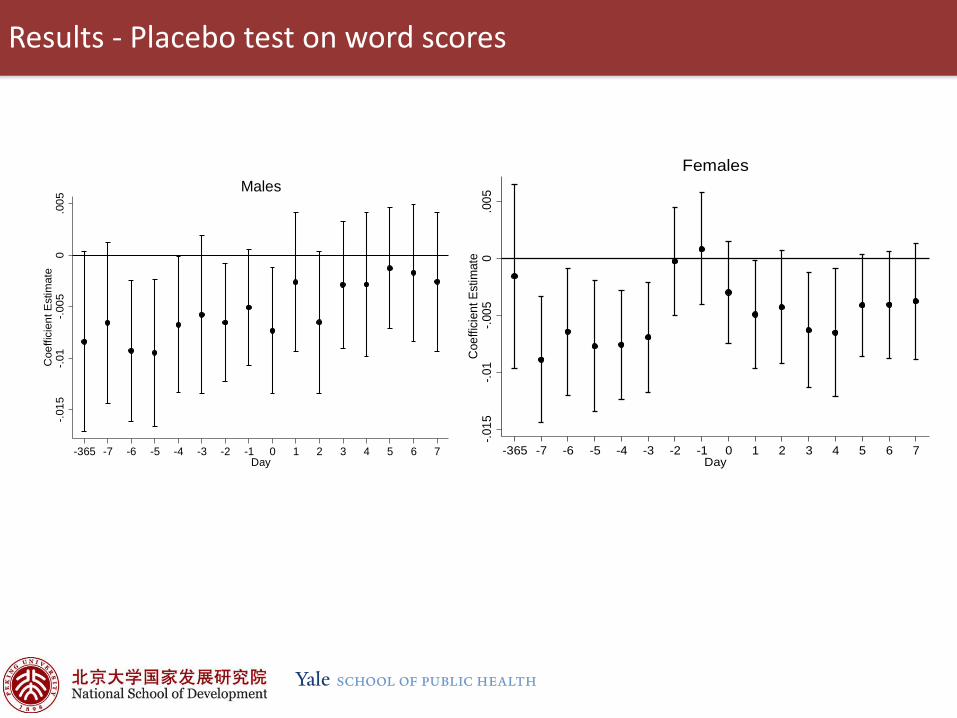
Results - Placebo test on word scores-.0
15-.0
1-.0
050
.005
Coe
ffici
ent E
stim
ate
-365 -7 -6 -5 -4 -3 -2 -1 0 1 2 3 4 5 6 7Day
Males
-.015
-.01
-.005
0.0
05C
oeffi
cien
t Est
imat
e
-365 -7 -6 -5 -4 -3 -2 -1 0 1 2 3 4 5 6 7Day
Females
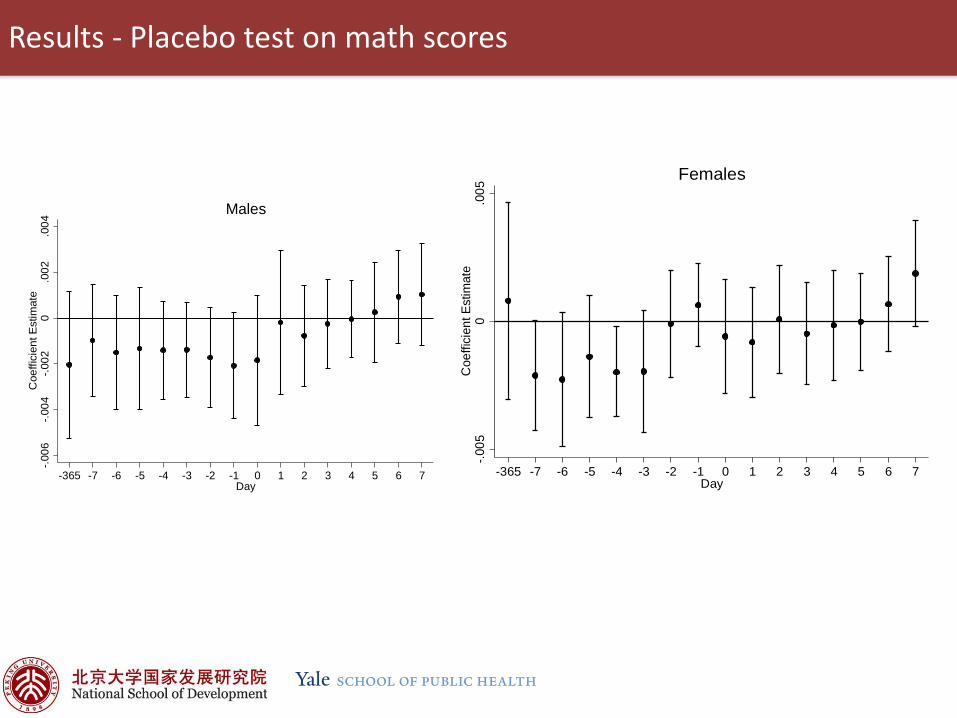
Results - Placebo test on math scores-.0
06-.0
04-.0
020
.002
.004
Coe
ffici
ent E
stim
ate
-365 -7 -6 -5 -4 -3 -2 -1 0 1 2 3 4 5 6 7Day
Males
-.005
0.0
05C
oeffi
cien
t Est
imat
e-365 -7 -6 -5 -4 -3 -2 -1 0 1 2 3 4 5 6 7
Day
Females

Results - Non-linear Specifications
Back-of-the-envelope calculations: males’ word test scores on a day with hazardous air (API≥301) are on average 0.34 SD lower than scores on a day with good air (API≤50).

Results – Contemporaneous versus Cumulative Exposure
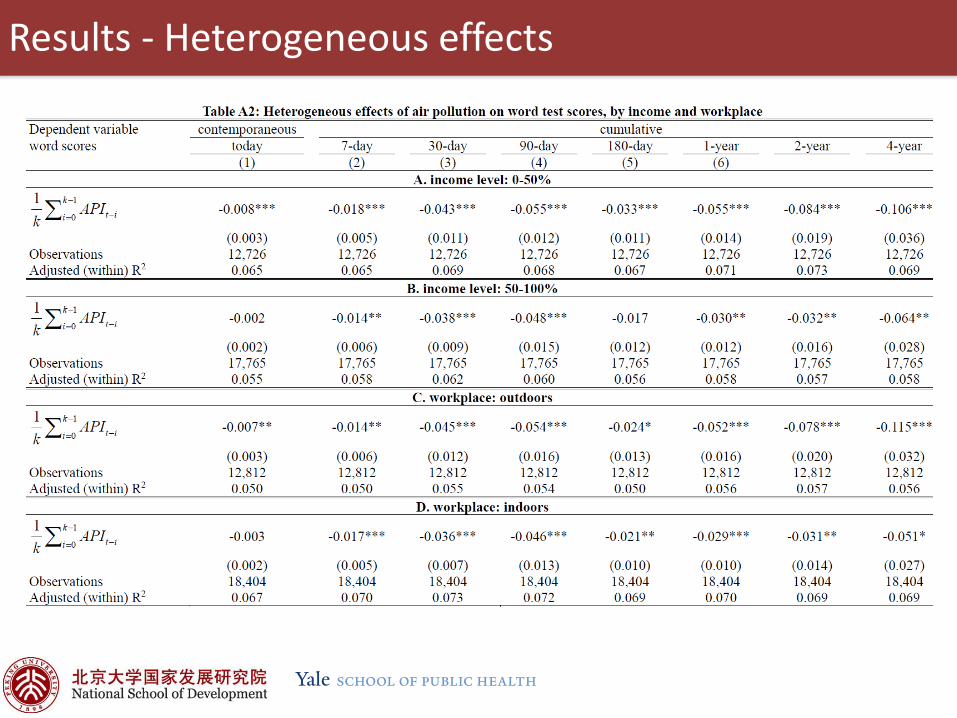
Results - Heterogeneous effects

• Gains from improving air quality may be underestimated by a narrow focus on health;
• Policy? contemporaneous versus cumulative exposure;• Air pollution impairs cognitive functioning critical to
everyday activities, human capital formation and productivity, and well-being in general;
• Leads to allocative inefficiency of workers across occupations;
• Enlarges social inequality;• Implication for other environmental stressors
Implications

Smog in Our BrainsGender Difference in the Impact of Exposures to
Air Pollution on Cognitive Performance
Thank you!