smith & williamson investment funds plc · smith & williamson investment funds plc . ... at...
TRANSCRIPT

Smith & Williamson Investment Funds Plc
An investment company with variable capital constituted as an umbrella fund with
segregated liability between sub-funds under the laws of Ireland and authorised by
the Central Bank of Ireland pursuant to the European Communities (Undertakings
for Collective Investment in Transferable Securities) Regulations 2011 as amended
and the Central Bank (Supervision and Enforcement) Act 2013 (Section 48(1))
(Undertakings for Collective Investment in Transferable Securities)
Regulations 2015 as amended (collectively the “Regulations”)
Annual Report and Audited Financial
Statements
For the financial year ended
December 31, 2018
No subscription can be received on the basis of financial reports. Subscriptions are only
valid if made on the basis of the current Prospectus which will be accompanied by a copy of
the latest available annual report and a copy of the latest available semi-annual report, if
published after such annual report.

Smith & Williamson Investment Funds Plc
1
Table of contents
Directors and Other Information
2
Investment Manager’s Report
3
Depositary’s Report
4
Directors’ Report
5 - 7
Independent Auditor’s Report
8 - 10
Statement of Financial Position
11 - 18
Statement of Comprehensive Income
19 - 22
Statement of Changes in Net Assets Attributable to Holders of Redeemable
Participating Shares
23 - 26
Statement of Cash Flows 27 - 30
Notes to the Financial Statements
31 - 90
Schedule of Investments
91 - 126
Portfolio Changes (Unaudited)
127 - 140
Unaudited Section 141 - 142

Smith & Williamson Investment Funds Plc
2
Directors and Other Information
Registered Office
Trinity Point
10-11 Leinster Street South
Dublin 2
Ireland
Investment Manager and Distributor
Smith & Williamson Investment Management LLP
25 Moorgate
London EC2R 6AY
England
Directors
Peter Blessing (Irish - Independent director)*
William Cussans (British)*
Desmond Miller (Irish - Independent director)*
Paul Wyse (Irish)*
Noel Medici (British)*
Administrator, Registrar and Transfer Agent
BNP Paribas Fund Administration Services (Ireland) Limited
Trinity Point
10-11 Leinster Street South
Dublin 2
Ireland
Depositary
BNP Paribas Securities Services, Dublin Branch
Trinity Point
10-11 Leinster Street South
Dublin 2
Ireland
Independent Auditors
Deloitte Ireland LLP
Chartered Accountants and Statutory Audit Firm
Deloitte & Touche House
Earlsfort Terrace
Dublin 2
Ireland
Legal Advisers in Ireland
A&L Goodbody Solicitors
International Financial Services Centre
North Wall Quay
Dublin 1
Ireland
Company Secretary
Goodbody Secretarial Limited
International Financial Services Centre
North Wall Quay
Dublin 1
Ireland
Manager
Smith & Williamson Investment Management (Ireland)
Limited
Trinity Point
10-11 Leinster Street South
Dublin 2
Ireland
Company Number
316015
*non-executive Director
Smith & Williamson Investment Funds Plc
3
Investment Manager’s Report
As the key worries about a possible US recession and the damage that a trade way could inflict on global growth have
receded, equity markets worldwide recovered from the lows seen at the end of 2018. Whilst markets were looking
oversold and relatively cheap, a catalyst was needed to spur the recovery, and this time it came from a reversal in
policy from the Fed, who eased fears of rising rates with a flip-flop towards no rises. We may even see a cut in rates
this year.
Following the recovery in equity markets the one question still to be answered is whether the indicators of slowing
growth that we are seeing are simply another soft patch in what has been an extremely long but slow growth cycle, or
whether we are now at a stage in the process which leads to recession and thus falls in earnings and share prices. These
worries have been compounded recently by the inversion of the US yield curve, which in the past has been a good lead
indicator of an earnings contractions approaching – but not necessarily being imminent.
But not all the indicators are negative. Indeed, there have been many positive developments that continue to point to a
slow but steady period of economic growth. Much has actually improved since the end of last year – China in
particular is responding to further stimulus, and should we see good news coming from the US – Sino trade talks, as
has recently been leaked, this could also provide added stimulus to US and Asian equities in particular. Broadly, real
rates are still very accommodative and the US is proving to be resilient. Labour markets remain very strong in key
regions, with rising wages. We are running our US and Far East positions for now.
In the UK the uncertainty caused by Brexit is helping some parts of the economy and hindering others, but as a whole
the economy isn’t doing too badly. An apparent surge in stockbuilding ahead of the original Brexit day of 29th March
boosted the Markit/CIPS manufacturing index to a 13-month high in March. In contrast, by prompting firms to delay
spending decisions, the political uncertainty contributed to the services PMI falling to its lowest level since the 2016
referendum. At face value, the two activity surveys suggest that the economy may have stagnated in Q1. The risk to
estimates that GDP rose by 0.3% in Q1 lie on the downside, but it must be remembered that the UK equity market is
still at a low valuation, suggesting much bad news is in the price.
There has been some talk that the European economy is moving into a tricky period. Bund yields in Germany have
fallen back to below zero, leading to talk about the ‘Japanification’ of Europe. There are some parallels. Inflation and
interest rates are low. Economic growth has been feeble. The banking sector looks weak. Overall, we still expect
equity markets to advance, but the relative strength from Europe is currently challenged. We have been reducing our
exposure to Europe over the past six months, and this will continue.
We are modestly bullish for equities and bonds, encouraged by global activity momentum looking to be positive, with
the US being resilient, China turning higher and Europe stabilising. However, the bottom-up analyst consensus now
expects global EPS growth of 5% in 2019, down from 7% at the start of the year, and more in-line with the 4% top-
down forecast. Gains are still expected but possibly only modest from here until the outlook for 2020 becomes clearer.
Smith & Williamson Investment Management Ltd
March 2019

Smith & Williamson Investment Funds Pie
DEPOSITARY'S REPORT TO THE SHAREHOLDERS OF SMITH & WILLIAMSON INVESTMENT FUNDS PLC FOR THE FINANCIAL YEAR ENDED DECEMBER 31,2018
In our opinion, the Company has been managed during the financial year, in all material respects:
(i) in accordance with the limitations imposed on the investment and borrowing powers of the scheme by the memorandum and articles of association and by the Central Bank of Ireland under the powers granted to the Central Bank of Ireland by the European Union (Undertakings for Collective Investment in Transferable Securities) (Amendment) Regulations 2015 as amended from time to time (the "Regulations") and the Companies Act, 2014; and
(ii) Otherwise in accordance with the provisions of the memorandum and articles of associations and the Regulations.
)v0y)lo {:oJcllvV'~-BNP Paribas Securities ~e~iJs,~in Branch Trinity Point 10-11 Leinster Street South Dublin 2 Ireland April 15, 2019
4

Smith & Williamson Investment Funds Plc
5
Directors’ Report
The Directors present their annual report together with the audited financial statements for the financial year ended
December 31, 2018.
Directors’ Responsibilities Statement
The Directors are responsible for preparing the Directors’ report and the financial statements in accordance with the
Companies Act 2014 as amended (the “Act”) and the Regulations. They have elected to prepare the financial
statements in accordance with International Financial Reporting Standards as adopted by the European Union
(“IFRS”).
Under the Act, the Directors must not approve the financial statements unless they are satisfied that they give a true
and fair view of the assets, liabilities and financial position of the Company as at the financial year end date and of the
profit or loss of the Company for the financial year.
In preparing those financial statements, the Directors are required to:
select suitable accounting policies and then apply them consistently;
make judgements and estimates that are reasonable and prudent;
state whether the financial statements have been prepared in accordance with the applicable accounting standards,
identify those standards, and note the effect and the reasons for any material departure from those standards; and
prepare the financial statements on the going concern basis unless it is inappropriate to presume that the Company
will continue in business.
The Directors confirm that they complied with the above requirements in preparing the financial statements.
The Directors are responsible for keeping adequate accounting records that are sufficient to:
- correctly record and explain the transactions of the Company;
- enable, at any time, the assets, liabilities, financial position and profit or loss of the Company to be determined
with reasonable accuracy; and
- enable the Directors to ensure that the financial statements comply with the Act, and enable those financial
statements to be audited.
To achieve this, the Directors have appointed the Administrator to ensure that the requirements of the Act, are complied
with. The accounting records are maintained at the Administrator’s offices at Trinity Point, 10-11 Leinster Street South,
Dublin 2, Ireland.
They are also responsible for safeguarding the assets of the Company and hence for taking reasonable steps for the
prevention and detection of fraud and other irregularities. To help achieve this, the Directors have delegated custody of
the Company’s assets to the Depositary.
Principal Activities
The Company commenced activities on 31 March 2000 and has been approved by the Central Bank of Ireland as an
Undertaking for Collective Investment in Transferable Securities. The Company is an open ended umbrella type
investment company comprising separate sub–funds which also have separate investment objectives.
Business Review
The Investment Manager’s Report contains a review of the factors which contributed to the performance of the
Company during the financial year. The Directors do not anticipate any changes to the investment objectives of the
existing sub-funds. As at 31 December 2018, the Company had 11 active sub-funds in operation and 1 sub-fund was
terminated during the financial year.
Risks and uncertainties
The principal risks facing the Company are described in Note 14.
Results and Distributions
The results for the financial year are set out in the Statement of Comprehensive Income on pages 19-22 and details of
distributions to investors are set out in Note 18.

Smith & Williamson Investment Funds Plc
6
Directors’ Report (continued)
Directors
The Directors that served during the financial year are listed below. All of the Directors served for the whole of the
financial year under review.
Peter Blessing (Irish - Independent director)*
William Cussans (British)*
Desmond Miller (Irish - Independent director)*
Paul Wyse (Irish)*
Noel Medici (British)*
*non-executive Director
Directors’ Interests
As at December 31, 2018 William Cussans had a beneficial interest of 225,000 shares in the Smith &Williamson Cash
Fund. Noel Medici had a beneficial interest of 16,950 units in Smith & Williamson Global Inflation Linked Bond
Fund, 20,820 units in Smith & Williamson Enterprise Fund and 20,265 units in Smith & Williamson Artificial
Intelligence Fund.
Transactions Involving Directors
There were no contracts or arrangements of any significance in relation to the business of the Company in which the
Directors had any interest as defined in the Act at any time during the financial year ended December 31, 2018 except
for the Investment Management and Distribution Agreements between the Company and Smith & Williamson
Investment Management LLP of which Noel Medici and William Cussans are employees.
Transactions with Connected Persons
In accordance with the requirements of the Central Bank (Supervision and Enforcement) Act 2013 (Section 48(1))
(Undertakings for Collective Investment in Transferable Securities) Regulations 2015 as amended the Directors
confirm that there are arrangements in place, evidenced by written procedures to ensure that any transactions carried
out between the Company and a connected person is conducted as arm’s length and in the best interests of the
shareholders. Connected persons means the Manager, Depositary and the delegates or sub-delegates of such a
management company or depositary (excluding any non-group company sub-custodians appointed by a depositary);
and any associated or group company of such a management company, depositary, delegate or sub-delegate. The
Company’s Board of Directors are satisfied that the transactions with connected persons during the financial year were
carried out as if negotiated at arm’s length and in the best interests of the shareholders.
Accounting Records
The Directors have ensured that the proper books and records requirements under Section 281 to 285 of the
Companies Act 2014 have been complied with by outsourcing this function to a specialist provider of such services.
The books of account are held at the Company’s registered office which is Trinity Point, 10 - 11 Leinster Street South,
Dublin 2.
Directors Compliance Statement
The Directors acknowledge that they are responsible for securing the Company’s compliance with the relevant
obligations as set out in Section 225 of the Companies Act 2014. The Directors confirm that:
A compliance policy document has been drawn up that sets out policies, that in our opinion are appropriate to the
company, respecting compliance by the company with its relevant obligations,
Appropriate arrangements or structures are in place that are, in our opinion, designed to secure material
compliance with the company's relevant obligations, and
During the financial year, the arrangements or structures referred to above have been reviewed.

Smith & Williamson Investment Funds Pie
Directors' Report (continued)
Statement of Relevant Audit Information The Directors acknowledge that they are responsible for providing all relevant audit information to the Company's statutory auditors in connection with preparing their report in accordance with Section 330 of the Companies Act 2014. The Directors confirm that:
• So far as the Directors are aware, there is no relevant audit information of which the Company's statutory auditors are not aware, and
• The Directors have taken all the steps that ought to have been taken as a Director in order to make himself or herself aware of any relevant audit information and to establish that the Company's statutory auditors are aware of that information.
Audit Committee Statement Section 167 (2) of the Act, requires the Board of Directors to either establish an audit committee or decide not to establish such a committee. The Directors believe that there is no requirement to form an audit committee as: Due consideration and oversight is given to the Company's financial reporting processes, internal controls and independent auditors at the quarterly Board meetings.
Voluntary Corporate Governance Code for the Irish Funds Industry The Company has complied with all elements of the Irish Funds' Corporate Governance Code for Collective Investment
Schemes and Management Companies during the financial year ended December 31, 2018.
Significant events during the financial year Smith &Williamson Medium Dated Corporate Bond Fund was terminated on June 15,2018.
A new Prospectus was issued on August 28, 2018.
Events post financial year end There were no significant events after the financial year end.
Independent Auditor The auditors, Deloitte Ireland LLP, Chartered Accountants and Statutory Audit Firm, have signified their willingness to continue in office in accordance with Section 383(2) of the Companies Act, 2014.
Signed on behalfofthe Board
April 15, 2019
7

Deloitte. Deloitte Ireland LLP Chartered Accountants & Statutory Audit Firm
INDEPENDENT AUDITOR'S REPORT TO THE SHAREHOLDERS OF SMITH & WILLIAMSON INVESTMENT FUND PLC
Report on the audit of the financial statements
Opinion on the financial statements of Smith & Williamson Investment Fund Pie ("the company") In our opinion the financial statements:
• give a true and fair view of the assets, liabilities and financial position of the company as at December 31, 2018 and of the loss for the financial year then ended; and
• have been properly prepared in accordance with the relevant financial reporting framework, the applicable Regulations and, in particular, with the requirements of the Companies Act 2014 and the European Communities (Undertaking for Collective Investment in Transferable Securities) regulation 2011 and the Central Bank (Supervision and Enforcement) Act 2013 (Section 48(1)) (Undertakings for Collective Investment in transferable Securities) Regulations 2015.
The financial statements we have audited comprise:
• the Statement of Financial Position; • the Statement of Comprehensive Income • the Statement of Changes in Net Assets attributable to holders of Redeemable Shares; • the Statement of Cash Flows; and • the related notes 1 to 25, including a summary of significant accounting policies as set out in note 2.
The relevant financial reporting framework that has been applied in their preparation is the Companies Act 2014 and Intrnational Finacnia Reporting Standards (IFRSs) as adopted by the European Union ("the relevant financial reporting framework").
Basis for opinion We conducted our audit in accordance with International Standards on Auditing (Ireland) (ISAs (Ireland)) and applicable law. Our responsibilities under those standards are described below in the "Auditor's responsibilities for the audit of the financial statements" section of our report .
We are independent of the company in accordance with the ethical requirements that are relevant to our audit of the financial statements in Ireland, including the Ethical Standard issued by the Irish Auditing and Accounting Supervisory Authority, and we have fulfilled our other ethical responsibilities in accordance with these requirements. We believe that the audit evidence we have obtained is sufficient and appropriate to provide a basis for our opinion .
Conclusions relating to going concern We have nothing to report in respect of the following matters in relation to which ISAs (Ireland) require us to report to you where :
• the directors' use of the going concern basis of accounting in preparation of the financial statements is not appropriate; or
• the directors have not disclosed in the financial statements any identified material uncertainties that may cast significant doubt about the company's ability to continue to adopt the going concern basis of accounting for a period of at least twelve months from the date when the financial statements are authorised for issue.
Other information The directors are responsible for the other information. The other information comprises the information included in the Annual Report, other than the financial statements and our auditor's report thereon. Our opinion on the financial statements does not cover the other information and, except to the extent otherwise explicitly stated in our report, we do not express any form of assurance conclusion thereon .
Continued on next page/
8

Deloitte. / Continued from previous page
INDEPENDENT AUDITOR'S REPORT TO THE SHAREHOLDERS OF SMITH & WILLIAMSON INVESTMENT FUND PLC
In connection with our audit of the financial statements, our responsibility is to read the other information and, in doing so, consider whether the other information is materially inconsistent with the financial statements or our knowledge obtained in the audit or otherwise appears to be materially misstated. If we identify such material inconsistencies or apparent material misstatements, we are required to determine whether there is a material misstatement in the financial statements or a material misstatement of the other information. If, based on the work we have performed, we conclude that there is a material misstatement of this other information, we are requ ired to report that fact.
We have nothing to report in this regard.
Responsibilities of directors As explained more fully in the Directors ' Report, the directors are responsible for the preparation of the financial statements and for being satisfied that they give a true and fair view and otherwise comply with the Companies Act 2014, and for such internal control as the directors determine is necessary to enable the preparation of financial statements that are free from material misstatement, whether due to fraud or error.
In preparing the financial statements, the directors are responsible for assessing the Company 's ability to continue as a going concern, disclosing, as applicable, matters related to going concern and using the going concern basis of accounting unless the directors either intend to liquidate the Company or to cease operations, or have no realistic alternative but to do so.
Auditor's responsibilities for the audit of the financial statements Our objectives are to obtain reasonable assurance about whether the financial statements as a whole are free from material misstatement, whether due to fraud or error, and to issue an auditor's report that includes our opinion . Reasonable assurance is a high level of assurance, but is not a guarantee that an audit conducted in accordance with ISAs (Ireland) will always detect a material misstatement when it ex ists . Misstatements can arise from fraud or error and are considered material if, individually or in the aggregate, they could reasonably be expected to influence the economic decisions of users taken on the basis of these financial statements .
As part of an audit in accordance with ISAs (Ireland) , we exercise professional judgment and maintain professional scepticism throughout the audit. We also:
• Identify and assess the risks of material misstatement of the financial statements, whether due to fraud or error, design and perform audit procedures responsive to those risks, and obtain audit evidence that is sufficient and appropriate to provide a basis for our opinion. The risk of not detecting a material misstatement resulting from fraud is higher than for one resulting from error, as fraud may involve collusion, forgery, intentional omissions, misrepresentations, or the override of internal control.
• Obtain an understanding of internal control relevant to the audit in order to design audit procedures that are appropriate in the circumstances, but not for the purpose of expressing an opinion on the effectiveness of the company's internal control.
• Evaluate the appropriateness of accounting policies used and the reasonableness of accounting estimates and related disclosures made by the directors.
• Conclude on the appropriateness of the directors ' use of the going concern basis of accounting and, based on the audit evidence obtained, whether a material uncertainty exists related to events or conditions that may cast significant doubt on the company's ability to continue as a going concern . If we conclude that a material uncertainty exists, we are required to draw attention in our auditor's report to the related disclosures in the financial statements or, if such disclosures are inadequate, to modify our opinion. Our conclusions are based on the audit evidence obtained up to the date of the auditor's report . However, future events or conditions may cause the entity ( or where relevant, the group) to cease to continue as a going concern.
Continued on nex t page/
9

Deloitte. / Continued from previous page
INDEPENDENT AUDITOR'S REPORT TO THE SHAREHOLDERS OF SMITH & WILLIAMSON INVESTMENT FUND PLC
• Evaluate the overall presentation, structure and content of the financial statements, including the disclosures, and whether the financial statements represent the underlying transactions and events in a manner that achieves fair presentation.
We communicate with those charged with governance regarding, among other matters, the planned scope and timing of the audit and significant audit findings, including any significant deficiencies in internal control that the auditor identifies during the audit .
This report is made solely to the company's shareholders, as a body, in accordance with Section 391 of the Companies Act 2014. Our audit work has been undertaken so that we might state to the company's shareholders those matters we are required to state to them in an auditor's report and for no other purpose. To the fullest extent permitted by law, we do not accept or assume responsibility to anyone other than the company and the company 's shareholders as a body, for our audit work, for this report, or for the opinions we have formed.
Report on other legal and regulatory requirements
Opinion on other matters prescribed by the Companies Act 2014 Based solely on the work undertaken in the course of the audit, we report that :
• We have obtained all the information and explanations which we consider necessary for the purposes of our audit. • In our opinion the accounting records of the company were sufficient to permit the financial statements to be
read ily and properly audited . • The financial statements are in agreement with the accounting records. • In our opinion the information given in the directors' report is consistent with the financial statements and the
directors' report has been prepared in accordance with the Companies Act 2014.
Matters on which we are required to report by exception Based on the knowledge and understanding of the company and its environment obtained in the course of the audit, we have not identified material misstatements in the directors' report.
We have nothing to report in respect of the provisions in the Companies Act 2014 which require us to report to you if, ur opinion, the disclosures of directors' remuneration and transactions specified by law are not made.
is ian' acManus For and on behalf of Deloitte Ireland LLP Chartered Accountants and Statutory Audit Firm Deloitte & Touche House, Earlsfort Terrace, Dublin 2 Ireland
29 April 2019
10

Smith & Williamson Investment Funds Plc
11
Statement of Financial Position
as at December 31, 2018
Wye
Investment
Fund
Boulder
Investment
Fund
Santos
Investment
Fund
Smith &
Williamson
Defensive
Growth Fund
Smith &
Williamson
Cash Fund
Smith &
Williamson
Short Dated
Corporate
Bond Fund
Smith &
Williamson
Enterprise
Fund
Notes GBP GBP GBP GBP GBP GBP GBP
Assets
Financial assets at fair value through profit or loss 5,15 19,299,230 17,914,517 12,519,562 39,712,719 - 224,254,945 18,569,306
Cash at bank 7 80,192 157,686 187,762 2,597,868 6,731 1,657,844 13,406,091
Loans and receivables 8 - - - - 45,072,930 23,974,130 99,604,614
Debtors 6 67,260 24,089 42,661 122,564 69,989 6,083,079 214,966
Total assets 19,446,682 18,096,292 12,749,985 42,433,151 45,149,650 255,969,998 131,794,977
Current liabilities
Financial liabilities at fair value through profit or loss 5,15 - - - - - 345,557 311,390
Bank overdraft 7 - - - - - - 30,001
Dividends payable 18 199,262 - 85,025 150,565 61,127 1,868,016 -
Other liabilities 9 27,839 24,868 21,715 1,319,972 24,594 2,306,923 718,667
Due to shareholders - - - 121,325 5,619 36,807 30,479
Total current liabilities (excluding net assets attributable
to holders of redeemable participating shares) 227,101 24,868 106,740 1,591,862 91,340 4,557,303 1,090,537
Net assets attributable to holders of redeemable
participating shares 19,219,581 18,071,424 12,643,245 40,841,289 45,058,310 251,412,695 130,704,440
The notes 1 to 25 form an integral part of the financial statements.

Smith & Williamson Investment Funds Plc
12
Statement of Financial Position
as at December 31, 2018 (continued)
Smith &
Williamson
Global
Inflation
Linked Bond
Fund
Smith &
Williamson
Medium Dated
Corporate
Bond Fund*
Smith &
Williamson
Mid Ocean
World
Investment
Fund
Smith &
Williamson
Blairmore
Global
Equity Fund
Smith &
Williamson
Artificial
Intelligence
Fund
Cross
Investments Total
Notes GBP GBP USD USD GBP GBP GBP
Assets
Financial assets at fair value through profit or loss 5,15 113,442,006 - 67,048,039 26,907,654 114,146,135 (3,300,950) 630,327,245
Cash at bank 7 2,257,306 20,590 3,269,388 1,243,276 8,958,415 - 32,873,625
Loans and receivables 8 - - - - - - 168,651,674
Debtors 6 523,615 9 51,614 30,151 326,330 - 7,538,760
Total assets 116,222,927 20,599 70,369,041 28,181,081 123,430,880 (3,300,950) 839,391,304
Current liabilities
Financial liabilities at fair value through profit or loss 5,15 280,953 - - - - - 937,900
Bank overdraft 7 2,095 - - 2,090 - - 33,737
Dividends payable 18 478,262 - 129,272 - - - 2,943,756
Other liabilities 9 87,421 20,599 91,035 46,543 608,267 - 5,268,884
Due to shareholders 11,717 - 5,796 - 133,449 - 343,947
Total current liabilities (excluding net assets attributable
to holders of redeemable participating shares) 860,448 20,599 226,103 48,633 741,716 - 9,528,224
Net assets attributable to holders of redeemable
participating shares 115,362,479 - 70,142,938 28,132,448 122,689,164 (3,300,950) 829,863,080
*Terminated on June 15, 2018.
The notes 1 to 25 form an integral part of the financial statements.
Smith & Williamson Investment Funds Plc
13
Statement of Financial Position
as at December 31, 2018
(continued)
Wye
Investment
Fund
Boulder
Investment
Fund
Santos
Investment
Fund
Smith &
Williamson
Defensive
Growth
Fund
Smith &
Williamson
Cash
Fund
Smith &
Williamson
Short Dated
Corporate
Bond
Fund
Smith &
Williamson
Enterprise
Fund
Smith &
Williamson
Global
Inflation
Linked Bond
Fund
Smith &
Williamson
Medium
Dated
Corporate
Bond
Fund*
Smith &
Williamson
Mid Ocean
World
Investment
Fund
Smith &
Williamson
Blairmore
Global
Equity
Fund
Smith &
Williamson
Artificial
Intelligence
Fund
Notes Shares outstanding at the end of the financial year 10
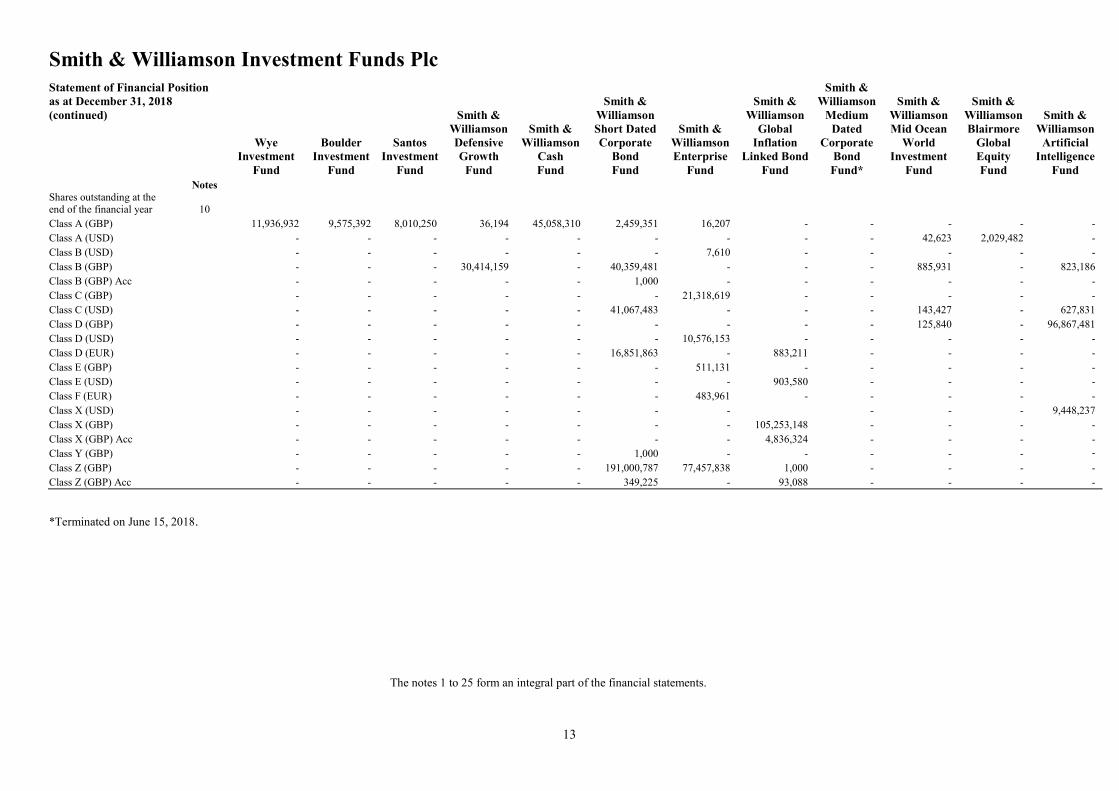
Class A (GBP) 11,936,932 9,575,392 8,010,250 36,194 45,058,310 2,459,351 16,207 - - - - -
Class A (USD) - - - - - - - - - 42,623 2,029,482 -
Class B (USD) - - - - - - 7,610 - - - - -
Class B (GBP) - - - 30,414,159 - 40,359,481 - - - 885,931 - 823,186
Class B (GBP) Acc - - - - - 1,000 - - - - - -
Class C (GBP) - - - - - - 21,318,619 - - - - -
Class C (USD) - - - - - 41,067,483 - - - 143,427 - 627,831
Class D (GBP) - - - - - - - - - 125,840 - 96,867,481
Class D (USD) - - - - - - 10,576,153 - - - - -
Class D (EUR) - - - - - 16,851,863 - 883,211 - - - -
Class E (GBP) - - - - - - 511,131 - - - - -
Class E (USD) - - - - - - - 903,580 - - - -
Class F (EUR) - - - - - - 483,961 - - - - -
Class X (USD) - - - - - - - - - - 9,448,237
Class X (GBP) - - - - - - - 105,253,148 - - - -
Class X (GBP) Acc - - - - - - - 4,836,324 - - - -
Class Y (GBP) - - - - - 1,000 - - - - - -
Class Z (GBP) - - - - - 191,000,787 77,457,838 1,000 - - - -
Class Z (GBP) Acc - - - - - 349,225 - 93,088 - - - -
*Terminated on June 15, 2018.
The notes 1 to 25 form an integral part of the financial statements.

Smith & Williamson Investment Funds Pie Statement of Financial Position as at December 31, 2018 (continued)
Net Asset Value per Class A Share (GBP)
Net Asset Value per Class A Share (USD)
Net Asset Value per Class B Share (USD)
Net Asset Value per Class B Share (GBP)
Net Asset Value per Class B Share (GBP) Ace Net Asset Value per Class C Share (GBP)
Net Asset Value per Class C Share (USD)
Net Asset Value per Class D Share (GBP)
Net Asset Value per Class D Share (USD)
Net Asset Value per Class D Share (EUR)
Net Asset Value per Class E Share (GBP)
Net Asset Value per Class E Share (USD)
Net Asset Value per Class F Share (EUR)
Net Asset Value per Class X Share (USD)
Net Asset Value per Class X Share (GBP)
Net Asset Value per Class X Share (GBP) Ace
Net Asset Value per Class Y Share (GBP)
Net Asset Value per Class Z Share (GBP) Net Asset Value per Class Z Share (GBP) Ace
*Terminated on June 15. 2018.
Signed on behalf of the Board of Directors:
Notes 11
Wye Boulder Santos Investment Investment Investment
Fund Fund Fund
1.6101 1.8873 1.5784
Peter Blessing ----... Paul Wyse Director: ___ __,__________ Director: Date: April 15. 2019
Smith & Williamson Defensive Growth
Fund
19.2944
1.3199
Smith & Williamson
Cash Fund
1.0000
Smith & Williamson Short Dated Corporate
Bond Fund
0.9086
0.8943
0.9966
0.8755
0.8230
0.8999
0.9008 0.9962
Smith & Williamson Enterprise
Fund
211.8564
208.2088
1.3771
1.0642
13049
10256
I I !96
The notes 1 to 25 form an integral part of the financial statements.
14
Smith & Williamson
Global Inflation
Linked Bond Fund
0.9879
1.0059
10318
10696
0.9878 0.9782
Smith & Williamson
Medium Dated
Corporate Bond Fund*
Smith & Williamson Mid Ocean
World Investment
Fund
365.6845
13801
367.9657
13910
Smith & Williamson Blairmore
Global Equity Fund
13.8619
Smith & Williamson
Artificial Intelligence
Fund
1.1575
1 1535 l.1621
1585

Smith & Williamson Investment Funds Plc
15
Statement of Financial Position
as at December 31, 2017
Wye
Investment
Fund
Boulder
Investment
Fund
Santos
Investment
Fund
Smith &
Williamson
Defensive
Growth
Fund
Smith &
Williamson
Cash
Fund
Smith &
Williamson
Short Dated
Corporate
Bond Fund
Smith &
Williamson
Enterprise
Fund
Notes GBP GBP GBP GBP GBP GBP GBP
Assets
Financial assets at fair value through profit or loss 5,15 20,651,376 20,721,729 13,111,506 24,725,724 - 352,120,384 26,569,663
Cash at bank 7 56,864 77,931 522,053 1,757,045 1,925 5,820,688 19,989,862
Loans and receivables 8 - - - - 47,157,284 34,937,175 90,185,890
Debtors 6 107,320 19,874 34,585 249,992 34,297 6,997,985 1,244,511
Total assets 20,815,560 20,819,534 13,668,144 26,732,761 47,193,506 399,876,232 137,989,926
Current liabilities
Financial liabilities at fair value through profit or loss 5,15 - - - - - 331,580 198,070
Bank overdraft 7 - - - - - 350,000 80,825
Dividends payable 18 214,693 43,346 63,750 86,984 13,658 2,787,586 -
Other liabilities 9 22,639 26,232 21,776 33,520 25,525 2,878,926 661,445
Due to shareholders - - - 115,423 - 1,567,952 113,776
Total current liabilities (excluding net assets attributable
to holders of redeemable participating shares) 237,332 69,578 85,526 235,927 39,183 7,916,044 1,054,116
Net assets attributable to holders of redeemable
participating shares 20,578,228 20,749,956 13,582,618 26,496,834 47,154,323 391,960,188 136,935,810
The notes 1 to 25 form an integral part of the financial statements.

Smith & Williamson Investment Funds Plc
16
* Formerly known as Smith & Williamson Global Government Bond Fund.
** Launched on June 23, 2017.
The notes 1 to 25 form an integral part of the financial statements.
Statement of Financial Position
as at December 31, 2017 (continued)
Smith &
Williamson
Global Inflation
Linked Bond
Fund*
Smith &
Williamson
Medium
Dated
Corporate
Bond Fund
Smith &
Williamson
Mid Ocean
World
Investment
Fund
Smith &
Williamson
Blairmore
Global
Equity
Fund
Smith &
Williamson
Artificial
Intelligence
Fund** Total
Notes GBP GBP USD USD GBP GBP
Assets
Financial assets at fair value through profit or loss 5,15 66,166,219 3,741,683 88,527,358 34,894,642 41,125,822 660,169,595
Cash at bank 7 729,237 18,190 1,436,928 235,923 2,542,950 32,753,343
Loans and receivables 8 - - - - - 172,280,349
Debtors 6 380,585 48,175 66,467 20,132 865,359 10,046,698
Total assets 67,276,041 3,808,048 90,030,753 35,150,697 44,534,131 875,249,985
Current liabilities
Financial liabilities at fair value through profit or loss 5,15 149,736 - - - - 679,386
Bank overdraft 7 - - 168,543 - 908,403 1,463,818
Dividends payable 18 167,326 22,482 45,286 - - 3,433,301
Other liabilities 9 19,761 13,725 94,188 105,718 50,206 3,901,529
Due to shareholders 468,600 - - - - 2,265,751
Total current liabilities (excluding net assets attributable
to holders of redeemable participating shares) 805,423 36,207 308,017 105,718 958,609 11,743,785
Net assets attributable to holders of redeemable
participating shares 66,470,618 3,771,841 89,722,736 35,044,979 43,575,522 863,506,200

Smith & Williamson Investment Funds Plc
17
Statement of Financial Position
as at December 31, 2017
(continued)
Boulder
Investment
Fund
Santos
Investment
Fund
Smith &
Williamson
Defensive
Growth
Fund
Smith &
Williamson
Cash
Fund
Smith &
Williamson
Short Dated
Corporate
Bond
Fund
Smith &
Williamson
Enterprise
Fund
Smith &
Williamson
Global
Inflation
Linked Bond
Fund*
Smith &
Williamson
Medium
Dated
Corporate
Bond
Fund
Smith &
Williamson
Mid Ocean
World
Investment
Fund
Smith &
Williamson
Blairmore
Global
Equity
Fund
Smith &
Williamson
Artificial
Intelligence
Fund**
Wye
Investment
Fund
Notes
Shares outstanding at the
end of the financial year 10
Class A (GBP) 11,708,296 9,568,718 8,010,250 33,778 47,154,323 3,585,499 21,056 - - - - -
Class A (USD) - - - - - - - - - 51,009 2,165,177 -
Class B (USD) - - - - - - 7,610 - - - - -
Class B (GBP) - - - 19,366,636 - 102,951,205 - - 3,741,677 880,821 - 90,390
Class B (GBP) Acc - - - - - 1,000 - - - - - -
Class C (GBP) - - - - - - 17,924,203 - - - - -
Class C (USD) - - - - - 47,600,462 - - - 157,240 - 92,200
Class D (GBP) - - - - - - - - - 125,840 - -
Class D (USD) - - - - - - 9,583,118 - - - - -
Class D (EUR) - - - - - 22,048,836 - - - - - -
Class E (GBP) - - - - - - 119,523 - - - - -
Class F (EUR) - - - - - - 693,941 - - - - -
Class X (USD) - - - - - - - - - - - 6,591,437
Class X (GBP) - - - - - - - 58,123,686 - - - -
Class X (GBP) Acc - - - - - - - 4,630,425 - - - -
Class Y (GBP) - - - - - 1,000 - - - - - -
Class Z (GBP) - - - - - 248,621,919 81,027,351 1,000 - - - 34,318,760
Class Z (GBP) Acc - - - - - 12,488,080 - 1,000 - - - -
* Formerly known as Smith & Williamson Global Government Bond Fund.
** Launched on June 23, 2017.
The notes 1 to 25 form an integral part of the financial statements.

Smith & Williamson Investment Funds Plc
18
Statement of Financial Position
as at December 31, 2017 (continued)
Wye
Investment
Fund
Boulder
Investment
Fund
Santos
Investment
Fund
Smith &
Williamson
Defensive
Growth
Fund
Smith &
Williamson
Cash
Fund
Smith &
Williamson
Short Dated
Corporate
Bond
Fund
Smith &
Williamson
Enterprise
Fund
Smith &
Williamson
Global
Inflation
Linked Bond
Fund*
Smith &
Williamson
Medium
Dated
Corporate
Bond
Fund
Smith &
Williamson
Mid Ocean
World
Investment
Fund
Smith &
Williamson
Blairmore
Global
Equity
Fund
Smith &
Williamson
Artificial
Intelligence
Fund**
Notes
Net Asset Value per Class A Share (GBP) 11 1.7576 2.1685 1.6957 19.5027 1.0000 0.9421 225.7540 - - - - -
Net Asset Value per Class A Share (USD) - - - - - - - - - 419.4714 16.1857 -
Net Asset Value per Class B Share (USD) - - - - - - 218.3499 - - - - -
Net Asset Value per Class B Share (GBP) - - - 1.3342 - 0.9272 - - 1.0081 1.4905 - 1.0981
Net Asset Value per Class B Share (GBP) Acc - - - - - 1.0030 - - - - - -
Net Asset Value per Class C Share (GBP) - - - - - - 1.4587 - - - - -
Net Asset Value per Class C Share (USD) - - - - - 0.8941 - - - 421.6183 - 1.1624
Net Asset Value per Class D Share (GBP) - - - - - - - - - 1.4969 - -
Net Asset Value per Class D Share (USD) - - - - - - 1.1099 - - - - -
Net Asset Value per Class D Share (EUR) - - - - - 0.8637 - - - - - -
Net Asset Value per Class E Share (GBP) - - - - - - 1.3942 - - - - -
Net Asset Value per Class F Share (EUR) - - - - - - 1.0986 - - - - -
Net Asset Value per Class X Share (USD) - - - - - - - - - - - 1.1639
Net Asset Value per Class X Share (GBP) - - - - - - - 1.0570 - - - -
Net Asset Value per Class X Share (GBP) Acc - - - - - - - 1.0866 - - - -
Net Asset Value per Class Y Share (GBP) - - - - - 0.9335 - - - - - -
Net Asset Value per Class Z Share (GBP) - - - - - 0.9340 1.1860 1.0043 - - - 1.0993
Net Asset Value per Class Z Share (GBP) Acc - - - - - 1.0033 - 1.0021 - - - -
* Formerly known as Smith & Williamson Global Government Bond Fund.
** Launched on June 23, 2017.
The notes 1 to 25 form an integral part of the financial statements.

Smith & Williamson Investment Funds Plc
19
Statement of Comprehensive Income
for the Financial Year Ended December 31, 2018
Wye
Investment
Fund
Boulder
Investment
Fund
Santos
Investment
Fund
Smith &
Williamson
Defensive
Growth Fund
Smith &
Williamson
Cash Fund
Smith &
Williamson
Short Dated
Corporate
Bond Fund
Smith &
Williamson
Enterprise
Fund
Notes GBP GBP GBP GBP GBP GBP GBP
Income
Income from investments 3 628,442 332,414 338,301 481,086 251,855 10,542,903 2,768,218
Net realised gain/(loss) on investments at fair value through
profit or loss 12 1,156,157 410,172 339,368 758,291 - (12,201,275) (6,371,810)
Movement in unrealised (depreciation)/appreciation on
investments at fair value through profit or loss 12 (2,894,722) (3,102,940) (1,278,748) (1,308,342) (2,229) 1,973,150 (2,489,539)
Total investment (loss)/income (1,110,123) (2,360,354) (601,079) (68,965) 249,626 314,778 (6,093,131)
Operating expenses
Management fees 13 91,177 204,023 125,291 227,341 118,691 1,542,577 1,338,153
Other expenses 4 60,079 35,553 23,012 37,626 37,455 69,930 154,199
Performance fees 13 - - - - - - 8,593
Total operating expenses 151,256 239,576 148,303 264,967 156,146 1,612,507 1,500,945
Operating (loss)/profit (1,261,379) (2,599,930) (749,382) (333,932) 93,480 (1,297,729) (7,594,076)
Finance costs
Distributions to holders of redeemable participating shares 18 413,729 35,038 167,369 225,378 97,164 8,404,019 -
Equalisation (received)/paid (1,738) (50) - (30,962) (4,125) 470,007 -
Interest charge on bank overdraft 1,355 71 43 112 283 3,341 10,292
Total finance cost 413,346 35,059 167,412 194,528 93,322 8,877,367 10,292
(Loss)/profit before tax (1,674,725) (2,634,989) (916,794) (528,460) 158 (10,175,096) (7,604,368)
Withholding tax on dividends 63,833 55,712 22,579 19,617 - - 11,948
Withholding tax on bond interest - - - - - 13,323 -
(Decrease)/increase in net assets from operations attributable
to holders of redeemable participating shares (1,738,558) (2,690,701) (939,373) (548,077) 158 (10,188,419) (7,616,316)
All amounts arose solely from continuing operations. There were no gains or losses other than those dealt with in the Statement of Comprehensive Income.
The notes 1 to 25 form an integral part of the financial statements.

Smith & Williamson Investment Funds Plc
20
Statement of Comprehensive Income
for the Financial Year Ended December 31, 2018 (continued)
Smith &
Williamson
Global
Inflation
Linked Bond
Fund
Smith &
Williamson
Medium Dated
Corporate
Bond Fund*
Smith &
Williamson
Mid Ocean
World
Investment
Fund
Smith &
Williamson
Blairmore
Global
Equity Fund
Smith &
Williamson
Artificial
Intelligence
Fund
Cross
Investments Total
Notes GBP GBP USD USD GBP GBP GBP
Income
Income from investments 3 1,100,596 26,315 1,607,681 571,425 787,815 - 18,890,247
Net realised gain/(loss) on investments at fair value through
profit or loss 12 (3,311,999) (71,702) 5,626,592 2,684,989 2,138,749 - (10,928,095)
Movement in unrealised (depreciation)/appreciation on
investments at fair value through profit or loss 12 1,244,068 (45,493) (15,904,677) (7,476,761) (8,660,299) (325,901) (34,405,325)
Total investment (loss)/income (967,335) (90,880) (8,670,404) (4,220,347) (5,733,735) (325,901) (26,443,173)
Operating expenses
Management fees 13 241,456 5,694 768,169 332,982 485,280 - 5,204,522
Other expenses 4 26,914 24,780 124,948 67,119 175,718 - 789,135
Performance fees 13 - - - - - - 8,593
Total operating expenses 268,370 30,474 893,117 400,101 660,998 - 6,002,250
Operating (loss)/profit (1,235,705) (121,354) (9,563,521) (4,620,448) (6,394,733) (325,901) (32,445,423)
Finance costs
Distributions to holders of redeemable participating shares 18 869,041 429 392,816 - - - 10,506,414
Equalisation (received)/paid (101,443) 1,055 7,201 2,530 (813) - 339,220
Interest charge on bank overdraft 6,732 19 4,843 - 6,813 - 32,689
Total finance cost 774,330 1,503 404,860 2,530 6,000 - 10,878,323
(Loss)/profit before tax (2,010,035) (122,857) (9,968,381) (4,622,978) (6,400,733) (325,901) (43,323,746)
Withholding tax on dividends - 332,584 87,729 137,421 625,954
Withholding tax on bond interest - - - - - 13,323
(Decrease)/increase in net assets from operations attributable
to holders of redeemable participating shares (2,010,035) (122,857) (10,300,965) (4,710,707) (6,538,154) (325,901) (43,963,023)
*Terminated on June 15, 2018.
All amounts arose solely from continuing operations. There were no gains or losses other than those dealt with in the Statement of Comprehensive Income.
The notes 1 to 25 form an integral part of the financial statements.

Smith & Williamson Investment Funds Plc
21
Statement of Comprehensive Income
for the Financial Year Ended December 31, 2017
Wye
Investment
Fund
Boulder
Investment
Fund
Santos
Investment
Fund
Smith &
Williamson
Defensive
Growth Fund
Smith &
Williamson
Cash Fund
Smith &
Williamson
Short Dated
Corporate
Bond Fund
Smith &
Williamson
Enterprise
Fund
Notes GBP GBP GBP GBP GBP GBP GBP
Income
Income from investments 3 626,744 394,212 357,467 329,702 163,781 15,719,967 1,938,939
Net realised gain on investments at fair value
through profit or loss 12 1,894,417 800,633 553,047 608,565 - 180,916 6,538,119
Movement in unrealised (depreciation)/appreciation on
investments at fair value through profit or loss 12 (255,032) 2,388,450 769,217 618,365 - (11,365,634) (397,183)
Total investment income 2,266,129 3,583,295 1,679,731 1,556,632 163,781 4,535,249 8,079,875
Operating expenses
Management fees 13 91,696 188,401 129,962 150,413 93,356 2,316,668 1,180,781
Other expenses 4 52,813 35,956 23,265 27,093 34,603 128,360 179,121
Performance fees 13 - - - - - - 918,094
Total operating expenses 144,509 224,357 153,227 177,506 127,959 2,445,028 2,277,996
Operating profit 2,121,620 3,358,938 1,526,504 1,379,126 35,822 2,090,221 5,801,879
Finance costs
Distributions to holders of redeemable participating shares 18 422,046 112,218 180,068 154,564 34,774 13,155,271 -
Equalisation paid/(received) 3,373 (847) 900 (15,059) (71) 577,945 8
Interest charge on bank overdraft 305 190 14 - 1,118 4,892 739
Total finance cost 425,724 111,561 180,982 139,505 35,821 13,738,108 747
Profit/(loss) before tax 1,695,896 3,247,377 1,345,522 1,239,621 1 (11,647,887) 5,801,132
Withholding tax on dividends 56,503 58,290 23,253 12,691 - 10,083 43,014
Withholding tax on bond interest - - - - - (762,684) -
Increase/(decrease) in net assets from operations attributable
to holders of redeemable participating shares 1,639,393 3,189,087 1,322,269 1,226,930 1 (10,895,286) 5,758,118
All amounts arose solely from continuing operations. There were no gains or losses other than those dealt with in the Statement of Comprehensive Income.
The notes 1 to 25 form an integral part of the financial statements.

Smith & Williamson Investment Funds Plc
22
Statement of Comprehensive Income
for the Financial Year Ended December 31, 2017 (continued)
Smith &
Williamson
Global Inflation
Linked Bond
Fund*
Smith &
Williamson
Medium Dated
Corporate Bond
Fund
Smith &
Williamson Mid
Ocean World
Investment
Fund
Smith &
Williamson
Blairmore
Global Equity
Fund
Smith &
Williamson
Artificial
Intelligence
Fund** Total
Notes GBP GBP USD USD GBP GBP
Income
Income from investments 3 266,692 143,385 1,623,686 468,776 50,983 21,615,381
Net realised gain on investments at fair value through
profit or loss 12 1,360,281 236,607 4,608,806 1,099,823 307,194 16,909,018
Movement in unrealised (depreciation)/appreciation on
investments at fair value through profit or loss 12 (583,700) (244,191) 15,380,180 6,381,318 2,323,196 10,137,905
Total investment income 1,043,273 135,801 21,612,672 7,949,917 2,681,373 48,662,304
Operating expenses
Management fees 13 65,840 23,544 778,542 316,504 77,132 5,167,423
Other expenses 4 30,744 19,968 269,555 67,484 101,060 894,484
Performance fees 13 - - - - - 918,094
Total operating expenses 96,584 43,512 1,048,097 383,988 178,192 6,980,001
Operating profit 946,689 92,289 20,564,575 7,565,929 2,503,181 41,682,303
Finance costs
Distributions to holders of redeemable participating shares 18 167,324 100,666 404,461 - - 14,640,746
Equalisation paid/(received) (36,412) 3,559 2,795 868 - 536,238
Interest charge on bank overdraft 2,039 42 1,254 122 1,915 12,322
Total finance cost 132,951 104,267 408,510 990 1,915 15,189,306
Profit/(loss) before tax 813,738 (11,978) 20,156,065 7,564,939 2,501,266 26,492,997
Withholding tax on dividends - (2,395) 234,304 - 7,801 391,033
Withholding tax on bond interest - (2,667) - 81,467 - (702,142)
Increase/(decrease) in net assets from operations attributable
to holders of redeemable participating shares 813,738 (6,916) 19,921,761 7,483,472 2,493,465 26,804,106
* Formerly known as Smith & Williamson Global Government Bond Fund.
** Launched on June 23, 2017.
All amounts arose solely from continuing operations. There were no gains or losses other than those dealt with in the Statement of Comprehensive Income.
The notes 1 to 25 form an integral part of the financial statements.

Smith & Williamson Investment Funds Plc
23
Statement of Changes in Net Assets Attributable to Holders of
Redeemable Participating Shares
for the Financial Year Ended December 31, 2018
Wye
Investment
Fund
Boulder
Investment
Fund
Santos
Investment
Fund
Smith &
Williamson
Defensive
Growth Fund
Smith &
Williamson
Cash Fund
Smith &
Williamson
Short Dated
Corporate
Bond Fund
Smith &
Williamson
Enterprise
Fund
GBP GBP GBP GBP GBP GBP GBP
(Decrease)/increase in net assets from operations attributable
to holders of redeemable participating shares
(1,738,558) (2,690,701) (939,373) (548,077) 158 (10,188,419) (7,616,316)
Capital share transactions
Proceeds from issue of shares 809,589 305,298 - 21,596,711 32,903,468 46,295,252 33,641,152
Payments for redemption of shares (429,678) (293,129) - (6,704,179) (34,999,639) (176,654,326) (32,256,206)
Notional foreign exchange adjustment - - - - - - -
Net increase/(decrease) in net assets resulting from share
capital transactions
379,911 12,169 - 14,892,532 (2,096,171) (130,359,074) 1,384,946
Balance at beginning of financial year 20,578,228 20,749,956 13,582,618 26,496,834 47,154,323 391,960,188 136,935,810
Net assets attributable to holders of redeemable participating
shares at end of financial year 19,219,581 18,071,424 12,643,245 40,841,289 45,058,310 251,412,695 130,704,440
The notes 1 to 25 form an integral part of the financial statements.

Smith & Williamson Investment Funds Plc
24
Statement of Changes in Net Assets Attributable to Holders of
Redeemable Participating Shares
for the Financial Year Ended December 31, 2018 (continued)
Smith &
Williamson
Global
Inflation
Linked Bond
Fund
Smith &
Williamson
Medium Dated
Corporate
Bond Fund*
Smith &
Williamson
Mid Ocean
World
Investment
Fund
Smith &
Williamson
Blairmore
Global
Equity Fund
Smith &
Williamson
Artificial
Intelligence
Fund
Cross
Investments Total
GBP GBP USD USD GBP GBP GBP
(Decrease)/increase in net assets from operations attributable
to holders of redeemable participating shares
(2,010,035) (122,857) (10,300,965) (4,710,707) (6,538,154) (325,901) (43,963,023)
Capital share transactions
Proceeds from issue of shares 57,380,470 14,264 89,633 2,254 101,150,185 (2,861,809) 291,303,409
Payments for redemption of shares (6,478,574) (3,663,248) (9,368,466) (2,204,078) (15,498,389) - (285,646,011)
Notional foreign exchange adjustment - - - - - (113,240) 4,662,505
Net increase/(decrease) in net assets resulting from share
capital transactions
50,901,896 (3,648,984) (9,278,833) (2,201,824) 85,651,796
10,319,903 (2,975,049)
Balance at beginning of financial year 66,470,618 3,771,841 89,722,736 35,044,979 43,575,522 - 863,506,200
Net assets attributable to holders of redeemable participating
shares at end of financial year 115,362,479 - 70,142,938 28,132,448 122,689,164 (3,300,950) 829,863,080
*Terminated on June 15, 2018.
The notes 1 to 25 form an integral part of the financial statements.

Smith & Williamson Investment Funds Plc
25
Statement of Changes in Net Assets Attributable to Holders of
Redeemable Participating Shares
for the Financial Year Ended December 31, 2017
Wye
Investment
Fund
Boulder
Investment
Fund
Santos
Investment
Fund
Smith &
Williamson
Defensive
Growth
Fund
Smith &
Williamson
Cash Fund
Smith &
Williamson
Short Dated
Corporate
Bond Fund
Smith &
Williamson
Enterprise
Fund
GBP GBP GBP GBP GBP GBP GBP
Increase/(decrease) in net assets from operations attributable
to holders of redeemable participating shares
1,639,393 3,189,087 1,322,269 1,226,930 1 (10,895,286) 5,758,118
Capital share transactions
Proceeds from issue of shares 563,361 912,773 - 9,561,051 34,678,592 162,731,491 41,070,510
Payments for redemption of shares (1,172,187) (202,638) (303,660) (2,244,922) (37,819,166) (272,387,110) (36,207,593)
Notional foreign exchange adjustment - - - - - - -
Net (decrease)/increase in net assets
resulting from share capital transactions
(608,826) 710,135 (303,660) 7,316,129 (3,140,574) (109,655,619) 4,862,917
Balance at beginning of financial year 19,547,661 16,850,734 12,564,009 17,953,775 50,294,896 512,511,093 126,314,775
Net assets attributable to holders of redeemable participating
shares at end of financial year 20,578,228 20,749,956 13,582,618 26,496,834 47,154,323 391,960,188 136,935,810
The notes 1 to 25 form an integral part of the financial statements.

Smith & Williamson Investment Funds Plc
26
Statement of Changes in Net Assets Attributable to Holders of
Redeemable Participating Shares
for the Financial Year Ended December 31, 2017 (continued)
Smith &
Williamson
Global Inflation
Linked Bond
Fund*
Smith &
Williamson
Medium Dated
Corporate
Bond Fund
Smith &
Williamson
Mid Ocean
World
Investment
Fund
Smith &
Williamson
Blairmore
Global
Equity
Fund
Smith &
Williamson
Artificial
Intelligence
Fund** Total
GBP GBP USD USD GBP GBP
Increase/(decrease) in net assets from operations attributable
to holders of redeemable participating shares
813,738 (6,916) 19,921,761 7,483,472 2,493,465 26,804,106
Capital share transactions
Proceeds from issue of shares 64,961,157 93,467 59,687,737 20,938 41,591,037 402,490,496
Payments for redemption of shares (1,231,812) (1,174,053) (72,408,790) (2,352,802) (508,980) (411,258,509)
Notional foreign exchange adjustment - - - - - (8,330,519)
Net (decrease)/increase in net assets resulting from share
capital transactions
63,729,345 (1,080,586) (12,721,053) (2,331,864) 41,082,057 (17,098,532)
Balance at beginning of financial year 1,927,535 4,859,343 82,522,028 29,893,371 - 853,800,626
Net assets attributable to holders of redeemable participating
shares at end of financial year 66,470,618 3,771,841 89,722,736 35,044,979 43,575,522 863,506,200
* Formerly known as Smith & Williamson Global Government Bond Fund.
** Launched on June 23, 2017.
The notes 1 to 25 form an integral part of the financial statements.

Smith & Williamson Investment Funds Plc
27
Statement of Cash Flows
for the Financial Year Ended December 31, 2018
Wye
Investment
Fund
Boulder
Investment
Fund
Santos
Investment
Fund
Smith &
Williamson
Defensive
Growth Fund
Smith &
Williamson
Cash Fund
Smith &
Williamson
Short Dated
Corporate
Bond Fund
Smith &
Williamson
Enterprise
Fund
GBP GBP GBP GBP GBP GBP GBP
(Decrease)/increase in net assets attributable to holders
of redeemable participating shares from operations (1,738,558) (2,690,701) (939,373) (548,077) 158 (10,188,419) (7,616,316)
Decrease/(increase) in financial assets and liabilities at fair
value through profit or loss 1,352,146 2,807,212 591,944 (14,986,995) - 127,879,416 8,113,677
Decrease/(increase) in other assets 40,060 (4,215) (8,076) 127,428 2,048,662 11,877,951 (8,389,179)
(Decrease)/increase in other liabilities (10,231) (44,710) 21,214 1,355,935 52,157 (3,022,718) (26,075)
Net cash (outflow)/inflow from operating activities (356,583) 67,586 (334,291) (14,051,709) 2,100,977 126,546,230 (7,917,893)
Financing activities
Proceeds from issue of redeemable participating shares 809,589 305,298 - 21,596,711 32,903,468 46,295,252 33,641,152
Payments on redemption of redeemable participating shares (429,678) (293,129) - (6,704,179) (34,999,639) (176,654,326) (32,256,206)
Notional foreign exchange adjustment - - - - - - -
Net cash inflow/(outflow) from financing activities 379,911 12,169 - 14,892,532 (2,096,171) (130,359,074) 1,384,946
Net increase/(decrease) in cash 23,328 79,755 (334,291) 840,823 4,806 (3,812,844) (6,532,947)
Cash and cash equivalents at beginning of financial year 56,864 77,931 522,053 1,757,045 1,925 5,470,688 19,909,037
Cash and cash equivalents at end of financial year 80,192 157,686 187,762 2,597,868 6,731 1,657,844 13,376,090
The notes 1 to 25 form an integral part of the financial statements.

Smith & Williamson Investment Funds Plc
28
Statement of Cash Flows
for the Financial Year Ended December 31, 2018 (continued)
Smith &
Williamson
Global
Inflation
Linked Bond
Fund
Smith &
Williamson
Medium Dated
Corporate
Bond Fund*
Smith &
Williamson
Mid Ocean
World
Investment
Fund
Smith &
Williamson
Blairmore
Global
Equity Fund
Smith &
Williamson
Artificial
Intelligence
Fund
Cross
Investments Total
GBP GBP USD USD GBP GBP GBP
(Decrease)/increase in net assets attributable to holders
of redeemable participating shares from operations (2,010,035) (122,857) (10,300,965) (4,710,707) (6,538,154) (325,901) (43,963,023)
Decrease/(increase) in financial assets and liabilities at fair
value through profit or loss (47,144,570) 3,741,683 21,479,319 7,986,988 (73,020,313) 3,300,950 30,100,864
Decrease/(increase) in other assets (143,030) 48,166 14,853 (10,019) 539,029 - 6,136,613
(Decrease)/increase in other liabilities (78,287) (15,608) 86,629 (59,175) 691,510 - (1,043,994)
Net cash (outflow)/inflow from operating activities (49,375,922) 3,651,384 11,279,836 3,207,087 (78,327,928) 2,975,049 (8,769,540)
Financing activities
Proceeds from issue of redeemable participating shares 57,380,470 14,264 89,633 2,254 101,150,185 (2,861,809) 291,303,409
Payments on redemption of redeemable participating shares (6,478,574) (3,663,248) (9,368,466) (2,204,078) (15,498,389) - (285,646,011)
Notional foreign exchange adjustment - - - - - (113,240) 4,662,505
Net cash inflow/(outflow) from financing activities 50,901,896 (3,648,984) (9,278,833) (2,201,824) 85,651,796 (2,975,049) 10,319,903
Net increase/(decrease) in cash 1,525,974 2,400 2,001,003 1,005,263 7,323,868 - 1,550,363
Cash and cash equivalents at beginning of financial year 729,237 18,190 1,268,385 235,923 1,634,547 - 31,289,525
Cash and cash equivalents at end of financial year 2,255,211 20,590 3,269,388 1,241,186 8,958,415 - 32,839,888
*Terminated on June 15, 2018.
The notes 1 to 25 form an integral part of the financial statements.

Smith & Williamson Investment Funds Plc
29
Statement of Cash Flows
for the Financial Year Ended December 31, 2017
Wye
Investment
Fund
Boulder
Investment
Fund
Santos
Investment
Fund
Smith &
Williamson
Defensive
Growth
Fund
Smith &
Williamson
Cash
Fund
Smith &
Williamson
Short Dated
Corporate
Bond Fund
Smith &
Williamson
Enterprise
Fund
GBP GBP GBP GBP GBP GBP GBP
Increase/(decrease) in net assets attributable to holders
of redeemable participating shares from operations
1,639,393 3,189,087 1,322,269 1,226,930 1 (10,895,286) 5,758,118
(Increase)/decrease in financial assets and liabilities at fair
value through profit or loss
(986,300) (3,833,125) (648,730) (7,941,230) - 110,945,753 (10,294,640)
(Increase)/decrease in other assets (54,042) 24,623 32,176 (218,628) 3,160,367 (19,435,791) (6,803,694)
Increase/(decrease) in other liabilities 30,825 (45,873) (28,602) 111,591 (18,748) 1,771,682 59,464
Net cash inflow/(outflow) from operating activities 629,876 (665,288) 677,113 (6,821,337) 3,141,620 82,386,358 (11,280,752)
Financing activities
Proceeds from issue of redeemable participating shares 563,361 912,773 - 9,561,051 34,678,592 162,731,491 41,070,510
Payments on redemption of redeemable participating shares (1,172,187) (202,638) (303,660) (2,244,922) (37,819,166) (272,387,110) (36,207,593)
Notional foreign exchange adjustment - - - - - - -
Net cash (outflow)/inflow from financing activities (608,826) 710,135 (303,660) 7,316,129 (3,140,574) (109,655,619) 4,862,917
Net increase/(decrease) in cash 21,050 44,847 373,453 494,792 1,046 (27,269,261) (6,417,835)
Cash and cash equivalents at beginning of financial year 35,814 33,084 148,600 1,262,253 879 32,739,949 26,326,872
Cash and cash equivalents at end of financial year 56,864 77,931 522,053 1,757,045 1,925 5,470,688 19,909,037
The notes 1 to 25 form an integral part of the financial statements.

Smith & Williamson Investment Funds Plc
30
Statement of Cash Flows
for the Financial Year Ended December 31, 2017 (continued)
Smith &
Williamson
Global Inflation
Linked Bond
Fund*
Smith &
Williamson
Medium Dated
Corporate Bond
Fund
Smith &
Williamson
Mid Ocean
World
Investment
Fund
Smith &
Williamson
Blairmore
Global
Equity Fund
Smith &
Williamson
Artificial
Intelligence
Fund** Total
GBP GBP USD USD GBP GBP
Increase/(decrease) in net assets attributable to holders of
redeemable participating shares from operations 813,738 (6,916) 19,921,761 7,483,472 2,493,465 26,804,106
(Increase)/decrease in financial assets and liabilities at fair value
through profit or loss (64,166,316) 805,106 (7,086,446) (6,056,105) (41,125,822) (19,232,594)
(Increase)/decrease in other assets (374,770) 12,526 178,463 7,994 (865,359) (24,365,625)
Increase/(decrease) in other liabilities 645,584 (7,809) (1,187,526) 47,295 50,206 1,628,359
Net cash inflow/(outflow) from operating activities (63,081,764) 802,907 11,826,252 1,482,656 (39,447,510) (15,165,754)
Financing activities
Proceeds from issue of redeemable participating shares 64,961,157 93,467 59,687,737 20,938 41,591,037 402,490,496
Payments on redemption of redeemable participating shares (1,231,812) (1,174,053) (72,408,790) (2,352,802) (508,980) (411,258,509)
Notional foreign exchange adjustment - - - - - (8,330,519)
Net cash (outflow)/inflow from financing activities 63,729,345 (1,080,586) (12,721,053) (2,331,864) 41,082,057 (17,098,532)
Net increase/(decrease) in cash 647,581 (277,679) (894,801) (849,208) 1,634,547 (32,264,286)
Cash and cash equivalents at beginning of financial year 81,656 295,869 2,163,186 1,085,131 - 63,553,811
Cash and cash equivalents at end of financial year 729,237 18,190 1,268,385 235,923 1,634,547 31,289,525
* Formerly known as Smith & Williamson Global Government Bond Fund.
** Launched on June 23, 2017.
The notes 1 to 25 form an integral part of the financial statements.

Smith & Williamson Investment Funds Plc
31
Notes to the Financial Statements for the financial year ended December 31, 2018
1. Company background
Smith & Williamson Investment Funds Plc (the “Company”) is an authorised umbrella fund with segregated liability
between sub-funds pursuant to the Regulations. The Company was incorporated on November 30, 1999 as an open-
ended investment company with variable capital under the Regulations. The Company began trading on March 31,
2000.
The investment objective of Wye Investment Fund, Boulder Investment Fund and Santos Investment Fund is to achieve long term growth of capital through investment in stocks (which may include fixed interest stocks), shares, collective investment schemes and investment trust companies in the UK and overseas stock markets, and through investment in cash and money market instruments throughout the world.
The investment objective of Smith & Williamson Defensive Growth Fund is to achieve long-term steady capital growth by adopting a policy to normally invest at least 50% of the assets in zero dividend preference shares (zeros), which are a class of share issued by Split Capital Investment Trusts, and synthetic zeros (closed-ended investment companies listed on Recognised Markets that display the same characteristics as conventional zeros). The sub-fund may also invest in other transferable securities, money market instruments, deposits, collective investment schemes and warrants.
The investment objective of Smith & Williamson Cash Fund and Smith & Williamson Short Dated Corporate Bond Fund is to achieve a high rate of interest and ready access to capital.
The investment objective of Smith & Williamson Enterprise Fund is to achieve long term capital appreciation with low risk and low volatility. The investment objective of Smith & Williamson Global Inflation Linked Bond Fund is to achieve total returns in excess of the sub-funds benchmark, the FTSE Actuaries Government Securities UK Gilts All Stocks Index, by investing the majority of its Net Asset Value in debt securities.
The investment objective of Smith & Williamson Medium Dated Corporate Bond Fund is to achieve income returns and ready access to capital by investing the majority of its Net Asset Value in a variety of Sterling, US Dollar and Euro medium-dated investment grade corporate bonds. This Fund closed on June 15, 2018.
The investment objective of Smith & Williamson Mid Ocean World Investment Fund is investing the majority of its Net Asset Value in equity and equity-related securities and debt securities.
The investment objective of the Smith & Williamson Blairmore Global Equity Fund is to achieve capital appreciation through investment in an actively managed long-only portfolio consisting primarily of global equities.
The investment objective of the Smith & Williamson Artificial Intelligence Fund is to achieve capital appreciation through investing primarily in equity and equity-related securities issued by companies.
The following table provides the date of commencement of trading and closing for the various sub-funds established by the Company (the “sub-funds”):
Date of Trading Closure Date
Wye Investment Fund May 24, 2000
Boulder Investment Fund October 19, 2000
Santos Investment Fund July 2, 2002
Smith & Williamson Defensive Growth Fund September 28, 2004
Smith & Williamson Cash Fund March 18, 2008
Smith & Williamson Short Dated Corporate Bond Fund April 29, 2009
Smith & Williamson Enterprise Fund January 15, 2010
Smith & Williamson Global Inflation Linked Bond Fund May 25, 2012
Smith & Williamson Medium Dated Corporate Bond Fund July 13, 2012 June 15, 2018
Smith & Williamson Mid Ocean World Investment Fund April 1, 2014
Smith & Williamson Blairmore Global Equity Fund December 31, 2014
Smith & Williamson Artificial Intelligence Fund June 23, 2017

Smith & Williamson Investment Funds Plc
32
Notes to the Financial Statements for the financial year ended December 31, 2018 (continued)
2. Significant Accounting Policies
The significant accounting policies adopted by the Company are as follows:
(a) Basis of Preparation
These financial statements have been prepared in accordance with International Financial Reporting Standards
(“IFRS”) as adopted by the European Union (“EU”), applicable law comprising the Irish Companies Act 2014 as
amended, and the Regulations.
The Company has initially applied IFRS 9 from January 1, 2018. IFRS 15 Revenue from Contracts with Customers is
also effective from January 1, 2018 but does not have a material effect on the Company’s financial statements.
New standards and amendments effective after 1 January 2018:
IFRS 9, “Financial instruments”, addresses the classification, measurement and recognition of financial assets and
financial liabilities. An updated version of IFRS 9 was issued on November 10, 2013. It replaces the parts of IAS 39
that relate to the classification and measurement of financial instruments. IFRS 9 requires financial assets to be
classified into two measurement categories: those measured at fair value and those measured at amortised cost. The
determination is made at initial recognition. The classification depends on the entity’s business model for managing its
financial instruments and the contractual cash flow characteristics of the instrument. For financial liabilities, the
standard retains most of the IAS 39 requirements. The main change is that, in cases where the fair value option is taken
for financial liabilities, the part of a fair value change due to an entity’s own credit risk is recorded in other
comprehensive income rather than the income statement, unless this creates an accounting mismatch. The effective
mandatory date in place for IFRS 9 is 1 January 2018. The Company classifies its financial assets as being at fair value
through profit or loss in accordance with its business model as its financial assets are managed and their performance
evaluated on a fair value basis in accordance with the documented investment strategy. The adoption of IFRS 9 did not
have a significant effect on the financial statements (refer to below for further detail).
IFRS 9 Financial Instruments (effective for annual periods beginning on or after January 1, 2018)
In the current year the Company has adopted IFRS 9 “Financial Instruments”. Comparative figures for the period
ended December 31, 2017 have not been restated. Therefore, financial instruments in the comparative period are still
accounted for in accordance with IAS 39 Financial Instrument: Recognition and Measurement.
Classification of financial instruments effective from January 1, 2018 (IFRS 9)
Under IFRS 9, financial assets are measured at amortised cost if they are held within a business model whose objective
it is to hold financial assets in order to collect contractual cash flows (business model test), the contractual terms of
which give rise on specified dates to cash flows that are solely payments of principal and interest on the principal
outstanding (SPPI test).
The primary objective of each sub-fund is disclosed under note 1, some of the financial instruments held lead to credit
exposure for one or more investments.
The Company considers this to be indicative of a ‘hold to collect’ business model as identified by IFRS 9. The
contractual cash flow characteristics of the financial assets are also deemed to meet the SPPI test.
The Company therefore classifies money market instruments, term deposits and certificate of deposits as measured at
amortised cost in line with the standard. The financial instruments which are valued at market prices with a
corresponding gain or loss being recognized in the Statement of Comprehensive Income are classified at fair value
through the profit or loss. Debt instruments are classified at fair value through profit or loss due to being valued at fair
value for which the results of the instruments are also monitored on a fair value basis and the default risk is assumed to
be zero.
The Company also includes short-term non-financing receivables including interest receivable and other receivables at
amortised cost.
Smith & Williamson Investment Funds Plc
33
Notes to the Financial Statements for the financial year ended December 31, 2018 (continued)
2. Significant Accounting Policies (continued)
(a) Basis of Preparation (continued)
IFRS 9 Financial Instruments (effective for annual periods beginning on or after January 1, 2018) (continued)
Classification of financial instruments effective from January 1, 2018 (IFRS 9) (continued)
In evaluating the classification of financial assets the Company has determined the following for financial instruments
at fair value through the profit or loss:
- Based on how performance is evaluated, how risks are managed and how compensation is paid, the business
model for financial assets is to manage on a fair value basis.
- The contractual cash flows of the financial assets are not solely payments of principal and interest.
Classification of financial instruments before January 1, 2018 (IAS 39)
- The Company classified its investments in money market instruments, term deposits and certificate of
deposits as loans and receivables in the Statement of Financial Position. Loans and receivables are non-
derivative financial assets with fixed or determinable payments that are not quoted in an active market.
- Financial instruments classified at fair value through profit or loss prior to January 1, 2018 will remain
classified at fair value through profit or loss based on the above and recognised as per below.
Recognition/derecognition of financial instruments
Investments at fair value through profit or loss are initially recognised at fair value, and transaction costs for all
financial assets and liabilities carried at fair value through profit or loss are expensed as incurred. Subsequent to initial
recognition, all financial assets and liabilities at fair value through profit or loss are measured at fair value.
Investments are derecognised when the rights to receive cash flows from the investments have expired or the Company
has transferred substantially all risks and rewards of ownership. The Company derecognises a financial liability (or a
part of a financial liability) from its Statement of Financial Position when, and only when, it is extinguished, that is,
when the obligation specified in the contract is discharged or cancelled or expires.
Purchases and sales of investments at fair value through profit or loss are accounted for on the day the trade
transaction takes place. Investments are derecognized when the rights to receive cash flows from the investments have
expired or the risks and rewards of ownership have all been substantially transferred. Realised gains and losses on
disposals are calculated using the first-in first-out cost method and are reflected as net realised gains/(losses) on
financial instruments in the Statement of Comprehensive Income.
Gains and losses arising from changes in the fair value of financial assets and liabilities at fair value through profit or
loss category are included in the Statement of Comprehensive Income in the financial year in which they arise. The
computation of realised gains and losses on sales of financial assets and liabilities at fair value through profit or loss is
made on the basis of average cost.
Derivatives are recognised at fair value on the date on which a derivative contract is entered into and are subsequently
re-measured at their fair value. Fair values are determined by using forward exchange market rates at the Statement of Financial Position date. The fair value of contracts for differences is calculated as the difference between the contracted price and the quoted market price of the underlying security on the date of the Statement of Financial Position. All derivatives are carried as assets when fair value is positive and as liabilities when fair value is negative.
The fair value of financial instruments traded in active markets (such as publicly traded derivatives and trading
securities) is based on quoted market prices at the Statement of Financial Position date. The quoted market price used
for financial assets held by the Company is the bid price and for financial liabilities, the ask price. When the Company
holds derivatives with offsetting market risks it uses mid-market prices as a basis for establishing fair values for the
offsetting risk positions and applies the bid or ask price to the net open position, as appropriate.

Smith & Williamson Investment Funds Plc
34
Notes to the Financial Statements for the financial year ended December 31, 2018 (continued)
2. Significant Accounting Policies (continued)
(a) Basis of Preparation (continued)
IFRS 9 Financial Instruments (effective for annual periods beginning on or after January 1, 2018) (continued)
Recognition/derecognition of financial instruments (continued)
Financial instruments classified as loans and receivables are initially recognised at fair value and subsequently
measured at amortized cost using the effective interest method, less any allowance for impairment.
Impairment of financial assets effective from January 1, 2018
Under IFRS 9, impairments are recognised in three stages to reflect the potential variation in credit quality of financial
assets:
• Stage 1: Items that have not deteriorated significantly in credit quality since initial recognition. For these items, a
loss allowance equal to 12-month expected credit losses (“ECL”) is recognised. Interest income is calculated on the
gross carrying amount of the asset (i.e., without reduction for the loss allowance).
• Stage 2: Items that have deteriorated significantly in credit quality since initial recognition but that do not have
objective evidence of impairment. For these items, a loss allowance equal to lifetime ECL is recognised. Interest
income is still calculated on the gross carrying amount of the asset.
• Stage 3: Items that have objective evidence of impairment at the reporting date. For these items, a loss allowance
equal to lifetime ECL is recognised. Interest income is subsequently calculated on the net carrying amount (i.e.
reduced by the loss allowance).
As at 31 December 2018 all the Company’s loans and receivables are at Stage 1.
IFRS 9 permits the use of a practical expedient for financial assets with low credit risk. If the credit risk of a financial
instrument is low at the reporting date, impairment can be measured using a 12-month ECL. Where this applies, an
assessment of whether a significant increase in credit risk has occurred does not have to be carried out. In order to
avail of the expedient, the financial instrument must meet the following criteria:
It has a low risk of default;
The borrower is considered, in the short term, to have strong capacity to meet its obligations; and
The lender expects, in the longer term, that adverse changes in economic and business conditions might, but will
not necessarily, reduce the liability of the borrower to fulfil its obligations.
The investment manager will only invest in financial instruments which meet or exceed the required credit quality as
set out in the sub-fund’s investment objectives. Financial instruments at amortized cost are considered to have low
credit risk, and the loss allowance recognised during the period was therefore limited to 12 month expected losses.
Exposure to banks are monitored daily and comment from ratings agencies and the press is closely followed to ensure
that any deterioration in the credit standing of approved counterparties is identified in a timely manner and appropriate
action taken. No fixed deposit, certificate of deposit or floating rate note is to have a remaining maturity of more than
12 months, at date of purchase. Consideration is given to firms being retained as counterparties where their Fitch
Support rating is 1, indicating a strong probability of their receiving support from the authorities or a strong parent
should the need arise.
The Company has no appetite for crystallised credit risk which may result in poor outcomes or detriment. The level of
credit risk is expected to reflect the overall low risk appetite for financial risks. There is a comprehensive ladder of
roles and responsibilities designed to ensure that this low risk approach is implemented and monitored effectively.

Smith & Williamson Investment Funds Plc
35
Notes to the Financial Statements for the financial year ended December 31, 2018 (continued)
2. Significant Accounting Policies (continued)
(a) Basis of Preparation (continued)
Impairment of financial assets effective from January 1, 2018(continued)
As a result of this, loans and receivables measured at amortised cost are considered to have low credit risk, and the loss
allowance recognised during the period was therefore limited to 12 month ECL.
The 12-month ECL estimate provided for each investment is estimated by multiplying the probability of default by the
expected loss given default (“LGD”). The portfolio level expected loss is estimated by taking a weighted average of
each deal’s expected loss.
Given the nature of investments at amortised cost the investment manager considers the ECLs to be immaterial and not
disclosed in the financial statements.
Should the credit risk of a financial instrument be deemed to no longer qualify for the low risk expedient, the
Company will assess whether the increase has been significant such that a lifetime ECL should be recognised.
The carrying amount of financial assets best represents the maximum credit risk exposure at Statement of Financial
Position date. As at 31 December 2018, the Company’s financial assets exposed to credit risks which are accounted for
at amortised cost amounted to the following:
Smith & Williamson Cash Fund
31 December 2018 31 December 2017
GBP GBP
Assets
Loans and receivables 45,072,930 47,157,284
Cash and cash equivalents 6,731 1,925
Interest from deposits 47,619 22,666
Other assets 22,370 11,631
45,149,650 47,193,506
Smith & Williamson Short Dated Corporate Bond Fund
31 December 2018 31 December 2017
GBP GBP
Assets
Loans and receivables 23,974,130 34,937,175
Cash and cash equivalents 1,657,844 5,820,688
Other assets 6,083,079 6,997,985
31,715,053 47,755,848
Smith & Williamson Enterprise Fund
31 December 2018 31 December 2017
GBP GBP
Assets
Loans and receivables 99,604,614 90,185,890
Cash and cash equivalents 13,406,091 19,989,862
Interest from deposits 52,729 12,972
Other assets 162,237 1,231,539
113,225,671 111,420,263

Smith & Williamson Investment Funds Plc
36
Notes to the Financial Statements for the financial year ended December 31, 2018 (continued)
2. Significant Accounting Policies (continued)
(a) Basis of Preparation (continued)
IFRS 15 Revenue from Contracts with Customers (effective for annual periods beginning on or after January
1, 2018)
IFRS 15 was issued in May 2014 and establishes a five-step model to account for revenue arising from contracts with
customers. Under IFRS 15, revenue is recognised at an amount that reflects the consideration to which an entity
expects to be entitled in exchange for transferring goods or services to a customer.
These standards did not have a significant impact on the Company’s financial position or performance, the Company
will continue to classify its financial assets and financial liabilities as being at fair value through profit or loss.
(d) Income from Investments
Interest income on investments in loans and receivables and debt instruments is recognised when earned using the
effective interest method and is shown in the Statement of Comprehensive Income. The effective interest rate is the
rate that exactly discounts estimated future cash payments or receipts through the expected life of the financial
instrument to the net carrying amount of the financial asset or liability.
Dividends are credited to the Statement of Comprehensive Income on the dates on which the relevant securities are
listed as “ex-dividend”. Dividend income is shown gross of any non-recoverable withholding taxes, which is disclosed
separately in the Statement of Comprehensive Income, and net of any tax credits.
(e) Offsetting Financial Instruments
Financial assets and liabilities are offset and the net amount reported on the Statement of Financial Position when there
is a legally enforceable right to offset the recognised amounts and there is an intention to settle on a net basis, or
realise the assets and settle the liability simultaneously.
(f) Redeemable Participating Shares
The issued redeemable participating share capital is at all times equal to the net asset value of the Company.
Redeemable participating shares are redeemable at the shareholders option and are classified as financial liabilities.
Redeemable shares can be put back to the Company at any time for cash equal to a proportionate share of the
Company’s net asset value. The redeemable share is carried at the redemption amount that is payable at the Statement
of Financial Position date if the holder exercises the right to put the share back to the Company. The movement in the
number of participating shares is set out in Note 10. Each sub-fund’s NAV per share is calculated by dividing the ‘Net
Asset Value’ of each sub-fund being the value of its assets less its liabilities by the numbers of shares of each sub-fund
then in issue.
(g) Foreign Exchange
(i) Functional and presentation currency Items in the Company's financial statements are measured using the currency of the primary economic environment in which it operates. The functional currency for this Company and each sub-fund is Sterling except for Smith & Williamson Mid Ocean World Investment Fund and the Smith & Williamson Blairmore Global Equity Fund which are US Dollar.
(ii) Transactions and balances Foreign currency transactions are translated into the functional currency of the individual sub-funds using the exchange rate on the transaction date (as an approximation of actual). Foreign exchange gains and losses resulting from the settlement of such transactions and from the translation at financial year end rates of assets and liabilities denominated in foreign currencies are recognised in the Statement of Comprehensive Income. The financial statements of the individual sub-funds are prepared in the functional currency of the respective sub-fund which is also the presentation currency. The functional currency of the Company is Sterling as this reflects the exposure of the sub-funds to securities issued by British companies, their shareholders and the markets in which the sub-funds are available. The aggregated financial statements of the Company are prepared in the presentation currency of the Company, Sterling. Amounts of the individual sub-funds in overseas currencies are translated for the purpose of the aggregation as follows:
Smith & Williamson Investment Funds Plc
37
Notes to the Financial Statements for the financial year ended December 31, 2018 (continued)
2. Significant Accounting Policies (continued)
(g) Foreign Exchange (continued)
(ii) Transactions and balances (continued)
a) Using average exchange rates (as an approximation of actual) for the financial year for the Statement of Comprehensive Income.
b) Using average exchange rates (as an approximation of actual) for the period for the proceeds and cost of issue and redemption of shares, respectively, for the Statement of Changes in Net Assets Attributable to Holders of Redeemable Participating Shares.
c) Using period end exchange rates for the Statement of Financial Position.
For the purposes of producing the aggregated financial statements, the notional currency gain or loss on the re-translation of the opening net assets of individual sub-funds with functional currencies other than Sterling, the presentation currency of the Company, is included as the notional foreign exchange adjustment in the Statement of Changes in Net Assets Attributable to Holders of Redeemable Participating Shares. This figure also includes the notional gain or loss from use of average rates as noted above compared to the financial year end exchange rates for the Statement of Financial Position.
(h) Equalisation
An equalisation account is maintained by each sub-fund so that the amount distributed is the same for all shares of the same type notwithstanding different dates of issue. A sum equal to that part of the price of a share which reflects the net income accumulated at the date of issue or redemption is booked to the equalisation account and added or deducted to/from the first dividend in the same financial year as that in which the shares are issued or redeemed in arriving at the finance cost.
(i) Expenses
All expenses are recognised in the Statement of Comprehensive Income on an accrual basis.
(j) Cash
Cash includes current deposits with banks, and bank overdrafts with maturities of 3 months or less. Cash equivalents
are short-term highly liquid investments that are readily convertible to known amounts of cash, are subject to an
insignificant risk of changes in value, and are held for the purpose of meeting short-term cash commitments rather than
for investment or other purposes. Bank overdrafts are presented within current liabilities on the Statement of Financial
Position.
The Investor Money Regulations became effective from July 1, 2016. Each sub-fund has chosen the sub-fund asset
route where by the subscription and redemption dealing accounts will be channelled through an umbrella cash
collection account in the name of each sub-fund. Cash balances held in the umbrella cash collection account are
regarded as an asset of the Company and are therefore recognised in the Statement of Financial Position within cash
and cash equivalents.
(k) Taxation
Liabilities relating to uncertain tax positions are accrued only subject to Irish tax if there are taxable Irish investors when such liabilities are probable and can be estimated with reasonable accuracy.
Capital gains, dividends, and interest received on investments made by the Company may be subject to withholding taxes or capital gains taxes imposed by the country of origin and such taxes may not be recoverable by the Company or its shareholders.
(l) Transaction costs
Transactions costs are costs incurred to acquire financial assets or liabilities at fair value through profit and loss. They include fees and commissions paid to agents, advisers, brokers and dealers. Transaction costs, when incurred, are immediately recognised in the Statement of Comprehensive Income as an expense. Transaction costs during 2018 were GBP316,496 (2017: GBP402,729).

Smith & Williamson Investment Funds Plc
38
Notes to the Financial Statements for the financial year ended December 31, 2018 (continued)
2. Significant Accounting Policies (continued)
(m) Financial derivatives
The sub-funds may enter into forward foreign currency exchange contracts and contracts for difference for the purposes of efficient portfolio management.
Forward Currency Contracts
When entering into a forward foreign currency exchange contract, the sub-fund agrees to receive or deliver a fixed quantity of foreign currency for an agreed price upon an agreed future date. These contracts are valued daily at the forward rate and the sub-fund’s equity therein, representing unrealised gains or losses on the contracts, is included in the Statement of Comprehensive Income. The unrealised gain/(loss) on open forward foreign exchange contracts is calculated by reference to the difference between the contracted rate and the rate to close out the contract. Realised and movement in unrealised gains or losses are included in the Statement of Comprehensive Income.
Contracts for difference
Contracts for difference are over-the-counter derivatives which take advantage of the economical benefits which are not afforded through investing directly in certain securities markets. A sub-fund may purchase equity contracts for difference as a means of gaining exposure to the economic performance and cash flows of an equity security without the need for taking or making physical delivery of the security. A contract for difference is a financial instrument linked to an underlying share price. Consequently, no rights are acquired or obligations incurred relating to the underlying share and the sub-fund may buy or sell depending on the sub-fund manager’s view of a Company’s share price. Contracts for difference are highly leveraged instruments and for a small deposit it is possible for a sub-fund to hold a position much greater than would be possible with a traditional investment. These are valued daily based on quoted market prices at the Statement of Financial Position dates. The fair value of contracts for differences is the difference between the contracted price and the volume weighted average price of the financial instrument multiplied by the number of shares specified within the contract.
There were open forward foreign currency exchange contracts and contracts for differences at December 31, 2018, and
these are disclosed on the relevant Schedule of Investments of each sub-fund on pages 91 to 126.
(n) Critical accounting estimates and assumptions
Management makes estimates and assumptions concerning the future.
The resulting accounting estimates will, by definition seldom equal the actual related results. The estimates and assumptions that have a significant risk of causing a material adjustment to the carrying amounts of assets and liabilities within the next financial year are outlined below. A description of the valuation techniques and the inputs used in the fair value measurement of level 3 financial instruments are disclosed in Note 15.

Smith & Williamson Investment Funds Plc
39
Notes to the Financial Statements for the financial year ended December 31, 2018 (continued)
3. Income from Investments 2018
Boulder
Investment
Fund
Santos
Investment
Fund
Smith &
Williamson
Defensive
Growth Fund
Smith &
Williamson
Cash Fund
Smith &
Williamson
Short Dated
Corporate Bond
Fund
Smith &
Williamson
Enterprise Fund
Wye
Investment
Fund
GBP GBP GBP GBP GBP GBP GBP
Dividend income 628,371 332,132 217,596 448,327 7 - 2,421,767
Deposit interest 71 282 121 1,472 166,819 7,745 346,451
Bond interest - - 120,584 29,313 85,029 10,505,541 -
Other income - - - 1,974 - 29,617 -
628,442 332,414 338,301 481,086 251,855 10,542,903 2,768,218
2018
Smith
Williamson
Global Inflation
Linked Bond
Fund
Smith &
Williamson
Medium Dated
Corporate Bond
Fund*
Smith &
Williamson
Mid Ocean
World
Investment Fund
Smith &
Williamson
Blairmore
Global Equity
Fund
Total
2018
Company
Smith &
Williamson
Artificial
Intelligence
Fund
GBP GBP USD USD GBP GBP
Dividend income - - 1,587,188 555,232 771,259 6,424,282
Deposit interest 3,226 51 14,101 15,539 16,556 564,997
Bond interest 1,082,986 26,064 - 201 - 11,849,668
Other income 14,384 200 6,392 453 - 51,300
1,100,596 26,315 1,607,681 571,425 787,815 18,890,247
* Terminated on June 15, 2018.
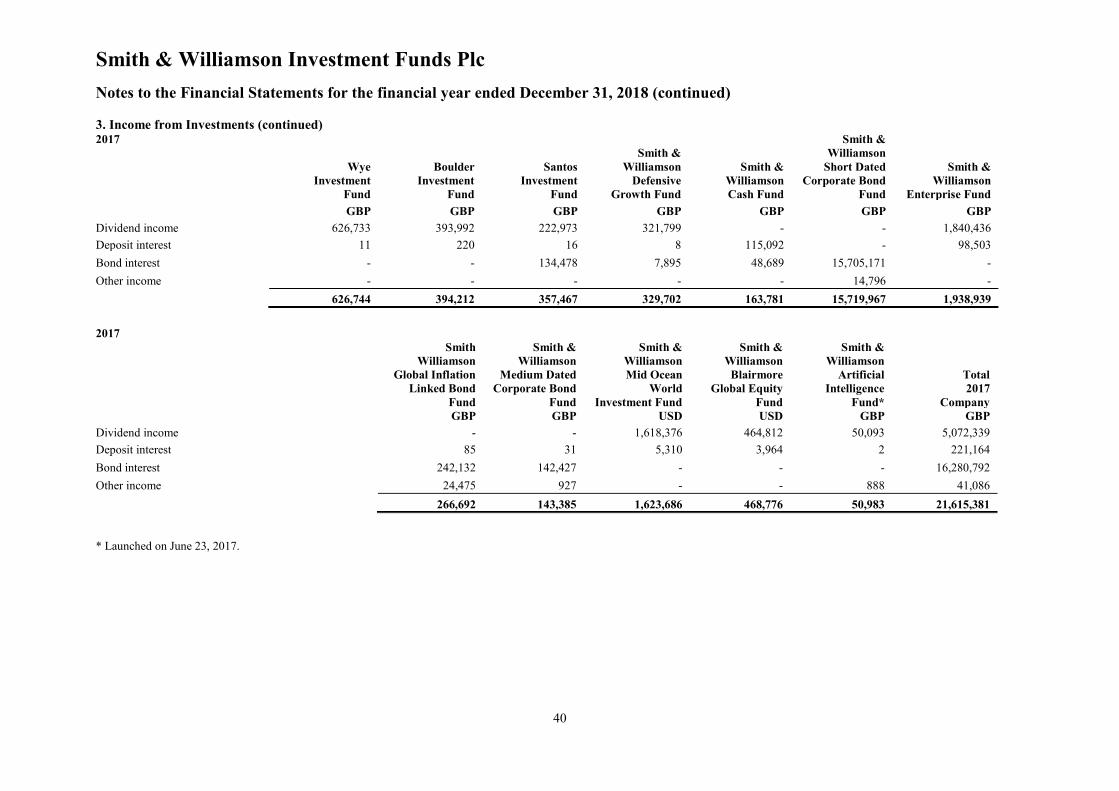
Smith & Williamson Investment Funds Plc
40
Notes to the Financial Statements for the financial year ended December 31, 2018 (continued)
3. Income from Investments (continued) 2017
Boulder
Investment
Fund
Santos
Investment
Fund
Smith &
Williamson
Defensive
Growth Fund
Smith &
Williamson
Cash Fund
Smith &
Williamson
Short Dated
Corporate Bond
Fund
Smith &
Williamson
Enterprise Fund
Wye
Investment
Fund
GBP GBP GBP GBP GBP GBP GBP
Dividend income 626,733 393,992 222,973 321,799 - - 1,840,436
Deposit interest 11 220 16 8 115,092 - 98,503
Bond interest - - 134,478 7,895 48,689 15,705,171 -
Other income - - - - - 14,796 -
626,744 394,212 357,467 329,702 163,781 15,719,967 1,938,939
2017
Smith
Williamson
Global Inflation
Linked Bond
Fund
Smith &
Williamson
Medium Dated
Corporate Bond
Fund
Smith &
Williamson
Mid Ocean
World
Investment Fund
Smith &
Williamson
Blairmore
Global Equity
Fund
Total
2017
Company
Smith &
Williamson
Artificial
Intelligence
Fund*
GBP GBP USD USD GBP GBP
Dividend income - - 1,618,376 464,812 50,093 5,072,339
Deposit interest 85 31 5,310 3,964 2 221,164
Bond interest 242,132 142,427 - - - 16,280,792
Other income 24,475 927 - - 888 41,086
266,692 143,385 1,623,686 468,776 50,983 21,615,381
* Launched on June 23, 2017.

Smith & Williamson Investment Funds Plc
41
Notes to the Financial Statements for the financial year ended December 31, 2018 (continued)
4. Other Expenses 2018
Boulder
Investment
Fund
Santos
Investment
Fund
Smith &
Williamson
Defensive
Growth Fund
Smith &
Williamson
Cash Fund
Smith &
Williamson
Short Dated
Corporate Bond
Fund
Smith &
Williamson
Enterprise Fund
Wye
Investment
Fund
GBP GBP GBP GBP GBP GBP GBP
Directors’ Fees* 6,288 6,302 6,302 6,629 6,289 6,290 6,290
Transaction Costs 12,406 12,303 1,885 13,803 - 3,730 79,616
Regulatory Fees 722 722 722 719 719 815 858
Audit Fees** 6,880 6,880 6,880 6,886 8,512 6,886 14,007
Depositary Fees 11,700 - - - 12,210 - -
Professional Fees 5,140 5,140 5,140 5,244 5,243 6,007 7,530
Sundry Fees 16,943 4,206 2,083 4,345 4,482 46,202 45,898
60,079 35,553 23,012 37,626 37,455 69,930 154,199
2018
Smith
Williamson
Global Inflation
Linked Bond
Fund
Smith &
Williamson
Medium Dated
Corporate Bond
Fund***
Smith &
Williamson
Mid Ocean World
Investment Fund
Smith &
Williamson
Blairmore
Global Equity
Fund
Smith &
Williamson
Artificial
Intelligence
Fund
Total
2018
Company
GBP GBP USD USD GBP GBP
Directors’ Fees* 6,290 2,011 8,410 9,398 6,290 72,321
Transaction Costs - - 78,298 - 134,102 316,496
Regulatory Fees 720 269 1,164 569 1,010 8,574
Audit Fees** 6,886 3,370 6,604 9,576 7,043 86,350
Depositary Fees - - - 14,499 - 34,771
Professional Fees 7,366 2,699 7,130 6,734 8,659 68,553
Sundry Fees 5,652 16,431 23,342 26,343 18,614 202,070
26,914 24,780 124,948 67,119 175,718 789,135
* Mr. William Cussans & Mr. Noel Medici have waived their director’s fees for 2018. There are no out of pocket expenses included in the directors’ fees.
** Audit fees relate to the statutory audit of the Company. There are no fees paid to the auditors in respect of other assurance services, tax advisory services or other non-audit services.
*** Terminated on June 15, 2018.
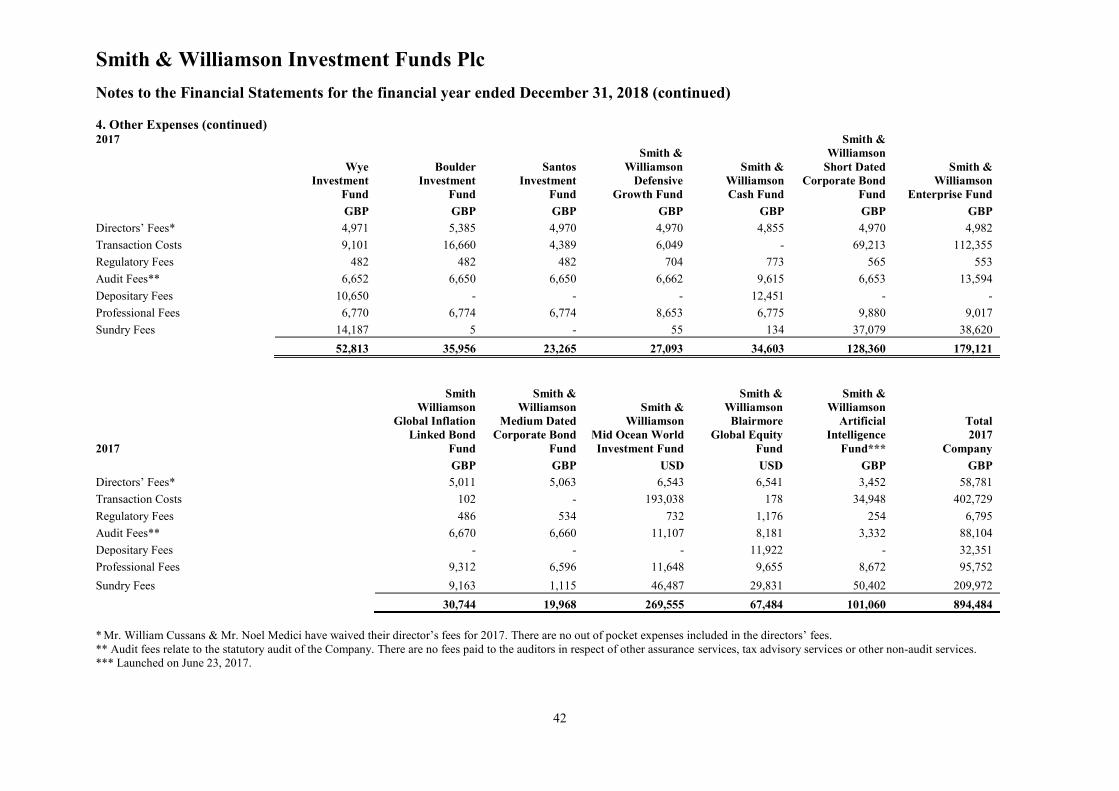
Smith & Williamson Investment Funds Plc
42
Notes to the Financial Statements for the financial year ended December 31, 2018 (continued)
4. Other Expenses (continued) 2017
Boulder
Investment
Fund
Santos
Investment
Fund
Smith &
Williamson
Defensive
Growth Fund
Smith &
Williamson
Cash Fund
Smith &
Williamson
Short Dated
Corporate Bond
Fund
Smith &
Williamson
Enterprise Fund
Wye
Investment
Fund
GBP GBP GBP GBP GBP GBP GBP
Directors’ Fees* 4,971 5,385 4,970 4,970 4,855 4,970 4,982
Transaction Costs 9,101 16,660 4,389 6,049 - 69,213 112,355
Regulatory Fees 482 482 482 704 773 565 553
Audit Fees** 6,652 6,650 6,650 6,662 9,615 6,653 13,594
Depositary Fees 10,650 - - - 12,451 - -
Professional Fees 6,770 6,774 6,774 8,653 6,775 9,880 9,017
Sundry Fees 14,187 5 - 55 134 37,079 38,620
52,813 35,956 23,265 27,093 34,603 128,360 179,121
2017
Smith
Williamson
Global Inflation
Linked Bond
Fund
Smith &
Williamson
Medium Dated
Corporate Bond
Fund
Smith &
Williamson
Mid Ocean World
Investment Fund
Smith &
Williamson
Blairmore
Global Equity
Fund
Smith &
Williamson
Artificial
Intelligence
Fund***
Total
2017
Company
GBP GBP USD USD GBP GBP
Directors’ Fees* 5,011 5,063 6,543 6,541 3,452 58,781
Transaction Costs 102 - 193,038 178 34,948 402,729
Regulatory Fees 486 534 732 1,176 254 6,795
Audit Fees** 6,670 6,660 11,107 8,181 3,332 88,104
Depositary Fees - - - 11,922 - 32,351
Professional Fees 9,312 6,596 11,648 9,655 8,672 95,752
Sundry Fees 9,163 1,115 46,487 29,831 50,402 209,972
30,744 19,968 269,555 67,484 101,060 894,484
* Mr. William Cussans & Mr. Noel Medici have waived their director’s fees for 2017. There are no out of pocket expenses included in the directors’ fees.
** Audit fees relate to the statutory audit of the Company. There are no fees paid to the auditors in respect of other assurance services, tax advisory services or other non-audit services.
*** Launched on June 23, 2017.

Smith & Williamson Investment Funds Plc
43
Notes to the Financial Statements for the financial year ended December 31, 2018 (continued)
5. Financial Assets and Financial Liabilities at fair value through profit or loss
2018
Wye
Investment
Fund
Boulder
Investment
Fund
Santos
Investment
Fund
Smith &
Williamson
Defensive
Growth
Fund
Smith &
Williamson
Short Dated
Corporate
Bond Fund
Smith &
Williamson
Enterprise
Fund
Smith
Williamson
Global
Inflation
Linked Bond
Fund
Smith &
Williamson
Mid Ocean
World
Investment
Fund
Smith &
Williamson
Blairmore
Global
Equity Fund
Smith &
Williamson
Artificial
Intelligence
Fund
Cross
Investment
Total*
2018
Company
GBP GBP GBP GBP GBP GBP GBP USD USD GBP GBP GBP
Cost 17,712,346 17,014,544 10,809,559 38,363,281 235,131,824 18,210,277 111,306,682 61,866,458 25,757,782 120,355,422 (2,962,414) 634,740,124
Unrealised Appreciation/
(Depreciation) on
Revaluation 1,586,884 899,973 1,710,003 1,349,438 (11,222,436) 47,639 1,854,371 5,181,581 1,149,872 (6,209,287) (338,536) (5,350,779)
Fair value 19,299,230 17,914,517 12,519,562 39,712,719 223,909,388 18,257,916 113,161,053 67,048,039 26,907,654 114,146,135 (3,300,950) 629,389,345
* Santos Investment Fund cross invest in Smith & Williamson Artificial Intelligence Fund and Smith & Williamson Global Inflation Linked Bond Fund. Smith & Williamson Mid Ocean World
Investment Fund and Smith & Williamson Blairmore Global Equity Fund cross invest in Smith & Williamson Artificial Intelligence Fund.
2017
Wye
Investment
Fund
Boulder
Investment
Fund
Santos
Investment
Fund
Smith &
Williamson
Defensive
Growth
Fund
Smith &
Williamson
Short Dated
Corporate
Bond Fund
Smith &
Williamson
Enterprise
Fund
Smith
Williamson
Global
Inflation
Linked Bond
Fund
Smith &
Williamson
Medium
Dated
Corporate
Bond Fund
Smith &
Williamson
Mid Ocean
World
Investment
Fund
Smith &
Williamson
Blairmore
Global
Equity Fund
Smith &
Williamson
Artificial
Intelligence
Fund*
Total
2017
Company
GBP GBP GBP GBP GBP GBP GBP GBP USD USD GBP GBP
Cost 16,162,107 16,717,560 10,122,566 22,071,424 365,992,789 23,755,500 65,885,029 3,707,037 67,499,593 26,272,906 38,771,491 632,503,612
Unrealised Appreciation/
(Depreciation) on
Revaluation 4,489,269 4,004,169 2,988,940 2,654,300 (14,203,985) 2,616,093 131,454 34,646 21,027,765 8,621,736 2,354,331 26,986,597
Fair value 20,651,376 20,721,729 13,111,506 24,725,724 351,788,804 26,371,593 66,016,483 3,741,683 88,527,358 34,894,642 41,125,822 659,490,209
* Launched on June 23, 2017.

Smith & Williamson Investment Funds Plc
44
Notes to the Financial Statements for the financial year ended December 31, 2018 (continued)
6. Debtors
2018
Wye
Investment
Fund
Boulder
Investment
Fund
Santos
Investment
Fund
Smith &
Williamson
Defensive
Growth Fund
Smith &
Williamson
Cash Fund
Smith &
Williamson
Short Dated
Corporate
Bond Fund
Smith &
Williamson
Enterprise
Fund
GBP GBP GBP GBP GBP GBP GBP
Dividends receivable 67,260 24,010 14,147 38,250 - - -
Accrued income on bonds - - 28,514 - - 3,907,261 -
Interest from deposits - 79 - - 47,619 - 52,729
Amounts receivable for subscriptions - - - 84,314 - 2,042,848 37,301
Other receivables - - - - 22,370 132,970 124,936
67,260 24,089 42,661 122,564 69,989 6,083,079 214,966
Smith
Williamson
Global
Inflation
Linked Bond
Fund
Smith &
Williamson
Medium
Dated
Corporate
Bond Fund*
Smith &
Williamson
Mid Ocean
World
Investment
Fund
Smith &
Williamson
Blairmore
Global Equity
Fund
Smith &
Williamson
Artificial
Intelligence
Fund
Total
2018
Company
2018
GBP GBP USD USD GBP GBP
Dividends receivable - - 51,614 30,151 1,381 209,246
Accrued income on bonds 381,364 - - - - 4,317,139
Interest from deposits - 9 - - - 100,436
Amounts receivable for subscriptions 142,227 - - - 324,949 2,631,639
Other receivables 24 - - - - 280,300
523,615 9 51,614 30,151 326,330 7,538,760
* Terminated on June 15, 2018.

Smith & Williamson Investment Funds Plc
45
Notes to the Financial Statements for the financial year ended December 31, 2018 (continued)
6. Debtors (continued)
2017
Wye
Investment
Fund
Boulder
Investment
Fund
Santos
Investment
Fund
Smith &
Williamson
Defensive
Growth Fund
Smith &
Williamson
Cash Fund
Smith &
Williamson
Short Dated
Corporate
Bond Fund
Smith &
Williamson
Enterprise
Fund
GBP GBP GBP GBP GBP GBP GBP
Dividends receivable 45,119 19,874 8,511 27,163 - - -
Accrued income on bonds - - 26,074 - - 5,855,692 -
Interest from deposits - - - 2 22,666 - 12,972
Amounts receivable for subscriptions 62,201 - - 222,827 - 737,830 1,163,742
Other receivables - - - - 11,631 404,463 67,797
107,320 19,874 34,585 249,992 34,297 6,997,985 1,244,511
Smith
Williamson
Global
Inflation
Linked Bond
Fund
Smith &
Williamson
Medium
Dated
Corporate
Bond Fund
Smith &
Williamson
Mid Ocean
World
Investment
Fund
Smith &
Williamson
Blairmore
Global Equity
Fund
Smith &
Williamson
Artificial
Intelligence
Fund*
Total
2017
Company
2017
GBP GBP USD USD GBP GBP
Dividends receivable - - 64,928 19,479 1,270 164,332
Accrued income on bonds 215,473 48,161 - - - 6,145,400
Interest from deposits 45 14 1,539 653 - 37,319
Amounts receivable for subscriptions 165,067 - - - 797,633 3,149,300
Other receivables - - - - 66,456 550,347
380,585 48,175 66,467 20,132 865,359 10,046,698
* Launched on June 23, 2017.

Smith & Williamson Investment Funds Plc
46
Notes to the Financial Statements for the financial year ended December 31, 2018 (continued)
7. Cash at Bank 2018
Wye
Investment
Fund
Boulder
Investment
Fund
Santos
Investment
Fund
Smith &
Williamson
Defensive
Growth Fund
Smith &
Williamson
Cash Fund
Smith &
Williamson
Short Dated
Corporate Bond
Fund
Smith &
Williamson
Enterprise Fund
GBP GBP GBP GBP GBP GBP GBP Cash at Bank 80,192 157,686 187,762 2,597,868 6,731 1,657,844 13,406,091
Bank Overdraft - - - - - - (30,001)
Percentage of NAV 0.42% 0.87% 1.49% 6.36% 0.01% 0.66% 10.23%
2018
Smith Williamson
Global Inflation
Linked Bond
Fund
Smith &
Williamson
Medium Dated
Corporate
Bond Fund*
Smith &
Williamson
Mid Ocean World
Investment Fund
Smith &
Williamson
Blairmore
Global Equity
Fund
Smith &
Williamson
Artificial
Intelligence
Fund
Total
2018
Company
GBP GBP USD USD GBP GBP
Cash at Bank 2,257,306 20,590 3,269,388 1,243,276 8,958,415 32,873,625
Bank Overdraft (2,095) - - (2,090) - (33,737)
Percentage of NAV 1.95% - 4.66% 4.41% 7.30% 3.96%
* Terminated on June 15, 2018.
2017
Wye
Investment
Fund
Boulder
Investment
Fund
Santos
Investment
Fund
Smith &
Williamson
Defensive
Growth Fund
Smith &
Williamson
Cash Fund
Smith &
Williamson
Short Dated
Corporate Bond
Fund
Smith &
Williamson
Enterprise Fund
GBP GBP GBP GBP GBP GBP GBP Cash at Bank 56,864 77,931 522,053 1,757,045 1,925 5,820,688 19,989,862
Bank Overdraft - - - - - (350,000) (80,825)
Percentage of NAV 0.28% 0.38% 3.84% 6.63% - 1.40% 14.54%
2017
Smith Williamson
Global Inflation
Linked Bond
Fund
Smith &
Williamson
Medium Dated
Corporate
Bond Fund
Smith &
Williamson
Mid Ocean World
Investment Fund
Smith &
Williamson
Blairmore
Global Equity
Fund
Smith &
Williamson
Artificial
Intelligence
Fund*
Total
2017
Company
GBP GBP USD USD GBP GBP
Cash at Bank 729,237 18,190 1,436,928 235,923 2,542,950 32,753,343
Bank Overdraft - - (168,543) - (908,403) (1,463,818)
Percentage of NAV 1.10% 0.48% 1.41% 0.67% 3.75% 3.62%
* Launched on June 23, 2017.
The Company's cash balances are held with BNP Paribas Services, Dublin Branch and Morgan Stanley London.

Smith & Williamson Investment Funds Plc
47
Notes to the Financial Statements for the financial year ended December 31, 2018 (continued)
8. Loans and Receivables 2018
Smith &
Williamson
Cash Fund
Smith &
Williamson Smith &
Williamson
Enterprise
Fund
Short Dated Total
Corporate Bond 2018
Fund Company
GBP GBP GBP GBP
Term Deposits 28,172,685 - 62,632,579 90,805,264
Money Market Instruments 13,902,982 23,974,130 36,972,035 74,849,147
Call Deposits 2,997,263 - - 2,997,263
45,072,930 23,974,130 99,604,614 168,651,674
2017
Smith &
Williamson
Cash Fund
Smith &
Williamson Smith &
Williamson
Enterprise
Fund
Short Dated Total
Corporate Bond 2017
Fund Company
GBP GBP GBP GBP
Term Deposits 29,076,933 - 53,198,765 82,275,698
Money Market Instruments 15,050,000 34,937,175 36,987,125 86,974,300
Call Deposits 3,030,351 - - 3,030,351
47,157,284 34,937,175 90,185,890 172,280,349

Smith & Williamson Investment Funds Plc
48
Notes to the Financial Statements for the financial year ended December 31, 2018 (continued)
9. Other Liabilities
2018
Boulder
Investment
Fund
Santos
Investment
Fund
Smith &
Williamson
Defensive
Growth Fund
Smith &
Williamson
Cash Fund
Smith &
Williamson
Short Dated
Corporate
Bond Fund
Smith &
Williamson
Enterprise Fund
Wye
Investment
Fund
GBP GBP GBP GBP GBP GBP GBP
Management fees 7,532 15,687 10,195 24,453 11,081 104,489 103,885
Redemptions payable - - - 36,670 - 2,036,680 345,633
Bond payable - - - 1,250,625 - - -
Cash payable - - - - - 131,251 -
CFD dividend payable - - - - - - 227,531
CFD interest payable - - - - - - 9,664
Sundry expenses payable 20,307 9,181 11,520 8,224 13,513 34,503 31,954
27,839 24,868 21,715 1,319,972 24,594 2,306,923 718,667
2018 Smith
Williamson
Global Inflation
Linked Bond
Fund
Smith &
Williamson
Medium Dated
Corporate Bond
Fund*
Smith &
Williamson
Mid Ocean World
Investment Fund
Smith &
Williamson
Blairmore
Global Equity
Fund
Smith &
Williamson
Artificial
Intelligence
Fund
Total
2018
Company
GBP GBP USD USD GBP GBP
Management fees 24,392 73 54,553 23,923 53,744 417,147
Redemptions payable 59,688 - - - 548,506 3,027,177
Bond payable - - - - - 1,250,625
Cash payable - - - - - 131,251
CFD dividend payable - - - - - 227,531
CFD interest payable - - - - - 9,664
Sundry expenses payable 3,341 20,526 36,482 22,620 6,017 205,489
87,421 20,599 91,035 46,543 608,267 5,268,884
* Terminated on June 15, 2018.

Smith & Williamson Investment Funds Plc
49
Notes to the Financial Statements for the financial year ended December 31, 2018 (continued)
9. Other Liabilities (continued)
2017
Boulder
Investment
Fund
Santos
Investment
Fund
Smith &
Williamson
Defensive
Growth Fund
Smith &
Williamson
Cash Fund
Smith &
Williamson
Short Dated
Corporate
Bond Fund
Smith &
Williamson
Enterprise Fund
Wye
Investment
Fund
GBP GBP GBP GBP GBP GBP GBP
Management fees 7,881 17,521 10,808 15,616 7,947 170,563 104,655
Redemptions payable - - - 10,183 - 2,281,110 75,546
CFD dividend payable - - - - - - 77,539
CFD interest payable - - - - - - 12,534
Performance fees - - - - - - 352,545
Sundry expenses payable 14,758 8,711 10,968 7,721 17,578 427,253 38,626
22,639 26,232 21,776 33,520 25,525 2,878,926 661,445
2017 Smith
Williamson
Global Inflation
Linked Bond
Fund
Smith &
Williamson
Medium Dated
Corporate Bond
Fund
Smith &
Williamson
Mid Ocean World
Investment Fund
Smith &
Williamson
Blairmore
Global Equity
Fund
Smith &
Williamson
Artificial
Intelligence
Fund*
Total
2017
Company
GBP GBP USD USD GBP GBP
Management fees 13,800 1,773 45,671 19,639 18,073 416,915
Redemptions payable - - - 67,465 27,823 2,444,533
CFD dividend payable - - - - - 77,539
CFD interest payable - - - - - 12,534
Performance fees - - - - - 352,545
Sundry expenses payable 5,961 11,952 48,517 18,614 4,310 597,463
19,761 13,725 94,188 105,718 50,206 3,901,529
* Launched on June 23, 2017.

Smith & Williamson Investment Funds Plc
50
Notes to the Financial Statements for the financial year ended December 31, 2018 (continued)
10. Share Capital
2018
Wye
Investment
Fund
Class A
Boulder
Investment Fund
Class A
Santos
Investment
Fund
Class A
Smith &
Williamson
Defensive
Growth Fund
Class A
Smith &
Williamson
Defensive
Growth
Fund
Class B
Smith &
Williamson
Cash Fund
Class A
Smith & Williamson
Short Dated
Corporate Bond
Fund
Class A
Smith &
Williamson
Short Dated
Corporate Bond
Fund
Class Z
Number of
shares
Number of
shares
Number of
shares
Number of
shares
Number of
shares
Number of
shares
Number of
shares
Number of
shares
Number of shares outstanding at
January 1, 2018 11,708,296 9,568,718 8,010,250 33,778 19,366,636 47,154,323 3,585,499 248,621,919
Subscriptions for the financial year 482,867 144,000 - 4,815 16,018,599 32,903,848 161,742 31,705,611
Redemptions for the financial year (254,231) (137,326) - (2,399) (4,971,076) (34,999,861) (1,287,890) (89,326,743)
Number of shares outstanding at
December 31, 2018 11,936,932 9,575,392 8,010,250 36,194 30,414,159 45,058,310 2,459,351 191,000,787
Smith &
Williamson Short
Dated Corporate
Bond Fund
Class B
Smith &
Williamson Short
Dated Corporate
Bond Fund
Class C
Smith &
Williamson Short
Dated Corporate
Bond Fund
Class D
Smith &
Williamson
Short Dated
Corporate
Bond Fund
Class Y
Smith &
Williamson
Short Dated
Corporate
Bond Fund
Class B Acc
Smith &
Smith &
Williamson
Enterprise Fund
Class A
Smith &
Williamson
Enterprise Fund
Class Z
2018 Williamson
Short Dated
Corporate
Bond Fund
Class Z Acc
Number of
shares
Number of
shares
Number of
shares
Number of
shares
Number of
shares
Number of
shares
Number of
shares
Number of
shares
Number of shares outstanding at
January 1, 2018 102,951,205 47,600,462 22,048,836 1,000 1,000 12,488,080 21,056 81,027,351
Subscriptions for the financial year 12,401,030 5,000,815 3,522,055 - - - 9 16,435,504
Redemptions for the financial year (74,992,754) (11,533,794) (8,719,028) - - (12,138,855) (4,858) (20,005,017)
Number of shares outstanding at
December 31, 2018 40,359,481 41,067,483 16,851,863 1,000 1,000 349,225 16,207 77,457,838

Smith & Williamson Investment Funds Plc
51
Notes to the Financial Statements for the financial year ended December 31, 2018 (continued)
10. Share Capital (continued)
2018
Smith &
Williamson
Enterprise Fund
Class C
Smith &
Williamson
Enterprise Fund
Class D
Smith &
Williamson
Enterprise
Fund
Class E
Smith &
Williamson
Enterprise
Fund
Class F
Smith &
Williamson
Global Inflation
Linked Bond
Fund
Class X
Smith &
Williamson
Global Inflation
Linked Bond
Fund
Class Z
Smith &
Williamson
Global Inflation
Linked Bond
Fund
Class X Acc
Smith &
Williamson
Enterprise Fund
Class B
Number of
shares
Number of
shares
Number of
shares
Number of
shares
Number of
shares
Number of
shares
Number of
shares
Number of
shares
Number of shares outstanding at
January 1, 2018 7,610 17,924,203 9,583,118 119,523 693,941 58,123,686 1,000 4,630,425
Subscriptions for the financial year 107 8,351,119 1,813,985 418,017 235,020 52,845,235 - 705,596
Redemptions for the financial year (107) (4,956,703) (820,950) (26,409) (445,000) (5,715,773) - (499,697)
Number of shares outstanding at
December 31, 2018 7,610 21,318,619 10,576,153 511,131 483,961 105,253,148 1,000 4,836,324
2018
Smith &
Williamson
Global Inflation
Linked Bond
Fund
Class D
Smith &
Williamson
Global Inflation
Linked Bond
Fund
Class C
Smith &
Williamson
Medium
Dated
Corporate
Bond Fund*
Class B
Smith &
Williamson
Mid
Ocean World
Investment
Fund
Class A
Smith &
Williamson
Mid
Ocean World
Investment
Fund
Class B
Smith &
Williamson
Mid
Ocean World
Investment
Fund
Class C
Smith &
Williamson
Mid
Ocean World
Investment
Fund
Class D
Smith &
Williamson
Global Inflation
Linked Bond
Fund
Class Z Acc
Number of
shares
Number of
shares
Number of
shares
Number of
shares
Number of
shares
Number of
shares
Number of
shares
Number of
shares
Number of shares outstanding at
January 1, 2018 1,000 - - 3,741,677 51,009 880,821 157,240 125,840
Subscriptions for the financial year 92,088 883,211 903,580 249,778 - 5,114 185 -
Redemptions for the financial year - - - (3,991,455) (8,386) (4) (13,998) -
Number of shares outstanding at
December 31, 2018 93,088 883,211 903,580 - 42,623 885,931 143,427 125,840
* Terminated on June 15, 2018.

Smith & Williamson Investment Funds Plc
52
Notes to the Financial Statements for the financial year ended December 31, 2018 (continued)
10. Share Capital (continued)
2018
Smith &
Williamson
Blairmore
Global
Equity Fund
Class A
Smith &
Williamson
Artificial
Intelligence
Fund
Class B
Smith &
Williamson
Artificial
Intelligence
Fund
Class C
Smith &
Williamson
Artificial
Intelligence
Fund
Class X
Smith &
Williamson
Artificial
Intelligence
Fund
Class Z
Number of
shares
Number of
shares
Number of
shares
Number of
shares
Number of
shares
Number of shares outstanding at
January 1, 2018 2,165,177 90,390 92,200 6,591,437 34,318,760
Subscriptions for the financial year 140 824,484 626,831 3,060,136 74,390,191
Redemptions for the financial year (135,835) (91,688) (91,200) (203,336) (11,841,470)
Number of shares outstanding at
December 31, 2018 2,029,482 823,186 627,831 9,448,237 96,867,481
2017
Wye
Investment
Fund
Class A
Boulder
Investment Fund
Class A
Santos
Investment
Fund
Class A
Smith &
Williamson
Defensive
Growth Fund
Class A
Smith &
Williamson
Defensive
Growth
Fund
Class B
Smith &
Williamson
Cash Fund
Class A
Smith & Williamson
Short Dated
Corporate Bond
Fund
Class A
Smith &
Williamson
Short Dated
Corporate Bond
Fund
Class Z
Number of
shares
Number of
shares
Number of
shares
Number of
shares
Number of
shares
Number of
shares
Number of
shares
Number of
shares
Number of shares outstanding at
January 1, 2017 12,062,600 9,215,880 8,190,250 53,634 13,486,144 50,294,896 5,301,116 293,355,299
Subscriptions for the financial year 330,773 457,476 - 8,502 7,221,074 34,678,592 996,029 95,347,033
Redemptions for the financial year (685,077) (104,638) (180,000) (28,358) (1,340,582) (37,819,165) (2,711,646) (140,080,413)
Number of shares outstanding at
December 31, 2017 11,708,296 9,568,718 8,010,250 33,778 19,366,636 47,154,323 3,585,499 248,621,919

Smith & Williamson Investment Funds Plc
53
Notes to the Financial Statements for the financial year ended December 31, 2018 (continued)
10. Share Capital (continued)
2017
Smith &
Williamson Short
Dated Corporate
Bond Fund
Class B
Smith &
Williamson Short
Dated Corporate
Bond Fund
Class C
Smith &
Williamson Short
Dated Corporate
Bond Fund
Class D
Smith &
Williamson
Short Dated
Corporate
Bond Fund
Class Y
Smith &
Williamson
Short Dated
Corporate
Bond Fund
Class B Acc
Smith &
Smith &
Williamson
Enterprise Fund
Class A
Smith &
Williamson
Enterprise Fund
Class Z
Williamson
Short Dated
Corporate
Bond Fund
Class Z Acc
Number of
shares
Number of
shares
Number of
shares
Number of
shares
Number of
shares
Number of
shares
Number of
shares
Number of
shares
Number of shares outstanding at
January 1, 2017 175,344,333 44,137,986 20,225,555 14,465,772 - - 27,111 77,611,455
Subscriptions for the financial year 40,825,671 12,412,474 3,581,247 - 1,000 21,477,063 - 21,702,017
Redemptions for the financial year (113,218,799) (8,949,998) (1,757,966) (14,464,772) - (8,988,983) (6,055) (18,286,121)
Number of shares outstanding at
December 31, 2017 102,951,205 47,600,462 22,048,836 1,000 1,000 12,488,080 21,056 81,027,351
2017
Smith &
Williamson
Enterprise Fund
Class C
Smith &
Williamson
Enterprise Fund
Class D
Smith &
Williamson
Enterprise
Fund
Class E
Smith &
Williamson
Enterprise
Fund
Class F
Smith &
Williamson
Global Inflation
Linked Bond
Fund
Class A
Smith &
Williamson
Global Inflation
Linked Bond
Fund
Class B
Smith &
Smith &
Williamson
Enterprise Fund
Class B
Williamson
Global Inflation
Linked Bond
Fund
Class B Acc
Number of
shares
Number of
shares
Number of
shares
Number of
shares
Number of
shares
Number of
shares
Number of
shares
Number of
shares
Number of shares outstanding at
January 1, 2017 34,797 16,654,271 3,903,723 116,612 819,780 4,250 1,699,947 134,210
Subscriptions for the financial year 200 7,306,912 6,424,170 44,345 253,941 1,000 1,291 29,884
Redemptions for the financial year (27,387) (6,036,980) (744,775) (41,434) (379,780) (5,250) (1,701,238) (164,094)
Number of shares outstanding at
December 31, 2017 7,610 17,924,203 9,583,118 119,523 693,941 - - -

Smith & Williamson Investment Funds Plc
54
Notes to the Financial Statements for the financial year ended December 31, 2018 (continued)
10. Share Capital (continued)
2017
Smith &
Williamson
Global Inflation
Linked Bond
Fund
Class Z
Smith &
Williamson
Global Inflation
Linked Bond
Fund
Class X Acc
Smith &
Williamson
Global
Inflation
Linked Bond
Fund
Class Z Acc
Smith &
Williamson
Medium Dated
Corporate
Bond Fund
Class B
Smith &
Williamson
Mid
Ocean World
Investment
Fund
Class A
Smith &
Williamson
Mid
Ocean World
Investment
Fund
Class B
Smith &
Smith &
Williamson
Global Inflation
Linked Bond
Fund
Class X
Williamson
Mid
Ocean World
Investment
Fund
Class C
Number of
shares
Number of
shares
Number of
shares
Number of
shares
Number of
shares
Number of
shares
Number of
shares
Number of
shares
Number of shares outstanding at
January 1, 2017 - - - - 4,807,067 244,102 1,083,894 3
Subscriptions for the financial year 59,216,186 1,000 4,726,796 1,000 92,250 301 1,272 176,435
Redemptions for the financial year (1,092,500) - (96,371) - (1,157,640) (193,394) (204,345) (19,198)
Number of shares outstanding at
December 31, 2017 58,123,686 1,000 4,630,425 1,000 3,741,677 51,009 880,821 157,240
2017
Smith &
Williamson
Mid
Ocean World
Investment
Fund
Class D
Smith &
Williamson
Blairmore
Global
Equity Fund
Class A
Smith &
Williamson
Artificial
Intelligence
Fund*
Class B
Smith &
Williamson
Artificial
Intelligence
Fund*
Class C
Smith &
Williamson
Artificial
Intelligence
Fund*
Class X
Smith &
Williamson
Artificial
Intelligence
Fund*
Class Z
Number of
shares
Number of
shares
Number of
shares
Number of
shares
Number of
shares
Number of
shares
Number of shares outstanding at
January 1, 2017 800 2,331,931 - - - -
Subscriptions for the financial year 125,040 1,576 90,390 92,200 6,591,437 34,808,157
Redemptions for the financial year - (168,330) - - - (489,397)
Number of shares outstanding at
December 31, 2017
125,840 2,165,177 90,390 92,200 6,591,437 34,318,760
* Launched on June 23, 2017.
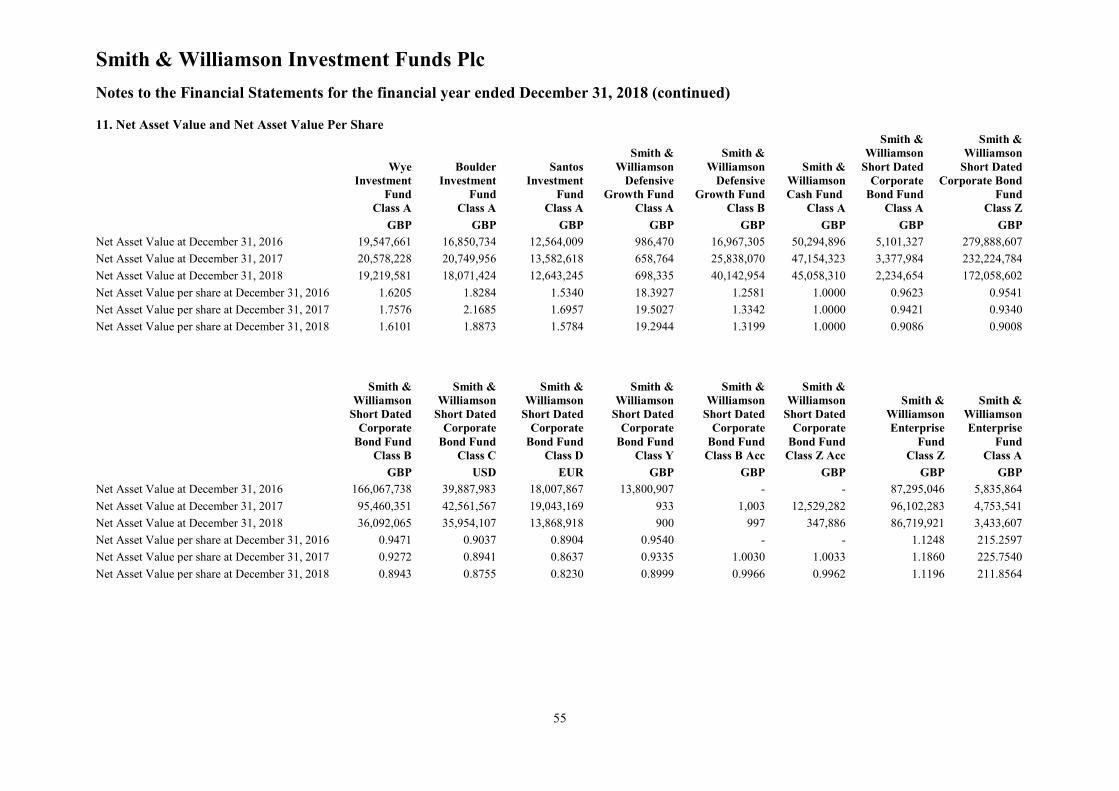
Smith & Williamson Investment Funds Plc
55
Notes to the Financial Statements for the financial year ended December 31, 2018 (continued)
11. Net Asset Value and Net Asset Value Per Share
Wye
Investment
Fund
Class A
Boulder
Investment
Fund
Class A
Santos
Investment
Fund
Class A
Smith &
Williamson
Defensive
Growth Fund
Class A
Smith &
Williamson
Defensive
Growth Fund
Class B
Smith &
Williamson
Cash Fund
Class A
Smith &
Williamson
Short Dated
Corporate
Bond Fund
Class A
Smith &
Williamson
Short Dated
Corporate Bond
Fund
Class Z
GBP GBP GBP GBP GBP GBP GBP GBP
Net Asset Value at December 31, 2016 19,547,661 16,850,734 12,564,009 986,470 16,967,305 50,294,896 5,101,327 279,888,607
Net Asset Value at December 31, 2017 20,578,228 20,749,956 13,582,618 658,764 25,838,070 47,154,323 3,377,984 232,224,784
Net Asset Value at December 31, 2018 19,219,581 18,071,424 12,643,245 698,335 40,142,954 45,058,310 2,234,654 172,058,602
Net Asset Value per share at December 31, 2016 1.6205 1.8284 1.5340 18.3927 1.2581 1.0000 0.9623 0.9541
Net Asset Value per share at December 31, 2017 1.7576 2.1685 1.6957 19.5027 1.3342 1.0000 0.9421 0.9340
Net Asset Value per share at December 31, 2018 1.6101 1.8873 1.5784 19.2944 1.3199 1.0000 0.9086 0.9008
Smith &
Williamson
Short Dated
Corporate
Bond Fund
Class B
Smith &
Williamson
Short Dated
Corporate
Bond Fund
Class D
Smith &
Williamson
Short Dated
Corporate
Bond Fund
Class Y
Smith &
Williamson
Enterprise
Fund
Class Z
Smith &
Williamson
Short Dated
Corporate
Bond Fund
Class C
Smith &
Williamson
Short Dated
Corporate
Bond Fund
Class B Acc
Smith &
Williamson
Short Dated
Corporate
Bond Fund
Class Z Acc
Smith &
Williamson
Enterprise
Fund
Class A
GBP USD EUR GBP GBP GBP GBP GBP
Net Asset Value at December 31, 2016 166,067,738 39,887,983 18,007,867 13,800,907 - - 87,295,046 5,835,864
Net Asset Value at December 31, 2017 95,460,351 42,561,567 19,043,169 933 1,003 12,529,282 96,102,283 4,753,541
Net Asset Value at December 31, 2018 36,092,065 35,954,107 13,868,918 900 997 347,886 86,719,921 3,433,607
Net Asset Value per share at December 31, 2016 0.9471 0.9037 0.8904 0.9540 - - 1.1248 215.2597
Net Asset Value per share at December 31, 2017 0.9272 0.8941 0.8637 0.9335 1.0030 1.0033 1.1860 225.7540
Net Asset Value per share at December 31, 2018 0.8943 0.8755 0.8230 0.8999 0.9966 0.9962 1.1196 211.8564

Smith & Williamson Investment Funds Plc
56
Notes to the Financial Statements for the financial year ended December 31, 2018 (continued)
11. Net Asset Value and Net Asset Value Per Share (continued)
Smith &
Williamson
Enterprise
Fund
Class B
Smith &
Williamson
Enterprise
Fund
Class C
Smith &
Williamson
Enterprise
Fund
Class D
Smith &
Williamson
Enterprise
Fund
Class E
Smith &
Williamson
Enterprise
Fund
Class F
Smith &
Williamson
Global
Inflation
Linked Bond
Fund
Class A
Smith &
Williamson
Global Inflation
Linked Bond
Fund
Class B
Smith &
Williamson
Global
Inflation
Linked Bond
Fund
Class B Acc
USD GBP GBP USD EUR GBP GBP GBP
Net Asset Value at December 31, 2016 7,175,240 23,169,189 4,094,577 156,133 864,548 4,440 1,779,098 143,997
Net Asset Value at December 31, 2017 1,661,643 26,146,086 10,635,893 166,637 762,384 - - -
Net Asset Value at December 31, 2018 1,584,469 29,357,074 11,255,495 666,971 496,358 - - -
Net Asset Value per share at December 31, 2016 206.2030 1.3912 1.0489 1.3389 1.0546 1.0447 1.0466 1.0729
Net Asset Value per share at December 31, 2017 218.3499 1.4587 1.1099 1.3942 1.0986 - - -
Net Asset Value per share at December 31, 2018 208.2088 1.3771 1.0642 1.3049 1.0256 - - -
Smith &
Williamson
Global
Inflation
Linked Bond
Fund
Class C
Smith &
Williamson
Global
Inflation
Linked Bond
Fund
Class D
Smith &
Williamson
Global
Inflation
Linked Bond
Fund
Class X
Smith &
Williamson
Global
Inflation
Linked Bond
Fund
Class Z
Smith &
Williamson
Global
Inflation
Linked Bond
Fund
Class X Acc
Smith &
Williamson
Global
Inflation
Linked Bond
Fund
Class Z Acc
Smith &
Williamson
Medium Dated
Corporate
Bond Fund*
Class B
Smith &
Williamson
Mid Ocean
World
Investment
Fund
Class A
USD EUR GBP GBP GBP GBP GBP USD
Net Asset Value at December 31, 2016 - - - - - - 4,859,343 80,798,157
Net Asset Value at December 31, 2017 - - 61,437,240 1,004 5,031,371 1,002 3,771,841 21,396,624
Net Asset Value at December 31, 2018 908,968 872,487 108,600,678 988 5,172,975 91,056 - 15,586,547
Net Asset Value per share at December 31, 2016 - - - - - - 1.0109 331.0020
Net Asset Value per share at December 31, 2017 - - 1.0570 1.0043 1.0866 1.0021 1.0081 419.4714
Net Asset Value per share at December 31, 2018 1.0059 0.9879 1.0318 0.9878 1.0696 0.9782 - 365.6845

Smith & Williamson Investment Funds Plc
57
Notes to the Financial Statements for the financial year ended December 31, 2018 (continued)
11. Net Asset Value and Net Asset Value Per Share (continued)
Smith &
Williamson
Mid Ocean
World
Investment
Fund
Class B
Smith &
Williamson
Mid Ocean
World
Investment
Fund
Class C
Smith &
Williamson
Mid Ocean
World
Investment
Fund
Class D
Smith &
Williamson
Blairmore
Global Equity
Fund
Class A
Smith &
Williamson
Artificial
Intelligence
Fund**
Class B
Smith &
Williamson
Artificial
Intelligence
Fund**
Class C
Smith &
Williamson
Artificial
Intelligence
Fund**
Class X
Smith &
Williamson
Artificial
Intelligence
Fund**
Class Z
GBP USD GBP USD GBP USD USD GBP
Net Asset Value at December 31, 2016 1,393,278 995 1,030 29,893,371 - - - -
Net Asset Value at December 31, 2017 1,312,897 66,295,226 188,366 35,044,979 99,262 107,175 7,671,792 37,725,925
Net Asset Value at December 31, 2018 1,222,708 52,776,172 175,040 28,132,448 952,839 724,205 10,945,476 112,573,818
Net Asset Value per share at December 31, 2016 1.2854 331.6300 1.2876 12.8191 - - - -
Net Asset Value per share at December 31, 2017 1.4905 421.6183 1.4969 16.1857 1.0981 1.1624 1.1639 1.0993
Net Asset Value per share at December 31, 2018 1.3801 367.9657 1.3910 13.8619 1.1575 1.1535 1.1585 1.1621
*Terminated on June 15, 2018.
** Launched on June 23, 2017.

Smith & Williamson Investment Funds Plc
58
Notes to the Financial Statements for the financial year ended December 31, 2018 (continued)
12. Net realised and movement in unrealised gains/(losses) on investments
2018
Wye
Investment
Fund
Boulder
Investment
Fund
Santos
Investment
Fund
Smith &
Williamson
Defensive
Growth
Fund
Smith &
Williamson
Short Dated
Corporate
Bond Fund
Smith &
Williamson
Enterprise
Fund
GBP GBP GBP GBP GBP GBP
Realised gains/(losses) on investments at fair
value through profit or loss
Equities and participation notes 1,156,157 410,172 339,368 758,291 2,093,943 456,880
Bonds - - - - (9,161,918) 113,390
Contracts for difference - - - - - (7,671,517)
Forward currency contracts - - - - (5,133,300) 729,437
1,156,157 410,172 339,368 758,291 (12,201,275) (6,371,810)
Smith &
Williamson
Global
Inflation
Linked Bond
Fund
Smith &
Williamson
Medium
Dated
Corporate
Bond Fund*
Smith &
Williamson
Mid Ocean
World
Investment
Fund
Smith &
Williamson
Blairmore
Global
Equity
Fund
Smith &
Williamson
Artificial
Intelligence
Fund
Total
2018
Company
GBP GBP USD USD GBP GBP
Realised gains/(losses) on investments at fair
value through profit or loss
Equities and participation notes 1,935,776 - 5,684,881 2,684,989 2,138,749 15,558,953
Bonds (92,076) (127,347) - - - (9,267,951)
Contracts for difference - - - - - (7,671,517)
Forward currency contracts (5,155,699) 55,645 (58,289) - - (9,547,580)
(3,311,999) (71,702) 5,626,592 2,684,989 2,138,749 (10,928,095)
*Terminated on June 15, 2018.

Smith & Williamson Investment Funds Plc
59
Notes to the Financial Statements for the financial year ended December 31, 2018 (continued)
12. Net realised and movement in unrealised gains/(losses) on investments (continued)
2018
Wye
Investment
Fund
Boulder
Investment
Fund
Santos
Investment
Fund
Smith &
Williamson
Defensive
Growth
Fund
Smith &
Williamson
Cash
Fund
Smith &
Williamson
Short Dated
Corporate
Bond Fund
Smith &
Williamson
Enterprise
Fund
GBP GBP GBP GBP GBP GBP GBP
Movement in unrealised appreciation/(depreciation)
on investments at fair value through profit or loss
Equities and participation notes (2,894,722) (3,102,940) (1,131,646) (490,478) (30) (1,015,630) (2,452,477)
Bonds - - (147,102) (817,864) (2,199) 4,776,477 80,731
Contracts for difference - - - - - - (153,061)
Forward currency contracts - - - - - (1,787,697) 35,268
(2,894,722) (3,102,940) (1,278,748) (1,308,342) (2,229) 1,973,150 (2,489,539)
Smith &
Williamson
Global
Inflation
Linked Bond
Fund
Smith &
Williamson
Medium
Dated
Corporate
Bond Fund*
Smith &
Williamson
Mid Ocean
World
Investment
Fund
Smith &
Williamson
Blairmore
Global
Equity
Fund
Smith &
Williamson
Artificial
Intelligence
Fund
Total**
2018
Company
GBP GBP USD USD GBP GBP
Movement in unrealised appreciation/(depreciation)
on investments at fair value through profit or loss
Equities and participation notes (478,849) (10,847) (15,904,677) (7,476,761) (8,660,299) (38,078,149)
Bonds 2,045,894 (24,900) - - - 5,911,037
Contracts for difference - - - - - (153,061)
Forward currency contracts (322,977) (9,746) - - - (2,085,152)
1,244,068 (45,493) (15,904,677) (7,476,761) (8,660,299) (34,405,325)
*Terminated on June 15, 2018.
**Santos Investment Fund cross invest in Smith & Williamson Artificial Intelligence Fund and Smith & Williamson Global Inflation Linked Bond Fund. Smith & Williamson Mid Ocean World
Investment Fund and Smith & Williamson Blairmore Global Equity Fund cross invest in Smith & Williamson Artificial Intelligence Fund.

Smith & Williamson Investment Funds Plc
60
Notes to the Financial Statements for the financial year ended December 31, 2018 (continued)
12. Net realised and movement in unrealised gains/(losses) on investments (continued)
2017
Wye
Investment
Fund
Boulder
Investment
Fund
Santos
Investment
Fund
Smith &
Williamson
Defensive
Growth
Fund
Smith &
Williamson
Short Dated
Corporate
Bond Fund
Smith &
Williamson
Enterprise
Fund
GBP GBP GBP GBP GBP GBP
Realised gains/(losses) on investments at fair
value through profit or loss
Equities and participation notes 1,894,417 800,633 352,626 608,565 - 1,834,188
Bonds - - 200,421 - (18,308,049) 68,965
Contracts for difference - - - - - 4,961,683
Forward currency contracts - - - - 18,488,965 (326,717)
1,894,417 800,633 553,047 608,565 180,916 6,538,119
Smith
Williamson
Global
Inflation
Linked Bond
Fund
Smith &
Williamson
Medium
Dated
Corporate
Bond Fund
Smith &
Williamson
Mid Ocean
World
Investment
Fund
Smith &
Williamson
Blairmore
Global
Equity
Fund
Smith &
Williamson
Artificial
Intelligence
Fund*
Total
2017
Company
GBP GBP USD USD GBP GBP
Realised gains/(losses) on investments at fair
value through profit or loss
Equities and participation notes - - 4,614,679 1,126,394 307,194 10,252,035
Bonds (267,717) 122,815 - (27,213) - (18,204,679)
Contracts for difference - - - - - 4,961,683
Forward currency contracts 1,627,998 113,792 (5,873) 642 - 19,899,979
1,360,281 236,607 4,608,806 1,099,823 307,194 16,909,018
* Launched on June 23, 2017.

Smith & Williamson Investment Funds Plc
61
Notes to the Financial Statements for the financial year ended December 31, 2018 (continued)
12. Net realised and movement in unrealised gains/(losses) on investments (continued)
2017
Wye
Investment
Fund
Boulder
Investment
Fund
Santos
Investment
Fund
Smith &
Williamson
Defensive
Growth
Fund
Smith &
Williamson
Short Dated
Corporate
Bond Fund
Smith &
Williamson
Enterprise
Fund
GBP GBP GBP GBP GBP GBP
Movement in unrealised appreciation/(depreciation)
on investments at fair value through profit or loss
Equities and participation notes (255,032) 2,388,450 796,615 204,621 - 624,658
Bonds - - (27,398) 413,744 (16,750,889) (14,237)
Contracts for difference - - - - - (647,106)
Forward currency contracts - - - - 5,385,255 (360,498)
(255,032) 2,388,450 769,217 618,365 (11,365,634) (397,183)
Smith
Williamson
Global
Inflation
Linked Bond
Fund
Smith &
Williamson
Medium
Dated
Corporate
Bond Fund
Smith &
Williamson
Mid Ocean
World
Investment
Fund
Smith &
Williamson
Blairmore
Global
Equity
Fund
Smith &
Williamson
Artificial
Intelligence
Fund*
Total
2017
Company
GBP GBP USD USD GBP GBP
Movement in unrealised appreciation/(depreciation)
on investments at fair value through profit or loss
Equities and participation notes - - 15,428,504 6,302,622 2,323,196 22,943,359
Bonds (766,730) (275,348) - 99,460 - (17,343,688)
Contracts for difference - - - - - (647,106)
Forward currency contracts 183,030 31,157 (48,324) (20,764) - 5,185,340
(583,700) (244,191) 15,380,180 6,381,318 2,323,196 10,137,905
* Launched on June 23, 2017.

Smith & Williamson Investment Funds Plc
62
Notes to the Financial Statements for the financial year ended December 31, 2018 (continued)
13. Related Party Transactions
IAS 24 - Related Party Disclosures requires the disclosure of information relating to material transactions with parties
who are deemed to be related to the reporting entity.
Cross Investments Some of the sub-funds invest in other investment funds managed by the Investment Manager. These investments are
included in the schedule of investments and are precluded by the name Smith & Williamson. The total amount of the
unrealised gains relating to these investments for December 31, 2018 was GBP325,901 (December 31, 2017:
GBP523,108). For the Company’s total column in the primary statements these figures must be eliminated to avoid
double counting. As at December 31, 2018, Santos Investment Fund had cross investments in Smith & Williamson
Artificial Intelligence Fund and Smith & Williamson Global Inflation Linked Bond Fund which amounted to
GBP406,035 and GBP430,978 respectively. Smith & Williamson Mid Ocean World Investment Fund and Smith &
Williamson Blairmore Global Equity Fund each had cross investments in Smith & Williamson Artificial Intelligence
Fund which amounted to USD2,735,059 and USD403,095 respectively.
Management Fee
Smith & Williamson Investment Management LLP as the Investment Manager is a related party of the Company. The
Company has entered into a management agreement with Smith & Williamson Investment Management (Ireland)
Limited under which the Manager is entitled to a fee at an agreed annual rate of the Net Asset Value of each class of
shares.
All depositary and trustee fees will be borne by the Manager from its annual management fee, except for Wye
Investment Fund, Cash Fund and Blairmore Global Equity Fund which will bear such fees.
Performance Fee
The Investment Manager is entitled to receive a Performance Fee out of the assets of the Enterprise Fund in respect of
each class of Shares. The Performance Fee is calculated, accrued and valued monthly and is payable either quarterly in
arrears in respect of each calendar quarter (i.e. the three month period ending on 31 March, 30 June, 30 September and
31 December each financial year) (a Performance Period) or upon redemption in respect of any shares redeemed
during a Performance Period.
Management fee
Smith & Williamson Enterprise Fund Class E 1.75%
Smith & Williamson Enterprise Fund Class A & B 1.50%
Smith & Williamson Enterprise Fund Class C, D, F, Y and Z 0.90%
Santos Investment Fund 1.00%
Smith & Williamson Defensive Growth Fund A 1.00%
Smith & Williamson Defensive Growth Fund B 0.70%
Smith & Williamson Short Dated Corporate Bond Fund Class A 1.00%
Smith & Williamson Short Dated Corporate Bond Fund Class B Income, B Accumulation,
C & D 0.65%
Smith & Williamson Short Dated Corporate Bond Fund Class Y, Z income & Z Accumulation 0.45%
Smith & Williamson Boulder Investment Fund 1.00%
Smith & Williamson Global Inflation Linked Bond Fund Class C, D, X Income & X
Accumulation 0.25%
Smith & Williamson Global Inflation Linked Bond Fund Class Z Income & Z Accumulation 0.45%
Smith & Williamson Medium Dated Corporate Bond Fund Class A 1.00%
Smith & Williamson Medium Dated Corporate Bond Fund Class B 0.55%
Smith & Williamson Mid Ocean World Investment Fund Class A & B 1.50%
Smith & Williamson Mid Ocean World Investment Fund Class C & D 0.75%
Smith & Williamson Blairmore Global Equity Fund Class A USD, Class B & Class C EUR 1.00%
Smith & Williamson Artificial Intelligence Fund Class B & C 0.80%
Smith & Williamson Artificial Intelligence Fund Class X & Z 0.50%

Smith & Williamson Investment Funds Plc
63
Notes to the Financial Statements for the financial year ended December 31, 2018 (continued)
13. Related Party Transactions (continued)
Performance Fee (continued) The Performance Fee is a percentage of the amount by which the Net Asset Value per Share on the last Business Day of the relevant Performance Period (the Calculation Day), without deduction of any accrued Performance Fee, exceeds the Performance Fee High Watermark (as defined below), at the following rates:
Class A Shares: 10% Class B Shares: 10% Class C Shares: 20% Class D Shares: 20% Class E Shares: 20% Class F Shares: 20% Class Y Shares: 10% Class Z Shares: 10%
In order for a Performance Fee to be payable in respect of a Performance Period, the Net Asset Value per Share of the relevant class on the relevant Calculation Day without deduction of any accrued Performance Fee (the Final Net Asset Value per Share) must exceed the Performance Fee High Watermark (as defined below).
Where the Performance Fee High Watermark is exceeded, the Performance Fee payable per class of Shares is equal to 10% or 20% (as applicable) of the amount by which the Final Net Asset Value per Share of the relevant class exceeds the Performance Fee High Watermark multiplied by the Shares in issue on the relevant Calculation Day.
Performance Fee High Watermark means the higher of (i) the initial issue price of the relevant class of Shares (excluding any sales charge or anti-dilution levy) and (ii) the last Final Net Asset Value per Share of the relevant class upon which a Performance Fee was paid, adjusted for any Performance Fees paid since such date. The Performance Fee High Watermark will be adjusted for the issue of new Shares to ensure that Shareholders are only charged a Performance Fee in respect of such Shares for the period during which those Shareholders remain invested. The Performance Fee High Watermark for the first Performance Period will be the initial issue price of the relevant class of Shares.
Performance fees charged by Smith & Williamson Enterprise Fund during 2018 were GBP8,593 (2017: GBP918,094) and performance fees payable at December 31, 2018 were GBPNil (December 31, 2017: GBP352,545).
Directors Fees
The Directors will be entitled to remuneration by the Company for their services as Directors provided however that
the aggregate emoluments of each Director in respect of any twelve month accounting period shall not exceed
GBP30,000 or such higher amount as may be approved by the Company in general meeting. In addition, the Directors
will also be entitled to be reimbursed for their reasonable expenses incurred not included out of pocket expenses in
discharging their duties as Directors.
Any Director who serves on any committee or who otherwise performs services which, in the opinion of the Directors
are outside the scope of the ordinary duties of a Director, may be paid such extra remuneration as the Directors may
determine.
Directors fees charged by Smith & Williamson Enterprise Fund during 2018 were GBP72,321 (2017: GBP58,781) and directors fees payable at December 31, 2018 were GBP17,928 (December 31, 2017: GBP13,280).
Transactions with Connected Persons
In accordance with the requirements of the Central Bank (Supervision and Enforcement) Act 2013 (Section 48(1))
(Undertakings for Collective Investment in Transferable Securities) Regulations 2015 as amended the Directors
confirm that there are arrangements in place, evidenced by written procedures to ensure that any transactions carried
out between the Company and a connected person is conducted as arm’s length and in the best interests of the
shareholders. Connected persons means the Manager, Depositary and the delegates or sub-delegates of such a
management company or depositary (excluding any non-group company sub-custodians appointed by a depositary);
and any associated or group company of such a management company, depositary, delegate or sub-delegate. The
Company’s Board of Directors are satisfied that the transactions with connected persons during the financial year were
carried out as if negotiated at arm’s length and in the best interests of the shareholders.
Contingent liabilities
The Directors are not currently aware of any such existing or contingent liabilities as at December 31, 2018.

Smith & Williamson Investment Funds Plc
64
Notes to the Financial Statements for the financial year ended December 31, 2018 (continued)
14. Financial Instruments and Associated risks
In pursuing their investment objectives the sub-funds invest in transferable securities, with the aim of spreading risk. To the extent permitted by the investment objectives, restrictions and policies set forth in the sub-funds’ Prospectus, the sub-funds may also participate in various derivative-based transactions.
Investment in equities, bonds, money market deposits and derivatives expose the sub-funds to varying risks, including market risk (interest rate risk, currency risk and price risk) liquidity risk and credit risk. A description of the specific risks and the policies for managing these risks are included below. Derivative securities are instruments or agreements whose value is derived from an underlying security instrument, currency or index.
An analysis of the types of securities held at the financial year end is included in each respective sub-fund’s Schedule of Investments. Investments held at the financial year end are representative of the type of investments held during the financial year.
14.1.1 Market risk
Market risk embodies the potential for both loss and gains and includes interest rate risk, currency risk and price risk.
The Company's strategy on the management of investment risk is driven by the Company's investment objective as set
out in Note 1. The Company's market risk is managed on a daily basis by the Investment Manager. The Investment
Manager moderates this risk through a careful selection of securities and other financial instruments within specified
limits. Details of the nature of the Company's investment portfolio at the Statement of Financial Position date are
disclosed in the Schedule of Investments on pages 91 to 126.
Any increase or decrease in the market price of investments would alter the Company’s net asset value to the extent
that it was invested at the time. The Company’s investment portfolio complies with the investment restrictions as
disclosed in its prospectus.
The use of Financial Derivative Instruments (“FDI”) is restricted to forward foreign exchange transactions providing
passive hedging of currency share classes. A non-sophisticated user of FDI approach is being taken and hence the
commitment approach is to be used. The global position exposure is calculated taking into account the current value of
the underlying assets. The commitment approach converts the sub-funds FDI positions into equivalent positions of the
underlying assets and seeks to ensure that the sub-fund is monitored in terms of any future commitments to which it
may be obliged.
There is no leverage on the sub-funds with the exception of the Smith & Williamson Enterprise Fund. The total
exposure of the sub-fund (which is calculated taking leverage into account) will not exceed 200% of NAV and will be
monitored on a daily basis to ensure that the total exposure does not exceed this stated maximum.
At December 31, 2018 if the fair value of investments to which the sub-funds were exposed had changed by 5% with
all other variables held constant, this would have resulted in a change of net assets attributable to the shareholders by
the amounts detailed below:
2018 2017
Wye Investment Fund GBP 964,962 1,032,569
Boulder Investment Fund GBP 895,726 1,036,086
Santos Investment Fund GBP 625,978 655,575
Smith & Williamson Defensive Growth Fund GBP 1,985,636 1,236,286
Smith & Williamson Cash Fund GBP 2,253,647 2,357,864
Smith & Williamson Short Dated Corporate Bond Fund GBP 11,195,469 17,589,440
Smith & Williamson Enterprise Fund GBP 912,896 1,318,580
Smith & Williamson Global Inflation Linked Bond Fund GBP 5,658,053 3,300,824
Smith & Williamson Medium Dated Corporate Bond Fund** GBP - 187,084
Smith & Williamson Mid Ocean World Investment Fund USD 3,352,402 4,426,368
Smith & Williamson Blairmore Global Equity Fund USD 1,345,383 1,744,732
Smith & Williamson Artificial Intelligence Fund* GBP 5,707,307 2,056,291
* Launched on June 23, 2017.
**Terminated on June 15, 2018.
14.1.2 Interest rate risk
The Company's financial assets include direct interest bearing instruments. As a result the Company is exposed to fair
value interest rate risk due to fluctuations in the prevailing levels of market interest rates. The Company's interest rate
risk is managed on a daily basis by the Investment Manager.
Cash and cash equivalents are not considered significantly exposed to fair value interest rate risk due to the short term
nature of the instruments. Cash earns interest at a variable interest rate.

Smith & Williamson Investment Funds Plc
65
Notes to the Financial Statements for the financial year ended December 31, 2018 (continued)
14. Financial Instruments and Associated risks (continued)
14.1.2 Interest rate risk (continued)
The interest bearing financial instruments significantly exposed to fair value interest rate risk are the corporate bonds.
Consequently, movements in interest rates would have an inverse effect on the movement of the net asset value of the
sub-funds. At December 31, 2018 an increase of 1% in interest rates as at the reporting date would have decreased the
Net Assets Attributable to Holders of Redeemable Participating Shares in the Statement of Financial Position and
increase/(decrease) per the Statement of Comprehensive Income by the amounts detailed below. A decrease of 1%
would have an equal but opposite effect.
2018 2017
Santos Investment Fund GBP 31,721 28,129
Smith & Williamson Defensive Growth Fund GBP 163,033 78,425
Smith & Williamson Cash Fund GBP 450,729 471,573
Smith & Williamson Short Dated Corporate Bond Fund GBP 2,482,291 3,852,838
Smith & Williamson Enterprise Fund GBP 996,046 901,859
Smith & Williamson Global Inflation Linked Bond Fund GBP 1,133,145 658,470
Smith & Williamson Medium Dated Corporate Bond Fund* GBP - 37,319
* Terminated on June 15, 2018.
2018
Santos
Investment
Fund
Smith &
Williamson
Defensive
Growth Fund
Smith &
Williamson
Cash Fund
Smith &
Williamson
Short
Dated
Corporate
Bond Fund
Smith &
Williamson
Enterprise
Fund
GBP GBP GBP GBP GBP
Fair value of Fixed Interest Rate
Investments 2,574,858 - 45,072,930 224,254,945 62,632,579
Fair value of Floating Interest Rate
Investments 597,242 17,084,897 - 23,974,130 36,972,035
Weighted Average Coupon Rate 3.45% 0.26% 0.75% 3.46% 0.48%
Weighted Average Period to Maturity
(financial years) 13.79 5.27 0.14 2.91 0.12
Non-Interest Bearing Investments 9,347,462 22,627,822 - (345,557) 18,257,916
Total financial assets and financial
liabilities at fair value through profit
or loss and loans and receivables 12,519,562 39,712,719 45,072,930 247,883,518 117,862,530
2018
Smith &
Williamson
Global
Inflation
Linked Bond
Fund
GBP
Fair value of Fixed Interest Rate
Investments 100,129,932
Fair value of Floating Interest Rate
Investments 13,184,566
Weighted Average Coupon Rate 0.20%
Weighted Average Period to Maturity
(financial years) 6.71
Non-Interest Bearing Investments (153,445)
Total financial assets and financial
liabilities at fair value through
profit or loss and loans and receivables 113,161,053

Smith & Williamson Investment Funds Plc
66
Notes to the Financial Statements for the financial year ended December 31, 2018 (continued)
14. Financial Instruments and Associated risks (continued)
14.1.2 Interest rate risk (continued)
2017
Santos
Investment
Fund
Smith &
Williamson
Defensive
Growth Fund
Smith &
Williamson
Cash Fund
Smith &
Williamson
Short
Dated
Corporate
Bond Fund
Smith &
Williamson
Enterprise
Fund
GBP GBP GBP GBP GBP
Fair value of Fixed Interest Rate
Investments 2,179,646 779,625 47,157,284 350,346,664 53,198,765
Fair value of Floating Interest Rate
Investments 633,256 8,330,548 - 34,937,175 36,987,125
Weighted Average Coupon Rate 3.16% 0.35% 0.41% 3.46% 0.21%
Weighted Average Period to Maturity
(financial years) 16.62 4.72 0.16 3.52 0.07
Non-Interest Bearing Investments 10,298,604 15,615,551 - 1,442,140 26,371,593
Total financial assets and financial
liabilities at fair value through profit
or loss and loans and receivables 13,111,506 24,725,724 47,157,284 386,725,979 116,557,483
The tables below analyses all of the sub-funds’ interest bearing instruments as at December 31, 2018 into relevant
groupings based on the remaining period at the date of the Statement of Financial Position to the contractual maturity
date:
Wye Investment Fund Less than
1 month Total
December 31, 2018 GBP GBP
EUR 84 84
GBP 80,106 80,106
USD 2 2
80,192 80,192
2017 Smith &
Williamson
Global Inflation
Linked Bond
Fund
Smith &
Williamson
Medium Dated
Corporate
Bond Fund
GBP GBP
Fair value of Fixed Interest Rate
Investments 58,786,102 3,731,937
Fair value of Floating Interest Rate
Investments 7,060,848 -
Weighted Average Coupon Rate 0.26% 3.60%
Weighted Average Period to Maturity
(financial years) 7.39 8.66
Non-Interest Bearing Investments 169,533 9,746
Total financial assets and financial
liabilities at fair value through
profit or loss and loans and receivables 66,016,483 3,741,683

Smith & Williamson Investment Funds Plc
67
Notes to the Financial Statements for the financial year ended December 31, 2018 (continued)
14. Financial Instruments and Associated risks (continued)
14.1.2 Interest rate risk (continued)
Boulder Investment Fund Less than
1 month Total
December 31, 2018 GBP GBP
EUR 2,549 2,549
GBP 155,130 155,130
NOK 5 5
USD 2 2
157,686 157,686
Santos Investment Fund Less than 1 year to 3 years to Greater
1 month 3 years 5 years than 5 years Total
December 31, 2018 GBP GBP GBP GBP GBP
GBP 187,762 308,968 533,902 2,329,231 3,359,863
187,762 308,968 533,902 2,329,231 3,359,863
Smith & Williamson Defensive Growth
Fund Less than 1 year to 3 years to Greater
1 month 3 years 5 years than 5 years Total
December 31, 2018 GBP GBP GBP GBP GBP
GBP 2,596,996 2,341,179 3,881,858 9,859,958 18,679,991
JPY (1) - - - (1)
USD 872 - - 1,001,903 1,002,775
2,597,867 2,341,179 3,881,858 10,861,861 19,682,765
Smith & Williamson Cash Fund Less than 1 month to 3 months to
1 month 3 months 12 months Total
December 31, 2018 GBP GBP GBP GBP
GBP 22,636,613 12,433,461 10,009,587 45,079,661
22,636,613 12,433,461 10,009,587 45,079,661
Smith & Williamson Short
Dated Corporate Bond Fund Less than 1 month to 3 months to 1 year to 3 years to Greater
1 month 3 months 12 months 3 years 5 years than 5 years Total
December 31, 2018 GBP GBP GBP GBP GBP GBP GBP
EUR 267,453 - - 4,745,069 - - 5,012,522
GBP 3,263,387 19,978,300 17,972,494 42,269,621 65,186,064 5,619,082 154,288,948
USD 126,324 - - 15,142,652 66,941,824 8,374,649 90,585,449
3,657,164 19,978,300 17,972,494 62,157,342 132,127,888 13,993,731 249,886,919
Smith & Williamson Enterprise Fund Less than 1 month to
1 month 3 months Total
December 31, 2018 GBP GBP GBP
EUR 591,919 - 591,919
GBP 35,215,968 77,169,876 112,385,844
USD 32,942 - 32,942
35,840,829 77,169,876 113,010,705

Smith & Williamson Investment Funds Plc
68
Notes to the Financial Statements for the financial year ended December 31, 2018 (continued)
14. Financial Instruments and Associated risks (continued)
14.1.2 Interest rate risk (continued)
Smith & Williamson Global
Inflation Linked Bond Fund Less than 3 months to 1 year to 3 years to Greater
1 month 12 months 3 years 5 years than 5 years Total
December 31, 2018 GBP GBP GBP GBP GBP GBP
AUD - - 85,061 61,659 1,418,407 1,565,127
CAD 529 - 102,740 - 1,388,271 1,491,540
EUR 905,203 - - 4,285,763 17,201,813 22,392,779
GBP 1,267,077 - 8,135,632 - 24,363,568 33,766,277
JPY 32,601 - - 1,915,266 5,667,209 7,615,076
NZD 3,935 - - - 627,859 631,794
SEK 6,265 - - - 673,779 680,044
USD 41,696 6,918,786 2,852,027 7,922,882 29,693,776 47,429,167
2,257,306 6,918,786 11,175,460 14,185,570 81,034,682 115,571,804
Smith & Williamson Mid Ocean World Investment Fund Less than
1 month Total
December 31, 2018 USD USD
AUD 372 372
CAD 605 605
EUR 387,909 387,909
GBP 76 76
HKD (101) (101)
JPY 1,136,921 1,136,921
SGD 159 159
USD 1,743,447 1,743,447
3,269,388 3,269,388
Smith & Williamson Blairmore Global Equity Fund Less than
1 month Total
December 31, 2018 USD USD
AUD 14 14
GBP 35,926 35,926
NOK 4 4
USD 1,207,332 1,207,332
1,243,276 1,243,276
Smith & Williamson Artificial Intelligence Fund Less than
1 month Total
December 31, 2018 GBP GBP
AUD 588,061 588,061
EUR 25,009 25,009
GBP 3,505,321 3,505,321
HKD 1 1
JPY 2,398,501 2,398,501
USD 2,441,522 2,441,522
8,958,415 8,958,415

Smith & Williamson Investment Funds Plc
69
Notes to the Financial Statements for the financial year ended December 31, 2018 (continued)
14. Financial Instruments and Associated risks (continued)
14.1.2 Interest rate risk (continued)
The tables below analyses all of the sub-funds’ interest bearing instruments as at December 31, 2017 into relevant
groupings based on the remaining period at the date of the Statement of Financial Position to the contractual maturity
date:
Wye Investment Fund Less than
1 month Total
December 31, 2017 GBP GBP
EUR 84 84
GBP 56,779 56,779
USD 1 1
56,864 56,864
Boulder Investment Fund Less than
1 month Total
December 31, 2017 GBP GBP
EUR 2,537 2,537
GBP 75,389 75,389
NOK 5 5
77,931 77,931
Santos Investment Fund Less than 1 year to Greater
1 month 3 years than 5 years Total
December 31, 2017 GBP GBP GBP GBP
GBP 522,053 - 2,812,902 3,334,955
522,053 - 2,812,902 3,334,955
Smith & Williamson Defensive Growth Fund Less than 1 year to 3 years to Greater
1 month 3 years 5 years than 5 years Total
December 31, 2017 GBP GBP GBP GBP GBP
GBP 1,756,381 2,696,834 1,281,381 4,643,958 10,378,554
JPY (1) - - - (1)
USD 665 - - - 665
1,757,045 2,696,834 1,281,381 4,643,958 10,379,218
Smith & Williamson Cash Fund Less than 1 month to 3 months to
1 month 3 months 12 months Total
December 31, 2017 GBP GBP GBP GBP
GBP 20,439,798 13,815,869 12,903,542 47,159,209
20,439,798 13,815,869 12,903,542 47,159,209
Smith & Williamson Short
Dated Corporate Bond Fund Less than 1 month to 3 months to 1 year to 3 years to Greater
1 month 3 months 12 months 3 years 5 years than 5 years Total
December 31, 2017 GBP GBP GBP GBP GBP GBP GBP
EUR (91,629) 89,426 - - - - (2,203)
GBP 5,524,245 11,082,196 44,445,425 63,131,340 113,167,394 10,131,871 247,482,471
USD 388,072 (331,255) - 11,599,148 100,633,162 32,777,272 145,066,399
5,820,688 10,840,367 44,445,425 74,730,488 213,800,556 42,909,143 392,546,667

Smith & Williamson Investment Funds Plc
70
Notes to the Financial Statements for the financial year ended December 31, 2018 (continued)
14. Financial Instruments and Associated risks (continued)
14.1.2 Interest rate risk (continued)
Smith & Williamson Enterprise Fund Less than 1 month to
1 month 3 months Total
December 31, 2017 GBP GBP GBP
EUR 494,425 - 494,425
GBP 19,495,437 36,987,125 56,482,562
19,989,862 36,987,125 56,976,987
Smith & Williamson Global Inflation Linked Bond
Fund Less than 3 years to Greater
1 month 5 years than 5 years Total
December 31, 2017 GBP GBP GBP GBP
AUD 5,778 153,960 393,863 553,601
CAD 1,032 107,526 1,063,369 1,171,927
EUR 39,890 2,954,574 9,636,214 12,630,678
GBP (267,640) 4,304,755 18,013,476 22,050,591
JPY 4,095 - 2,547,681 2,551,776
NZD 1,774 - 233,976 235,750
SEK 184 - 624,428 624,612
USD 6,925 8,587,004 17,226,124 25,820,053
(207,962) 16,107,819 49,739,131 65,638,988
Smith & Williamson Medium Dated Corporate Bond Fund Less than Greater
1 month than 5 years Total
December 31, 2017 GBP GBP GBP
EUR 815 - 815
GBP 13,665 2,883,477 2,897,142
USD 3,710 848,460 852,170
18,190 3,731,937 3,750,127
Smith & Williamson Mid Ocean World Investment Fund Less than
1 month Total
December 31, 2017 USD USD
AUD 126 126
CAD 3 3
EUR 935,305 935,305
GBP 495,712 495,712
USD 5,782 5,782
1,436,928 1,436,928
Smith & Williamson Blairmore Global Equity Fund Less than
1 month Total
December 31, 2017 USD USD
EUR 51,470 51,470
GBP 38,132 38,132
USD 146,321 146,321
235,923 235,923

Smith & Williamson Investment Funds Plc
71
Notes to the Financial Statements for the financial year ended December 31, 2018 (continued)
14. Financial Instruments and Associated risks (continued)
14.1.2 Interest rate risk (continued)
Smith & Williamson Artificial Intelligence Fund* Less than
1 month Total
December 31, 2017 GBP GBP
GBP 2,542,950 2,542,950
2,542,950 2,542,950
* Launched on June 23, 2017
14.1.3 Currency risk
The sub-funds may invest in securities and enter into transactions denominated in currencies other than their reporting
currency. Consequently, the sub-funds are exposed to risks that the exchange rate of their currency relative to other
currencies may change in a manner which may have a favourable or unfavourable effect on the value of that portion of
the sub-funds’ assets which are denominated in currencies other than their own currency. The sub-funds’ currency risk
is managed on a daily basis by the Investment Manager. The sub-funds’ overall currency positions and exposures are
monitored on a quarterly basis by the Board of Directors.
The currency risk is in relation to the notional exposure on the forward currency contracts held by the sub-funds. The
Manager uses forward contracts for share class hedging. These are detailed on the Schedule of Investments.
At the reporting date the sub-funds had the following currency exposures:
Wye Investment Fund
Currency
Total Exposure
GBP
2018
(%) of Net
Assets
2018
Total Exposure
GBP
2017
(%) of Net
Assets
2017
CHF 282,152 1.47 480,749 2.34
EUR 938,446 4.88 868,681 4.22
GBP 15,565,706 80.99 17,487,168 84.98
SGD 288,680 1.50 - -
USD 2,144,597 11.16 1,741,630 8.46
19,219,581 100.00 20,578,228 100.00
Boulder Investment Fund
Currency
Total Exposure
GBP
2018
(%) of Net
Assets
2018
Total Exposure
GBP
2017
(%) of Net
Assets
2017
CHF - - 400,112 1.93
DKK 437,127 2.42 977,787 4.71
EUR 2,396,299 13.26 2,525,350 12.17
GBP 7,941,273 43.94 9,439,724 45.49
NOK 5 - 5 -
USD 7,296,720 40.38 7,406,978 35.70
18,071,424 100.00 20,749,956 100.00
Santos Investment Fund
Currency
Total Exposure
GBP
2018
(%) of Net
Assets
2018
Total Exposure
GBP
2017
(%) of Net
Assets
2017
CHF 137,472 1.09 219,077 1.62
EUR 294,053 2.33 339,909 2.50
GBP 10,351,875 81.87 10,951,995 80.63
HKD 132,254 1.05 - -
USD 1,727,591 13.66 2,071,637 15.25
12,643,245 100.00 13,582,618 100.00
.

Smith & Williamson Investment Funds Plc
72
Notes to the Financial Statements for the financial year ended December 31, 2018 (continued)
14. Financial Instruments and Associated risks (continued)
14.1.3 Currency risk (continued)
Smith & Williamson Defensive Growth Fund
Currency
Total Exposure
GBP
2018
(%) of Net
Assets
2018
Total Exposure
GBP
2017
(%) of Net
Assets
2017
GBP 39,386,634 96.44 25,534,907 96.37
JPY - - 104,992 0.40
USD 1,454,655 3.56 856,935 3.23
40,841,289 100.00 26,496,834 100.00
Smith & Williamson Cash Fund
Currency
Total Exposure
GBP
2018
(%) of Net
Assets
2018
Total Exposure
GBP
2017
(%) of Net
Assets
2017
GBP 45,058,310 100.00 47,154,323 100.00
45,058,310 100.00 47,154,323 100.00
Smith & Williamson Short Dated Corporate Bond Fund
Currency
Total Exposure
GBP
2018
(%) of Net
Assets
2018
Total Exposure
GBP
2017
(%) of Net
Assets
2017
EUR 4,983,293 1.98 (2,203) -
GBP 156,114,357 62.10 246,895,992 62.99
USD 90,315,045 35.92 145,066,399 37.01
251,412,695 100.00 391,960,188 100.00
Smith & Williamson Enterprise Fund
Currency
Total Exposure
GBP
2018
(%) of Net
Assets
2018
Total Exposure
GBP
2017
(%) of Net
Assets
2017
EUR 569,371 0.44 500,193 0.37
GBP 130,152,919 99.57 136,527,156 99.70
USD (17,850) (0.01) (91,539) (0.07)
130,704,440 100.00 136,935,810 100.00
Smith & Williamson Global Inflation Linked Bond Fund
Currency
Total Exposure
GBP
2018
(%) of Net
Assets
2018
Total Exposure
GBP
2017
(%) of Net
Assets
2017
AUD 1,562,912 1.35 553,601 0.83
CAD 1,490,248 1.29 1,171,926 1.76
EUR 22,384,457 19.40 12,635,337 19.01
GBP 33,604,844 29.14 22,897,412 34.45
JPY 7,615,076 6.60 2,551,776 3.84
NZD 631,794 0.55 235,750 0.35
SEK 680,044 0.59 624,612 0.94
USD 47,393,104 41.08 25,800,204 38.82
115,362,479 100.00 66,470,618 100.00

Smith & Williamson Investment Funds Plc
73
Notes to the Financial Statements for the financial year ended December 31, 2018 (continued)
14. Financial Instruments and Associated risks (continued)
14.1.3 Currency risk (continued)
Smith & Williamson Medium Dated Corporate Bond Fund*
Currency
Total Exposure
GBP
2018
(%) of Net
Assets
2018
Total Exposure
GBP
2017
(%) of Net
Assets
2017
EUR - - 815 0.02
GBP - - 2,918,856 77.39
USD - - 852,170 22.59
- - 3,771,841 100.00
* Terminated on June 15, 2018.
Smith & Williamson Mid Ocean World Investment Fund
Currency
Total Exposure
USD
2018
(%) of Net
Assets
2018
Total Exposure
USD
2017
(%) of Net
Assets
2017
AUD 1,061,396 1.51 2,346,764 2.61
CAD 605 - 1,319,228 1.47
CHF 1,336,152 1.90 - -
EUR 6,505,215 9.27 11,331,334 12.63
GBP 4,435,650 6.33 8,070,579 9.00
HKD 2,655,286 3.79 7,170,886 7.99
JPY 6,306,900 8.99 13,295,230 14.82
KRW 732,714 1.04 1,485,676 1.66
SGD 159 - - -
USD 47,108,861 67.17 44,703,039 49.82
70,142,938 100.00 89,722,736 100.00
Smith & Williamson Blairmore Global Equity Fund
Currency
Total Exposure
USD
2018
(%) of Net
Assets
2018
Total Exposure
USD
2017
(%) of Net
Assets
2017
AUD 827,599 2.94 1,501,212 4.28
CAD 215,196 0.76 272,165 0.78
CHF - - 429,729 1.23
DKK (28) - 857,393 2.45
EUR 2,759,917 9.81 3,228,897 9.21
GBP 7,852,383 27.92 7,280,289 20.77
HKD 1,825,529 6.49 3,340,079 9.53
JPY 1,705,829 6.06 2,962,220 8.45
NOK 552,336 1.96 - -
SEK 226,370 0.80 - -
USD 12,167,317 43.26 15,172,995 43.30
28,132,448 100.00 35,044,979 100.00
Smith & Williamson Artificial Intelligence Fund*
Currency
Total Exposure
GBP
2018
(%) of Net
Assets
2018
Total Exposure
GBP
2017
(%) of Net
Assets
2017
AUD 7,291,369 5.94 1,228,918 2.82
EUR 9,141,468 7.45 3,562,640 8.18
GBP 11,560,490 9.43 5,546,155 12.73
HKD 3,280,060 2.67 854,619 1.96
JPY 12,183,134 9.93 2,708,016 6.21
USD 79,232,643 64.58 29,675,174 68.10
122,689,164 100.00 43,575,522 100.00
* Launched on June 23, 2017

Smith & Williamson Investment Funds Plc
74
Notes to the Financial Statements for the financial year ended December 31, 2018 (continued)
14. Financial Instruments and Associated risks (continued)
14.1.4 Price risk
Price risk is the risk that the value of the instrument will fluctuate as a result of changes in market prices, whether
caused by factors specific to an individual investment, its issuer or all factors affecting all instruments traded in the
market. As the majority of the Company's financial instruments are carried at fair value with fair value changes
recognised in the Statement of Comprehensive Income, all changes in market conditions will directly affect the profit
or loss.
Price risk is managed by the Company's Investment Manager by constructing a diversified portfolio of instruments
traded on various markets. A breakdown of the investment assets and liabilities held by each sub-fund are shown on
the schedule of investments on pages 91 to 126.
14.2 Liquidity risk
Liquidity risk is the risk that the Company may not be able to generate sufficient cash resources to settle its obligations
in full as they fall due or can do so only on terms that are materially disadvantageous.
The Company's constitution provides for the creation and cancellation of shares and it is therefore exposed to liquidity
risk of meeting shareholders redemptions at any time. The majority of the Company's securities are considered to be
readily realisable as they are traded on active markets. All of the Company's assets and liabilities can be realised in less
than 1 financial year. The Company's liquidity is managed on a daily basis by the Investment Manager. The
Company's overall liquidity risks are monitored on a quarterly basis by the Board of Directors.
14.3 Credit risk
Credit risk is the risk that a counterparty to a financial instrument will fail to discharge an obligation or commitment
that it has entered into with the Company. The carrying amount of financial assets as per the Statement of Financial
Position on pages 11 and 12 best represent the maximum credit risk exposure as at the Statement of Financial Position
date. Credit risk on transactions with brokers relates to transactions awaiting settlement. Risk relating to unsettled
transactions is considered small due to the short settlement period involved and the high credit quality of the broker
used. Substantially all of the assets of the Company are held by BNP Paribas Securities Services, Dublin Branch (“the
Depositary”) and Contract for Difference are held by Morgan Stanley. Bankruptcy or insolvency of the Depositary
may cause the Company's rights with respect to securities or cash held by the Depositary to be delayed or limited. The
Company manages its risk by monitoring the credit quality and financial position of the Depositary the Company uses.
The credit rating for the Depositary and Morgan Stanley as at December 31, 2018 was A and A+ (2017: A and A+)
published by Standard & Poor’s.
The Investment Manager manages issuer risk through building diversified portfolios to limit exposure to any one
issuer in accordance with the Company's investment objectives. The Company employs well known counterparties and
ensures that concentration of investment in any one stock or counterparty is monitored against set limits.
Additionally, if required, the Investment Manager will limit ownership of debt instruments to those instruments
carrying a credit rating equal to or in excess of that provided for in the Company's investment objectives. The
Investment Manager monitors compliance with these restrictions on a daily basis.
All transactions in listed securities are settled/paid upon delivery using approved brokers. The risk of default is
considered minimal as delivery of securities sold is only made once the broker has received payment. Payment is made
on a purchase once the securities have been received by the broker.
The credit ratings of all derivative counterparties are monitored regularly. The Front Office Risk Committee reviews
counterparty credit ratings and approves the use of such counterparties.
The credit rating for the Depositary as at December 31, 2018 was xxx published by Morgan Stanley.

Smith & Williamson Investment Funds Plc
75
Notes to the Financial Statements for the financial year ended December 31, 2018 (continued)
14. Financial Instruments and Associated risks (continued)
14.3 Credit risk (continued)
The below table shows the breakdown by credit rating of the bonds in the sub-funds’ portfolios by Standard & Poor’s
rating agency:
Santos Investment Fund
December 31,
2018
December 31,
2018
December 31,
2017
December 31,
2017
Gross exposure
GBP
Gross exposure as
a % of NAV
Gross exposure
GBP
Gross exposure as
a % of NAV
BB- 605,742 4.79% 633,974 4.67%
BBB- 334,691 2.65% 361,206 2.66%
Not Rated 2,231,668 17.65% 1,817,722 13.38%
Total 3,172,101 25.09% 2,812,902 20.71%
Smith & Williamson
Defensive Growth Fund
December 31,
2018
December 31,
2018
December 31,
2017
December 31,
2017
Gross exposure
GBP
Gross exposure as
a % of NAV
Gross exposure
GBP
Gross exposure as
a % of NAV
Not Rated 16,303,265 39.92% 7,842,548 29.60%
Total 16,303,265 39.92% 7,842,548 29.60%
Smith & Williamson Short
Dated Corporate Bond Fund
December 31,
2018
December 31,
2018
December 31,
2017
December 31,
2017
Gross exposure
GBP
Gross exposure as
a % of NAV
Gross exposure
GBP
Gross exposure as
a % of NAV
AAA 12,696,499 5.06% 19,578,132 4.99%
AA+ 4,267,488 1.70% 6,498,532 1.66%
AA 13,280,420 5.28% 19,593,726 5.00%
A+ 25,003,201 9.95% 68,082,205 17.37%
AA- 25,277,270 10.05% 25,859,471 6.60%
A 20,618,048 8.20% 13,082,989 3.34%
A- 28,670,565 11.40% 59,020,150 15.06%
BBB+ 61,897,876 24.62% 90,084,403 22.98%
BBB 24,523,418 9.75% 38,862,518 9.91%
Not Rated 8,020,160 3.19% 9,684,538 2.47%
Total 224,254,945 89.20% 350,346,664 89.38%

Smith & Williamson Investment Funds Plc
76
Notes to the Financial Statements for the financial year ended December 31, 2018 (continued)
14. Financial Instruments and Associated risks (continued)
14.3 Credit risk (continued)
Smith & Williamson Global
Inflation Linked Bond Fund
December 31,
2018
December 31,
2018
December 31,
2017
December 31,
2017
Gross exposure
GBP
Gross exposure as
a % of NAV
Gross exposure
GBP
Gross exposure as
a % of NAV
AAA 1,491,011 1.29% 1,170,895 1.76%
AA 5,330,016 4.62% 364,540 0.55%
AA+ 627,859 0.54% 233,976 0.35%
A- 3,769,913 3.27% 2,049,620 3.08%
BBB 4,421,076 3.83% - -
BBB+ - - 3,680,516 5.54%
Not Rated 97,674,623 84.67% 58,347,403 87.78%
Total 113,314,498 98.22% 65,846,950 99.06%
Smith & Williamson
Medium Dated
December 31,
2018
December 31,
2018
December 31,
2017
December 31,
2017
Corporate Bond Fund* Gross exposure
GBP
Gross exposure as
a % of NAV
Gross exposure
GBP
Gross exposure as
a % of NAV
A+ - - 459,089 12.17%
AAA - - 134,986 3.58%
AA- - - 282,146 7.48%
A - - 132,244 3.51%
A- - - 504,354 13.37%
BBB+ - - 1,580,588 41.90%
BBB - - 383,245 10.16%
Not Rated - - 255,285 6.77%
Total - - 3,731,937 98.94%
* Terminated on June 15, 2018.
14.4 Efficient Portfolio Management
The Company may employ investment techniques and instruments for efficient portfolio management of the assets of
the Company and, in particular, the Company may, for the purpose of hedging (whether against currency, exchange or
interest rate risks or otherwise), or for direct investment purposes, purchase or sell put options and call options, spot
contracts, forward contracts, futures contracts and other derivative instruments and may also enter into sale and
repurchase agreement.
The Company will employ a risk management process which will enable it to accurately monitor, measure and manage
the risks attached to financial derivative positions and details of this process have been provided to the Central Bank.
Subject to the conditions and within the limits otherwise stated in the investment objective and policies of the
Company, the Investment Managers may employ investment techniques and instruments such as futures, options,
forward foreign currency contracts and other derivatives for investment purposes, Hedging or efficient portfolio
management.
During the financial year the Company entered into forward currency translation and contract for difference on Smith
& Williamsons Short Dated Corporate Bond Fund (realized loss: GBP7,217,263), Smith & Williamson Enterprise
Fund (realised gain: GBP692,074, Smith & Williamson Global Inflation Linked Bond Fund (realised loss:
GBP5,167,939), Smith & Williamson Medium Dated Corporate Bond Fund (realised loss: GBP11,359) and Smith &
Williamson Mid Ocean World Investment Fund (realised gain: USD39,620) details of which can be found in note
2(m).

Smith & Williamson Investment Funds Plc
77
Notes to the Financial Statements for the financial year ended December 31, 2018 (continued)
15. Fair Value of Financial Instruments
The Company analyses investments by way of a fair value hierarchy. The hierarchy gives the highest priority to
unadjusted quoted prices in active markets for identical assets or liabilities (level 1 measurements) and the lowest
priority to unobservable inputs (level 3 measurements). The three levels of the fair value hierarchy under IFRS 7 are as
follows:
Level 1 Inputs that reflect unadjusted quoted prices in active markets for identical assets or liabilities that the
Company has the ability to access at the measurement date; Investments whose values are based on quoted
market prices in active markets, and are therefore classified within level 1, include active listed equities. The
Directors do not adjust the quoted price for such instruments, even in situations where the Directors hold a large
position and a sale could reasonably impact the quoted price.
Level 2 Inputs other than quoted prices that are observable for the asset or liability either directly or indirectly,
including inputs in markets that are not considered to be active; Investments that trade in markets that are not
considered to be active, but are valued based on quoted market prices, dealer quotations or alternative pricing
sources supported by observable inputs are classified within level 2. As level 2 investments include positions
that are not traded in active markets and/or are subject to transfer restrictions, valuations may be adjusted to
reflect illiquidity and/or non-transferability, which are generally based on available market information.
Level 3 Inputs that are unobservable. These are indicative of third party pricing.
Wye Investment Fund Financial Assets at Fair Value as of December 31, 2018
Level 1 Level 2 Level 3 Total
GBP GBP GBP GBP
Financial assets held for trading
Equities 2,985,984 - - 2,985,984
Investment Funds 16,313,246 - - 16,313,246
19,299,230 - - 19,299,230
Boulder Investment Fund Financial Assets at Fair Value as of December 31, 2018
Level 1 Level 2 Level 3 Total
GBP GBP GBP GBP
Financial assets held for trading
Equities 15,492,744 - - 15,492,744
Investment Funds 2,421,773 - - 2,421,773
17,914,517 - - 17,914,517
Santos Investment Fund Financial Assets at Fair Value as of December 31, 2018
Level 1 Level 2 Level 3 Total
GBP GBP GBP GBP
Financial assets held for trading
Bonds 3,172,101 - - 3,172,101
Equities 4,814,959 - - 4,814,959
Investment Funds 4,532,502 - - 4,532,502
12,519,562 - - 12,519,562

Smith & Williamson Investment Funds Plc
78
Notes to the Financial Statements for the financial year ended December 31, 2018 (continued)
15. Fair Value of Financial Instruments (continued)
Smith & Williamson Defensive Growth Fund Financial Assets at Fair Value as of December 31, 2018
Level 1 Level 2 Level 3 Total
GBP GBP GBP GBP
Financial assets held for trading
Bonds 16,303,265 - - 16,303,265
Equities 11,593,009 - - 11,593,009
Investment Funds 11,816,445 - - 11,816,445
39,712,719 - - 39,712,719
Smith & Williamson Short Dated Corporate
Bond Fund Financial Assets at Fair Value as of December 31, 2018
Level 1 Level 2 Level 3 Total
GBP GBP GBP GBP
Financial assets held for trading
Bonds 224,254,945 - - 224,254,945
224,254,945 - - 224,254,945
Smith & Williamson Short Dated Corporate
Bond Fund Financial Liabilities at Fair Value as of December 31, 2018
Level 1 Level 2 Level 3 Total
GBP GBP GBP GBP
Financial liabilities held for trading
Unrealised loss on forward currency contracts - 345,557 - 345,557
- 345,557 - 345,557
Smith & Williamson Enterprise Fund Financial Assets at Fair Value as of December 31, 2018
Level 1 Level 2 Level 3 Total
GBP GBP GBP GBP
Financial assets held for trading
Equities 18,551,011 - 17,000 18,568,011
Unrealised gain on forward currency contracts - 1,295 - 1,295
18,551,011 1,295 17,000 18,569,306
Smith & Williamson Enterprise Fund Financial Liabilities at Fair Value as of December 31, 2018
Level l Level 2 Level 3 Total
GBP GBP GBP GBP
Financial liabilities held For trading
Unrealised loss on contracts for difference - 259,591 - 259,591
Unrealised loss on forward currency contracts - 51,799 - 51,799
- 311,390 - 311,390

Smith & Williamson Investment Funds Plc
79
Notes to the Financial Statements for the financial year ended December 31, 2018 (continued)
15. Fair Value of Financial Instruments (continued)
Smith & Williamson Global Inflation Linked
Bond Fund Financial Assets at Fair Value as of December 31, 2018
Level 1 Level 2 Level 3 Total
GBP GBP GBP GBP
Financial assets held for trading
Bonds 113,314,498 - - 113,314,498
Unrealised gain on forward currency contracts - 127,508 - 127,508
113,314,498 127,508 - 113,442,006
Smith & Williamson Global Inflation Linked
Bond Fund Financial Liabilities at Fair Value as of December 31, 2018
Level 1 Level 2 Level 3 Total
GBP GBP GBP GBP
Financial liabilities held for trading
Unrealised loss on forward currency contracts - 280,953 - 280,953
- 280,953 - 280,953
Smith & Williamson Mid Ocean World
Investment Fund Financial Assets at Fair Value as of December 31, 2018
Level 1 Level 2 Level 3 Total
USD USD USD USD
Financial assets held for trading
Equities 64,312,979 - - 64,312,979
Investment Funds 2,735,060 - - 2,735,060
67,048,039 - - 67,048,039
Smith & Williamson Blairmore Global Equity
Fund Financial Assets at Fair Value as of December 31, 2018
Level 1 Level 2 Level 3 Total
USD USD USD USD
Financial assets held for trading
Equities 24,609,978 - 267,680 24,877,658
Investment Funds 2,029,996 - - 2,029,996
26,639,974 - 267,680 26,907,654

Smith & Williamson Investment Funds Plc
80
Notes to the Financial Statements for the financial year ended December 31, 2018 (continued)
15. Fair Value of Financial Instruments (continued)
Smith & Williamson Artificial Intelligence Financial Assets at Fair Value as of December 31, 2018
Fund Level 1 Level 2 Level 3 Total
GBP GBP GBP GBP
Financial assets held for trading
Equities 114,146,135 - - 114,146,135
114,146,135 - - 114,146,135
Wye Investment Fund Financial Assets at Fair Value as of December 31, 2017
Level 1 Level 2 Level 3 Total
GBP GBP GBP GBP
Financial assets held for trading
Equities 4,098,979 - - 4,098,979
Investment Funds 16,552,397 - - 16,552,397
20,651,376 - - 20,651,376
Boulder Investment Fund Financial Assets at Fair Value as of December 31, 2017
Level 1 Level 2 Level 3 Total
GBP GBP GBP GBP
Financial assets held for trading
Equities 17,707,554 - - 17,707,554
Investment Funds 3,014,175 - - 3,014,175
20,721,729 - - 20,721,729
Santos Investment Fund Financial Assets at Fair Value as of December 31, 2017
Level 1 Level 2 Level 3 Total
GBP GBP GBP GBP
Financial assets held for trading
Bonds 2,812,902 - - 2,812,902
Equities 5,568,904 - - 5,568,904
Investment Funds 4,729,700 - - 4,729,700
13,111,506 - - 13,111,506

Smith & Williamson Investment Funds Plc
81
Notes to the Financial Statements for the financial year ended December 31, 2018 (continued)
15. Fair Value of Financial Instruments (continued)
Smith & Williamson Defensive Growth Fund Financial Assets at Fair Value as of December 31, 2017
Level 1 Level 2 Level 3 Total
GBP GBP GBP GBP
Financial assets held for trading
Bonds 7,842,548 - - 7,842,548
Equities 8,939,092 - - 8,939,092
Investment Funds 7,940,814 - 3,270 7,944,084
24,722,454 - 3,270 24,725,724
Smith & Williamson Short Dated Corporate
Bond Fund Financial Assets at Fair Value as of December 31, 2017
Level 1 Level 2 Level 3 Total
GBP GBP GBP GBP
Financial assets held for trading
Bonds 350,346,664 - - 350,346,664
Unrealised gain on forward currency contracts - 1,773,720 - 1,773,720
350,346,664 1,773,720 - 352,120,384
Smith & Williamson Short Dated Corporate
Bond Fund Financial Liabilities at Fair Value as of December 31, 2017
Level 1 Level 2 Level 3 Total
GBP GBP GBP GBP
Financial liabilities held for trading
Unrealised loss on forward currency contracts - 331,580 - 331,580
- 331,580 - 331,580
Smith & Williamson Enterprise Fund Financial Assets at Fair Value as of December 31, 2017
Level 1 Level 2 Level 3 Total
GBP GBP GBP GBP
Financial assets held for trading
Equities
Unrealised gain on contracts for difference 26,546,250 - 17,645 26,563,895
Unrealised gain on forward currency contracts - 5,768 - 5,768
26,546,250 5,768 17,645 26,569,663
Smith & Williamson Enterprise Fund Financial Liabilities at Fair Value as of December 31, 2017
Level l Level 2 Level 3 Total
GBP GBP GBP GBP
Financial liabilities held for trading
Unrealised loss on contracts for difference - 106,531 - 106,531
Unrealised loss on forward currency contracts - 91,539 - 91,539
- 198,070 - 198,070

Smith & Williamson Investment Funds Plc
82
Notes to the Financial Statements for the financial year ended December 31, 2018 (continued)
15. Fair Value of Financial Instruments (continued)
Smith & Williamson Global Inflation Linked
Bond Fund Financial Assets at Fair Value as of December 31, 2017
Level 1 Level 2 Level 3 Total
GBP GBP GBP GBP
Financial assets held for trading
Bonds 65,846,950 - - 65,846,950
Unrealised gain on forward currency contracts - 319,269 - 319,269
65,846,950 319,269 - 66,166,219
Smith & Williamson Global Inflation Linked
Bond Fund Financial Liabilities at Fair Value as of December 31, 2017
Level 1 Level 2 Level 3 Total
GBP GBP GBP GBP
Financial liabilities held for trading
Unrealised loss on forward currency contracts - 149,736 - 149,736
- 149,736 - 149,736
Smith & Williamson Medium Dated Corporate
Bond Fund Financial Assets at Fair Value as of December 31, 2017
Level 1 Level 2 Level 3 Total
GBP GBP GBP GBP
Financial assets held for trading
Bonds 3,731,937 - - 3,731,937
Unrealised gain on forward currency contracts - 9,746 - 9,746
3,731,937 9,746 - 3,741,683
Smith & Williamson Mid Ocean World
Investment Fund Financial Assets at Fair Value as of December 31, 2017
Level 1 Level 2 Level 3 Total
USD USD USD USD
Financial assets held for trading
Equities 84,648,855 - - 84,648,855
Investment Funds 3,878,503 - - 3,878,503
88,527,358 - - 88,527,358
Smith & Williamson Blairmore Global Equity
Fund Financial Assets at Fair Value as of December 31, 2017
Level 1 Level 2 Level 3 Total
USD USD USD USD
Financial assets held for trading
Equities 31,121,701 - 268,234 31,389,935
Investment Funds 3,478,869 - 24,401 3,503,270
Rights/Warrants 1,437 - - 1,437
34,602,007 - 292,635 34,894,642
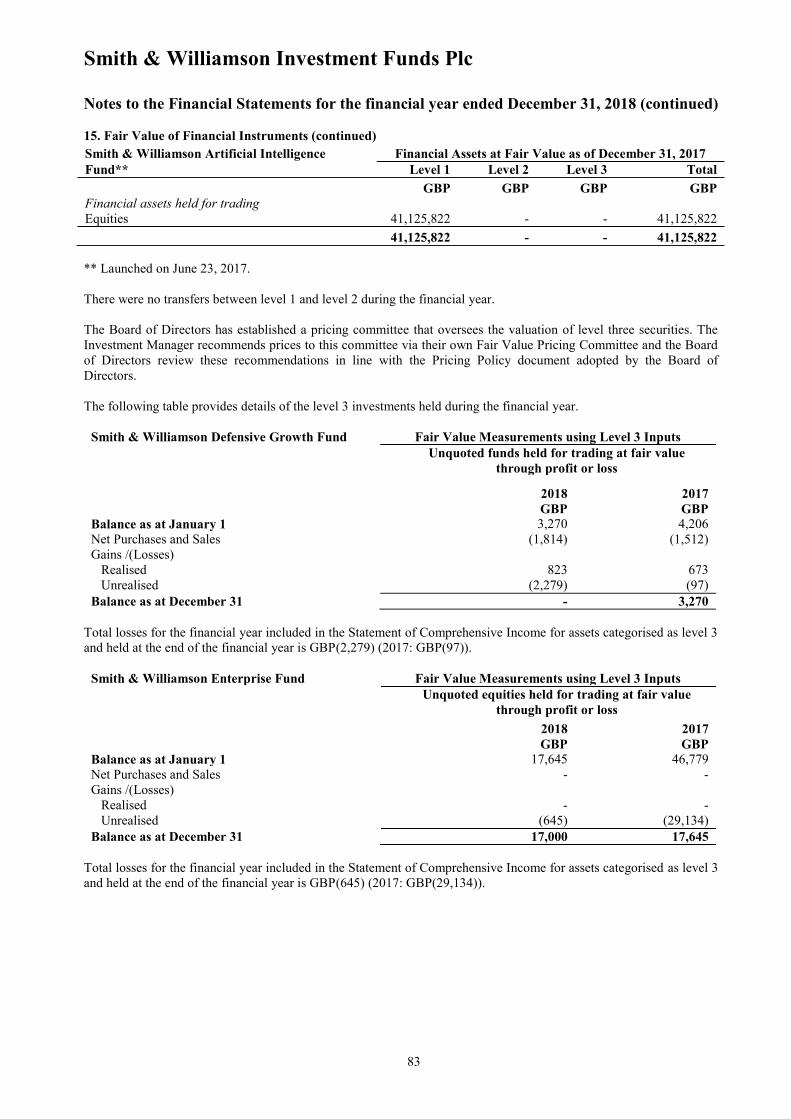
Smith & Williamson Investment Funds Plc
83
Notes to the Financial Statements for the financial year ended December 31, 2018 (continued)
15. Fair Value of Financial Instruments (continued)
Smith & Williamson Artificial Intelligence Financial Assets at Fair Value as of December 31, 2017
Fund** Level 1 Level 2 Level 3 Total
GBP GBP GBP GBP
Financial assets held for trading
Equities 41,125,822 - - 41,125,822
41,125,822 - - 41,125,822
** Launched on June 23, 2017.
There were no transfers between level 1 and level 2 during the financial year.
The Board of Directors has established a pricing committee that oversees the valuation of level three securities. The
Investment Manager recommends prices to this committee via their own Fair Value Pricing Committee and the Board
of Directors review these recommendations in line with the Pricing Policy document adopted by the Board of
Directors.
The following table provides details of the level 3 investments held during the financial year.
Smith & Williamson Defensive Growth Fund Fair Value Measurements using Level 3 Inputs
Unquoted funds held for trading at fair value
through profit or loss
2018 2017
GBP GBP
Balance as at January 1 3,270 4,206
Net Purchases and Sales (1,814) (1,512)
Gains /(Losses)
Realised 823 673
Unrealised (2,279) (97)
Balance as at December 31 - 3,270
Total losses for the financial year included in the Statement of Comprehensive Income for assets categorised as level 3
and held at the end of the financial year is GBP(2,279) (2017: GBP(97)).
Smith & Williamson Enterprise Fund Fair Value Measurements using Level 3 Inputs
Unquoted equities held for trading at fair value
through profit or loss
2018 2017
GBP GBP
Balance as at January 1 17,645 46,779
Net Purchases and Sales - -
Gains /(Losses)
Realised - -
Unrealised (645) (29,134)
Balance as at December 31 17,000 17,645
Total losses for the financial year included in the Statement of Comprehensive Income for assets categorised as level 3
and held at the end of the financial year is GBP(645) (2017: GBP(29,134)).

Smith & Williamson Investment Funds Plc
84
Notes to the Financial Statements for the financial year ended December 31, 2018 (continued)
15. Fair Value of Financial Instruments (continued)
Smith & Williamson Blairmore Global Equity Fund Fair Value Measurement using Level 3 Inputs
Unquoted equities held for trading at fair value
through profit or loss
2018 2017
USD USD
Balance as at January 1 292,635 330,082
Net Purchases and Sales - -
Gains /(Losses)
Realised - -
Unrealised (24,955) (37,447)
Balance as at December 31 267,680 292,635
Total losses for the financial year included in the Statement of Comprehensive Income for assets categorised as level 3
and held at the end of the financial year is USD(24,955) (2017: USD(37,447)).
16. Forward currency contracts and other derivatives
Derivative financial instruments are initially recognised on trade date and are measured at fair value. After initial
recognition, derivative financial instruments are measured at fair value.
The realised gain or loss and unrealised gain or loss from forward currency contracts and Contracts for Difference are
included in the Statement of Comprehensive Income within “Movement in unrealised appreciation/ depreciation on
investments at fair value through profit or loss”.
17. Exchange rates
The following exchange rates were used at the financial year end to translate foreign currency denominated assets and
liabilities:
2018 2017
£1= 1.80915 AUD £1= 1.72957 AUD
£1= 1.73951 CAD £1= 1.69493 CAD
£1= 1.25553 CHF £1= 1.31826 CHF
£1= 8.31424 DKK £1= 8.38777 DKK
£1= 1.11414 EUR £1= 1.12657 EUR
£1= 9.97176 HKD £1= 10.57517 HKD
£1= 139.73673 JPY £1= 152.39126 JPY
£1= 11.02863 NOK £1= 11.06489 NOK
£1= 1.89939 NZD £1= 1.90210 NZD
£1= 11.29185 SEK £1= 11.07588 SEK
£1= 1.73600 SGD £1= 1.35279 USD
£1= 1.27363 USD

Smith & Williamson Investment Funds Plc
85
Notes to the Financial Statements for the financial year ended December 31, 2018 (continued)
18. Distributions to holders of redeemable participating shares
The following dividends were declared and authorised on December 31, 2018 in respect of the financial year ended
December 31, 2018.
Wye Investment Fund GBP
Dividend of GBP 0.01669p per share on December 31, 2018 – Class A 199,262
Santos Investment Fund
Dividend of GBP 0.01061p per share on December 31, 2018 – Class A 85,025
Smith & Williamson Defensive Growth Fund
Dividend of GBP 0.04143p per share on December 31, 2018 – Class A 1,500
Dividend of GBP 0.00490p per share on December 31, 2018 – Class B 149,065
150,565
Smith & Williamson Cash Fund
Dividend of GBP 0.00136p per share on December 31, 2018 – Class A 61,127
Smith &Williamson Short Dated Corporate Bond Fund
Dividend of GBP 0.00556p per share on December 31, 2018 – Class A 13,665
Dividend of GBP 0.00628p per share on December 31, 2018 – Class B 253,521
Dividend of USD 0.00512c per share on December 31, 2018 – Class C 210,140
Dividend of EUR 0.00551c per share on December 31, 2018 – Class D 92,917
Dividend of GBP 0.00679p per share on December 31, 2018 – Class Z 1,297,766
Dividend of GBP 0.00654p per share on December 31, 2018 – Class Y 7
1,868,016
Smith & Williamson Global Inflation Linked Bond Fund
Dividend of USD 0.00334c per share on December 31, 2018 – Class C 3,016
Dividend of EUR 0.00375c per share on December 31, 2018 – Class D 3,314
Dividend of GBP 0.00448p per share on December 31, 2018 – Class X 471,629
Dividend of GBP 0.00326p per share on December 31, 2018 – Class Z 303
478,262
Smith & Williamson Mid Ocean World Investment Fund USD
Dividend of USD 0.90131c per share on December 31, 2018 – Class C 129,272
All distributions are declared in the currency of the share price.

Smith & Williamson Investment Funds Plc
86
Notes to the Financial Statements for the financial year ended December 31, 2018 (continued)
18. Distributions to holders of redeemable participating shares (continued)
The following dividends were declared and authorised on December 31, 2017 in respect of the financial year ended
December 31, 2017.
Wye Investment Fund GBP
Dividend of GBP 0.01834p per share on December 31, 2017 – Class A 214,693
Boulder Fund
Dividend of GBP 0.00453p per share on December 31, 2017 – Class A 43,346
Santos Investment Fund
Dividend of GBP 0.00796p per share on December 31, 2017 – Class A 63,750
Smith & Williamson Defensive Growth Fund
Dividend of GBP 0.03565p per share on December 31, 2017 – Class A 1,204
Dividend of GBP 0.35647p per share on December 31, 2017 – Class B 85,780
86,984
Smith & Williamson Cash Fund
Dividend of GBP 0.00029p per share on December 31, 2017 – Class A 13,658
Smith &Williamson Short Dated Corporate Bond Fund
Dividend of GBP 0.00571p per share on December 31, 2017 – Class A 20,481
Dividend of GBP 0.00646p per share on December 31, 2017 – Class B 664,713
Dividend of USD 0.00680c per share on December 31, 2017 – Class C 323,737
Dividend of EUR 0.00647c per share on December 31, 2017 – Class D 142,571
Dividend of GBP 0.00698p per share on December 31, 2017 – Class Z 1,736,520
Dividend of GBP 0.00696p per share on December 31, 2017 – Class Y 7
2,888,029
Smith & Williamson Global Inflation Linked Bond Fund
Dividend of GBP 0.00288p per share on December 31, 2017 – Class B Acc 167,326
Smith &Williamson Medium Dated Corporate Bond Fund
Dividend of GBP 0.00601p per share on December 31, 2017 – Class B 22,482
Smith & Williamson Mid Ocean World Investment Fund USD
Dividend of USD 0.28000c per share on December 31, 2017 – Class C 44,027
Dividend of GBP 0.00739p per share on December 31, 2017 – Class D 930
44,957
All distributions are declared in the currency of the share price.

Smith & Williamson Investment Funds Plc
87
Notes to the Financial Statements for the financial year ended December 31, 2018 (continued)
18. Distributions to holders of redeemable participating shares (continued) The following dividends were proposed and paid during the financial year ended December 31, 2018.
Wye Investment Fund GBP
Dividend of GBP 0.01798p per share on June 30, 2018 – Class A 214,466
Boulder Investment Fund
Dividend of GBP 0.00367p per share on June 30, 2018 – Class A 35,038
Santos Investment Fund
Dividend of GBP 0.01028p per share on June 30, 2018 – Class A 82,344
Smith & Williamson Defensive Growth Fund
Dividend of GBP 0.01907p per share on June 30, 2018 – Class A 736
Dividend of GBP 0.00329p per share on June 30, 2018 – Class B 74,077
74,813
Smith and Williamson Cash Fund
Dividend of GBP 0.00082p per share on June 30, 2018 – Class A 36,038
Smith & Williamson Short Dated Corporate Bond Fund
Dividend of GBP 0.00567p per share on June 30, 2018 – Class A 15,659
Dividend of GBP 0.00638p per share on June 30, 2018 – Class B 433,922
Dividend of USD 0.00643c per share on June 30, 2018 – Class C 283,890
Dividend of EUR 0.00629c per share on June 30, 2018 – Class D 140,555
Dividend of GBP 0.00689p per share on June 30, 2018 – Class Z 1,446,609
Dividend of GBP 0.00666p per share on June 30, 2018 – Class Y 7
2,320,642
Smith & Williamson Global Inflation Linked Bond Fund
Dividend of GBP 0.00337p per share on June 30, 2018 – Class Z 314
Dividend of GBP 0.00425p per share on June 30, 2018 – Class X 390,152
Dividend of EUR 0.00040c per share on June 30, 2018 – Class D 263
Dividend of USD 0.00339c per share on June 30, 2018 – Class C 108
390,837
Smith & Williamson Mid Ocean World Investment Fund USD
Dividend of USD 0.10316c per share on June 30, 2018 – Class A 4,983
Dividend of GBP 0.00042p per share on June 30, 2018 – Class B 368
Dividend of USD 1.71773c per share on June 30, 2018 – Class C 257,036
Dividend of GBP 0.00626p per share on June 30, 2018 – Class D 788
263,175
All distributions are declared in the currency of the share price.

Smith & Williamson Investment Funds Plc
88
Notes to the Financial Statements for the financial year ended December 31, 2018 (continued)
18. Distributions to holders of redeemable participating shares (continued) The following dividends were proposed and paid during the financial year ended December 31, 2017.
Wye Investment Fund GBP
Dividend of GBP 0.01763p per share on June 30, 2017 – Class A 207,353
Boulder Fund
Dividend of GBP 0.00747p per share on June 30, 2017 – Class A 68,872
Santos Investment Fund
Dividend of GBP 0.01420p per share on June 30, 2017 – Class A 116,318
Smith & Williamson Defensive Growth Fund
Dividend of GBP 0.03637p per share on June 30, 2017 – Class A 1,110
Dividend of GBP 0.00438p per share on June 30, 2017 – Class B 66,470
67,580
Smith and Williamson Cash Fund
Dividend of GBP 0.00045p per share on June 30, 2017 – Class A 21,116
Smith & Williamson Short Dated Corporate Bond Fund
Dividend of GBP 0.00570p per share on September 30, 2017 – Class A 26,320
Dividend of GBP 0.00644p per share on September 30, 2017 – Class B 688,701
Dividend of USD 0.00679c per share on September 30, 2017 – Class C 321,742
Dividend of EUR 0.00658c per share on September 30, 2017 – Class D 143,920
Dividend of GBP 0.00696p per share on September 30, 2017 – Class Z 1,852,489
Dividend of GBP 0.00688p per share on September 30, 2017 – Class Y 7
Dividend of GBP 0.00564p per share on June 30, 2017 – Class A 26,523
Dividend of GBP 0.00638p per share on June 30, 2017 – Class B 745,139
Dividend of USD 0.00667c per share on June 30, 2017 – Class C 265,096
Dividend of EUR 0.00629c per share on June 30, 2017 – Class D 136,870
Dividend of GBP 0.00691p per share on June 30, 2017 – Class Z 2,051,171
Dividend of GBP 0.00691p per share on June 30, 2017 – Class Y 7
Dividend of GBP 0.00731p per share on March 31, 2017 – Class A 36,631
Dividend of GBP 0.00800p per share on March 31, 2017 – Class B 939,050
Dividend of USD 0.00818c per share on March 31, 2017 – Class C 339,756
Dividend of EUR 0.00800c per share on March 31, 2017 – Class D 167,490
Dividend of GBP 0.00746p per share on March 31, 2017 – Class Z 2,895,800
Dividend of GBP 0.00861p per share on March 31, 2017 – Class Y 9
10,636,721
Smith & Williamson Medium Dated Corporate Bond Fund
Dividend of GBP 0.00608p per share on September 30, 2017 – Class B 23,560
Dividend of GBP 0.00597p per share on June 30, 2017 – Class B 25,005
Dividend of GBP 0.00654p per share on March 31, 2017 – Class B 29,620
78,185
Smith & Williamson Mid Ocean World Investment Fund USD
Dividend of USD 0.64562c per share on June 30, 2017 – Class A 33,728
Dividend of USD 2.00338c per share on June 30, 2017 – Class C 325,447
359,175
All distributions are declared in the currency of the share price.

Smith & Williamson Investment Funds Plc
89
Notes to the Financial Statements for the financial year ended December 31, 2018 (continued)
18. Distributions to holders of redeemable participating shares (continued) The Company declares a dividend for each sub-fund on the below basis:
Wye Investment Fund Bi-annually
Boulder Investment Fund Bi-annually
Santos Investment Fund Bi-annually
Smith & Williamson Defensive Growth Fund Bi-annually
Smith & Williamson Cash Fund Bi-annually
Smith & Williamson Mid Ocean World Investment Fund Bi-annually
Smith & Williamson Short Dated Corporate Bond Fund Quarterly
Smith & Williamson Medium Dated Corporate Bond Fund* Quarterly
Smith & Williamson Global Inflation Linked Bond Fund Quarterly
* Terminated on June 15, 2018.
The income available for distribution in respect of the Company will be determined in accordance with the terms of
the Company’s offering documents. It is the intention to pay dividends out of surplus net income, although the Articles
of Association of the Company also permit the distribution as a dividend of realised and unrealised capital gains less
realised and unrealised capital losses.
All distributions are declared in the currency of the share price.
19. Financial Derivative Instruments
The use of Financial Derivative Instruments (“FDI”) is restricted to forward foreign exchange transactions providing
passive hedging of currency share classes and contracts for difference. A non-sophisticated user of FDI approach is
being taken and hence the commitment approach is to be used. The global position exposure is calculated taking into
account the current value of the underlying assets. The commitment approach converts the sub-funds FDI positions
into equivalent positions of the underlying assets and seeks to ensure that each sub-fund is monitored in terms of any
future commitments to which it may be obliged.
20. Cross Liability
Liabilities incurred by a sub-fund of the Company may be discharged solely out of the assets of that sub-fund such that
creditors of sub-funds will not have recourse to the assets of the other sub-funds of the Company to settle any
liabilities incurred.
21. Taxation
Under current law and practice, the Company qualifies as an investment undertaking as defined in Section 739B of the
Taxes Consolidation Act, 1997, as amended. It is not chargeable to Irish tax on its income or capital gains. However,
the Company is obliged to apply a withholding tax on any distribution payments to Irish residents or ordinarily
resident shareholders on any encashment, redemption or transfer of units by an Irish resident or ordinarily resident
shareholder, unless the shareholder is exempted under Section 739D of the Taxes Consolidation Act, 1997, as
amended. Shareholders who complete a declaration confirming that they are not Irish residents are not liable to Irish
tax on the income or gains arising from their investment in the Company and no withholding tax will be deducted on
any payments made to them. Where the Company has a concession from the Revenue Commissioners it may be
possible to obtain an exemption from the requirement to have a valid non-resident declaration in place.
If the Company fails to deduct the tax or fails to collect the appropriate signed declaration from any non-resident or
exempted shareholders, the Company will remain liable for the tax. In these circumstances, the Company would seek
to recover the tax paid from the relevant shareholder.
Capital gains, dividends and interest received by the Company may be subject to withholding taxes imposed by the
country of origin and such taxes may not be recoverable by the Company or its shareholders.
Smith & Williamson Investment Funds Plc
90
Notes to the Financial Statements for the financial year ended December 31, 2018 (continued)
22. Events during the financial year
Smith &Williamson Medium Dated Corporate Bond Fund was terminated on June 15, 2018.
23. Events post financial year end
Dividends proposed as are disclosed in note 18.
There were no other post financial year events which require disclosure.
24. Soft commission arrangements
The Investment Manager has entered into soft commission arrangements for research purposes as permitted by
applicable regulation on behalf of the Fund with broker counterparties during the financial years ended December 31, 2018 and 2017.
25. Approval of the Financial Statements
The financial statements were approved and authorised for issue by the Board of Directors on April 15, 2019.

Smith & Williamson Investment Funds Plc
91
Schedule of Investments
Wye Investment Fund
As at As at
December December
Domicile
Shares/
Description
31, 2018 31, 2018
Par Value Fair Value % of Net
GBP Assets
EQUITIES
Germany (2017: 4.22%)
20,200 Deutsche Beteiligungs AG 608,279 3.16
Guernsey (2017: 2.19%)
- - -
Ireland (2017: 0.00%)
357,049 Greencoat Renewables Plc 330,083 1.72
Singapore (2017: 0.00%)
195,000 Ascendas Real Estate Investment 288,680 1.50
Switzerland (2017: 2.34%)
5,000 Pargesa Holding SA 282,152 1.47
United Kingdom (2017: 11.17%)
200,000 Martin Currie Asia Unconstra Fund 716,000 3.73
125,000 Secure Income REIT Plc 471,250 2.45
1,187,250 6.18
United States (2017: 0.00%)
3,200 Alexandria Real Estate Equity 289,540 1.51
Total Equities (2017: 19.92%) 2,985,984 15.54
INVESTMENT FUNDS
Europe (2017: 10.35%)
445,000 Blackrock Continental Europe Fund 618,105 3.22
Ireland (2017: 0.00%)
3,500 Egerton Capital Equity Fund Plc 1,096,375 5.70
340,000 Montanaro UK Income 593,300 3.09
1,689,675 8.79
Luxembourg (2017: 0.00%)
450,000 BBGI SICAV SA 699,750 3.64
4,000 Edgewood L Sl-US Sl G-I USDZ 640,215 3.33
1,339,965 6.97

Smith & Williamson Investment Funds Plc
92
Schedule of Investments
Wye Investment Fund (continued) As at As at
December December
Domicile
Shares/
Description
31, 2018 31, 2018
Par Value Fair Value % of Net
GBP Assets
INVESTMENT FUNDS (continued)
United Kingdom (2017: 49.28%)
270,000 Artemis Income Fund 585,954 3.05
240,000 Blackrock Frontiers Investment 328,200 1.71
360,000 CF Milton Multi Capital Fund 644,220 3.35
110,000 Fidelity Asian Values Plc 449,900 2.34
250,000 Fidelity China Special Situa Fund 471,500 2.45
2,100,000 Fidelity Index UK Fund 2,205,420 11.47
260,000 Fidelity Special Values Plc 592,800 3.08
550,000 Man GLG UK Underva Assets PD 718,300 3.74
43,000 NB Private Equity Partners Fund Ltd 431,290 2.24
370,000 Schroder UK Growth Fund Plc 601,250 3.13
531,818
Sequoia Economic Infrastructure
Fund 603,614 3.14
500,000 TB Wise Evenlode Inc Fund 1,031,400 5.37
80,000 Templeton Emerging Markets Fund 541,600 2.82
9,205,448 47.89
United States (2017: 20.81%)
840,000 Fidelity Index US Fund 1,433,964 7.46
520,000 Hermes US Equity Fund 1,214,839 6.32
275,000 JPM US Equity Income Fund 811,250 4.22
3,460,053 18.00
Total Investment Funds (2017: 80.44%) 16,313,246 84.87
Financial assets at fair value through profit or loss 19,299,230 100.41
Net Current Liabilities (79,649) (0.41)
Net Assets Attributable to Holders of Redeemable Participating Shares 19,219,581 100.00
% of
Total
Assets
Analysis of Total Assets
Transferable securities admitted to an official stock exchange listing or traded on a
regulated market 17,558,635 90.29
UCITS & AIF Collective Investment Schemes 1,740,595 8.95
19,299,230 99.24

Smith & Williamson Investment Funds Plc
93
Schedule of Investments
Boulder Investment Fund
As at As at
December December
Domicile
Shares/
Description
31, 2018 31, 2018
Par Value Fair Value % of Net
GBP Assets
EQUITIES
Denmark (2017: 2.37%)
- - -
Europe (2017: 2.34%)
12,200 Novo Nordisk A.S. 437,127 2.42
France (2017: 2.12%)
11,500 Accor S.A. 383,043 2.12
6,850 Danone 378,177 2.09
761,220 4.21
Germany (2017: 6.98%)
12,000 Deutsche Beteiligungs AG 361,354 2.00
6,500 Fresenius Medical Care AG & Co 330,442 1.83
5,300 SAP SE 413,527 2.29
1,105,323 6.12
Ireland (2017: 0.00%)
30,000 Experian Plc 571,500 3.16
Switzerland (2017: 4.11%)
8,052 Ferguson Plc 403,969 2.23
United Kingdom (2017: 31.73%)
22,500 Ashtead Group Plc 368,325 2.04
18,000 Asos Plc 409,860 2.27
11,250 Croda International Plc 527,063 2.91
177,000 Equiniti Group Plc 383,205 2.12
93,848 FIH Group Plc 281,544 1.56
35,000 Halma Plc 477,400 2.64
645,161 Mirriad Advertising Plc 101,613 0.56
120,500 Numis Corporation Plc 288,597 1.60
29,000 Prudential Plc 406,580 2.25
32,000 Relx Plc 517,280 2.86
145,000 Rotork Plc 359,020 1.99
120,000 Scapa Group Plc 368,400 2.04
100,000 Treatt Plc 428,000 2.37
4,916,887 27.21

Smith & Williamson Investment Funds Plc
94
Schedule of Investments
Boulder Investment Fund (continued) As at As at
December December
Domicile
Shares/
Par Value Description
31, 2018 31, 2018
Fair Value % of Net
GBP Assets
EQUITIES (continued)
United States (2017: 35.70%)
11,200 Abbott Laboratories Fund 636,051 3.52
10,500 Activision Blizzard Inc 383,929 2.12
550 Alphabet Inc 451,251 2.50
3,000 Apple Inc 371,551 2.06
20,000 Bank of America Corp 386,924 2.14
315 Booking Holdings Inc 425,996 2.36
8,600 Citigroup Inc 351,526 1.95
6,300 Danaher Corp 510,081 2.82
6,900 Eaton Corp Plc 371,970 2.06
5,600 EOG Resources Inc 383,451 2.12
3,600 Estee Lauder Companies 367,735 2.03
12,000 Hess Corp 381,585 2.11
3,650 Home Depot Inc 492,405 2.72
3,400 Mastercard Inc 503,606 2.79
5,300 Microsoft Corp 422,665 2.34
10,700 Transunion Fund 477,186 2.64
4,400 Walt Disney Co 378,806 2.10
7,296,718 40.38
Total Equities (2017: 85.35%) 15,492,744 85.73
INVESTMENT FUNDS
Asia (2017: 5.75%)
57,000
Aberdeen Asian Smaller Companies
Fund 577,125 3.19
134,000
Vietnam Enterprise Investment Fund
Ltd 612,380 3.39
1,189,505 6.58
Europe (2017: 5.89%)
5,700 Comeragh Funds ICAV* 527,207 2.92

Smith & Williamson Investment Funds Plc
95
Schedule of Investments
Boulder Investment Fund (continued)
As at As at
December December
Shares/ 31, 2018 31, 2018
Domicile Par Value Description Fair Value % of Net
GBP Assets
INVESTMENT FUNDS (continued)
United Kingdom (2017: 2.88%)
231,812 Blackrock Frontiers 226,017 1.25
254,000 Fidelity China Special Situa Fund 479,044 2.65
705,061 3.90
Total Investment Funds (2017: 14.52%) 2,421,773 13.40
Financial assets at fair value through profit or loss 17,914,517 99.13
Net Current Assets 156,907 0.87
Net Assets Attributable to Holders of Redeemable Participating Shares 18,071,424 100.00
*Valued by Smith & Williamson Fair Value Pricing Committee
% of
Total
Analysis of Total Assets Assets
Transferable securities and money market instruments admitted to an
official stock exchange listing or traded on a regulated market 17,387,310 96.08
Transferable securities and money market instruments not admitted to an
official stock exchange listing or traded on a regulated market 527,207 2.92
17,914,517 99.00

Smith & Williamson Investment Funds Plc
96
Schedule of Investments
Santos Investment Fund
As at As at
December December
Shares/
31, 2018 31, 2018
Domicile Par Value Description Fair Value % of Net
GBP Assets
BONDS
Europe (2017: 2.65%)
300,000 PGH Capital 6.625% 18/12/2025 306,461 2.42
United Kingdom (2017: 18.06%)
200,000 Bupa Finance Plc 5% 25/04/2023 213,066 1.69
190,000 Burford Capital 5% 01/12/2026 192,309 1.52
340,000 Centrica Plc 10/04/2075 FRN 334,691 2.65
300,000 Enterprise Inns 6% 06/10/2023 320,836 2.54
250,000 Sainsbury Plc 29/12/2049 FRN 262,552 2.08
300,000 Tesco Personal 5% 21/11/2020 308,968 2.44
270,000 UK Treasury 1.5% 22/07/2026 278,358 2.20
103,611
UK Treasury Gilt 1.25%
22/11/2027 136,746 1.08
310,000 UK Treasury Gilt 2% 07/09/2025 329,979 2.61
300,000 Virgin Media Sec 5% 15/04/2027 284,906 2.25
200,000
Whitbread Group 3.375%
16/10/2025 203,229 1.61
2,865,640 22.67
Total Bonds (2017: 20.71%) 3,172,101 25.09
EQUITIES
Asia (2017: 0.00%)
4,200 Tencent Holdings Ltd 132,254 1.05
Europe (2017: 3.77%)
6,500 CRH Plc 134,615 1.06
710 L’Oreal 128,217 1.01
1,800 Valeo S.A. 41,213 0.33
304,045 2.40
Ireland (2017: 0.00%)
9,300 Keywords Studios Plc 99,510 0.79
Italy (2017: 0.00%)
1,600 Ferrari NV 124,623 0.98
Switzerland (2017: 1.61%)
2,000 VAT Group AG 137,472 1.09
United Kingdom (2017: 23.99%)
100,000 Aew UK REIT Plc 89,700 0.71
3,400 Associated British Foods Plc 69,462 0.55
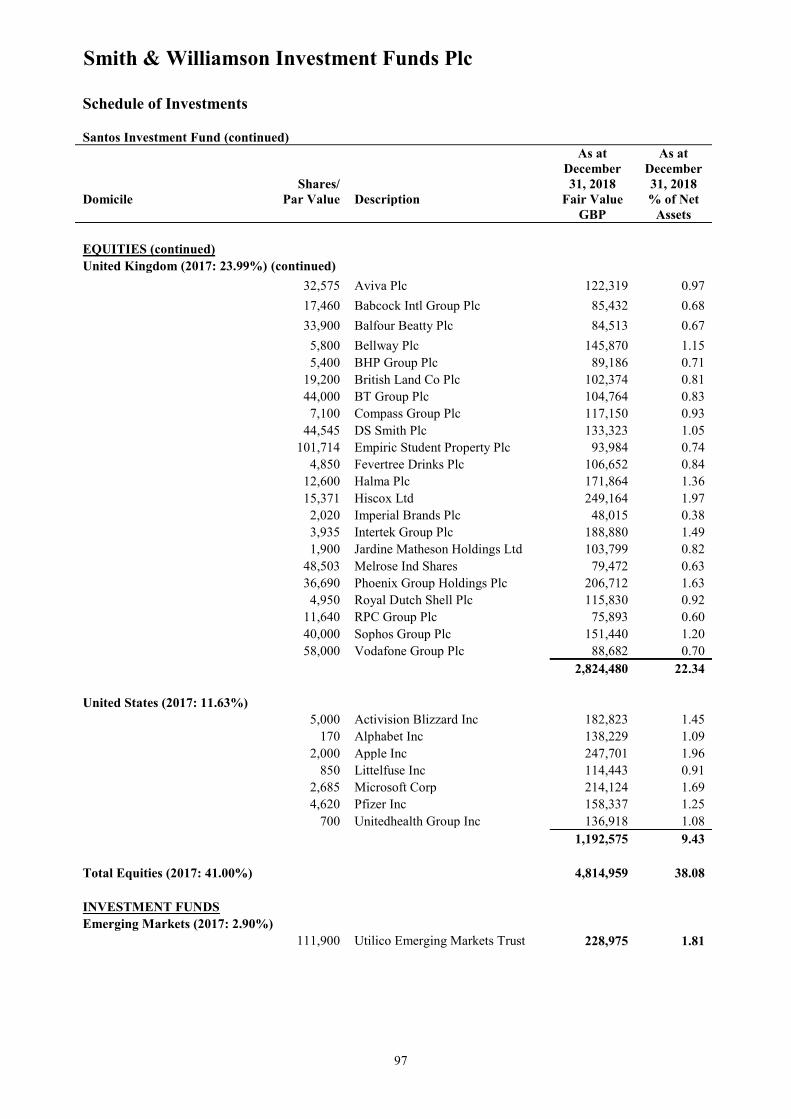
Smith & Williamson Investment Funds Plc
97
Schedule of Investments
Santos Investment Fund (continued)
As at As at
December December
Shares/ 31, 2018 31, 2018
Domicile Par Value Description Fair Value % of Net
GBP Assets
EQUITIES (continued)
United Kingdom (2017: 23.99%) (continued)
32,575 Aviva Plc 122,319 0.97
17,460 Babcock Intl Group Plc 85,432 0.68
33,900 Balfour Beatty Plc 84,513 0.67
5,800 Bellway Plc 145,870 1.15
5,400 BHP Group Plc 89,186 0.71
19,200 British Land Co Plc 102,374 0.81
44,000 BT Group Plc 104,764 0.83
7,100 Compass Group Plc 117,150 0.93
44,545 DS Smith Plc 133,323 1.05
101,714 Empiric Student Property Plc 93,984 0.74
4,850 Fevertree Drinks Plc 106,652 0.84
12,600 Halma Plc 171,864 1.36
15,371 Hiscox Ltd 249,164 1.97
2,020 Imperial Brands Plc 48,015 0.38
3,935 Intertek Group Plc 188,880 1.49
1,900 Jardine Matheson Holdings Ltd 103,799 0.82
48,503 Melrose Ind Shares 79,472 0.63
36,690 Phoenix Group Holdings Plc 206,712 1.63
4,950 Royal Dutch Shell Plc 115,830 0.92
11,640 RPC Group Plc 75,893 0.60
40,000 Sophos Group Plc 151,440 1.20
58,000 Vodafone Group Plc 88,682 0.70
2,824,480 22.34
United States (2017: 11.63%)
5,000 Activision Blizzard Inc 182,823 1.45
170 Alphabet Inc 138,229 1.09
2,000 Apple Inc 247,701 1.96
850 Littelfuse Inc 114,443 0.91
2,685 Microsoft Corp 214,124 1.69
4,620 Pfizer Inc 158,337 1.25
700 Unitedhealth Group Inc 136,918 1.08
1,192,575 9.43
Total Equities (2017: 41.00%) 4,814,959 38.08
INVESTMENT FUNDS
Emerging Markets (2017: 2.90%)
111,900 Utilico Emerging Markets Trust 228,975 1.81

Smith & Williamson Investment Funds Plc
98
Schedule of Investments
Santos Investment Fund (continued)
As at As at
December December
Shares/ 31, 2018 31, 2018
Domicile Par Value Description Fair Value % of Net
GBP Assets
INVESTMENT FUNDS (continued)
Europe (2017: 2.69%)
60,125
Blackrock European Dynamic
Fund 317,520 2.51
Far East (2017: 4.59%)
228,000 Jupiter Japan Income Fund 194,621 1.54
210,000
Smith & Williamson Far Eastern
Income & Growth Fund 335,370 2.65
529,991 4.19
Guernsey (2017: 0.77%)
7,625 BH Global Ltd Fund 113,041 0.89
Ireland (2017: 2.85%)
350,000
Smith & Williamson Artificial
Intelligence Fund 406,035 3.21
Luxembourg (2017: 0.00%)
189,000 BBGI SICAV SA 293,895 2.33
United Kingdom (2017: 18.02%)
17,372
Blackrock Gold & General Inc
Fund 143,770 1.14
3,299 CG Portfolio Fund Plc 510,975 4.04
2,220
CG Portfolio Fund Plc – Dollar
Fund 338,758 2.68
133,150
International Public Partnership
Limited Fund 203,986 1.61
114,937
NB Private Equity Partners Ltd
Fund 131,028 1.04
7,550
Pantheon International
Participations Fund 148,735 1.18
27,500 Polar Capital Technology Fund 303,600 2.40
415,000
Smith & Williamson Global
Infrastructure Link Fund 430,977 3.41
2,211,829 17.50
United States (2017: 3.00%)
5,104
Findlay Park American Smaller
Companies Fund 431,216 3.41
Total Investment Funds (2017: 34.82%) 4,532,502 35.85

Smith & Williamson Investment Funds Plc
99
Schedule of Investments
Santos Investment Fund (continued)
As at As at
December December
31, 2018 31, 2018
Fair Value % of Net
GBP Assets
Financial assets at fair value through profit or loss 12,519,562 99.02
Net Current Assets 123,683 0.98
Net Assets Attributable to Holders of Redeemable Participating Shares 12,643,245 100.00
% of Total
Assets
Analysis of Total Assets
Transferable securities admitted to an official stock exchange listing or traded on
a regulated market 11,682,550 91.63
Transferable securities not admitted to an official stock exchange listing or traded on
a regulated market 837,012 6.56
12,519,562 98.19

Smith & Williamson Investment Funds Plc
100
Schedule of Investments
Smith & Williamson Defensive Growth Fund
As at As at
December December
Shares/ 31, 2018 31, 2018
Domicile Par Value Description Fair Value % of Net
GBP Assets
BONDS
Canada (2017: 3.03%)
1,250,000 Canada Imperial Bank 0% 05/01/2026 1,250,000 3.06
650,000 Royal Bank Canada Toronto 0% 09/12/2020 801,080 1.96
2,051,080 5.02
Guernsey (2017: 2.84%)
190 APQ Global Ltd 3.50% 30/09/2024 950,000 2.33
Luxembourg (2017: 2.48%)
600,000 Natixis Structured 0% 18/01/2023 658,536 1.61
Netherland (2017: 12.21%)
700,000 JP Morgan Structure 0% 09/03/2023 743,811 1.82
1,500,000 JP Morgan Structure 0% 18/09/2023 1,432,374 3.51
1,650,000 Morgan Standly BV 0% 10/07/2024 1,498,530 3.67
1,350,000 Morgan Standly BV 0% 16/10/2024 1,182,600 2.89
4,857,315 11.89
Singapore (2017: 0.00%)
1,500,000 UBS AG Jersey Branch 0% 25/04/2024 1,317,706 3.23
Switzerland (2017: 0.00%)
1,320,000 Credit Suisse AG London 0% 01/10/2024 1,001,902 2.45
1,705,000 Credit Suisse AG London 0% 17/10/2025 1,607,115 3.94
1,350,000 UBS AG 29/09/2025 1,272,375 3.11
3,881,392 9.50
United Kingdom (2017: 9.04%)
950,000 Credit Suisse 0% 09/06/2020 1,126,319 2.76
340,000 HSBC Bank Plc 0% 26/11/2021 413,780 1.01
910,000 HSBC Bank Plc 0% 16/11/2022 1,047,137 2.57
2,587,236 6.34
Total Bonds (2017: 29.60%)
16,303,265 39.92
EQUITIES
Far East (2017: 0.40%)
-
- -
Bermuda (2017: 0.00%)
750,000 UIL Finance Ltd ZDP 2026 780,000 1.91

Smith & Williamson Investment Funds Plc
101
Schedule of Investments
Smith & Williamson Defensive Growth Fund (continued)
As at As at
December December
Shares/ 31, 2018 31, 2018
Domicile Par Value Description Fair Value % of Net
GBP Assets
EQUITIES (continued)
Guernsey (2017: 3.82%)
700,000 GLI Finance Ltd 833,000 2.04
665,219 Raven Russia 6.50% 07/07/2026 781,633 1.91
1,614,633 3.95
Jersey (2017: 3.87%)
1,000,000 EJF Investments Ltd ZDP 2022 1,090,000 2.67
United Kingdom (2017: 25.22%)
950,000 Empiric Student Property Plc 877,800 2.15
488,794 Eurovestech Plc 19,552 0.05
835,000 Impact Healthcare REIT Plc 864,225 2.12
550,000 Inland ZDP Plc 849,750 2.08
279,937 Local Shopping REIT Plc 80,622 0.20
725,000 Origo Partmers Plc 79,693 0.20
453,968 Pgit Securities 2020 Plc 528,873 1.29
725,000 Real Estate Credit Investments Fund 1,201,687 2.94
149,680 Real Estate Opportunities Fund - -
550,000 Regional REIT ZDP Plc 717,750 1.76
750,000 RM ZDP Plc 768,750 1.88
257,302 SDV 2025 ZDP Plc 280,459 0.69
500,000 Utilico Finance Ltd ZDP 2022 642,500 1.57
1,014,000 Utilico Finance Ltd ZDP 2024 1,100,190 2.69
8,011,851 19.62
United States (2017: 0.43%)
1,650,000 Dolphin Capital Investors Fund 96,525 0.24
Total Equities (2017: 33.74%)
11,593,009 28.39
INVESTMENT FUNDS
Guernsey (2017: 0.87%)
251,214 Macau Property Opportunities Fund Ltd 407,745 1.00
1,465,000 Medicx Fund Ltd 1,092,890 2.68
1,500,635 3.68
Luxembourg (2017: 0.00%)
928,275 BBGI SICAV SA 1,443,468 3.53
United Kingdom (2017: 29.11%)
380,000 Acencia Debt Strategies Ltd Fund - -
216,010 Acorn Income Fund ZDP 327,255 0.80
73,000 BH Global Fund Ltd 1,082,225 2.65

Smith & Williamson Investment Funds Plc
102
Schedule of Investments
Smith & Williamson Defensive Growth Fund (continued)
As at As at
December December
Shares/ 31, 2018 31, 2018
Domicile Par Value Description Fair Value % of Net
GBP Assets
INVESTMENT FUNDS (continued) United Kingdom (2017: 29.11%) (continued)
475,000 Duet Real Estate Finance Fund Ltd - -
3,732 FRM Credit Alpha Fund * - -
330,000 Henderson Alternative Strategies Trust 879,450 2.15
460,000 Highbridge Multi Strategy Fund Ltd 952,200 2.33
113,861 Jarf Trust 2012* - -
980,363
John Laing Environmental Assets Group
Fund Ltd 1,029,381 2.52
525,241 NB Distressed Debt Investment Fund Ltd 372,187 0.91
319,106 NB Private Equity Partners Fund Ltd 363,781 0.89
1,000,000 NB Private Equity ZDP 2024 1,040,000 2.55
1,145,606 Sequoia Economic Infrastructure Fund 1,300,263 3.18
650,000 Standard LF Globale Index Ltd 974,350 2.39
375,000 Utilico Finance Fund Ltd 551,250 1.35
8,872,342 21.72
Total Investment Funds (2017: 29.98%) 11,816,445 28.93
Financial assets at fair value through profit or loss 39,712,719 97.24
Net Current Assets
1,128,570 2.76
Net Assets Attributable to Holders of Redeemable Participating Shares 40,841,289 100.00
% of
Total
Assets
Analysis of Total Assets
Transferable securities and money market instruments admitted to an
official stock exchange listing or traded on a regulated market
35,127,460 82.78
Transferable securities and money market instruments not admitted to an
official stock exchange listing or traded on a regulated market
4,585,259 10.81
39,712,719 93.59
*Valued by Smith & Williamson Fair Value Pricing Committee

Smith & Williamson Investment Funds Plc
103
Schedule of Investments
Smith & Williamson Cash Fund
As at
December As at
31, 2018 December
Domicile
Shares/
Par Value Description
Amortised
Cost
31, 2018
% of Net
GBP Assets
MONEY MARKET INSTRUMENTS
United Kingdom (2017: 31.92%)
1,000,000 Bank of Nova Scotia 0.92% 18/04/2019 1,000,000 2.22
1,000,000 HSBC Bank Plc 0.84% 11/03/2019 1,000,432 2.22
1,000,000 ING Bank 0.8% 04/02/2019 1,000,000 2.22
1,000,000 ING Bank 0.83% 04/02/2019 1,002,485 2.23
1,000,000 Leeds Building Society 0.76% 14/01/2019 1,000,000 2.22
1,000,000 Leeds Building Society 0.86% 09/04/2019 1,000,000 2.22
1,000,000 Lloyds 0.84% 29/03/2019 1,000,000 2.22
1,000,000 Lloyds Bank Plc 0.89% 23/04/2019 1,000,000 2.22
1,000,000 Nationwide 0.77% 12/06/2019 1,000,000 2.22
1,000,000 Nordea Bank 0.82% 07/01/2019 1,000,000 2.22
1,000,000 Nordea Bank AB 0.85% 17/01/2019 1,000,065 2.22
1,000,000 Santander UK 1% 05/06/2019 1,000,000 2.22
900,000 Santander UK Plc 0.95% 17/05/2019 900,000 1.99
1,000,000 Standard Chartered 0.85% 10/01/2019 1,000,000 2.22
13,902,982 30.86
Total Money Market Instruments (2017: 31.92%) 13,902,982 30.86
CALL DEPOSITS
United Kingdom (2017: 6.43%)
2,997,263 Santander UK Plc 0.35% 2,997,263 6.65
Total Call Deposits (2017: 6.43%) 2,997,263 6.65
TERM DEPOSITS
United Kingdom (2017: 61.66%)
1,000,000 Barclays Bank London 0.83% 11/02/2019 1,000,000 2.22
1,010,792 Barclays Bank London 0.84% 27/02/2019 1,010,792 2.24
1,105,980 Barclays Bank London 0.86% 06/03/2019 1,105,980 2.45
1,000,000 Barclays Bank London 0.86% 08/03/2019 1,000,000 2.22
1,000,000 Barclays Bank London 0.95% 01/04/2019 1,000,000 2.22
1,102,780 Barclays Bank London 0.99%24/05/2019 1,102,780 2.45
1,003,423 Barclays Bank London 1.05% 19/06/2019 1,003,424 2.23
3,926,179
Coventry Building Society 0.49%
02/01/2019 3,926,179 8.71

Smith & Williamson Investment Funds Plc
104
Schedule of Investments
Smith & Williamson Cash Fund (continued)
As at
December As at
31, 2018 December
Domicile
Shares/
Par Value Description
Amortised
Cost
31, 2018
% of Net
GBP Assets
TERM DEPOSITS (continued)
United Kingdom (2017: 61.66%) (continued)
1,183,013
Coventry Building Society 0.51%
03/01/2019 1,183,013 2.62
1,584,470
Coventry Building Society 0.51%
04/01/2019 1,584,470 3.52
1,002,055 Leeds Building Society 0.85% 15/03/2019 1,002,055 2.22
1,203,038 Leeds Building Society 0.86% 22/03/2019 1,203,038 2.67
2,381,666 Lloyds Bank Plc 0.60% 02/01/2019 2,381,666 5.28
1,255,733 Lloyds Bank Plc 0.60% 07/01/2019 1,255,733 2.79
1,293,523 Lloyds Bank Plc 0.85% 16/01/2019 1,293,523 2.87
1,104,340 Lloyds Bank Plc 0.85% 29/03/2019 1,104,340 2.45
1,000,000
National Bank of Canada 0.60%
04/01/2019 1,000,000 2.22
1,003,358
National Bank of Canada 0.65%
21/01/2019 1,003,358 2.23
1,000,134
National Bank of Canada 0.70%
21/01/2019 1,000,134 2.22
1,004,340
Santander Central Hispano 0.86%
15/03/2019 1,004,340 2.23
1,004,476
Santander Central Hispano 0.88%
30/01/2019 1,004,476 2.23
1,003,384
Santander Central Hispano 0.94%
26/06/2019 1,003,384 2.23
Total Term Deposits (2017: 61.66%) 28,172,685 62.52
Total loans & receivables 45,072,930 100.03
Net Current Liabilities
(14,620) (0.03)
Net Assets Attributable to Holders of Redeemable Participating Shares 45,058,310 100.00
% of Total
Analysis of Total Assets
Assets
Money market instruments not admitted to an official stock exchange listing 13,902,982 30.79
Call deposits
2,997,263 6.64
Term deposits
28,172,685 62.40
45,072,930 99.83

Smith & Williamson Investment Funds Plc
105
Schedule of Investments
Smith & Williamson Short Dated Corporate Bond Fund
As at As at
December December
Shares/ 31, 2018 31, 2018
Domicile Par Value Description Fair Value % of Net
GBP Assets
MONEY MARKET INSTRUMENTS United Kingdom (2017: 8.91%)
2,000,000 UK Treasury Bill 0% 01/04/2019 1,996,510 0.79
7,000,000 UK Treasury Bill 0% 04/02/2019 6,995,940 2.78
2,000,000 UK Treasury Bill 0% 21/01/2019 1,999,320 0.79
4,500,000 UK Treasury Bill 0% 25/02/2019 4,495,747 1.79
8,500,000 UK Treasury Bill 0% 25/03/2019 8,486,613 3.38
23,974,130 9.53
Total Money Market Instruments (2017: 8.91%) 23,974,130 9.53
BONDS
Europe (2017: 18.40%)
4,400,000 BMW Finance N.V. 0.875% 16/08/2022 4,234,589 1.68
3,800,000 E.O.N Internationl BV 6% 30/10/2019 3,937,066 1.57
3,700,000 France Telecom 7.25% 10/11/2020 4,078,936 1.62
3,700,000 GDF Suez 6.125% 11/02/2021 4,058,785 1.62
3,700,000 Glencore Finance 6% 03/04/2022 4,081,518 1.62
4,300,000 Henkel AG & Co 0.875% 13/09/2022 4,208,091 1.67
5,125,000 Sanofi 4% 29/03/2021 4,116,725 1.64
1,800,000
Shell International Finance 2.375%
21/08/2022 1,378,534 0.55
5,400,000 Siemens Finance 2.9% 27/05/2022 4,164,715 1.66
5,400,000 Statoil A.S.A. 3.15% 23/01/2022 4,230,381 1.68
4,050,000
Total Capital International 2.25%
09/06/2022 4,149,722 1.65
1,800,000 WPP Finance 6.375% 06/11/2020 1,946,682 0.77
44,585,744 17.73
United Kingdom (2017: 39.04%)
1,000,000 AstraZeneca Plc 0.25% 12/05/2021 897,505 0.36
4,500,000 AstraZeneca Plc 2.375% 12/06/2022 3,391,916 1.35
3,150,000 Bat International Finance 6% 29/06/2022 3,529,492 1.40
440,000
Bat International Finance 7.25%
12/03/2024 534,988 0.21
3,628,000 BG Energy Capital 4% 15/10/2021 2,889,591 1.15
3,220,000 BP Capital Market Plc 3.245% 06/05/2022 2,507,460 1.00
1,800,000 BP Capital Market Plc 1.177% 12/08/2023 1,751,980 0.70

Smith & Williamson Investment Funds Plc
106
Schedule of Investments
Smith & Williamson Short Dated Corporate Bond Fund (continued)
As at As at
December December
Shares/ 31, 2018 31, 2018
Domicile Par Value Description Fair Value % of Net
GBP Assets
BONDS (continued)
United Kingdom (2017: 39.04%) (continued)
4,000,000
British Sky Broadcasting 2.875%
24/11/2020 4,091,964 1.63
3,700,000 British Telecom Plc 8.625% 26/03/2020 4,011,562 1.60
4,000,000 Deutsche Bahn Finance 2.75% 20/06/2022 4,169,681 1.66
3,550,000
Deutsche Telecom Finance 6.5%
08/04/2022 4,068,233 1.62
2,000,000 Diageo Finance Plc 0.25% 22/10/2021 1,799,033 0.72
2,200,000 Experian Finance 3.5% 15/10/2021 2,303,623 0.92
1,600,000 Experian Finance 4.75% 04/02/2020 1,511,323 0.60
4,300,000 Hiscox Ltd 2% 14/12/2022 4,205,478 1.67
800,000
Imperial Tobacco Finance 8.125%
15/03/2024 998,964 0.40
2,450,000 Imperial Tobacco Finance 9% 17/02/2022 2,928,787 1.16
3,900,000 John Lewis Plc 8.375% 08/04/2019 3,959,418 1.57
3,450,000 Linde Finance BV 5.875% 24/04/2023 4,073,168 1.62
4,300,000 National Grid Gas 1.125% 22/09/2021 4,241,632 1.69
3,900,000 Next Plc 5.375% 26/10/2021 4,229,816 1.68
3,369,000 Prudential Plc 1.375% 19/01/2018 4,060,742 1.61
5,200,000
Reckitt Benckiser Treasury 2.375%
24/06/2022 3,923,334 1.56
4,000,000 Reed Elsv Invest 2.75% 01/08/2019 4,014,060 1.60
4,000,000 Rolls-Royce Plc 6.75% 30/04/2019 4,065,440 1.62
2,682,000 Scott & Energy 5.875% 22/09/2022 3,057,980 1.22
1,000,000 Scottish & South 4.25% 4/09/2021 1,066,285 0.42
3,450,000 Severn Trent Financial 6.125% 26/02/2024 4,085,129 1.62
600,000 Unilever NV 0% 31/07/2021 537,207 0.21
3,600,000 United Utilities Water 5.75% 25/03/2022 4,065,383 1.62
3,800,000 Welcome Trust 4.75% 28/05/2021 4,106,576 1.63
3,051,000 WPP Finance 2010 3.625% 07/09/2022 2,331,467 0.93
97,409,217 38.75
United States (2017: 31.94%)
2,400,000 Anheuser-Busch 3.3% 01/02/2023 1,833,994 0.73
3,150,000 Anheuser-Busch 3.7% 01/02/2024 2,426,458 0.96
2,500,000 Apple Inc 2.4% 03/05/2023 1,899,136 0.75
3,000,000 Apple Inc 3.45% 06/05/2024 2,368,351 0.94
3,800,000 AT&T Inc 2.85% 14/02/2023 2,967,916 1.18
1,500,000 AT&T Inc 3.9% 11/03/2024 1,171,158 0.47
5,100,000 BHP Finance USA 2.875% 24/02/2022 3,975,777 1.58
3,400,000 CK Hutchison Int 2.875% 05/04/2022 2,621,864 1.04
3,200,000
Diageo Investment Corp 2.875%
11/05/2022 2,489,192 0.99

Smith & Williamson Investment Funds Plc
107
Schedule of Investments
Smith & Williamson Short Dated Corporate Bond Fund (continued)
As at As at
December December
Shares/ 31, 2018 31, 2018
Domicile Par Value Description Fair Value % of Net
GBP Assets
BONDS (continued)
United States (2017: 31.94%) (continued)
5,300,000 GlaxoSmithKline 3.375% 15/05/2023 4,179,710 1.66
3,200,000 Heineken N.V. 2.75% 01/04/2023 2,438,975 0.97
2,200,000 Heineken N.V. 3.4% 01/04/2022 1,731,573 0.69
2,000,000 Hutchinson Whampoa 3.25% 08/11/2022 1,558,547 0.62
3,999,000 IBM Corp 2.625% 05/08/2022 4,136,178 1.64
3,800,000 McDonalds Corp 6.375% 03/02/2020 3,996,998 1.59
3,100,000 Microsoft Corp 2% 08/08/2023 2,405,563 0.96
2,600,000 Microsoft Corp 2.375% 12/02/2022 1,964,014 0.78
4,100,000 Nestle Holdings 1.75% 09/12/2020 4,136,762 1.64
3,000,000 Novartis Capital 2.4% 21/09/2022 2,302,033 0.92
2,400,000 Novartis Capital 4.4% 24/04/2020 1,925,593 0.77
2,300,000 Pfizer Inc 3% 15/06/2023 1,799,252 0.72
2,700,000 Pfizer Inc 5.8% 12/08/2023 2,354,628 0.94
200,000 Reed Elsevr Capital 3.125% 15/10/2022 154,321 0.06
5,400,000 Roche Holdings Inc 2.875% 29/09/2021 4,216,087 1.68
3,800,000
Temasek Financial I Ltd 4.625%
26/07/2022 4,220,347 1.68
4,350,000 Toyota Motor Credit 1% 27/09/2022 4,244,695 1.69
2,650,000 Unilever Capital 1.375% 28/07/2021 1,994,656 0.79
2,200,000 Unilever Capital 2.2% 05/05/2022 1,669,433 0.66
2,100,000
Verizon Communications Inc 5.15%
15/09/2023 1,756,769 0.70
3,000,000
Verizon Communications Inc 4.15%
15/03/2024 2,408,683 0.96
1,000,000 Walmart Inc 3.4% 26/06/2023 793,729 0.32
5,500,000 Walt Disney Co 2.125% 13/09/2022 4,117,592 1.64
82,259,984 32.72
Total Bonds (2017: 89.38%)
224,254,945 89.20

Smith & Williamson Investment Funds Plc
108
Schedule of Investments
Smith & Williamson Short Dated Corporate Bond Fund (continued)
Unrealised
gain/(loss) % of Net
GBP Assets
FORWARDS
Maturity Date Counterparty Amount Bought Amount Sold
17/01/2019 BNP Paribas GBP 4,732,038 EUR 5,270,000 (595) -
17/01/2019 BNP Paribas USD 450,000 GBP 358,223 (5,226) -
17/01/2019 BNP Paribas USD 1,300,000 GBP 1,034,011 (14,244) (0.01)
17/01/2019 BNP Paribas GBP 91,929,781 USD 117,250,000 (45,329) (0.02)
24/01/2019 BNP Paribas USD 40,000 GBP 31,582 (217) -
24/01/2019 BNP Paribas EUR 225,000 GBP 203,190 (1,088) -
24/01/2019 BNP Paribas EUR 13,458,000 GBP 12,116,533 (28,141) (0.01)
24/01/2019 BNP Paribas USD 36,100,000 GBP 28,558,093 (250,717) (0.10)
Unrealised loss on forward foreign exchange contracts
(345,557) (0.14)
Financial assets at fair value through profit or loss and loans and receivables 248,229,075 98.73
Financial liabilities at fair value through profit or loss
(345,557) (0.14)
Net Current Assets
3,529,177 1.40
Net Assets Attributable to Holders of Redeemable Participating Shares 251,412,695 100.00
% of Total
Analysis of Total Assets
Assets
Transferable securities and money market instruments admitted to an official stock
exchange listing or traded on a regulated market
248,229,075 96.98
OTC financial derivative instruments
(345,557) (0.14)
247,883,518 96.84

Smith & Williamson Investment Funds Plc
109
Schedule of Investments
Smith & Williamson Enterprise Fund
As at As at
Shares/ December December
Domicile Par Value Description 31, 2018 31, 2018
Fair Value % of Net
GBP Assets
EQUITIES
Jersey (2017: 2.17%)
- - - -
Luxembourg (2017: 1.57%)
- - - -
United Kingdom (2017: 15.41%)
175,000 Ashtead Group Plc 2,864,750 2.19
800,000 Cineworld Group Plc 2,105,600 1.61
58,620 Claremont 17,000 0.01
691,198 CMC Markets Plc 727,140 0.56
2,125,000 Coats Group Plc 1,731,875 1.32
1,000,000 Ei Group Plc 1,816,000 1.39
575,000 Entertainment One Ltd 2,050,450 1.57
850,000 Fairfx Group Plc 1,015,750 0.78
220,000 Global Ports Holding Plc 874,500 0.67
259,393 Gym Group Plc 708,143 0.54
4,073,077 Ironveld Plc 71,279 0.05
286,000 Phoenix Group Holdings Plc 1,611,324 1.23
170,000 Riverstone Energy Ltd 1,829,200 1.40
500,000 Yellow Cake Plc 1,145,000 0.88
18,568,011 14.20
United States (2017: 0.25%) - - - -
Total Equities (2017: 19.40%)
18,568,011 14.20
MONEY MARKET INSTRUMENTS United Kingdom (2017: 27.01%)
14,000,000 UK Treasury Bill 0% 11/02/2019 13,990,550 10.71
23,000,000 UK Treasury Bill 0% 18/02/2019 22,981,485 17.58
36,972,035 28.29
Total Money Market Instruments (2017: 27.01%) 36,972,035 28.29

Smith & Williamson Investment Funds Plc
110
Schedule of Investments
Smith & Williamson Enterprise Fund (continued)
As at As at
December December
Shares/ 31, 2018 31, 2018
Domicile Par Value Description Fair Value % of Net
GBP Assets
TERM DEPOSITS
United Kingdom (2017: 38:85%)
6,400,000
Coventry Building Society 0.51%
02/01/2019 6,400,000 4.89
10,035,191
Coventry Building Society 0.67%
08/02/2019 10,035,191 7.68
6,021,586 Lloyds Bank Plc 0.79% 08/01/2019 6,021,587 4.61
20,127,971 Lloyds Bank Plc 0.85% 12/03/2019 20,127,971 15.40
10,013,151
Nationwide Anglia Building 0.67%
03/01/2019 10,013,151 7.66
10,034,679
Santander Central Hispano 0.88%
18/03/2019 10,034,679 7.68
62,632,579 47.92
Total Term Deposits (2017: 38.85%)
62,632,579 47.92
Unrealised % of Net
FORWARDS
gain/(loss) Assets
Maturity Date Counterparty Amount Bought Amount Sold GBP
15/01/2019 BNP Paribas GBP 92,607 EUR 102,870 232 -
15/01/2019 BNP Paribas GBP 275,819 USD 350,223 1,063 -
Unrealised gain on forward foreign exchange contracts 1,295 -
Maturity Date Counterparty Amount Bought Amount Sold
15/01/2019 BNP Paribas USD 1,579,831 GBP 1,245,275 (5,864) (0.01)
15/01/2019 BNP Paribas USD 11,462,058 GBP 9,036,912 (44,686) (0.03)
15/01/2019 BNP Paribas USD 27,418 GBP 21,620 (110) -
15/01/2019 BNP Paribas USD 78,749 GBP 61,912 (132) -
15/01/2019 BNP Paribas EUR 598,123 GBP 538,107 (1,007) -
Unrealised loss on forward foreign exchange contracts (51,799) (0.04)

Smith & Williamson Investment Funds Plc
111
Schedule of Investments
Smith & Williamson Enterprise Fund (continued)
As at As at
December December
31, 2018 31, 2018
Unrealised
gain /(loss) % of Net
GBP Assets
CONTRACTS FOR DIFFERENCE (2017: 0.08%)
Number of
Counterparty Contracts Stock Name
Morgan Stanley 375,000 3I Group Plc 30/04/2053 (82,500) (0.06)
Morgan Stanley (170,000) Aggreko Plc 29/05/2059 (19,040) (0.01)
Morgan Stanley (33,000) Asos Plc 10/01/2068 (20,130) (0.02)
Morgan Stanley 675,000 Balfour Beatty Plc 31/12/2049 18,900 0.01
Morgan Stanley 375,000 Barratt Developments Plc 31/12/2049 13,875 0.01
Morgan Stanley 800,000 Boohoo.Com Plc 27/01/2062 31,200 0.02
Morgan Stanley 500,000 BP Plc 31/12/2050 (33,750) (0.03)
Morgan Stanley 1,000,000 BT Group Plc 31/12/2049 (2,500) -
Morgan Stanley (135,000) Burberry Group Plc 31/12/2049 (21,600) (0.02)
Morgan Stanley (550,000) Capital & Counties Propertie 07/02/2057 2,200 -
Morgan Stanley 145,000 Coca-Cola HBC AG 24/09/2058 8,700 0.01
Morgan Stanley (130,000) Compass Group Plc 27/06/2062 (10,400) (0.01)
Morgan Stanley (600,000) Countryside Properties Plc 28/02/2062 (22,800) (0.02)
Morgan Stanley 80,000 CRH Plc 03/02/2057 (7,200) (0.01)
Morgan Stanley (100,000) Daily Mail & General Trust -A 31/12/2068 11,000 0.01
Morgan Stanley 105,000 Diageo Plc 31/12/2050 7,875 0.01
Morgan Stanley (130,000) Dominos Pizza Group Plc 28/06/2061 130 -
Morgan Stanley 165,000 Easyjet Plc 21/03/2057 (10,725) (0.01)
Morgan Stanley 200,000 Grafton Group Plc-UTS 31/03/2060 (6,000) -
Morgan Stanley (300,000) Greene King 28/07/2056 (39,000) (0.03)
Morgan Stanley (140,000) Hargreaves Lansdown Plc 09/01/2054 (28,700) (0.02)
Morgan Stanley (50,000) Hiscox Ltd 09/10/2062 (10,500) (0.01)
Morgan Stanley (200,000) HSBC Holdings 03/04/2051 6,600 0.01
Morgan Stanley (65,000) Intercontinental Hotels Group 08/05/2062 (60,450) (0.05)
Morgan Stanley 210,000 Intermediate Capital Group 02/05/2062 (3,150) -
Morgan Stanley 600,000
JD Sports FSN Registered Shares
29/11/2061 57,600 0.04
Morgan Stanley (550,000) Jupiter Fund Management 14/01/2054 (6,050) -
Morgan Stanley (1,000,000) Kingfisher Plc 31/12/2050 10,000 0.01
Morgan Stanley (750,000) Marks & Spencer Group Plc 21/03/2068 (750) -
Morgan Stanley (400,000) Mediclinic International Plc 17/11/2061 9,200 0.01
Morgan Stanley 1,570,000 Melrose Industries Shares 29/01/2061 25,905 0.02
Morgan Stanley 80,000 NMC Health Plc 17/07/2060 22,400 0.02
Morgan Stanley (30,000) Paddy Power Betfair Plc 03/02/2061 (10,500) (0.01)
Morgan Stanley (300,000) Pearson Plc 31/12/2053 (1,800) -
Morgan Stanley 750,000 Premier Oil Plc 18/07/2053 42,375 0.03
Morgan Stanley (600,000) Rightmove Plc 31/08/2063 (25,200) (0.02)
Morgan Stanley 75,000 Rio Tinto Plc 02/01/2050 (24,375) (0.02)

Smith & Williamson Investment Funds Plc
112
Schedule of Investments
Smith & Williamson Enterprise Fund (continued)
As at As at
December December
31, 2018 31, 2018
Unrealised
gain /(loss) % of Net
GBP Assets
CONTRACTS FOR DIFFERENCE (2017: 0.08%) (continued)
Number of
Counterparty Contracts Stock Name
Morgan Stanley (575,000) Rotork Shares 19/05/2060 15,525 0.01
Morgan Stanley (200,000) Ryanair Holdings Plc 29/10/2060 (21,541) (0.02)
Morgan Stanley (300,000) Sage Group Plc 10/06/2058 11,400 0.01
Morgan Stanley (140,000) Smith & Nephew Plc 23/05/2053 (18,900) (0.01)
Morgan Stanley (200,000) Smiths Group Plc 22/08/2053 21,000 0.02
Morgan Stanley 1,750,000 Tesco Plc 25/01/2068 (35,000) (0.03)
Morgan Stanley (127,000) Travis Perkins Plc 31/12/2068 (24,765) (0.02)
Morgan Stanley 220,000 TUI AG-Di 23/12/2059 4,400 -
Morgan Stanley 70,000 Unilever Plc 22/05/2066 (11,550) (0.01)
Morgan Stanley (300,000) United Utilities Group Plc 04/09/2053 9,600 0.01
Morgan Stanley 1,600,000 Vodafone Group Shares 24/02/2059 (26,880) (0.02)
Morgan Stanley 825,000 William Hill Plc 25/08/2053 (26,400) (0.02)
Morgan Stanley (220,000) Wood Group (John) Plc 08/07/2056 9,240 0.01
Morgan Stanley (210,000) WPP Plc 15/04/2058 13,440 0.01
Total Contracts for Difference (2017: 0.08%) (259,591) (0.20)
Total Financial assets at fair value through profit & loss and loans and
receivables 118,173,920 90.41
Total Financial liabilities at fair value through profit & loss (311,390) (0.24)
Net Current Assets 12,841,910 9.83
Net Assets Attributable to Holders of Redeemable Participating Shares 130,704,440 100.00
% of Total
Analysis of Total Assets
Assets
Transferable securities and money market instruments admitted to an official stock exchange
listing or traded on a regulated market 18,551,011 14.08
Transferable securities and money market instruments not admitted to an official stock
exchange listing or traded on a regulated market 17,000 0.02
Money market instruments not admitted to an official stock exchange listing 36,972,035 28.05
Term deposits 62,632,579 47.52
Contracts for difference (259,591) (0.20)
OTC financial derivative instruments (50,504) (0.04)
117,862,530 89.43

Smith & Williamson Investment Funds Plc
113
Schedule of Investments
Smith & Williamson Global Inflation Linked Bond Fund
As at As at
December December
Shares/ 31, 2018 31, 2018
Domicile Par Value Description Fair Value % of Net
GBP Assets
BONDS
Australia (2017: 0.82%)
96,000 Australian Government Bonds 1.25% 21/02/2022 61,659 0.05
225,000 Australian Government Bonds 1.25% 21/08/2040 141,233 0.12
500,000 Australian Government Bonds 2% 21/08/2035 361,732 0.32
500,000 Australian Government Bonds 2.5% 20/09/2030 395,708 0.34
300,000 Australian Government Bonds 3% 20/09/2025 234,210 0.20
85,000 Australian Government Bonds 4% 20/08/2020 85,061 0.08
500,000 Australian Government Bonds 0.75% 21/11/2027 285,524 0.25
1,565,127 1.36
Canada (2017: 1.76%)
318,978 Canada Government Bonds 1.5% 01/12/2044 216,122 0.19
234,771 Canada Government Bonds 4% 01/12/2031 191,130 0.17
161,401 Canada Government Bonds 4.25% 01/12/2021 102,740 0.09
648,865 Canada Government Bonds 4.25% 01/12/2026 479,582 0.41
299,082 Canada Government Bonds1.25% 01/12/2047 194,719 0.17
421,967 Canada Government Bonds 2% 01/12/2041 306,718 0.26
1,491,011 1.29
France (2017: 11.10%)
511,900 France Treasury Bill 0.1% 25/07/2036 477,329 0.41
1,526,581 France Treasury Bill 0.10% 01/03/2025 1,428,412 1.24
1,229,568 France Treasury Bill 0.10% 01/03/2028 1,150,320 1.00
342,830 France Treasury Bill 0.10% 25/07/2047 317,585 0.27
1,057,400 France Treasury Bill 0.25% 25/07/2024 1,014,606 0.88
556,365 France Treasury Bill 1.85% 25/07/2027 608,776 0.53
1,286,940 France Treasury Bill 3.15% 25/07/2032 1,707,505 1.48
6,704,533 5.81
Germany (2017: 2.05%)
343,493 Germany Government Bonds 0.1% 15/04/2046 379,416 0.33
1,077,800 Germany Government Bonds 0.10% 15/04/2023 1,020,326 0.89
1,049,010 Germany Government Bonds 0.10% 15/04/2026 1,020,749 0.88
1,472,520 Germany Government Bonds 0.50% 15/04/2030 1,529,934 1.33
3,950,425 3.43
Italy (2017: 4.06%)
922,392 Italy Government Bonds 0.1% 15/05/2023 792,368 0.69
1,263,015 Italy Government Bonds 2.35% 5/09/2035 1,205,026 1.04
497,614 Italy Government Bonds 2.55% 15/09/2041 475,861 0.41

Smith & Williamson Investment Funds Plc
114
Schedule of Investments
Smith & Williamson Global Inflation Linked Bond Fund (continued)
As at As at
December December
Shares/ 31, 2018 31, 2018
Domicile Par Value Description Fair Value % of Net
GBP Assets
BONDS (continued) Italy (2017: 4.06%) (continued)
1,049,320 Italy Government Bonds 0.10% 15/05/2022 917,920 0.80
1,559,280 Italy Government Bonds 1.30% 15/05/2028 1,340,137 1.16
1,046,070 Italy Government Bonds 2.35% 15/09/2024 991,563 0.86
1,128,971 Italy Government Bonds 2.60% 15/09/2023 1,081,787 0.94
6,804,662 5.90
Japan (2017: 3.83%)
260,250,000
Japan Government Ten Year Bonds 0.10%
10/03/2024 1,908,060 1.65
253,527,500
Japan Government Ten Year Bonds 0.10%
10/03/2026 1,874,498 1.63
262,000,000
Japan Government Ten Year Bonds 0.10%
10/09/2023 1,915,266 1.66
254,265,000
Japan Government Ten Year Bonds 0.1%
10/03/2027 1,884,651 1.63
7,582,475 6.57
New Zealand (2017: 0.35%)
1,000,000 New Zealand Government Bonds 2.50% 20/09/2035 627,859 0.54
Spain (2017: 1.74%)
1,039,460 Spain Government Bonds 1% 30/11/2030 992,957 0.86
1,563,465 Spain Government Bonds 1.80% 30/11/2024 1,587,259 1.38
511,110 Spain Government Bonds 0.15% 30/11/2023 473,362 0.41
1,037,460 Spain Government Bonds 0.65% 30/11/2027 974,378 0.84
4,027,956 3.49
Sweden (2017: 0.94%)
500,000 Sweden Inflation Linked Bonds 0.125% 01/06/2032 55,216 0.05
1,285,000 Sweden Inflation Linked Bonds 0.125% 01/06/2026 136,264 0.12
2,000,000 Sweden Inflation Linked Bonds 1% 01/06/2025 220,827 0.19
1,500,000 Sweden Inflation Linked Bonds 3.5% 01/12/2028 261,472 0.22
673,779 0.58
United Kingdom (2017: 33.58%)
2,056,000 Anglian Water Services Finance 28/07/2020 3,769,913 3.27
2,100,000 British Telecom Plc 25/04/2025 4,421,076 3.83
3,461,600 National Grid Plc Gilt FRN 06/10/2021 4,365,720 3.78

Smith & Williamson Investment Funds Plc
115
Schedule of Investments
Smith & Williamson Global Inflation Linked Bond Fund (continued)
As at As at
December December
Shares/ 31, 2018 31, 2018
Domicile Par Value Description Fair Value % of Net
GBP Assets
BONDS (continued) United Kingdom (2017: 33.58%) (continued)
554,464
Network Rail Infrastructure Finance Plc 1.75%
22/11/2027 747,439 0.65
2,796,260
Network Rail Infrastructure Finance Plc 1.375%
22/11/2037 4,582,577 3.97
258,820 UK Treasury Gilt 0.125% 10/08/2048 418,033 0.36
667,062 UK Treasury Gilt 0.125% 22/03/2058 1,226,342 1.06
681,922 UK Treasury Gilt 0.125% 22/03/2068 1,483,861 1.29
327,405 UK Treasury Gilt 0.125% 22/11/2056 591,949 0.51
375,992 UK Treasury Gilt 0.125% 22/11/2065 781,726 0.68
714,867 UK Treasury Gilt 0.375% 22/03/2062 1,505,510 1.31
1,144,538 UK Treasury Gilt 1.25% 22/11/2055 2,676,273 2.32
554,838 UK Treasury Gilt 2% 26/01/2035 1,524,334 1.32
1,320,579 UK Treasury Gilt 0.125% 10/08/2041 1,959,281 1.70
1,299,792 UK Treasury Gilt 0.5% 22/03/2050 2,349,960 2.04
25,793 UK Treasury Gilt 4.125% 22/07/2030 95,206 0.08
32,499,200 28.17
United States (2017: 38.83%)
3,734,255
United States Inflation Indexed Bonds 0.125%
15/04/2021 2,852,027 2.47
4,938,955
United States Inflation Indexed Bonds 0.125%
15/04/2022 3,752,725 3.25
2,370,116
United States Inflation Indexed Bonds 0.25%
15/01/2025 1,782,256 1.55
5,535,864
United States Inflation Indexed Bonds 0.5%
15/01/2028 4,152,277 3.60
2,167,480
United States Inflation Indexed Bonds 0.625%
15/01/2024 1,676,015 1.45
1,979,748
United States Inflation Indexed Bonds 0.625%
15/02/2043 1,363,994 1.18
3,192,660
United States Inflation Indexed Bonds 0.625%
15/01/2026 2,442,890 2.12
5,395,559
United States Inflation Indexed Bonds 0.625%
15/04/2023 4,170,158 3.61
1,047,550
United States Inflation Indexed Bonds 0.875%
15/02/2047 755,919 0.66
1,640,704
United States Inflation Indexed Bonds 1%
15/02/2048 1,222,488 1.06
1,953,018
United States Inflation Indexed Bonds 1.375%
15/02/2044 1,586,732 1.38
3,185,767
United States Inflation Indexed Bonds 1.875%
15/07/2019 2,492,918 2.16
1,911,075
United States Inflation Indexed Bonds 2%
15/01/2026 1,602,360 1.39

Smith & Williamson Investment Funds Plc
116
Schedule of Investments
Smith & Williamson Global Inflation Linked Bond Fund (continued)
As at As at
December December
Shares/ 31, 2018 31, 2018
Domicile Par Value Description Fair Value % of Net
GBP Assets
BONDS (continued) United States (2017: 38.83%) (continued)
1,154,710
United States Inflation Indexed Bonds 2.125%
15/02/2041 1,072,015 0.93
6,006,729
United States Inflation Indexed Bonds 2.5%
15/01/2029 5,373,536 4.66
2,493,085
United States Inflation Indexed Bonds 3.375%
15/04/2032 2,516,404 2.18
4,299,460
United States Inflation Indexed Bonds 3.625%
15/04/2028 4,146,889 3.59
5,719,601 WI Treasury Bill 0.125% 15/04/2019 4,425,868 3.84
47,387,471 41.08
Total Bonds (2017: 99.06%)
113,314,498 98.22
Unrealised % of Net
FORWARDS
gain/(loss) Assets
Maturity Date Counterparty Amount Bought Amount Sold GBP 17/01/2019 BNP Paribas GBP 1,543,746 CAD 2,620,000 38,131 0.03
17/01/2019 BNP Paribas GBP 1,086,702 AUD 1,918,000 27,143 0.02
17/01/2019 BNP Paribas GBP 637,684 NZD 1,180,000 16,790 0.02
17/01/2019 BNP Paribas GBP 535,619 AUD 940,000 16,337 0.02
17/01/2019 BNP Paribas GBP 1,718,719 EUR 1,900,000 12,450 0.01
17/01/2019 BNP Paribas GBP 1,355,940 EUR 1,500,000 8,886 0.01
17/01/2019 BNP Paribas GBP 1,800,438 EUR 2,000,000 4,370 -
17/01/2019 BNP Paribas GBP 18,815,404 EUR 20,950,000 1,612 -
17/01/2019 BNP Paribas GBP 503,951 EUR 560,000 1,052 -
17/01/2019 BNP Paribas GBP 476,671 EUR 530,000 714 -
24/01/2019 BNP Paribas GBP 1,973 USD 2,500 12 -
24/01/2019 BNP Paribas GBP 2,257 EUR 2,500 11 -
Unrealised gain on forward foreign exchange contracts
127,508 0.11

Smith & Williamson Investment Funds Plc
117
Schedule of Investments
Smith & Williamson Global Inflation Linked Bond Fund (continued)
Unrealised % of Net
gain/(loss) Assets
GBP
FORWARDS (continued)
Maturity Date Counterparty Amount Bought Amount Sold
17/01/2019 BNP Paribas AUD 20,000 GBP 11,170 (121) -
17/01/2019 BNP Paribas USD 225,000 GBP 177,696 (1,197) -
17/01/2019 BNP Paribas USD 340,000 GBP 267,956 (1,248) -
17/01/2019 BNP Paribas CAD 65,000 GBP 38,645 (1,292) -
17/01/2019 BNP Paribas USD 430,000 GBP 339,932 (2,624) -
17/01/2019 BNP Paribas EUR 500,000 GBP 452,175 (3,158) -
17/01/2019 BNP Paribas EUR 1,750,000 GBP 1,575,105 (3,547) -
17/01/2019 BNP Paribas USD 300,000 GBP 239,078 (3,748) -
17/01/2019 BNP Paribas USD 700,000 GBP 553,513 (4,408) (0.01)
17/01/2019 BNP Paribas USD 1,400,000 GBP 1,104,306 (6,095) (0.01)
17/01/2019 BNP Paribas USD 1,250,000 GBP 991,333 (10,788) (0.01)
17/01/2019 BNP Paribas GBP 664,792 SEK 7,650,000 (13,280) (0.01)
17/01/2019 BNP Paribas GBP 51,323,660 USD 65,470,000 (33,366) (0.03)
17/01/2019 BNP Paribas GBP 7,436,372 JPY 1,065,000,000 (188,510) (0.16)
24/01/2019 BNP Paribas EUR 882,000 GBP 793,856 (1,616) (0.00)
24/01/2019 BNP Paribas USD 918,000 GBP 725,794 (5,955) (0.01)
Unrealised loss on forward foreign exchange contracts (280,953) (0.24)
Financial assets at fair value through profit or loss
113,442,006 98.33
Financial liabilities at fair value through profit or loss
(280,953) (0.24)
Net Current Assets
2,201,426 1.91
Net Assets Attributable to Holders of Redeemable Participating Shares 115,362,479 100.00
% of Total
Analysis of Total Assets
Assets
Transferable securities admitted to an official stock exchange listing
113,314,498 97.50
OTC derivative instruments
(153,445) (0.13)
113,161,053 97.37

Smith & Williamson Investment Funds Plc
118
Schedule of Investments
Smith & Williamson Mid Ocean World Investment Fund
As at As at
December December
Shares/ 31, 2018 31, 2018
Domicile Par Value Description Fair Value % of Net
USD Assets
EQUITIES
Asia (2017: 9.09%)
99,400 AIA Group Ltd 825,225 1.18
20,900 Daifuku Co Ltd 956,278 1.36
1,199,000 Reef China Commercial Trust - -
19,800 Technopro Holdings Inc 816,616 1.16
2,598,119 3.70
Australia (2017: 2.62%)
101,834 Treasury Wine Estates Ltd 1,061,024 1.51
Canada (2017:1.47%)
- - - -
China (2017: 1.58%)
7,000 Alibaba Group Holding-SP 959,490 1.37
229,000 Anhui Conch Cement Co Ltd 1,111,455 1.58
2,070,945 2.95
Europe (2017: 6.93%)
7,661 Capgemini SE 760,166 1.08
2,408 Kering 1,133,014 1.62
1,893,180 2.70
France (2017: 1.60%)
11,513 Vinci SA 947,862 1.35
Germany (2017: 2.37%)
20,076 Siemens Healthineers AG 838,244 1.20
Indonesia (2017: 1.29%)
13,400 HDFC Bank Ltd 1,388,106 1.98
Ireland (2017:1.49%)
- - - -
Italy (2017: 0.00%)
45,771 ENI SPA 719,339 1.03
6,947 Ferrari NV 689,160 0.98
1,408,499 2.01
Japan (2017: 9.77%)
2,600 Keyence Corp 1,319,491 1.88
28,700 Sony Corp 1,393,212 1.99
20,600 Sumitomo Mitsui Financial Group 684,382 0.97
3,397,085 4.84

Smith & Williamson Investment Funds Plc
119
Schedule of Investments
Smith & Williamson Mid Ocean World Investment Fund (continued)
As at As at
December December
Shares/ 31, 2018 31, 2018
Domicile Par Value Description Fair Value % of Net
USD Assets
EQUITIES (continued)
Netherlands (2017: 1.73%)
- - -
Singapore (2017:0.93%)
- - - -
South Korea (2017: 1.66%)
25,750 Samsung Electronics Fund 732,714 1.05
Switzerland (2017: 0.00%)
15,673 Novartis AG 1,336,152 1.91
United Kingdom (2017: 7.14%)
25,999 Rio Tinto Plc 1,235,123 1.76
50,986 Royal Dutch Shell Plc 1,498,433 2.14
50,403 Smith & Nephew Plc 939,814 1.34
386,875 Tesco Plc 936,693 1.33
18,992 Unilever NV-CVA 1,029,522 1.47
17,182 Worldpay Inc-Class A 1,313,220 1.87
6,952,805 9.91
United States (2017: 44.68%)
24,731 Abbott Laboratories 1,788,793 2.55
24,582 Activision Blizzard Inc 1,144,784 1.63
1,856 Alphabet Inc 1,939,446 2.77
68,907 Bank of America Corp 1,697,868 2.42
36,086 Cisco Systems Inc 1,563,606 2.23
27,146 Citigroup Inc 1,413,221 2.02
14,569 Danaher Corp 1,502,355 2.14
15,751 EOG Resources Inc 1,373,645 1.96
1,265 Fiac Inc* - -
1,200,000 Genagro* - -
14,160 Hess Corp 573,480 0.82
10,105 Ingersoll-Rand Plc 921,879 1.31
29,400 Jardine Strategic Holdings Ltd 1,079,274 1.54
15,836 Keysight Technologies Inc 983,099 1.40
6,551 L3 Technologies Inc 1,137,647 1.62
6,644 Lam Research Corp 904,713 1.29
6,118 Littelfuse Inc 1,049,115 1.50
10,135 Lowes Cos Inc 936,069 1.33
12,408 Merck & Co. Inc 948,095 1.35
19,622 Microsoft Corp 1,993,007 2.84
11,848 Nike Inc -Class B 878,411 1.25
6,537 NV idia Corp 872,689 1.24

Smith & Williamson Investment Funds Plc
120
Schedule of Investments
Smith & Williamson Mid Ocean World Investment Fund (continued)
As at As at
December December
Shares/ 31, 2018 31, 2018
Domicile Par Value Description Fair Value % of Net
USD Assets
EQUITIES
United States (2017: 44.68%) (continued)
11,264 Pepsico Inc 1,244,447 1.77
12,287 Raymond James Financial Inc 914,276 1.30
7,209 Raytheon Company 1,105,500 1.58
252,900 Samsonite International SA 718,707 1.03
4,670 SBA Communications Corp 756,026 1.08
8,467 Stryker Corp 1,327,202 1.89
3,741 SVB Financial Group 710,491 1.01
20,738 Transunion 1,177,918 1.68
35,113 Trimble Inc 1,155,569 1.65
9,492 United Health Group Inc 2,364,647 3.37
14,456 Wal-Mart Stores Inc 1,346,576 1.92
6,748 Walt Disney Co 739,918 1.06
15,511 Yum! Brands Inc 1,425,771 2.03
39,688,244 56.58
Total Equities (2017: 94.35%) 64,312,979 91.69
INVESTMENT FUNDS
Asia (2017: 1.24%)
- - - -
Ireland (2017: 3.08%)
2,374,802
S&W Artificial Intelligence Aeq
Fund* 2,735,060 3.90
Total Investment Funds (2017: 4.32%) 2,735,060 3.90
Financial assets at fair value through profit or loss 67,048,039 95.59
Net Current Assets
3,094,899 4.41
Net Assets Attributable to Holders of Redeemable Participating Shares 70,142,938 100.00
% of Total
Analysis of Total Assets
Assets
Transferable securities admitted to an official stock exchange listing 64,312,979 91.39
Transferable securities not admitted to an official stock exchange listing 2,735,060 3.89
67,048,039 95.28
*Value by Smith & Williamson Fair Value Pricing Committee

Smith & Williamson Investment Funds Plc
121
Schedule of Investments
Smith & Williamson Blairmore Global Equity Fund As at As at
December December
Shares/
31, 2018 31, 2018
Domicile Par Value Description Fair Value % of Net
USD Assets
EQUITIES
Asia (2017: 0.00%)
21,200 Tencent Holdings Ltd 850,234 3.02
Australia (2017: 4.68%)
2,586,846 Base Resources Ltd 427,966 1.52
700,000 Cap-Xx Ltd 70,878 0.25
175,741 Orocobre Ltd 399,619 1.42
898,463 3.19
Canada (2017: 0.78%)
21,000 Hexo Corp 72,419 0.26
100,000 Mountain Province Diamonds Fund 142,775 0.51
215,194 0.77
China (2017: 1.45%)
70,000 Ping An Insurance Group Co 618,249 2.20
Denmark (2017: 2.45%)
- - - -
Europe (Excl. United Kingdom) (2017: 2.73%)
22,300 Vivendi S.A. 542,475 1.93
Far East (2017: 2.46%)
20,000 Sumitomo Mitsui Financial Group 664,449 2.36
France (2017: 1.87%)
4,200 Capgemini SE 416,747 1.48
3,000 Laurent-Perrier Group 325,797 1.16
742,544 2.64
Germany (2017: 1.73%)
9,200 Kion Group AG 466,218 1.66
Greece (2017: 1.11%)
65,000 Diana Shipping Inc 206,700 0.73
Guernsey (2017:0.97%)
- - - -
Hong Kong (2017:1.94%)
- - - -
Italy (2017: 1.77%)
94,000 Davide Campari-Milano SPA 793,563 2.82

Smith & Williamson Investment Funds Plc
122
Schedule of Investments
Smith & Williamson Blairmore Global Equity Fund (continued) As at As at
December December
Shares/
31, 2018 31, 2018
Domicile Par Value Description Fair Value % of Net
USD Assets
EQUITIES (continued)
Japan (2017: 5.99%)
4,500 Fanuc Corp 683,726 2.43
12,000 Showa Denko 357,654 1.27
1,041,380 3.70
Macao (2017: 1.03%)
81,500 Sands China Ltd 357,046 1.27
Norway (2017: 0.00%)
10,000 Tomra Systems ASA 224,963 0.80
8,500 Yara International ASA 327,369 1.16
552,332 1.96
Romania (2017: 0.00%)
24,000 Fondul Proprietatea SA 252,000 0.90
Spain (2017: 0.00%)
8,500 Industria De Diseno Textile 217,170 0.77
Sweden (2017: 0.00%)
6,850 Modern Times Group-B 226,380 0.80
Switzerland (2017: 2.13%)
45,650 Transocean Ltd 316,811 1.13
United Kingdom (2017: 14.08%)
50,000 Actual Experience Plc 133,732 0.48
290,000 Augmentum Fintech Plc 361,228 1.29
10,000 British American Tobacco Plc 318,409 1.13
130,000 BT Group Plc 394,228 1.40
87,000 Ceres Power Holdings Plc 181,722 0.65
39,080 Claremont* 14,434 0.05
520,000 Coats Group Plc 539,766 1.92
300,000 CV Pharma Ltd* - -
5,200 Emerging Market Advisory Redeemable* 3,245 0.01
35,500 Energean Oil & Gas Plc 284,080 1.01
13,700 Genus Plc 374,451 1.33
800,000 Hummingbird Resources Plc 219,575 0.78
870,000 Hurricane Energy Plc 489,320 1.74
49,000 Just Eat Plc 366,211 1.30
136,890 Melrose Industrial Shares 285,669 1.02
183,000 Premier Oil Plc 155,111 0.55

Smith & Williamson Investment Funds Plc
123
Schedule of Investments
Smith & Williamson Blairmore Global Equity Fund (continued) As at As at
December December
Shares/
31, 2018 31, 2018
Domicile Par Value Description Fair Value % of Net
USD Assets
EQUITIES (continued)
United Kingdom (2017: 14.08%)
8,800 Renishaw Plc 475,218 1.69
11,000 Rio Tinto Plc 522,572 1.86
200,000 SDX Energy Inc 90,428 0.32
95,000 Sensyne Health Plc 191,777 0.68
90,000 Trufin Plc 228,108 0.81
100,000 Tullow Oil Plc 228,108 0.81
27,800 Weir Group Plc 459,583 1.63
153,635 Yellow Cake Plc 448,095 1.59
6,765,070 24.05
United States (2017: 42.40%)
675 Alphabet Inc-Cl C 699,037 2.49
700 Amazon.Com Inc 1,051,379 3.74
16,600 Citigroup Inc 864,196 3.07
5,400 Electronic Arts Inc 426,114 1.51
900,000 Genagro* - -
4,400 Honeywell International Inc 581,328 2.07
20,000 Iridium Communications Inc 369,000 1.31
66,313 Lemko Corp* 250,000 0.89
5,550 Mastercard Inc 1,047,007 3.72
10,500 Mondelez International Inc 420,315 1.49
4,750 Paypal Holdings Inc 399,428 1.42
9,700 Starbucks Corp 624,680 2.22
5,450 Texas Instruments Inc 515,025 1.83
8,300 Walt Disney Co 910,095 3.24
13,300 World Wrestling Entertain Fund 993,776 3.53
9,151,380 32.53
Total Equities (2017: 89.57%)
24,877,658 88.43
INVESTMENT FUNDS Bermuda (2017: 0.93%)
- - - -
Ireland (2017: 1.16%)
350,000 S&W Artificial Intelligence Fund* 403,095 1.43
United Kingdom (2017: 5.26%)
47,000 Blackrock Gold & General Inc Fund 495,408 1.76
1,250 CSP Second Opportunities II Fund* - -
450,000 India Capital Growth Fund 501,493 1.79
996,901 3.55

Smith & Williamson Investment Funds Plc
124
Schedule of Investments
Smith & Williamson Blairmore Global Equity Fund (continued) As at As at
December December
Shares/
31, 2018 31, 2018
Domicile Par Value Description Fair Value % of Net
USD Assets
INVESTMENT FUNDS (continued)
United States (2017: 2.65%)
150,000 VinaCapital Vietnam Opportunities Fund 630,000 2.24
Total Investment Funds (2017: 10.00%) 2,029,996 7.22
Financial assets at fair value through profit or loss 26,907,654 95.65
Net Current Assets
1,224,794 4.35
Net Assets Attributable to Holders of Redeemable Participating Shares 28,132,448 100.00
% of Total
Analysis of Total Assets
Assets
Transferable securities admitted to an official stock exchange listing 26,236,880 93.10
Transferable securities not admitted to an official stock exchange listing 670,774 2.38
26,907,654 95.48
*Valued by Smith & Williamson Fair Value Pricing Committee

Smith & Williamson Investment Funds Plc
125
Schedule of Investments
Smith & Williamson Artificial Intelligence
As at As at
December December
Shares/
31, 2018 31, 2018
Domicile Par Value Description Fair Value % of Net
GBP Assets
EQUITIES
Argentina (2017: 3.95%)
12,400 Mercadolibre Inc 2,851,165 2.32
Australia (2017: 2.82%)
422,035 Appen Ltd 2,992,962 2.44
111,988 ASX Ltd 3,710,346 3.02
6,703,308 5.46
China (2017: 6.40%)
36,300 Alibaba Group Holding-SP 3,906,649 3.19
22,100 Baidu Inc - Spon Adr 2,752,016 2.24
473,000 Ping An Insurance Group Co 3,280,059 2.67
9,938,724 8.10
Finland (2017: 0.32%)
- - - -
Germany (2017: 7.86%)
48,351 SAP SE 3,772,540 3.07
68,358 Siemens Healthineers AG 2,242,208 1.83
6,014,748 4.90
Hong Kong (2017: 1.96%)
- - - -
Israel (2017: 0.00%)
15,700 Mellanox Technologies Ltd 1,138,762 0.93
Italy (2017: 0.00%)
251,364 ENI SPA 3,101,710 2.53
Japan (2017: 6.22%)
259,400 Advantest Corp 4,165,645 3.40
13,700 Fanuc Corp 1,634,352 1.33
10,000 Keyence Corp 3,984,636 3.25
9,784,633 7.98
Luxembourg (2017: 2.96%)
74,000 Globant SA 3,272,275 2.67
United Kingdom (2017: 7.11%)
161,929 Blue Prism Group Plc 1,790,935 1.46
404,012 Ocado Group Plc 3,191,695 2.60
180,659 Relx Plc 2,920,353 2.38
358,091 Sensyne Health Plc 567,574 0.47
8,470,557 6.91
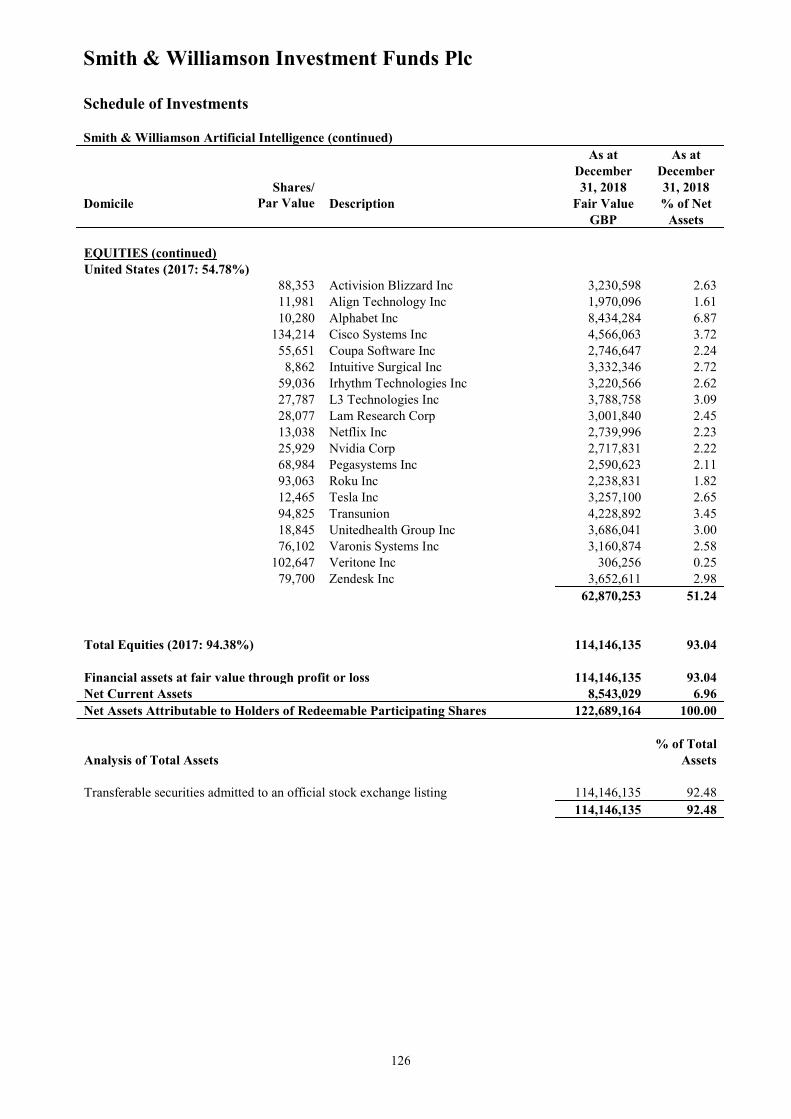
Smith & Williamson Investment Funds Plc
126
Schedule of Investments
Smith & Williamson Artificial Intelligence (continued)
As at As at
December December
Shares/
31, 2018 31, 2018
Domicile Par Value Description Fair Value % of Net
GBP Assets
EQUITIES (continued)
United States (2017: 54.78%)
88,353 Activision Blizzard Inc 3,230,598 2.63
11,981 Align Technology Inc 1,970,096 1.61
10,280 Alphabet Inc 8,434,284 6.87
134,214 Cisco Systems Inc 4,566,063 3.72
55,651 Coupa Software Inc 2,746,647 2.24
8,862 Intuitive Surgical Inc 3,332,346 2.72
59,036 Irhythm Technologies Inc 3,220,566 2.62
27,787 L3 Technologies Inc 3,788,758 3.09
28,077 Lam Research Corp 3,001,840 2.45
13,038 Netflix Inc 2,739,996 2.23
25,929 Nvidia Corp 2,717,831 2.22
68,984 Pegasystems Inc 2,590,623 2.11
93,063 Roku Inc 2,238,831 1.82
12,465 Tesla Inc 3,257,100 2.65
94,825 Transunion 4,228,892 3.45
18,845 Unitedhealth Group Inc 3,686,041 3.00
76,102 Varonis Systems Inc 3,160,874 2.58
102,647 Veritone Inc 306,256 0.25
79,700 Zendesk Inc 3,652,611 2.98
62,870,253 51.24
Total Equities (2017: 94.38%) 114,146,135 93.04
Financial assets at fair value through profit or loss 114,146,135 93.04
Net Current Assets
8,543,029 6.96
Net Assets Attributable to Holders of Redeemable Participating Shares 122,689,164 100.00
% of Total
Analysis of Total Assets
Assets
Transferable securities admitted to an official stock exchange listing 114,146,135 92.48
114,146,135 92.48

Smith & Williamson Investment Funds Plc
Portfolio changes for the financial year ended December 31, 2018 (Unaudited)
127
Wye Investment Fund
Shares/
Shares/
Purchases Par value GBP Sales Par value GBP
Man GLG UK Underva Assets PD 550,000 805,200 Trojan Income Fund 590,000 1,046,968
NB Private Equity Partners Fund Ltd 86,000 757,112 Edinburgh Investment Trust 138,000 950,353
Fidelity Special Values Plc 260,000 712,400 John Laing Infrastructure Fund 588,000 806,912
Montanaro UK Income 340,000 695,300 JPM US Equity Income Fund 235,000 722,005
Templeton Emerging Markets Fund 80,000 643,804 Tritax Big Box REIT Plc 355,000 532,100
Fidelity China Special Situa Fund 250,000 630,825 Fidelity Index UK Fund 400,000 479,016
Edgewood L Sl-US Sl G-I USDZ 4,000 627,630
Henderson European Focus
Trust 36,000 447,400
BBGI SICAV SA 450,000 627,467 UK Mortgages Ltd 500,000 445,500
Schroder UK Growth Fund Plc 370,000 597,180
Egerton Sterling Investment
Fund 3,500 438,001
Egerton Sterling Investment Fund 3,500 438,001
Martin Currie Asia Unconstra
Fund 100,000 398,000
Blackrock Frontiers Investment 240,000 396,000 NB Private Equity Partners Ltd 43,000 378,556
Greencoat Renewables Plc 357,049 320,519 Artemis Income Fund 130,000 283,608
Alexandria Real Estate Equity 3,200 301,482
Blackrock Continental Europe
Fund 120,000 191,160
Ascendas Real Estate Investment 195,000 297,816 Pargesa Holding SA 2,500 142,458
TB Wise Evenlode Inc Fund 110,000 225,126 Secure Income REIT Plc 30,000 107,400
Sequoia Economic Infrastructure 81,818 90,179 Deutsche Beteiligungs AG 600 20,383 Sequoia Economic Infrastructure Ent
RTS 08/10/2018 81,818 3,452 Sequoia Economic Infrastructure - 3,452 Sequoia Economic Infrastructure Sub
RTS 08/10/2018 409,090 - Sequoia Economic Infrastructure
Ent RTS 08/10/2018 81,818 3,452
Ascendas Real Estate Investment - 1,352

Smith & Williamson Investment Funds Plc
Portfolio changes for the financial year ended December 31, 2018 (Unaudited)
128
Boulder Investment Fund
Shares/
Shares/
Purchases Par value GBP Sales Par value GBP
Asos Plc 18,000 832,523
Templeton Emerging Markets
Fund 80,000 643,804
Templeton Emerging Markets
Fund 80,000 640,600 Blackrock Continental Europe
365,000 577,795
Hess Corp 12,000 547,935 Priceline Group 315 461,256
Scapa Group Plc 120,000 506,833 Facebook Inc 3,100 454,234
Relx Plc 32,000 504,640 Fifth Third Bancorp 21,000 451,486
Treatt Plc 100,000 492,360 ULS Technology Plc 330,000 451,000
Experian Plc 30,000 491,993 Shire Plc 13,000 427,044
Citigroup Inc 8,600 461,393 Phoenix Group Holdings Fund 55,000 426,763
Bank of America Corp 20,000 461,390 IPG Photonics Corp 3,850 400,199
Booking Holdings Inc 315 461,256 Pandora A/S 6,100 396,347
Estee Lauder Companies 3,600 406,193 Reckitt Benckiser Group Plc 6,350 359,047
Mirriad Advertising Plc 645,161 400,000 Cognex Corp 9,400 356,994
Danone 6,850 397,227 Ferguson Plc 8,052 338,908
Walt Disney Co 4,400 394,062 Microsoft Corp 3,300 248,749
Ferguson Plc 7,604 338,908 Blackrock Emerging Europe Plc 70,000 245,800
Blackrock Frontiers 231,812 245,800 U-Blox Holding AG 2,750 225,919
Hostelworld Group Plc 60,000 203,958 Numis Corporation Plc 44,500 179,700
Ipg Photonics Corp 1,100 137,000 Rotork Plc 55,000 169,462
Blackrock Emerging Europe Plc 10,000 32,500 Halma Plc 12,500 165,456
FIH Group Plc 8,515 28,304 Apple Inc 1,150 159,516
Hostelworld Group Plc 60,000 153,150
Croda International Plc 2,750 120,683
Mastercard Inc 750 105,130

Smith & Williamson Investment Funds Plc
Portfolio changes for the financial year ended December 31, 2018 (Unaudited)
129
Santos Investment Fund
Shares/
Shares/
Purchases Par value GBP Sales Par value GBP
Tesco Personal 5% 21/11/2020 300,000 308,700 Phoenix Group Holdings 48,364 296,789
BBGI SICAV SA 189,000 278,952 John Laing Infrastructure Fund 187,550 257,996
Phoenix Group Holdings Plc 36,690 206,829 Shire Plc 4,200 191,489
Burford Capital 5.% 01/12/2026 190,000 197,600 Utilico Emerging Markets Ltd 111,900 184,495
Sophos Group Plc 40,000 191,619 Johnson & Johnson 1,620 164,198
Utilico Emerging Markets Trust 111,900 184,495 Utilico Finance Ltd 100,000 142,510
Keywords Studios Plc 9,300 168,146 Whitbread Plc 2,400 111,311
Tencent Holdings Ltd 4,200 157,840 BHP Group Plc 5,400 111,153
Ferrari NV 1,600 157,038 Continental AG 620 104,157
Phoenix Group Holdings 23,348 150,432 Mohawk Industries Inc 720 99,813
BHP Group Plc 5,400 111,153 GKN Ltd 28,700 98,719
Melrose Ind Shs 48,503 75,472 Pepsico Inc 900 74,059
DS Smith Plc 19,090 74,687 Halma Plc 3,600 50,922
BT Group Plc 21,900 52,796 Activision Blizzard Inc 800 44,170
DS Smith Plc 9,545 41,279
Phoenix Group Holdings Nil Rts
09/07/18 11,674 14,745
VAT Group AG - 5,945
DS Smith Plc Nil RTS
24/07/2018 9,545 3,936

Smith & Williamson Investment Funds Plc
Portfolio changes for the financial year ended December 31, 2018 (Unaudited)
130
Smith & Williamson Defensive Growth Fund
Shares/
Shares/
Purchases Par value GBP Sales Par value GBP
Credit Suisse AG London 0%
17/10/2025 1,705,000 1,701,938
Taliesin Propert 0%30/09/2018
Flat 650,000 937,820
Morgan Standly BV 0%
10/07/2024 1,650,000 1,667,505
NB Distressed Debt Investment
Fund Ltd 954,526 650,031
UBS AG Jersey Branch 0%
25/04/2024 1,500,000 1,495,575
Personal Assets Trust Plc 1,620 638,470
UBS AG 29/09/2025 1,350,000 1,349,210 Syncona Ltd 302,000 633,395
BBGI SICAV SA 983,275 1,318,938 Nextenergy Solar Fund Ltd 561,433 623,178
Can Imperial Bank 0%
05/01/2026 1,250,000 1,250,000
Axa St Index Linked-I-Acc-Gr
Fund 185,000 520,405
Medicx Fund Ltd 1,465,000 1,178,857 Acencia Debt Strategies Ltd 380,000 440,557
NB Distressed Debt Investment
Fund Ltd 1,479,767 1,004,103
Macau Property Opportunities
Fund Ltd 190,000 359,491
Credit Suisse AG London 0%
01/10/2024 1,320,000 1,001,164
Aberforth Split Level Income 180,000 180,000
NB Private Equity Partners Fund
Ltd - ZDP 2024 1,000,000 1,000,000
Chelverton Small Companies ZDP 133,317 156,671
Standard LF Globale Index Ltd 650,000 999,180
Sequoia Economic Infrastructure
Fund 321,529 138,872
Inland ZDP Plc 550,000 831,425 Damille Investments II Ltd Fund 250,000 114,471
UIL Finance Ltd-ZDP 2026 750,000 756,875 Prospect Japan Fund Ltd 55,000 83,188
RM ZDP Plc 750,000 750,000 BBGI SICAV SA 5,500 78,415
Macau Property Opportunities
Fund Ltd 316,214 563,180
BH Global Fund Ltd 139,324 5,356
Sequoia Economic Infrastructure
Fund 515,606 549,173
Real Estate Credit Investments 255,000 428,861
Henderson Alternative Strategies
Trust 130,000 368,060
John Laing Environmental
Assets Group Fund Ltd 355,363 362,470
Raven Russia 6.50% 07/07/2026 265,219 310,717
PGIT Securities 2020 Plc 250,000 290,000
Highbridge Multi Strategy Fund
Ltd 120,000 270,349
BH Global Fund Ltd 18,500 261,012
APQ Global Ltd 3.50%
30/09/2024 50 253,300
Morgan Standly BV 0%
16/10/2024 250,000 246,631
GLI Finance Ltd 200,000 217,313

Smith & Williamson Investment Funds Plc
Portfolio changes for the financial year ended December 31, 2018 (Unaudited)
131
Smith & Williamson Cash Fund
Shares/
Shares/
Purchases Par value GBP Sales Par value GBP
Royal Bank of Scotland 0.57%
13/07/2018 1,100,000 1,100,000
Svenska Handelsbanken 0.46%
28/02/2018 2,000,000 2,000,000
Nationwide 0.58% 14/12/2018 1,100,000 1,100,000
Leeds Building Society 0.5%
11/05/2018 1,300,000 1,300,000
ING Bank 0.83% 04/02/2019 1,000,000 1,002,486
Royal Bank of Scotland 0.435%
15/01/2018 1,250,000 1,250,000
ING Bank 0.8% 04/02/2019 1,000,000 1,002,264
Standared Chartered 0.33%
07/02/2018 1,200,000 1,200,000
HSBC Bank Plc 0.84% 11/03/2019 1,000,000 1,000,432 Santander UK 0.5% 11/06/2018 1,100,000 1,100,000
ING Bank 0.45% 10/04/2018 1,000,000 1,000,000
Royal Bank Of Scotland 0.57%
13/07/2018 1,100,000 1,100,000
Nordea Bank Ab 0.85% 17/01/2019 1,000,000 1,000,000 Nationwide 0.38% 20/02/2018 1,100,000 1,100,000
Nordea Bank 0.6% 10/07/2018 1,000,000 1,000,000 Nationwide 0.47% 15/06/2018 1,100,000 1,100,000
ING Bank 0.82% 05/10/2018 1,000,000 1,000,000 Nationwide 0.58% 14/12/2018 1,100,000 1,100,000
Toronto Dominion Bank 0.65%
10/09/2018 1,000,000 1,000,000
Royal Bank of Scotland 0.34%
05/01/2018 1,000,000 1,000,000
Santander UK 1% 05/06/2019 1,000,000 1,000,000 Santander UK 0.7% 07/12/2018 1,000,000 1,000,000 Leeds Building Society 0.64%
11/10/2018 1,000,000 1,000,000 Lloyds 0.84% 19/10/2018 1,000,000 1,000,000
Bank of Nova Scotia 0.92%
18/04/2019 1,000,000 1,000,000
Santander UK Plc 0.6%
02/05/2018 1,000,000 1,000,000 Leeds Building Society 0.7%
12/09/2018 1,000,000 1,000,000 Lloyds 0.78% 29/10/2018 1,000,000 1,000,000
Nationwide 0.77% 12/06/2019 1,000,000 1,000,000 Lloyds 0.54% 02/05/2018 1,000,000 1,000,000
Leeds Building Society 0.76%
14/01/2019 1,000,000 1,000,000
Royal Bank of Scotland 0.57%
04/07/2018 1,000,000 1,000,000
Nordea Bank 0.82% 07/01/2019 1,000,000 1,000,000
Toronto Dominion Bank 0.65%
10/09/2018 1,000,000 1,000,000
Leeds Building Society 0.86%
09/04/2019 1,000,000 1,000,000
Leeds Building Society 0.64%
11/10/2018 1,000,000 1,000,000 Royal Bank of Scotland 0.57%
04/07/2018 1,000,000 1,000,000 ING Bank 0.45% 10/04/2018 1,000,000 1,000,000
Lloyds 0.78% 29/10/2018 1,000,000 1,000,000
Leeds Building Society 0.7%
12/09/2018 1,000,000 1,000,000
Santander UK 0.7% 07/12/2018 1,000,000 1,000,000 Rabobank 0.48% 23/04/2018 1,000,000 1,000,000
Lloyds 0.84% 19/10/2018 1,000,000 1,000,000 ING Bank 0.82% 05/10/2018 1,000,000 1,000,000
Standard Chartered 0.85%
10/01/2019 1,000,000 1,000,000
Standared Chartered 0.53%
09/05/2018 1,000,000 1,000,000
Lloyds 0.84% 29/03/2019 1,000,000 1,000,000 Nationwide 0.7% 01/10/2018 1,000,000 1,000,000
Toronto Dominion Bank 0.78%
19/11/2018 1,000,000 1,000,000
Toronto Dominion Bank 0.78%
19/11/2018 1,000,000 1,000,000
Lloyds Bank Plc 0.89% 23/04/2019 1,000,000 1,000,000 Nordea Bank 0.53% 15/05/2018 1,000,000 1,000,000
Nationwide 0.7% 01/10/2018 1,000,000 1,000,000 Nordea Bank 0.6% 10/07/2018 1,000,000 1,000,000
Santander UK 0.61% 16/11/2018 950,000 950,000
Santander UK 0.61%
16/11/2018 950,000 950,000 Santander UK Plc 0.95%
17/05/2019 900,000 900,000

Smith & Williamson Investment Funds Plc
Portfolio changes for the financial year ended December 31, 2018 (Unaudited)
132
Smith & Williamson Short Dated Corporate Bond Fund
Shares/
Shares/
Purchases Par value GBP Sales Par value GBP
UK Treasury 1.75% 07/09/2022 27,000,000 28,057,910
UK Treasury Bill 0%
18/06/2018 35,000,000 34,948,617
UK Treasury Bill 0% 13/08/2018 15,000,000 14,967,907
UK Treasury 1.75%
07/09/2022 27,000,000 28,011,380
UK Treasury Bill 0% 20/08/2018 10,000,000 9,976,669
UK Treasury Bill 0%
13/08/2018 15,000,000 14,998,498
UK Treasury Bill 0% 25/03/2019 8,500,000 8,486,269
UK Treasury Bill 0%
20/08/2018 10,000,000 10,000,000
UK Treasury Bill 0% 10/12/2018 7,500,000 7,486,058
UK Treasury Bill 0%
10/12/2018 7,500,000 7,500,000
UK Treasury Bill 0% 04/02/2019 7,000,000 6,993,455
Glaxosmithkline 2.85%
08/05/2022 8,593,000 6,468,010
UK Treasury Bill 0% 15/10/2018 6,000,000 5,989,696
Severn Trent Financial 6%
22/01/2018 6,450,000 6,450,000
Hiscox Ltd 2% 14/12/2022 6,000,000 5,973,244
UK Treasury Bill 0%
15/10/2018 6,000,000 6,000,000
Severn Trent Fin 6.125%
26/02/2024 4,900,000 5,965,921
UK Treasury Bill 0%
19/11/2018 5,000,000 5,000,000
UK Treasury Bill 0% 17/12/2018 5,000,000 4,997,623
UK Treasury Bill 0%
12/11/2018 5,000,000 5,000,000
UK Treasury Bill 0% 10/09/2018 5,000,000 4,997,355
UK Treasury Bill 0%
31/12/2018 5,000,000 5,000,000
UK Treasury Bill 0% 17/09/2018 5,000,000 4,997,317
UK Treasury Bill 0%
17/09/2018 5,000,000 5,000,000
UK Treasury Bill 0% 31/12/2018 5,000,000 4,992,417
UK Treasury Bill 0%
10/09/2018 5,000,000 5,000,000
UK Treasury Bill 0% 19/11/2018 5,000,000 4,991,289
UK Treasury Bill 0%
17/12/2018 5,000,000 5,000,000
UK Treasury Bill 0% 12/11/2018 5,000,000 4,991,165
UK Treasury Bill 0%
24/12/2018 3,500,000 3,500,000
GlaxoSmithKline 3.375%
15/05/2023 6,000,000 4,593,101
Experian Finance 4.75%
23/11/2018 3,425,000 3,483,780
UK Treasury Bill 0% 25/02/2019 4,500,000 4,492,496
Centrica Plc 6.375%
10/03/2022 2,730,000 3,436,364
UK Treasury Bill 0% 24/12/2018 3,500,000 3,493,476
Diageo Cap Plc 4.828%
15/07/2020 4,300,000 3,378,304
BP Capital Plc 1.177%
12/08/2023 3,000,000 2,937,600
BP Capital Plc 4.325%
10/12/2018 3,200,000 3,317,116
Imperial Tobacco Finance 9%
17/02/2022 2,000,000 2,556,000
Astrazeneca Plc 1.95%
18/09/2019 4,400,000 3,306,722
Prudential Plc 6.875% 20/01/2023 1,969,000 2,484,057
AT&T Inc 2.85%
14/02/2023 4,500,000 3,229,167
Anheuser-Busch 3.7% 01/02/2024 3,150,000 2,295,079 Centrica Plc 4% 16/10/2023 4,242,000 3,210,521
Verizon Communications Inc
4.15% 15/03/2024 3,000,000 2,253,811
Apple Inc 2.7% 13/05/2022 4,300,000 3,164,537
Apple Inc 3.45% 06/05/2024 3,000,000 2,222,297
Verizon Communications Inc
2.45% 01/11/2022 4,300,000 3,010,693
UK Treasury Bill 0% 21/01/2019 2,000,000 1,999,356
Imperial Tobacco Finance
7.75% 24/06/2019 2,640,000 3,006,130
UK Treasury Bill 0% 01/04/2019 2,000,000 1,996,466
Diageo Fin Plc 0.25% 22/10/2021 2,000,000 1,759,759
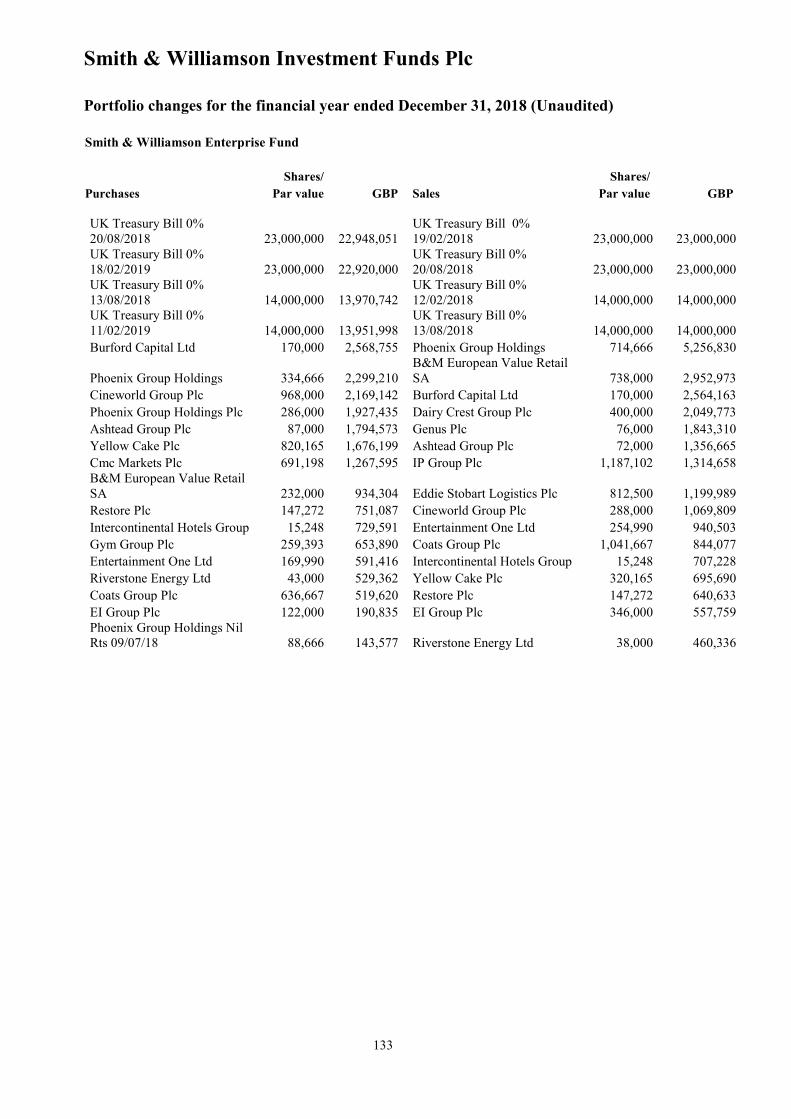
Smith & Williamson Investment Funds Plc
Portfolio changes for the financial year ended December 31, 2018 (Unaudited)
133
Smith & Williamson Enterprise Fund
Shares/
Shares/
Purchases Par value GBP Sales Par value GBP
UK Treasury Bill 0%
20/08/2018 23,000,000 22,948,051
UK Treasury Bill 0%
19/02/2018 23,000,000 23,000,000
UK Treasury Bill 0%
18/02/2019 23,000,000 22,920,000
UK Treasury Bill 0%
20/08/2018 23,000,000 23,000,000
UK Treasury Bill 0%
13/08/2018 14,000,000 13,970,742
UK Treasury Bill 0%
12/02/2018 14,000,000 14,000,000
UK Treasury Bill 0%
11/02/2019 14,000,000 13,951,998
UK Treasury Bill 0%
13/08/2018 14,000,000 14,000,000
Burford Capital Ltd 170,000 2,568,755 Phoenix Group Holdings 714,666 5,256,830
Phoenix Group Holdings 334,666 2,299,210
B&M European Value Retail
SA 738,000 2,952,973
Cineworld Group Plc 968,000 2,169,142 Burford Capital Ltd 170,000 2,564,163
Phoenix Group Holdings Plc 286,000 1,927,435 Dairy Crest Group Plc 400,000 2,049,773
Ashtead Group Plc 87,000 1,794,573 Genus Plc 76,000 1,843,310
Yellow Cake Plc 820,165 1,676,199 Ashtead Group Plc 72,000 1,356,665
Cmc Markets Plc 691,198 1,267,595 IP Group Plc 1,187,102 1,314,658
B&M European Value Retail
SA 232,000 934,304 Eddie Stobart Logistics Plc 812,500 1,199,989
Restore Plc 147,272 751,087 Cineworld Group Plc 288,000 1,069,809
Intercontinental Hotels Group 15,248 729,591 Entertainment One Ltd 254,990 940,503
Gym Group Plc 259,393 653,890 Coats Group Plc 1,041,667 844,077
Entertainment One Ltd 169,990 591,416 Intercontinental Hotels Group 15,248 707,228
Riverstone Energy Ltd 43,000 529,362 Yellow Cake Plc 320,165 695,690
Coats Group Plc 636,667 519,620 Restore Plc 147,272 640,633
EI Group Plc 122,000 190,835 EI Group Plc 346,000 557,759
Phoenix Group Holdings Nil
Rts 09/07/18 88,666 143,577 Riverstone Energy Ltd 38,000 460,336

Smith & Williamson Investment Funds Plc
Portfolio changes for the financial year ended December 31, 2018 (Unaudited)
134
Smith & Williamson Global Inflation Linked Bond Fund
Shares/
Shares/
Purchases Par value GBP Sales Par value GBP
UK Treasury Gilt 0.125%
22/03/2058 11,322,247 21,436,007
UK Treasury Gilt 0.125%
22/03/2058 11,044,449 20,966,890
United States Inflation Indexed
Bonds 0.25% 15/01/2025 19,500,000 14,084,301
United States Inflation
Indexed Bonds 0.25%
15/01/2025 20,180,000 14,474,043
United States Inflation Indexed
Bonds 1% 15/02/2048 12,662,300 9,225,126
United States Inflation
Indexed Bonds 1%
15/02/2048 11,062,300 8,117,194
United States Inflation Indexed
Bonds 0.5% 15/01/2028 12,050,000 8,774,783
United States Inflation
Indexed Bonds 2.125%
15/02/2041 6,375,000 5,896,641
United States Inflation Indexed
Bonds 2.125% 15/02/2041 7,375,000 6,837,801
United States Inflation
Indexed Bonds 0.125%
15/04/2020 7,450,000 5,541,937
United States Inflation Indexed
Bonds 3.375% 15/04/2032 5,255,000 5,368,077
United States Inflation
Indexed Bonds 0.75%
15/07/2028 7,000,000 5,156,217
United States Inflation Indexed
Bonds 0.75% 15/07/2028 7,000,000 5,247,206
United States Inflation
Indexed Bonds 3.875%
15/04/2029 4,900,000 4,959,731
United States Inflation Indexed
Bonds 0.125% 15/04/2022 7,000,000 4,991,180
United States Inflation
Indexed Bonds 0.5%
15/01/2028 6,650,000 4,920,543
WI Treasury Bill 0.125%
15/04/2019 6,500,000 4,752,850
United States Inflation
Indexed Bonds 2%
15/01/2026 5,000,000 4,196,481
United States Inflation Indexed
Bonds 0.125% 15/04/2020 6,450,000 4,708,324
United States Inflation
Indexed Bonds 3.375%
15/04/2032 3,800,000 3,898,571
US Treasury Gilt 2.5%
15/01/2029 5,100,000 4,422,911
United States Inflation
Indexed Bonds 0.125%
15/04/2022 5,250,000 3,697,160
United States Inflation Indexed
Bonds 0.625% 15/04/2023 5,800,000 4,141,897
UK Treasury Gilt 0.125%
10/08/2048 2,170,000 3,549,194
United States Inflation Indexed
Bonds 2% 15/01/2026 4,700,000 3,914,684
UK Treasury Gilt 0.625%
22/11/2042 1,750,000 2,946,515
United States Inflation Indexed
Bonds 3.875% 15/04/2029 3,400,000 3,388,489
United States Inflation
Indexed Bonds 2.375%
15/01/2027 3,250,000 2,767,648
Network Rail Infrastructure
Finance Plc 1.375% 22/11/2037 2,000,000 3,253,100
United States Inflation
Indexed Bonds 2.375%
15/01/2025 3,200,000 2,706,553
UK Treasury Gilt 0.125%
10/08/2048 1,879,000 3,089,418
WI Treasury Bill 0.125%
15/04/2019 3,500,000 2,545,188
United States Inflation Indexed
Bonds 3.625% 15/04/2028 3,285,000 3,081,115
United States Inflation
Indexed Bonds 0.125%
15/04/2018 3,350,000 2,475,655
Deutschland Government Bonds
0.5% 15/04/2030 2,873,738 2,946,744
UK Treasury Gilt 0.125%
10/08/2028 2,000,000 2,410,955

Smith & Williamson Investment Funds Plc
Portfolio changes for the financial year ended December 31, 2018 (Unaudited)
135
Smith & Williamson Global Inflation Linked Bond Fund (continued)
Shares/
Shares/
Purchases Par value GBP Sales Par value GBP
United States Inflation Indexed
Bonds 0.625% 15/01/2024 3,600,000 2,686,897
United States Inflation Indexed
Bonds 0.625% 15/01/2024 3,000,000 2,181,204
Spain Government Bond 1.8%
30/11/2024 2,600,000 2,679,638
France Treasury Bill 1.8%
25/07/2040 1,600,000 2,108,954
United States Inflation Indexed
Bonds 0.625% 15/01/2026 3,500,000 2,581,934
United States Inflation Indexed
Bonds 0.125% 15/01/2023 3,000,000 2,103,292 United States Inflation Indexed
Bonds 2.375% 15/01/2025 3,200,000 2,576,973 Spain Bond 1.8% 30/11/2024 2,000,000 2,057,927
Italy BTPS 2.35% 15/09/2035 2,395,000 2,425,138
United States Inflation Indexed
Bonds 3.625% 15/04/2028 2,000,000 1,950,846
UK Treasury Gilt 0.125%
10/08/2028 2,000,000 2,408,900
UK Treasury Gilt 0.75%
22/11/2047 1,000,000 1,861,050
United States Inflation Indexed
Bonds 1.875% 15/07/2019 2,890,000 2,229,299
United States Inflation Indexed
Bonds 0.875% 15/02/2047 2,500,000 1,849,762
United States Inflation Indexed
Bonds 0.125% 15/04/2021 3,000,000 2,183,139
United States Inflation Indexed
Bonds 0.625% 15/02/2043 2,650,000 1,838,336
Spain Bond 0.65% 30/11/2027 2,300,000 2,178,118
UK Treasury Gilt 1.125%
22/11/2037 1,085,000 1,770,616
Italy BTPS 1.3% 15/05/2028 2,400,000 2,170,161
UK Treasury Gilt 0.125%
22/03/2046 1,120,000 1,765,415
UK Treasury Gilt 0.125%
10/08/2041 1,450,000 2,145,071
Deutschland Government Bonds
0.5% 15/04/2030 1,674,369 1,727,265 United States Inflation Indexed
Bonds 0.625% 15/02/2043 3,150,000 2,141,901
United States Inflation Indexed
Bonds 0.125% 15/01/2023 3,000,000 2,105,270
United States Inflation Indexed
Bonds 0.875% 15/02/2047 2,900,000 2,083,604
National Grid Plc 06/10/2021
FRN 1,658,300 2,066,544
Deutschland 0.1% 15/04/2026 2,051,745 1,992,036
Italy BTPS 2.55% 15/09/2041 1,900,000 1,935,354
United States Inflation Indexed
Bonds 1.375% 15/02/2044 2,350,000 1,933,826

Smith & Williamson Investment Funds Plc
Portfolio changes for the financial year ended December 31, 2018 (Unaudited)
136
Smith & Williamson Medium Dated Corporate Bond Fund
Shares/
Shares/
Purchases Par value GBP Sales Par value GBP
UK Treasury Bill 0% 14/05/2018 900,000 899,671
UK Treasury Bill 0%
14/05/2018 900,000 899,665
UK Treasury Bill 0% 30/04/2018 800,000 799,776
UK Treasury Bill 0%
30/04/2018 800,000 799,842
UK Treasury Bill 0% 11/06/2018 800,000 799,408
UK Treasury Bill 0%
11/06/2018 800,000 799,483
UK Treasury Bill 0% 21/05/2018 400,000 399,820
UK Treasury Bill 0%
21/05/2018 400,000 399,882
UK Treasury Bill 0% 29/05/2018 400,000 399,732
UK Treasury Bill 0%
29/05/2018 400,000 399,825
UK Treasury Bill 0% 18/06/2018 235,000 234,910
UK Treasury Bill 0%
18/06/2018 235,000 234,955
UK Treasury Bill 0% 09/07/2018 120,000 119,957
Verizon Communications Inc
4.073% 18/06/2024 150,000 172,167
UK Treasury Bill 0% 25/06/2018 100,000 99,977
Procter & Gamble 1.8%
03/05/2029 150,000 146,235
UK Treasury Bill 0% 02/07/2018 100,000 99,960
CRH America Inc 3.875%
18/05/2025 200,000 144,412
UK Treasury Bill 0% 04/06/2018 100,000 99,951
Deutsche Bahn Finance 3.125%
24/07/2026 120,000 133,206
UK Treasury Bill 0% 06/08/2018 100,000 99,925
Brit Sky Broadcasting 6%
21/05/2027 100,000 132,594
UK Treasury Bill 0% 16/07/2018 40,000 39,989
Deutsche Telecom Finance
2.25% 13/04/2029 136,000 132,290
Glaxosmithkline 3.375%
20/12/2027 120,000 131,557
BASF SE 1.75% 11/03/2025 133,000 131,406
BHP Billiton Finance 3.25%
25/09/2024 120,000 130,668
United Utilities Water 5.625%
20/12/2027 100,000 128,446
Centrica Plc 6.4% 04/09/2026 100,000 127,713
Next Plc 4.375% 02/10/2026 115,000 126,555
Johnson&Johnson 2.95%
03/03/2027 180,000 124,604
Rio Tinto Finance 3.75%
15/06/2025 170,000 123,326
BG Energy Capital 5.125%
01/12/2025 100,000 122,687
Severn Trent Finance 6.125%
26/02/2024 100,000 121,883
Imperial Tobacco Finance 5.5%
28/09/2026 100,000 121,796
AT&T Inc 5.5% 15/03/2027 100,000 120,722
UK Treasury Bill 0%
09/07/2018 120,000 119,970

Smith & Williamson Investment Funds Plc
Portfolio changes for the financial year ended December 31, 2018 (Unaudited)
137
Smith & Williamson Medium Dated Corporate Bond Fund (continued)
Shares/
Sales Par value GBP
BP Capital Plc 2.03%
14/02/2025 120,000 119,904
John Lewis Plc 6.125%
21/01/2025 100,000 118,453
AB Inbev SA 2.25% 24/05/2029 120,000 115,828
AstraZeneca Plc 3.375%
16/11/2025 160,000 113,240
BAT International Finance 4%
13-04/09/2026 100,000 111,452
France Telecom 5.25%
05/12/2025 90,000 109,416
McDonalds Corp 3.5%
01/03/2027 150,000 104,488
UK Treasury Bill 0%
04/06/2018 100,000 100,000
UK Treasury Bill 0%
25/06/2018 100,000 99,984
UK Treasury Bill 0%
02/07/2018 100,000 99,977
UK Treasury Bill 0%
06/08/2018 100,000 99,929
Total Cap Intl 1.25% 16/12/2024 100,000 96,915
National Grid 2.125%
22/09/2028 100,000 95,098
Walt Disney Co 1.85%
30/07/2026 150,000 94,954
British Tel Plc 5.75%
07/12/2028 75,000 94,470
Heineken NV 3.5% 29/01/2028 120,000 83,678

Smith & Williamson Investment Funds Plc
Portfolio changes for the financial year ended December 31, 2018 (Unaudited)
138
Smith & Williamson Mid Ocean World Investment Fund
Shares/
Shares/
Purchases Par value USD Sales Par value USD
Worldpay Inc-Class A 25,779 2,017,639 Canadian Natural Resources 56,717 1,873,352
Ping An Insurance Group Co 137,000 1,541,026 Tencent Holdings Ltd 38,800 1,729,501
Keyence Corp 2,600 1,432,897 AIA Group Ltd 188,000 1,534,182
Trimble Inc 35,113 1,407,538 Steadfast Group Ltd 686,549 1,480,243
Keysight Technologies Inc 22,993 1,373,360 US Bancorp Fund 25,770 1,449,139
China Construction Bank 1,330,000 1,357,924 Henkel AG & Co KGAA 11,384 1,433,984
Littelfuse Inc 6,118 1,299,839 SAP SE 12,923 1,402,431
Telus Corp 35,929 1,283,830 Home Depot Inc 6,520 1,312,666
Novartis AG 15,673 1,271,548 Fanuc Corp 6,400 1,267,538
Tesco Plc 386,875 1,258,974 Telus Corp 35,929 1,245,695
Alibaba Group Holding-SP 7,000 1,191,391 Tsuruha Holdings Inc 9,000 1,242,414
Transunion 20,738 1,159,507 Itochu Corp 65,600 1,214,608
Nike Inc -Class B 16,776 1,134,987 Ping An Insurance Group Co 137,000 1,213,960
Unilever NV 18,992 1,099,358 Micro Focus International Fund 42,071 1,190,660
Lowes Cos Inc 10,135 1,097,851 China Construction Bank 1,330,000 1,154,520
Continental AG 3,704 1,062,947 ING Group NV 84,526 1,141,427
Venture Corp Ltd 64,500 1,031,097 Mohawk Industries Inc 5,789 1,134,799
Hess Corp 14,160 1,010,997 Jefferies Financial Group Inc 50,854 1,129,895
Lam Research Corp 6,644 996,835 Fortune REIT Fund 899,000 1,111,507
Broadcom Inc 4,744 959,010 Caterpillar Inc 8,083 1,088,602
Ferrari NV 6,947 877,326 CRH Plc 37,149 1,028,036
ENI SPA 45,771 876,155
Sumitomo Mitsui Financial
Group 26,600 993,871
Merck & Co. Inc 12,408 855,915 Broadcom Inc 4,744 977,811
Aia Group Ltd 99,400 837,218 Ralph Lauren Corp 8,791 977,243
Siemens Healthineers AG 20,076 801,884 Aalberts Industries NV 25,259 969,673
Walt Disney Co 6,748 784,729 Softbank Group Corp 12,800 965,925
Sba Communications Corp 4,670 777,751 Kion Group AG 11,381 959,750
Cisco Systems Inc 17,521 743,629 Broadcom Shares 4,744 959,010
Canadian Natural Resources Ltd 19,921 708,143 Chubb Ltd 6,500 943,093
Bank of America Corp 20,439 636,456 IPG Photonics Corp 4,358 923,864
Mercadolibre Inc 1,700 611,749 Horiba Ltd 18,600 914,809
Steadfast Group Ltd 198,975 430,655 Venture Corp Ltd 64,500 834,973
IPG Photonics Corp 1,605 409,379 Smith & Nephew Plc 46,705 832,710
Continental AG 3,704 806,742
Versum Materials Inc 25,194 785,539
Expedia Group Inc 7,458 770,818
Hirata Corp 8,300 768,087
Citigroup Inc 9,815 708,168
Worldpay Inc-Class A 8,597 664,062
SVB Financial Group 1,954 587,527
Technopro Holdings Inc 10,700 579,112
Nvidia Corp 2,712 557,286
Mercadolibre Inc 1,700 535,007
Rio Tinto Plc 10,198 526,785

Smith & Williamson Investment Funds Plc
Portfolio changes for the financial year ended December 31, 2018 (Unaudited)
139
Smith & Williamson Blairmore Global Equity Fund
Shares/
Shares/
Purchases Par value USD Sales Par value USD
Starbucks Corp 12,900 748,254 US Bancorp Fund 19,500 1,026,871
Texas Instruments Inc 6,800 701,907 Samsonite International S.A 240,000 960,646
Ping An Insurance Group Co 70,000 695,986 Pnc Financial Services Group 7,400 903,215
Electronic Arts Inc 5,400 637,947 Facebook Inc 4,900 875,150
Industria De Diseno Textile 21,500 633,829 Aia Group Ltd 80,000 716,131
Renishaw Plc 8,800 581,244 JP Morgan Russian Securities 94,500 647,334
Just Eat Plc 49,000 534,031 Amazon.Com Inc 375 626,084
Voya Financial Inc 10,000 525,701
World Wrestling Entertain
Fund 8,700 559,398
British American Tobacco Plc 10,000 515,123 Eagle Materials Inc 7,700 546,894
Mohawk Industries Inc 2,300 494,108 GKN Plc 114,000 544,647
Showa Denko 12,000 473,781 RPC Group Plc 45,000 540,979
Hurricane Energy Plc 870,000 456,260 Softbank Group Corp 6,200 506,693
Yara International ASA 8,500 409,706 Standard Life Aberdeen Plc 81,000 490,967
Yellow Cake Plc 153,635 406,426 Ctrip.Com International Ltd 11,500 467,216
Augmentum Fintech Plc 290,000 404,164 Jefferies Financial Group Inc 17,000 459,628
BT Group Plc 145,000 404,093 Pandora A/S 4,500 432,252
Paypal Holdings Inc 4,750 398,759 Polaris Industries Inc 4,000 422,064
Hummingbird Resources Plc 800,000 367,590 Industria De Diseno Textile 13,000 421,336
TKH Group NV-Dutch Certificate 5,300 347,191 Mohawk Industries Inc 2,300 418,158
Diana Shipping Inc 65,000 322,217 Voya Financial Inc 10,000 406,684
Tullow Oil Plc 100,000 320,980 Vat Group AG 2,900 383,904
Venture Corp Ltd 14,000 301,137 Alphabet Inc 330 365,489
Fondul Proprietatea SA 24,000 295,495 Diana Shipping Inc 95,700 362,963
Energean Oil & Gas Plc 35,500 294,424 Hollywood Bowl Group Plc 120,000 351,687
Modern Times Group-B 6,850 274,277
Globalworth Real Estate
Investment 31,657 346,923
Trufin Plc 90,000 269,314 Vivendi S.A. 13,200 342,734
Tomra Systems Asa 10,000 264,761 AP Moller-Maersk AS 210 340,261
Base Resources Ltd 1,209,211 259,964
Oakley Capital Investments
Fund 146,000 321,119
Sensyne Health Plc 95,000 259,433 Alps Electric Co Ltd 10,000 287,907
Melrose Industries Plc 136,890 257,743 Solaredge Technologies Inc 6,750 283,348
Solaredge Technologies Inc 6,750 249,755 Xilinx Inc 3,600 282,546
Iridium Communications Inc 20,000 246,095
VinaCapital Vietnam
Opportunities Fund 61,060 281,864
Premier Oil Plc 183,000 241,235
TKH Group NV-Dutch
Certificate 5,300 267,074
Danske Bank A/S 9,000 236,379 Orocobre Ltd 46,000 245,927
Transocean Ltd 16,000 208,077 Genus Plc 6,800 239,671
Ceres Power Holdings Plc 87,000 185,082 Fanuc Corp 1,000 222,604
Starbucks Corp 3,200 212,742
Danske Bank A/S 9,000 199,565
Mastercard Inc 950 194,991
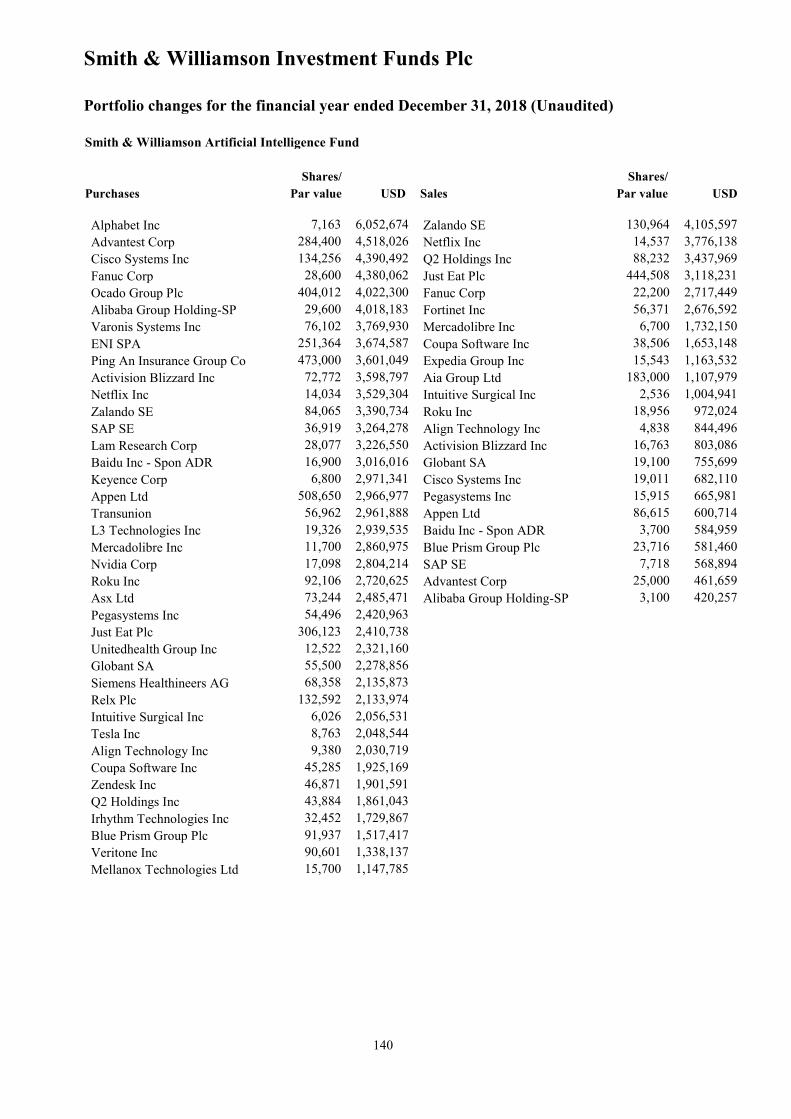
Smith & Williamson Investment Funds Plc
Portfolio changes for the financial year ended December 31, 2018 (Unaudited)
140
Smith & Williamson Artificial Intelligence Fund
Shares/
Shares/
Purchases Par value USD Sales Par value USD
Alphabet Inc 7,163 6,052,674 Zalando SE 130,964 4,105,597
Advantest Corp 284,400 4,518,026 Netflix Inc 14,537 3,776,138
Cisco Systems Inc 134,256 4,390,492 Q2 Holdings Inc 88,232 3,437,969
Fanuc Corp 28,600 4,380,062 Just Eat Plc 444,508 3,118,231
Ocado Group Plc 404,012 4,022,300 Fanuc Corp 22,200 2,717,449
Alibaba Group Holding-SP 29,600 4,018,183 Fortinet Inc 56,371 2,676,592
Varonis Systems Inc 76,102 3,769,930 Mercadolibre Inc 6,700 1,732,150
ENI SPA 251,364 3,674,587 Coupa Software Inc 38,506 1,653,148
Ping An Insurance Group Co 473,000 3,601,049 Expedia Group Inc 15,543 1,163,532
Activision Blizzard Inc 72,772 3,598,797 Aia Group Ltd 183,000 1,107,979
Netflix Inc 14,034 3,529,304 Intuitive Surgical Inc 2,536 1,004,941
Zalando SE 84,065 3,390,734 Roku Inc 18,956 972,024
SAP SE 36,919 3,264,278 Align Technology Inc 4,838 844,496
Lam Research Corp 28,077 3,226,550 Activision Blizzard Inc 16,763 803,086
Baidu Inc - Spon ADR 16,900 3,016,016 Globant SA 19,100 755,699
Keyence Corp 6,800 2,971,341 Cisco Systems Inc 19,011 682,110
Appen Ltd 508,650 2,966,977 Pegasystems Inc 15,915 665,981
Transunion 56,962 2,961,888 Appen Ltd 86,615 600,714
L3 Technologies Inc 19,326 2,939,535 Baidu Inc - Spon ADR 3,700 584,959
Mercadolibre Inc 11,700 2,860,975 Blue Prism Group Plc 23,716 581,460
Nvidia Corp 17,098 2,804,214 SAP SE 7,718 568,894
Roku Inc 92,106 2,720,625 Advantest Corp 25,000 461,659
Asx Ltd 73,244 2,485,471 Alibaba Group Holding-SP 3,100 420,257
Pegasystems Inc 54,496 2,420,963
Just Eat Plc 306,123 2,410,738
Unitedhealth Group Inc 12,522 2,321,160
Globant SA 55,500 2,278,856
Siemens Healthineers AG 68,358 2,135,873
Relx Plc 132,592 2,133,974
Intuitive Surgical Inc 6,026 2,056,531
Tesla Inc 8,763 2,048,544
Align Technology Inc 9,380 2,030,719
Coupa Software Inc 45,285 1,925,169
Zendesk Inc 46,871 1,901,591
Q2 Holdings Inc 43,884 1,861,043
Irhythm Technologies Inc 32,452 1,729,867
Blue Prism Group Plc 91,937 1,517,417
Veritone Inc 90,601 1,338,137
Mellanox Technologies Ltd 15,700 1,147,785

Smith & Williamson Investment Funds Plc
Unaudited Section (continued)
141
UCITS V Remuneration Disclosure
Smith & Williamson Investment Management Ireland Limited (the “Management Company”) is the authorised
management company of Smith & Williamson Investment Funds plc (the “Fund”) and is part of the Smith &
Williamson group of companies. In this section, the terms “Smith & Williamson” or “Firm” refer to that group, and
each of the entities in that group globally, unless otherwise specified.
This section of the annual report has been prepared in accordance with the Undertakings for Collective Investment in
Transferable Securities (the “UCITS Directive”) and the ‘Guidelines on sound remuneration policies’ issued by the
European Securities and Markets Authority under the UCITS Directives.
This section has also been prepared in accordance with the relevant provisions of the Financial Conduct Authority
Handbook (COLL 4.5.7).
Remuneration Policy
The remuneration committee report contained in pages 58-61 of the Smith & Williamson Report and Financial
Statements for the year ended 30 April 2018 (available http://smithandwilliamson.com/about-us/financial-reports)
includes details on the remuneration policy. The remuneration committee comprises five non-executive directors and
is governed by formal terms of reference, which are reviewed and agreed annuallyby the board. The committee met
eight times during 2017-18.
The main principles of the remuneration policy are:
to align remuneration with the strategy and performance of the business
to ensure that remuneration is set at an appropriate and competitive level taking into account market rates and
best practice
to foster and support conduct and behaviours in line with our culture and values
to maintain a sound risk management framework
to ensure that the ratio between fixed and variable remuneration is appropriate and does not encourage
excessive risk taking
to comply with all relevant regulatory requirements
to align incentive plans with business strategy and shareholder interests
The policy is designed to reward partners, directors and employees for delivery of both financial and non-financial
objectives which are set in line with company strategy. As part of a “balanced scorecard” approach to variable
remuneration non-financial criteria including, but not limited to, compliance and risk issues, client management,
supervision, leadership and teamwork are considered alongside financial performance.
Remuneration Systems
The committee reviews all partners and directors fixed and variable remuneration. In addition, it approves hurdles and
awards in respect of equity incentive plans, namely a deferred option plan, Equity Matching Plan, Matching Share Plan,
Executive Long Term Incentive Plan and an Investment Management Long Term Incentive Plan.
The remuneration of partners is made up of a fixed profit share, discretionary bonus profit share and non-discretionary
bonus profit share. The remuneration of employees typically comprises of a salary with benefits including pension
contribution, life assurance, permanent health insurance, private medical insurance, SAYE scheme and a discretionary
bonus scheme. Partners, directors and associate directors are also eligible to participate, at the invitation of the
committee, in the equity incentive plans described above.
When considering variable remuneration for the executive directors, the committee takes account of overall business
profit for the group and divisions, achievement of both financial and non-financial objectives (including adherence to
the principles of treating customers fairly, conduct risk, compliance and regulatory rules), personal performance and
any other relevant policy of the board in respect of the year ended 30 April 2018. The committee agrees the individual
allocation of variable remuneration and the proportion of that variable remuneration to be awarded as equity.

Smith & Williamson Investment Funds Plc
Unaudited Section (continued)
142
There is no separate Remuneration Policy currently applying to the Management Company. Two directors waive their
rights to remuneration; two receive €25,000 pa, and the chairman is paid €30,000 pa. These figures are disclosed in the
prospectus and in the annual report and accounts. No bonuses or other benefits are paid.
Quantitative Disclosures
The table below provides an overview of the aggregate 2018 total remuneration paid by the Fund to directors of the
Management Company and the number of beneficiaries.
Due to the Firm’s operational structure, the information needed to provide a further breakdown of remuneration
attributable to the Fund is not readily available and would not be relevant or reliable. However, for context, the
Management Company manages 11 UCITS, with a combined AUM as at 31 December 2018 of £833m
Fixed
remuneration
Variable
remuneration
Total
remuneration
Number of
beneficiaries
Directors €80,000 Nil €80,000 3