smile.oregonstate.edu · web viewunderwater gliders are a type of underwater research tool. it is...
TRANSCRIPT

Heading: RCRVTitle: Visualizing Ocean Data
Sub Title: Jane the Glider
Levels: Grades 5-12Content Areas: Math, Climate Sciences, Marine SciencesLesson Time: 45-90 Minutes
Next Generation Science Standards: 5-ESS2-1, MS-ESS2-6, HS-ESS2-4
Disciplinary Core IdeasEarth’s Materials and Systems
Crosscutting ConceptsSystem and System ModelsCause and Effect
Science and Engineering PracticesDeveloping and Using Models
Materials:Visualizing Ocean Data PowerPointStudent Worksheets Excel Glider Data FileTableau Public (app available via iOS and Android)Laptop/PC/iPAD
Description:In this lesson students will access and visualize data collected by Oregon State University’s Glide Jane. Students will use that data to identify key characteristics in the water column and its relationships to ocean circulation.
Outcomes:Students will learn about under water gliders.Students will engage in visualizing data collected by OSU’s Glider Jane.Students will identify key relationships between depth, pressure, density, salinity and temperature as they support ocean circulation.
Guiding Question:How can we visualize data collected by Glider Jane to understand the relationships that drive ocean mixing and circulation?

Background Information:
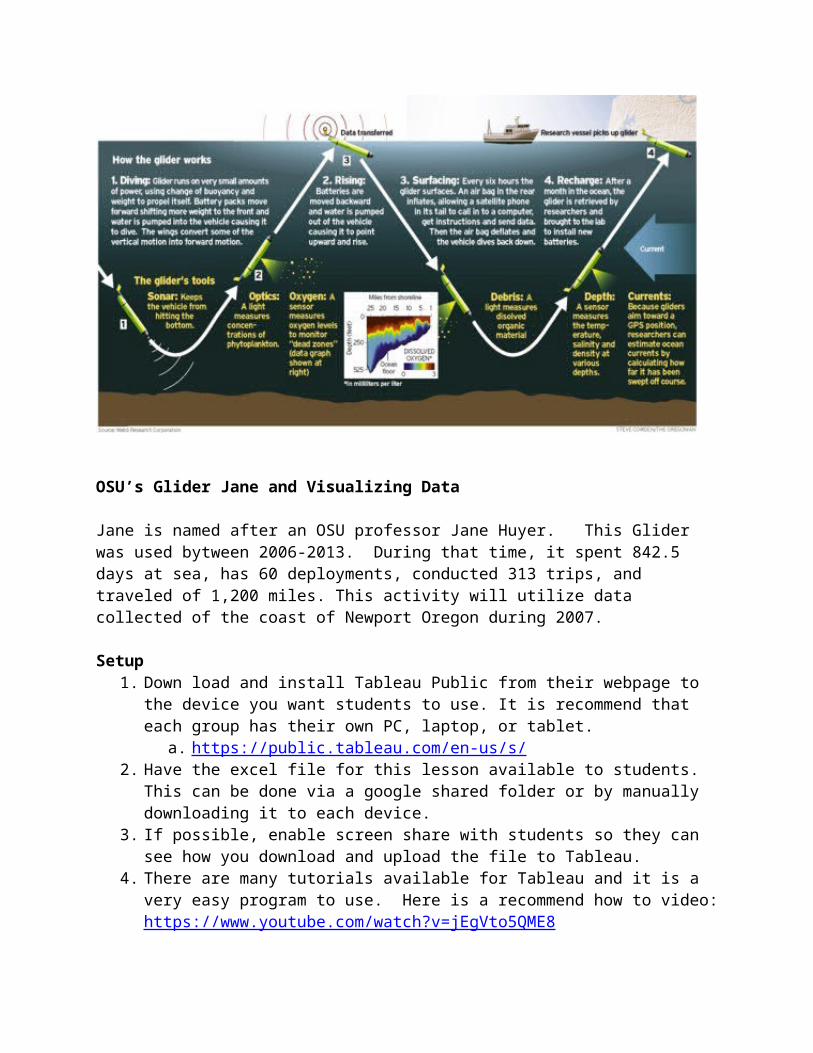
Underwater Gliders are a type of underwater research tool. It is autonomous, meaning that it can be programed to travel long distances, record data, transmit data, and send it back to shore all on its own. They can travel 1/2 knots, or about .6 miles per hour for 3-4 weeks at a time. The glider is about seven feet long, weighs about a hundred pounds, and can carry two computers, several oceanographic sensors, communication equipment, and batteries for power.

In the ocean, gliders travel in a saw tooth pattern by taking on and expelling water to change its buoyancy so the glider can sink and float as it travels along. This process propels the glider in a saw tooth pattern through the ocean. The glider can be used to for the same data collected a research vessel is used for, but at a fraction of the cost.
OSU’s Glider Jane and Visualizing Data
Jane is named after an OSU professor Jane Huyer. This Glider was used bytween 2006-2013. During that time, it spent 842.5 days at sea, has 60 deployments, conducted 313 trips, and traveled of 1,200 miles. This activity will utilize data collected of the coast of Newport Oregon during 2007.
Setup 1. Down load and install Tableau Public from their webpage to the device you want students
to use. It is recommend that each group has their own PC, laptop, or tablet. a. https://public.tableau.com/en-us/s/
2. Have the excel file for this lesson available to students. This can be done via a google shared folder or by manually downloading it to each device.
3. If possible, enable screen share with students so they can see how you download and upload the file to Tableau.
4. There are many tutorials available for Tableau and it is a very easy program to use. Here is a recommend how to video: https://www.youtube.com/watch?v=jEgVto5QME8
Procedure
1. Work through the accompanying PowerPoint.
2. Explain to student what an underwater glider does and that you will be looking at particular data that is used to document ocean circulation and nutrient cycling.
3. Uploading the “Glider Data File”a. Locate the Data File on your device b. Open Tableau Publicc. In the top left of the window, under Connect to a File, select Microsoft Excel.d. Select the file “Glider Data File” and then select open. e. Once the file is loaded, select sheet 1 at the bottom of the page.
4. Now you will be ready to start the lesson. a. You can explore these topics in any order you choose. b. Have students work through the student handout as the complete the following
tasks. 5. Mapping the Path of the Glider by Longitude and Latitude
a. On the far left section of the winder under “Measures” select Longitude and place it in the columns section, then select Latitude and place it in the Rows section.
i. Note: when the items are dragged and dropped to the columns/rows location, you can click the down arrow when hovering over each variable and select “dimensions” this will keep the program from plotting the average longitude and latitude.
b. Zoom at to see the path of the glider. c. Select Map at the top header and add layers to the map by selecting “Map Layers”
i. Here you can add labels similar to Google Maps (e.g. high ways, outdoor coloring, etc.)
ii. Asks students why there is a gap in the data where it looks like the glider was out of that water – What happened there?
1. Possible Answers: Had to be removed to change batteries, get repaired, maintenance, etc.
d. Right Click on “Sheet 1” and rename it to “Glider Map” for easy reference later. 6. Analyzing Changes with Depth over Time
a. In this next task, students will identify relationships between depth and ocean water characteristics that drive deep sea circulation.
b. Add new sheet to the document by clicking on the icon that look like a bar graph with a plus icon. Clicking on it adds a new sheet to the document.
c. Rename that Sheet “Variable Analysis by Time” i. Path of the Glider by time and depth
ii. In the Columns section have the students add Julian Day1. Julian Day is a measurement of time based on the 365 day
calendar. iii. In the row section add Approximate Depth in feet.
1. Change Measure to Averageiv. Ask students – what does this graph show you about the glider?
1. Answer, it shows how the glider traveled up and down through the water in a saw tooth pattern.
2. What does that flat space in the graph mean?a. No data, what not?
v. How does the ocean change as we get deeper in it?

1. Ask students what measure they would like to graph next, and make predictions about the pattern they might see. Be sure to select Measure Average for each variable.
a. Salinityb. Pressurec. Temperatured. Density
2. Ask students to think about what they know about ocean water and how it changes with depth.
a. E.g. deeper ocean water is usually saltier, colder, and denser than surface water.
b. As water changes in any of the above variables, water mixes and churns to distribute nutrients via deep sea ocean circulation.
7. Relationships with Deptha. In this next task, students will identify relationships between depth and ocean
water characteristics that drive deep sea circulation. b. Add new sheet to the document by clicking on the icon that look like a bar graph
with a plus icon. Clicking on it adds a new sheet to the document. c. Rename that Sheet “Variable Analysis by depth”
i. Identifying relationshipsii. In the Columns section have the students add Approximate Depth in feet
1. Julian Day is a measurement of time based on the 365 day calendar.
iii. In the row section add “Approximate Depth in feet”. 1. Change to Dimension via the drop down arrow
iv. Ask students – what relationships might they expect us to see between ocean water characteristics and depth?
1. Ask students what measure they would like to graph next, and make predictions about the pattern they might see. Be sure to select Measure Average for each variable.
a. Salinityb. Pressurec. Temperatured. Density
2. Ask students to explain how the ocean water is changing as the glider went deeper in it
a. E.g. colder, saltier, denser, and increase in pressure. v. Bonus Variables that relate to Sea Life
1. Oxygen – Oxygen decreases as depth increases, you can add this variable to see how it changed either by time or depth.
2. CDOM – is the dissolved Colored Dissolved Organic Matter. This measure is used to indicate the amount of “dead things” cycling through the water. These things, could be eaten by other organisms or deposited as decomposing matter on the sea floor to
support life, similar to how decomposing matter in soil supports life on land.
3. Chlorophyll – is the photosynthetic molecule associated with phytoplankton and can be used to indicate the amount of “living organisms” in the water sample.
Wrapping-Up
Once students have completed the analysis and the worksheet. Have them share out their findings and how their thinking about ocean water changed. What is important for students to know is that changes in water density, temperature, and salinity as a function of depth drive ocean mixing and circulation. Furthermore, CDOM, dissolved O2, and Chlorophyll found in water samples can help to indicate the “health of the ecosystem” by measuring the amount of nutrients (e.g. CDOM), living phytoplankton organisms (e.g. Chlorophyll), and Oxygen found in the water column.
Scaffolding/Extensions
The Dense Seas and the Salty SeasThis lesson compliments other ocean science lessons developed by the RCRV. Particularly those that detail ocean circulation. Those additional activities can be found here.
https://ceoas.oregonstate.edu/ships/rcrv/outreach/https://smile.oregonstate.edu/summer-2019-teacher-workshop
Sample Data Analysis Outputs

References
1. This lesson was developed from a Toledo JR/SR High STEM project developed by Ben Ewing.
http://toledohighstem.weebly.com/glider-project.html
2. The OSU Glider program provides a historical context and data sources used for this activity. They also provide a wealth of background information for underwater gliders.
http://gliderfs.coas.oregonstate.edu/gliderweb/docs/COAS50.pdfhttp://gliderfs.coas.oregonstate.edu/gliderweb/statistics.phphttp://terra.oregonstate.edu/2018/02/towing-the-line/https://www.irso.info/wp-content/uploads/INM2014_Unmanned_Shearman_Kipp.pdfhttps://www.opb.org/news/article/climate-change-pacific-ocean-science-oregon/
Acknowledgements
This lesson was developed as part of the RCRV Program and SMILEat Oregon State University
https://ceoas.oregonstate.edu/ships/rcrv/