smile curves in global value chains: multinationals vs
TRANSCRIPT

Smile curves in global value chains:multinationals vs domestic firms; the U.S. vsChina
著者 Meng Bo, Ye Ming権利 Copyrights 2020 by author(s)journal orpublication title
IDE Discussion Paper
volume 802year 2020-12URL http://doi.org/10.20561/00051910

INSTITUTE OF DEVELOPING ECONOMIES
IDE Discussion Papers are preliminary materials circulated
to stimulate discussions and critical comments
Keywords: smile curve, multinationals, global value chain, trade in value-added, industrial
upgrading, ICT
JEL classification: F6, F13, F15, D57
1: Senior Researcher, IDE-JETRO, Japan
2*: Researcher, Yangtze River Industrial Economic Research Institute, Nanjing University, China ([email protected])
IDE DISCUSSION PAPER No. 802
Smile Curves in Global Value Chains:
Multinationals vs Domestic Firms; the
U.S. vs China
Bo MENG1 and Ming YE2*
Dec. 2020
Abstract
This paper uses the “smile curve” mapping tool with a Y-axis for value-added ratio and an
X-axis for production stages to identify value-added gains, positions, and interdependencies
of multinationals and domestic firms along global value chains (GVCs). Taking the U.S. and
China’s ICT firms’ exporting activities as a target, we find that China’s domestic ICT firms’
value chain appears as a smile curve differing from the U.S. domestic ICT firms’ inverted-U
curve, which reflects the considerable difference in their technical specialization in joining
GVCs; multinationals are good at utilizing each country’s comparative advantages and can
thus arrange value chains as smile curves regardless of whether they are located in the U.S.
or in China; China’s domestic firms have increasingly plugged into most ICT value chains.
All findings reflect how “sticky” the interdependency among countries along GVCs is and
can thus help understanding the impact of the U.S.–China trade war.

The Institute of Developing Economies (IDE) is a semigovernmental,
nonpartisan, nonprofit research institute, founded in 1958. The Institute
merged with the Japan External Trade Organization (JETRO) on July 1, 1998.
The Institute conducts basic and comprehensive studies on economic and
related affairs in all developing countries and regions, including Asia, the
Middle East, Africa, Latin America, Oceania, and Eastern Europe.
The views expressed in this publication are those of the author(s). Publication does
not imply endorsement by the Institute of Developing Economies of any of the views
expressed within.
INSTITUTE OF DEVELOPING ECONOMIES (IDE), JETRO
3-2-2, WAKABA, MIHAMA-KU, CHIBA-SHI
CHIBA 261-8545, JAPAN
©2020 by author(s)
No part of this publication may be reproduced without the prior permission of the
author(s).
1
Smile Curves in Global Value Chains:
Multinationals vs Domestic Firms; the U.S. vs China
Bo MENG1 and Ming YE2*
Abstract: This paper uses the “smile curve” mapping tool with a Y-axis for value-added
ratio and an X-axis for production stages to identify value-added gains, positions, and
interdependencies of multinationals and domestic firms along global value chains
(GVCs). Taking the U.S. and China’s ICT firms’ exporting activities as a target, we find
that China’s domestic ICT firms’ value chain appears as a smile curve differing from the
U.S. domestic ICT firms’ inverted-U curve, which reflects the considerable difference in
their technical specialization in joining GVCs; multinationals are good at utilizing each
country’s comparative advantages and can thus arrange value chains as smile curves
regardless of whether they are located in the U.S. or in China; China’s domestic firms
have increasingly plugged into most ICT value chains. All findings reflect how “sticky”
the interdependency among countries along GVCs is and can thus help understanding
the impact of the U.S.–China trade war.
Highlights
1) A “smile curve” analysis is applied to mapping the geometry of GVCs for ICT firms
2) Value-added gains and positions of multinationals and domestic firms are presented
3) China’s domestic ICT firms’ value chain appears as a smile curve
4) The U.S. domestic ICT firms’ value chain shows an inverted-U curve
5) Multinationals’ ICT value chains appear as smile curves no matter their locations
6) Some China’s domestic service-suppliers are plugging into the high-end of GVCs
Key words: smile curve, multinational enterprise, global value chain, trade in value-
added, industrial upgrading, ICT
1: Senior researcher, IDE-JETRO, Japan
2*: Researcher, Yangtze River Industrial Economic Research Institute, Nanjing
University, China ([email protected])

2
1. Introduction
Global Value Chains (GVCs) divide the production process so that goods may be produced
in stages in a number of different countries with a little value-added at each stage in
accordance with each country’s comparative advantages (Krugman, 1991). Given the
rapid development of GVCs over the past three decades, the “Made in” label, typical of
manufactured goods (ranging from large planes to small electronic devices), which
attributes them to a specific economy, has become an archaic symbol of a bygone era as
most manufactured goods are now “Made in the World” (WTO-IDE, 2011). The
phenomenon of the rise of GVCs, which accompanied a substantial improvement in the
economic efficiency of multinationals, has significantly changed the nature and structure
of international trade (Gereffi & Fernandez-Stark, 2011; WTO, 2019) as well as the
topology of interdependency and influencing powers among countries (Xiao et al., 2020).
According to a recent report (UNCTAD, 2013), 80% of trade takes place in “value chains”
linked to transnational corporations. Furthermore, as shown in Cadestin et al., (2019),
“multinationals account for roughly for one-half of international trade, one-third of
output and GDP and one-fourth of employment in the global economy.”
Meanwhile, the complexity and sophistication of GVCs due to the increasing
inter- and intra-firm trade of intermediate goods and services, which may cross several
national borders multiple times, have also created considerable difficulties, such as those
in understanding “who creates added value for whom” and in formulating policies that
enable countries, industries, and firms with different ownership to clearly identify their
positions, gains, and potential risks in joining or engaging in GVCs. Better
understanding on this issue has very important policy implications as pointed out by the
so-called “Paradoxical Pair of Concerns” (Baldwin et al., 2014) for both developed and
developing countries when they join GVCs. That is to say, owing to the differences in
comparative advantages across countries participating in GVCs, rich countries might
tend to engage in high-end and intangible production activities, such as R&D, design,
and brand building in the upstream stages and after-sales services and marketing in the
downstream stages. Consequently, rich countries might worry about the hollowing out of
their economies as manufacturing jobs are offshored to low-technology, low-wage
countries. Meanwhile, poor countries might tend to focus on low-end and tangible
production activities, such as manufacturing and assembly, and might therefore have
concerns that they are getting the wrong types of jobs and that their economies might be
locked into GVCs at the bottom (low-end) of the so-called “smile curve.”
The concept of the smile curve was first proposed around 1992 by Stan Shih, the
founder of Acer, a technology company headquartered in Taiwan. Shih (1996) observed
that in the personal computer industry, both ends of the value chain command higher
value-added to the product than the middle part of the value chain. If this phenomenon
is presented in a graph with value-added represented on the Y-axis and the value chain
(stages of production located in different places) represented on the X-axis, the resulting
curve appears in the shape of a smile. The logic of the smile curve has been widely used
and discussed in the business literature of GVCs (e.g., Dedrick and Kraemer, 1998;

3
Mudambi, 2008; Shin et al., 2012, etc.). Its theoretical explanation could be traced in the
context of GVCs to three lines of literature.1 They include the business literature
concerning the value chain model (Porter, 1985), GVC governance (Gereffi et al., 2005),
the organizational choices of firms involved in supply chains (Antràs and Helpman, 2008;
Acemoglu et al., 2009; Antràs and Chor, 2013; Alfaro et al., 2015), and the international
trade literature concerning trade in tasks and fragmentation production (Jones and
Kierzkowski, 1990; Feenstra, 1998; Arndt, 1997; Campa and Goldberg, 1997, Yeats, 2001,
Hummels, Ishii and Yi, 2001; Yi, 2003, Grossman and Helpman, 2002a, b; Hanson et al.,
2003; Grossman and Rossi-Hansberg, 2008; Timmer et al., 2014, 2018).
However, the smile curve phenomenon has rarely been identified, measured, or
evaluated by employing real data with explicit consideration of international production
networks. A few studies have tried to identify the smile curve phenomenon using input–
output (IO) data at the industrial level (Kimura, 2003; 2006; Baldwin et al., 2014), firm
level (Saliola and Zanfei, 2009; Rungi and Del Prete, 2018), or using project-level FDI
data (Stöllinger, 2019), and none of them have explicitly considered value-added
propagation processes and country-sector positions along all stages of the value chain.
Ye et al. (2015) provided the pioneering idea in identifying smile curves in GVCs, followed
by Ito and Vézina (2016) and Meng et al. (2020). The originality and innovation of these
works is that they consistently combine both the so-called “trade in value-added” concept
(see Johnson and Noguera, 2012; Koopman et al., 2014; Los et al., 2016) in measuring
value-added gains of countries and sectors along GVCs and the value-added propagation
length (see Antràs et al. 2012; Miller and Temurshoev, 2013; Chen, 2014; Wang et al.,
2017) in measuring positions of countries and industries along GVCs. However, in what
is similar to the previously mentioned literature, one of the most critical comments
regarding these smile curve research studies is that no performance of multinationals
that are considered the main players of GVCs can be explicitly identified in the existing
smile curve analyses.
Concerning the role of multinationals in GVCs, a massive number of case
studies (e.g., Linden et al., 2009; Dedrick et al., 2010; Xing and Detert, 2010; Xing, 2019,
2020) have been developed. These studies rely on “tear down” analyses that assign the
value of individual components to source companies and their countries. These firm- and
product-based case studies can provide intuitive understanding of GVCs in terms of the
activities of multinationals. However, these “tear down” case studies only focus on the
supply chain of a specific firm and particular products and are clearly not representative
of the broader role of production networks and inter-industrial or inter-firm linkages in
the whole value creation process.
Owing to the recent novel data developed by the OECD, the analytical Activities
of Multinational Enterprises (AMNE) database (including Inter-Country IO tables split
according to firm ownership over the period 2005–2016; see Cadestin, et al., 2018a)
makes analyses of multinational production in value-added terms possible (see Cadestin,
et al., 2018b, 2019; Miroudot and Ye, 2019, 2020). This database also enables us to fill
1 For a detailed genealogical map of theoretical frameworks for GVCs, one can refer to Inomata
(2017).

4
the gap between approaches mentioned above in measuring smile curves in GVCs. With
this new data, we borrow the smile curve concept and focus on Information and
Communications Technology (ICT), including many representative fragmentation
products (e.g., smartphones, PCs) exporting firms located in China and the U.S. We aim
to identify value-added gains, positions, and interdependencies of both domestic and
multinational firms when they participate in GVCs. Understanding the gains from GVCs
and their distribution pattern across countries, sectors, and firm ownership is crucial for
policymakers in the context of reconsidering how world trade and production work. So is
having a better understanding of the nature and the impact of the recent U.S.–China
trade conflict, along with better international governance in the era of GVCs.
2. Method and Data
2.1 Conceptual GVC setting for measuring smile curves
GVCs can be shown from various perspectives. To give a better mapping of the geometry
of GVCs, we first need to give a clear conceptual setting about what we are going to
measure. The most popular and simple approach is to focus on the export of a specific
product produced by a specific type of firm and to look at how value is added from one
country, sector, or type of firm to another country, sector, or type of firm throughout the
entirety of production networks, along with how the product is ultimately consumed. For
example, we can use Chinese domestic firms’ ICT exports to the world market as a
starting point for separating the whole value chain into upstream stages and
downstream stages. All countries, sectors, and different types of firms that directly and
indirectly provide intermediate goods and services to the production of ICT exports are
considered participants in the upstream stages along the value chain. All countries,
sectors, and different types of firms involved in the distribution process of those ICT
products to world consumers are considered participants in the downstream stages.
With regard to how to visualize the above conceptual GVC, we need two
fundamental measures. The first measure is used to express the magnitude of the benefit
(i.e., the absolute gain of value-added) for countries, sectors, and firms that are involved
in GVCs. The second measure is the distance between producers and consumers in the
value-added propagation process, which can be used to identify the position of a country,
sector, or firm in a GVC. These two measures have been propounded by Ye et al. (2015)
and expounded by Meng et al. (2020). In the following sections, we simplify the
terminology of mathematics used in their methods.
2.2 Value-added gains from exporting
Following the definition of trade in value-added (TiVA: Johnson and Noguera,
2012), we can use an IO model to measure value-added gains induced by exporting final
goods and services. The advantage of using TiVA is that it can trace value-added created
upstream (GDP by sector) and absorbed downstream (final demands by product) without

5
any double counting because all transaction of intermediates across countries, sectors,
and firms are treated as endogenous variables (see Koopman et al., 2014).
For ease of explanation, consider a closed national IO model as follows:
𝐱 = 𝐀𝐱 + 𝐲, (1)
where 𝐱 is the N × 1 gross output vector with N sectors, 𝐲 is the N × 1 final demand
vector, and 𝐀 is the N × N input coefficient matrix (the share of intermediate input in
output). In other words, all gross output (total supply) must be used either as an
intermediate product or as a final product (total demand). This equation expresses the
ex-post equilibrium of market supply and demand in a closed economy. After rearranging
terms, we have the following:
𝐱 = (𝐈 − 𝐀)−𝟏𝐲 = 𝐋𝐲, (2)
where 𝐋 denotes the N × N block matrix, commonly known as a Leontief inverse, which
is the total requirement matrix that gives the amount of gross output required for a one-
unit increase in final demand. We define 𝐯 as a 1 × N value-added coefficient vector.
Each element (vs) in 𝐯 shows the share of value-added in the gross output of sector s.
Then, we can measure the value-added gained (𝛑k) by sector induced by exports (𝐞k) of a
final product k as follows:
𝛑k = �̂�𝐋𝐞k, (3)
where, �̂� is the diagonal matrix of 𝐯, 𝐞k is the N × 1 vector, with just an element of the
exported final product k. Without loss of generality, this model can be applied to an inter-
country input–output (ICIO) model.
2.3 GVC position index
By definition, in an IO system, the following equation always holds true:
𝐯𝐋 = 𝐯(𝐈 + 𝐀 + 𝐀𝟐 + 𝐀𝟑 + ⋯ ) = 𝐮′ (4)
where 𝐮′ denotes the transformed 𝐮 (an N × 1 unit vector). The value-added (𝐯s) of a
specific sector s induced by the final demand (𝐲k) of a specific product k can be given as
𝐯s𝐋𝐲k (a scalar). Following Antràs et al. (2012) and Meng et al. (2020), the distance from
a specific sector s (value-added creator) to consumers of a specific final product k, can be
defined as follows:
Dsk = 𝐯s(1𝐈 + 2𝐀 + 3𝐀𝟐 + 4𝐀𝟑 + ⋯ )𝐲k/𝐯s𝐋𝐲k = 𝐯s𝐋2𝐲k/𝐯s𝐋𝐲k. (5)
The aforementioned indicator measures the total number of value-added propagation
6
steps, on average, when the value-added of a specific sector upstream is embodied in all
downstream steps and ultimately reaches the final demand of a specific product. Without
loss of generality, this distance measure could be applied to the ICIO model as well.
2.4 Data
Data used is the OECD analytical AMNE database, wherein the conventional ICIO
tables are split according to firm ownership (D: domestic- and F: foreign-owned) over the
period 2005–2016, with 60 economies (including the “rest of the world” as one economy)
and 34 sectors in the ISIC Rev. 4 classification at the basic price.2 It should be noted that
foreign-owned firms are defined as foreign affiliates who have at least 50% foreign
ownership and that domestic-owned firms include domestic multinationals (domestic
firms with foreign affiliates) and domestic firms not involved in international investment.
The layout of this table with N sectors (N=34), G economies (G=60), and 2 types of firms
is shown in Table 1.
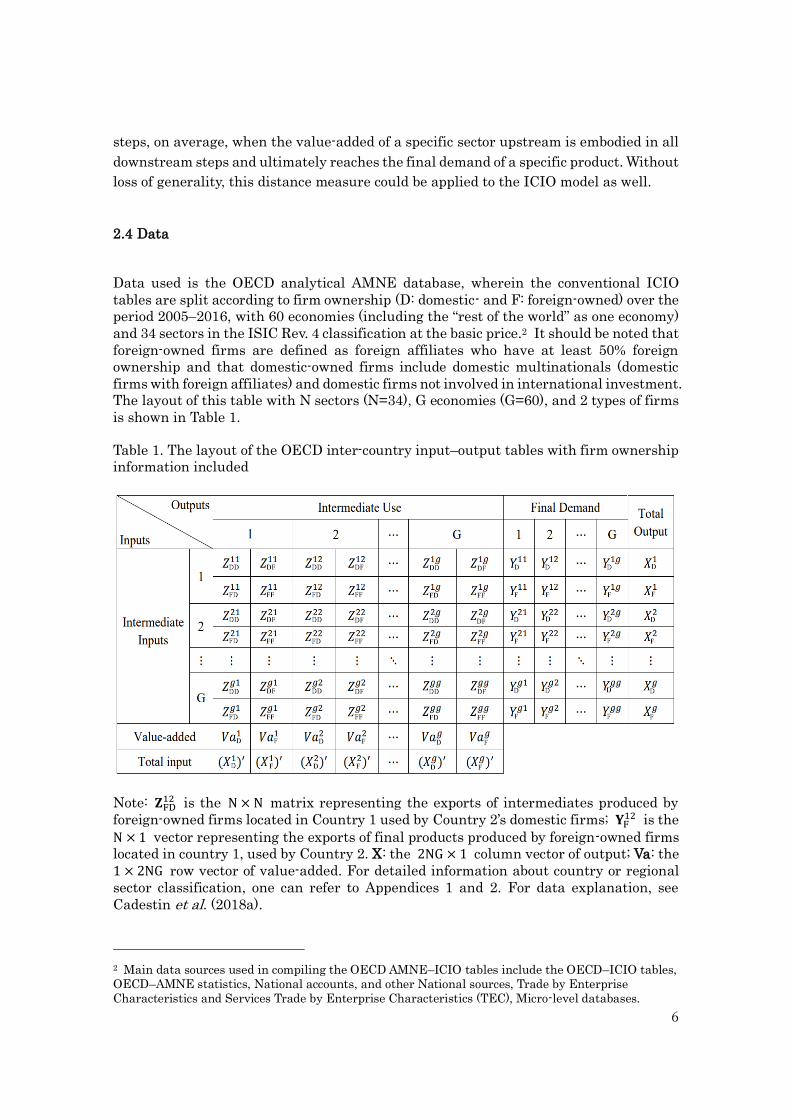
Table 1. The layout of the OECD inter-country input–output tables with firm ownership
information included
Note: 𝐙FD12 is the N × N matrix representing the exports of intermediates produced by
foreign-owned firms located in Country 1 used by Country 2’s domestic firms; 𝐘F12 is the
N × 1 vector representing the exports of final products produced by foreign-owned firms
located in country 1, used by Country 2. X: the 2NG × 1 column vector of output; Va: the
1 × 2NG row vector of value-added. For detailed information about country or regional
sector classification, one can refer to Appendices 1 and 2. For data explanation, see
Cadestin et al. (2018a).
2 Main data sources used in compiling the OECD AMNE–ICIO tables include the OECD–ICIO tables,
OECD–AMNE statistics, National accounts, and other National sources, Trade by Enterprise
Characteristics and Services Trade by Enterprise Characteristics (TEC), Micro-level databases.

7
3. Empirical Results
3.1 How to map the geometry of GVCs
By first employing the yearly AMNE–ICIO data to derive binomial regression and then
labeling the most important participants (country-sector-firm) with value-added gain
(represented by the size of circles) above a threshold percentage (e.g., 0.1% of the total
induced value-added in the whole value chain) in both upstream and downstream stages,
a map of the ICT exports-related GVCs can be created. As shown in the figures of the
next section, the Y-axis denotes the value-added ratio (value-added gained by producing
one unit US$ worth of output). The X-axis denotes position, measured by the value-added
propagation length between global consumers of ICT products and a specific
participating firm in a specific industry along the corresponding value chain (a kind of
normalized distance to consumers3). The smooth line is fitted by binomial regression
smoothing, and the shadowed area represents the confidence interval around the smooth
line (for detailed robustness check on the GVC position index and the shape of smile
curves, one can refer to Appendices 3 and 4). This GVC mapping can help us identify
whether the so-called “smile curve” exists, and if so, what the participants (countries,
sectors, and firms) of a specific value chain, as well as their positions and gains, look like.
3.2 Value-added gains in Chinese domestic ICT firms’ export-related value chain
As shown in Figures 1-a and 1-b, the value chain for Chinese domestic ICT firms’
exports to the world market clearly appears as a “smile curve” (to save space here, we
show only 2005 and 2016). Several stylized facts can be observed from these curves.
1) Chinese domestic ICT firms (CHN_D13) were located at the middle–bottom (low-end)
of the smile curve although they constituted the largest beneficiary in terms of value-
added gain, the reasons for which are several. First, the participation pattern of
Chinese domestic ICT firms in GVCs at the early stage of China’s economic
development was to export labor-intensive assembly products, partly including the
acceptance of foreign outsourcing tasks, because of cheap labor costs and abundant
labor supply inside China and the lack of industrial capital and technology. When
compared with the traditional production process, the assembly process depends on
a greater amount of parts and components, including imported intermediates. This
makes the value-added ratio of Chinese domestic ICT firms very low, thus explaining
their location at the lowest position in this smile curve. This is also the reason for
which many other domestic firms as well as foreign countries that directly and
3 Our position measure as shown in Equation 2 represents the distance from a specific industry to
consumers who consume a specific final product. In other words, the bigger this measure the further
the industry from the consumers. Therefore, when putting this industry along the X-axis (the bigger its
X-axis figure the closer the industry to the consumers), we need to make an inverse transformation for
the distance Dsk, such as by using a specific value (e.g., the maximum value of all industries’ distances
to industry k upstream: max (D.k)) minus the Dsk value.

8
Figure 1a. Chinese domestic ICT firms’ export-related value chain (2005)
Figure 1b. Chinese domestic ICT firms’ export-related value chain (2016)
indirectly provide intermediate products to Chinese domestic ICT firms have been
involved in the upstream segment of this value chain. In addition, to deliver those
assembly ICT products to users around the world, foreign after-services industries
are also needed. Thus, more foreign countries are involved in the downstream stages
of this value chain. Therefore, Chinese domestic ICT firms are naturally located in

9
the middle–bottom of this smile curve. The value-added gain, then, is self-evident, as
Chinese domestic ICT firms were the most direct player in the production of ICT
exports.
2) Many other Chinese domestic firms in different sectors (e.g., in the 2005 case,
CNH_D21: Wholesale and retail; CHN_D22: Transportation; CHN_D2: Mining;
CHN_D11: Basic Metals; CHN_19: Electricity; CHN_8: Chemicals) also benefited by
participating in the upstream stages of this value chain. This was because most of
the intermediate inputs directly and indirectly needed by the Chinese domestic ICT
firms to produce exports were presumed to come from other Chinese domestic firms.
3) Other countries’ (regions) domestic firms located in the upstream position of this
value chain also obtained a relatively large portion of value-added gain, particularly
their ICT firms (TWN_D13, KOR_D13, JPN_D13, USA_D13, for the 2005 case). This
clearly shows the strong cross-border, intra-industrial linkages between China and
the US as well as linkages with other East Asian economies. This is partly because
of the relatively broad industry classification of ICT in the AMNE (broader
classification used, more intra-industrial transaction appears). In addition, we can
also see that other countries’ domestic non-ICT firms located in much higher
upstream stages could also enjoy value-added gains by joining this value chain. They
include many business services providers (USA_D29, JPN_D29, KOR_D29), as well
as some manufacturing intermediate suppliers (JPN_D14: Electrical equipment,
JPN_D11: Basic metals, JPN_D8: Chemicals). This reflects the level of inter-
industrial linkages between China and foreign economies.
4) Although the value-added gain was not substantial, it can still be easily identified in
the upstream stage of this value chain for 2005, with the existence of beneficiaries,
including both multinationals located in China (CHN_F29: Business services,
CHN_F13: ICT) and abroad (SGP_F13: ICT; TWN_F13: ICT; THA_F13: ICT,
USA_F21: Business Services). This reflects the fact that multinationals, both inside
and outside China, have also been involved in Chinese domestic ICT firm value
chains through the provision of intermediate goods directly and indirectly although
their presence was not substantial when compared with that of domestic firms. This
is likely because most of those multinationals located in China focus on the
production of final products rather than intermediates.
5) The main beneficiaries in the downstream stage of this value chain include service
industries, such as Wholesale and Retail (21) and Transportation (22) in the U.S.,
Japan, the UK, Mexico, and France. This can be explained by the fact that China’s
domestic firms’ ICT products were mainly exported to these countries, which had to
be delivered to their countries’ domestic consumers mainly through the use of
domestic and international wholesale and transportation services provided by both
their domestic and multinational firms.
Upon examining the evolution of Chinese domestic ICT firms’ exports-related
smile curves over time, no significant change in the shape of this curve is seen, but some
remarkable structural changes concerning the participating countries and firms can be
observed.

10
1) More Chinese domestic manufacturing firms have been involved in the upstream
stage of this value chain. Their share of value-added gain in the whole chain
increased from 26.3% to 38.9% over time (note the change in the corresponding circle
size between 2005 and 2016). This is mainly because Chinese domestic
manufacturing firms experienced a relatively quick industrial upgrading over this
period and can thus provide more complex intermediate inputs to Chinese domestic
ICT firms as a replacement for foreign imports. For instance, JPN_D14, JPN_D11,
JPN_D8 appeared in 2005 and were largely replaced by the corresponding Chinese
domestic firms (CHN_D14, CHN_D11, CHN_D8) in 2016.
2) More Chinese domestic service firms have been involved in the upstream stage of
this value chain; meanwhile, their value-added gains account for a much larger
portion than those of other manufacturing firms do. In addition, in 2005, the largest
upstream beneficiaries were the traditional service providers, domestic wholesale
and retail (CHN_D22), and transportation firms (CHN_D21), while in 2016, domestic
financial and insurance firms (CHN_D27) and other business services firms
(CNH_29) showed a remarkable increasing presence, which took over the share
provided by the U.S., Japan, and Korea’s domestic services firms (USA_D29,
JPN_D29, KOR_D29). This clearly reflects the ongoing domestic-oriented
servitization of the whole ICT value chain in China since the time increasingly
modern domestic services have been embodied in China’s ICT exports.
3) The value-added ratio of the U.S. domestic ICT firms (USA_D13) that were the most
important foreign suppliers of intermediate goods in the upstream of this value chain
increased from 56.4% in 2005 to 81.6% in 2016, while the figure for China’s domestic
ICT firms (CHN_D13) declined slightly, from 24.6% in 2005, to 22.4% in 2016. This
reflects the fact that the U.S. domestic ICT firms increasingly concentrated on high-
tech production of more complex intermediate goods (e.g., computer processors),
whereas Chinese domestic ICT firms even then took on more tasks, such as
assembling final products using low-skilled labor. This result is very consistent with
the existing literature (Ye et al., 2015 and Meng et al., 2020).
4) Multinational ICT firms in China (CHN_F13) enhanced their participation in the
upstream of this value chain by providing intermediate goods to Chinese domestic
ICT firms directly and indirectly as a means of realizing more value-added gain. This
is probably because, increasingly, Japanese, Korean, and Taiwanese domestic ICT
firms (JPN_D13, KOR_D13, TWN_D13) located upstream as intermediate goods
providers to Chinese domestic ICT firms moved their production capacity to China
to be much closer to their consumer. This can be confirmed by the shrinking share of
value-added gain for JPA_D13 (66.7% down), KOR_D13 (75.9% down), and
TWN_D13 (76.2% down) and the increasing share of CHN_F13 (5.8 times greater) in
the 2016 figure when compared with the corresponding value-added gains in the
2005 figure.
5) Some developing countries’ services firms (ROW_D21, MEX_D21, ROW_D22,
BRA_D21, RUS_D21, IND_D21) enhanced their participation at the downstream
stage of this value chain. This reflects the fact that those countries imported more

11
Chinese ICT products, including both intermediate goods and final products, which
need to be shipped to their domestic users. Thus, their domestic services firms
(wholesale, retail, and transportation) are able to enjoy more value-added gain.
Figure 2a. China-based multinational ICT firms’ export-related value chain (2005)
Figure 2b. China-based multinational ICT firms’ export-related value chain (2016)
12
3.2 Value-added gains in the China-based multinational ICT firms’ export-related value
chain
Figures 2-a and 2-b show the participants’ value-added gains as well as their positions
in the value chain related to China-based multinational ICT firms’ exports. Both clearly
appear in the form of “smile curves.” When compared with the smile curves related to
Chinese domestic ICT firm exports (Figures 1-a and 1-b) over time, a few findings can be
gleaned:
1) The position of China-based multinational ICT firms’ exports (CHN_F13) was at the
middle–bottom of the value chain, which is similar to the position of Chinese
domestic ICT-exporting firms (CHN_D13) in Figures 1a and 1b. However, the share
of CHN_F13’s value-added gain and its position in Figures 2a and 2b were smaller
and lower than those of CHN_D13 were in Figures 1a and 1b, respectively. This is
mainly because almost half of China-based multinational ICT firms are doing
processing trade, which is more labor-intensive and requires more imported
intermediate input when compared with Chinese domestic ICT-exporting firms.
2) When compared with Figure 1a, more foreign domestic firms were involved in the
upstream stage of the value chain (Figure 2a). The share of value-added gain for
these firms in the upstream stage of the value chain was 36.9% in Figure 2a, which
was much greater than that in Figure 1a (27.6%). On the one hand, this is consistent
with the fact that many China-based multinational ICT firms are doing processing
exports, which need a more substantial amount of intermediate inputs from other
countries. On the other hand, this also reflects the fact that multinational ICT value
chains have more variation in arranging intermediate inputs from different locations
and types of firms.
3) There is no significant change in the shape of this value chain between 2005 and
2016, but a similar structural change concerning the participating members
upstream can be clearly observed. To be precise, Chinese domestic firms, including
those involved in both manufacturing and services, enhanced their industrial
upgrading, thus replacing foreign firms as suppliers of intermediate goods and
services to China-based multinational ICT firms (the share of value-added gain by
Chinese domestic firms upstream increased from 28.2% to 44.6% over the period).
This fact can also be partly confirmed by a recent case study having to do with the
iPhone X (Xing, 2020): Chinese companies “contributed 25% of the value-added to
the iPhone X.”
3.3 Value-added gains in the U.S. domestic ICT firms’ export-related value chain
Figures 3-a and 3-b show the mapping result for the value chain in terms of the U.S.
domestic ICT firms’ exports. A U-shaped smile curve cannot be clearly identified. Value
chains may not always look like a smile curve, particularly for the U.S.’ domestic ICT
firms. The main features of these figures and their changes over time are summarized
as follows:

13
Figure 3a. The U.S. domestic ICT firms’ export-related value chain (2005)
Figure 3b. The U.S. domestic ICT firms’ export-related value chain (2016)
1) The relatively higher value-added ratio of the U.S.’ domestic ICT firms when
compared with that of other participants upstream and downstream along this value
chain is the main reason that it does not look like a smile curve. This ratio even
increased from 56.4% to 81.6% between 2005 and 2016, which made the curve
assume a somewhat inverted-U shape. This clearly reflects the fact that producing

14
one unit of output by the U.S.’ domestic ICT firms can create more value-added. This
is probably due to the fact that more high-skilled laborers with higher wages, and
more sophisticated capital with higher rent are used in these firms.
2) In 2005, there were still many domestic manufacturing firms involved in the
upstream stage of this value chain, but in 2016, many of them disappeared, with only
Fabricated Metals (USA_12) and Chemicals (USA_D8) showing a presence as a
supplier of intermediates. The share of value-added gain of these firms was 23.6% in
2005 but shrunk to 9.3% in 2016. Something similar happened to foreign domestic
manufacturing firms located upstream in this value chain (the share of their value-
added gain declined from 8.4% to 3.4% over the period). In 2016, only ICT firms
located in China (CHN_D13 and CHN_F13) enjoyed a value-added gain by joining
the upstream stage of this value chain. The change is also reflected by the expanding
share of value-added gain by USA_D13 in this value chain, from 55.9% in 2005 to
77.9% in 2016. Therefore, we can conclude that the US domestic ICT firms’ value
chain has experienced significant technological upgrading, which has transitioned to
the production of very high value-added products (depending on the availability of
high-skilled labor and high-tech capital) without relying on more domestic and
foreign intermediate input. Those products (being traced at a more detailed product
level by trade statistics) include units of automatic data processing machines
(HS847150, accounting for about 6.3% of their ICT exports), surgical instruments
and appliances, and electro-diagnostic apparatus (HS901819, accounting for about
2.9% of their ICT exports).
3.4 Value-added gains in the U.S.-based multinational ICT firms’ export-related value
chain
Figures 4-a and 4-b show the mapping results for the value chain in terms of the U.S.-
based multinational ICT firms’ exports, which clearly appear as “smile curves.” When
compared with previous figures, the main findings can be presented as follows:
1) The pattern of value chains shown in Figures 4a and 4b is very similar to that in
Figures 2a and 2b. To be precise, the production of multinational ICT firms’ exports
in both China and the U.S. depended highly on a large amount of intermediate input
provided by both domestic and foreign suppliers at the upstream stages of the value
chain. This is probably because the U.S. economy is big enough with a relatively large
differential of primary costs across states; thus, multinational ICT firms can still
arrange their value chains to produce assembly products and export them to the
world market. Another factor possibly contributing to this phenomenon is that most
U.S.-based multinational ICT firms’ exports are final goods although they might be
different from those made by China-based multinational ICT firms in terms of
quality and function (we cannot identify the difference because of the broad
classification of sectors used in the data).
2) As mentioned earlier, China has experienced relatively rapid industrial upgrading,
which has also enabled more Chinese domestic manufacturing firms (CHN_D13: ICT,

15
CHN_D11: Basic metals, CHN_D14: Electrical equipment, CHN_D8: Chemicals)
with lower value-added ratios to be suppliers of intermediate goods in a position that
is upstream of U.S.-based multinational firms in the value chain. This also makes
this smile curve much flatter. Simultaneously, Chinese domestic financial and
insurance (CHN_D27) and business services (CHN_D29) firms could also get value-
added gain from this value chain. This is mainly because more services are embodied
in Chinese domestic firm-produced intermediate goods used directly and indirectly
by U.S.-based multinational ICT firms.
Figure 4a. The U.S.-based multinational ICT firms’ export-related value chain (2005)
Figure 4b. The U.S.-based multinational ICT firms’ export-related value chain (2016)

16
4. Conclusion
With U.S.-based and China-based multinational ICT firms’ exporting activities over the
period 2005–2016 as our analytical target, our empirical results show that the value
chains in terms of China-based multinational ICT firm exports clearly appear as “smile
curves,” wherein the ICT-exporting firms take the largest portion of value-added gain
but only obtain very low value-added per unit exported. Thus, they are located at the
low-end along these curves. This result is very evident for China-based multinational
ICT firms in much the same way as the findings from the case study on iPhone’s supply
chain. The value chain, as it relates to the U.S. domestic ICT firms’ exports, shows a
much steeper inverted-U-shaped smile curve over time, in which the U.S. domestic ICT
firms take the majority of value-added gain with much less usage of intermediate inputs
provided by both domestic and foreign firms over time. This result clearly reflects the
quick technology upgrading and specialization of U.S. domestic ICT firms, which can
create more value-added per unit of output, relying on more domestic, high-skilled labor
and sophisticated capital. The value chains in terms of U.S.-based multinational ICT
firms’ exports also clearly appear as “smile curves,” implying that multinationals can
still find opportunities in the U.S. to arrange value chains as they do in China because
the U.S. economy is big enough with large differentials of primary costs across states as
well as the ease of importing cheaper intermediate goods with lower import tariff rates
from the world market. Our results also show that more Chinese domestic firms
including both manufacturing and services suppliers have been increasingly involved at
the upstream stage of almost all smile curves identified. This clearly reflects the quick
industrial upgrading happening in China, which has enabled more Chinese domestic
firms to replace other suppliers in GVCs.
On the basis of the foregoing findings, we can discuss several highly important
policy implications on the recent bilateral trade conflicts between the U.S. and China.
First, the recent U.S.–China trade conflicts are due to very complex political, economic,
institutional, and cultural factors, which are clearly beyond the scope of our smile curve
analyses. However, on the basis of our results, at least from the economic perspective,
we can say that GVCs could play a very important role as an automatic stabilizer of those
trade conflicts. This is mainly because the development of GVCs is an irreversible
process of the ongoing globalization, which is mainly based on each country’s
comparative advantages dominated by firms rather than governments; thus, the whole
economic efficiency could be guaranteed in the long run. Any exogenous nonmarket shock
might tentatively impact GVCs but cannot change the fact that GVCs do follow market
mechanisms. Further, the context of the current U.S.-China trade conflicts is totally
different from those of previous U.S.–Japan trade conflicts, which occurred during 1970–
1980. For example, the U.S. and Japan were competitors in exporting cars during 1970–
1980, but the U.S. and China are both competitors and collaborators in producing ICT
products (e.g., smart phones) in the era of GVCs. Without the existence of a competition–
collaboration dynamic, nobody can imagine how such high-quality and cheap (referring
to its function) smart phones can be produced (assembled) in China and exported all over

17
the world, while bringing substantial benefits to our lives, as well as how the massive
investment in R&D for innovation in the U.S. could be paid off. This relationship can be
clearly recognized in almost all ICT smile curves visualized in the paper.
On the other hand, the value creation along GVCs mainly follows the market
mechanism although there is no guarantee that the distribution of value-added gain
across countries, sectors, firms, or individuals has been accepted by individuals as
income could always remain equal. This relates not only to the income distribution and
redistribution systems adopted domestically, for example, the growing wage gap across
sectors with different levels of GVC involvement or between high-skilled and low-skilled
labor inside some high-level GVC-participating sectors (for further discussion on the U.S.,
see Meng et al., 2020; on European countries, see Parteka and Wolszczak-Derlacz, 2019)
but also to the global income distribution pattern in terms of income shifts among
multinationals. Examples of this include: “U.S. companies have become more active at
shifting income out of the United States…” (see Klassen and Laplante, 2012),
“…multinational firms alter the distribution of reported profits to take advantage of
losses…” (Simone et al., 2017). This fact has, at least in part, been a driver of the
backlash against globalization and the breaking out of trade conflicts between the U.S.
and China.
Finally, there is a sticky interdependency between the U.S. and China. As both
competitors and collaborators along almost all ICT value chains, the so-called
“Paradoxical Pair of Concerns” (Baldwin et al., 2014) has been widely recognized by both
sides. China would not want to be locked in at the low-end of GVCs (tangible activities)
led by multinationals and would thus be likely to adopt very aggressive (somehow radical)
innovation strategies to support their firms on more intangible activities (R&D, design,
finance, and marketing) (see Cheng et al., 2020). Therefore, as shown in our paper, more
Chinese domestic firms, especially high value-added services suppliers have been able to
climb up the ladder to the high-end and enjoy more value-added gains directly and
indirectly upstream in GVCs. In other words, the quickly increasing presence (or value-
added gain) of Chinese firms in GVCs (meaning the relatively shrinking influencing
power of the U.S.) might be another possible trigger for the U.S.–China trade conflicts.
Therefore, the nature of the current U.S.–China trade conflicts may be similar to
judgments coming from international politics literature: “relative gains are more
important than absolute gains” (Waltz, 1959); “the first concern of states is not to
maximize power but to maintain their position in the system” (Waltz, 1979).

18
Appendix 1 Country/region code in the OECD, Analytical AMNE Database
OECD code OECD countries Non-OECD code Non-OECD economies
AUS 1 Australia ARG 37 Argentina
AUT 2 Austria BRA 38 Brazil
BEL 3 Belgium BGR 39 Bulgaria
CAN 4 Canada CHN 40 China (People's Republic of)
CHL 5 Chile COL 41 Colombia
CZE 6 Czech Republic CRI 42 Costa Rica
DNK 7 Denmark HRV 43 Croatia
EST 8 Estonia CYP 44 Cyprus4
FIN 9 Finland IND 45 India
FRA 10 France IDN 46 Indonesia
DEU 11 Germany HKG 47 Hong Kong, China
GRC 12 Greece MYS 48 Malaysia
HUN 13 Hungary MLT 49 Malta
ISL 14 Iceland MAR 50 Morocco
IRL 15 Ireland PHL 51 Philippines
ISR 16 Israel5 ROU 52 Romania
ITA 17 Italy RUS 53 Russian Federation
JPN 18 Japan SAU 54 Saudi Arabia
KOR 19 Korea SGP 55 Singapore
LVA 20 Latvia ZAF 56 South Africa
LTU 21 Lithuania TWN 57 Chinese Taipei
LUX 22 Luxembourg THA 58 Thailand
MEX 23 Mexico VNM 59 Viet Nam
NLD 24 Netherlands ROW 60 Rest of the World
NZL 25 New Zealand
NOR 26 Norway
POL 27 Poland
PRT 28 Portugal
SVK 29 Slovak Republic
SVN 30 Slovenia
ESP 31 Spain
SWE 32 Sweden
CHE 33 Switzerland
TUR 34 Turkey
GBR 35 United Kingdom
USA 36 United States Source: ReadMe_analytical AMNE.xlsx from the OECD (https://www.oecd.org/sti/ind/amne.htm)
4 Footnote by Turkey: The information in this document with reference to “Cyprus” relates to the southern part of the Island. There is no single authority representing both Turkish and Greek Cypriot people on the Island. Turkey recognizes the Turkish Republic of Northern Cyprus (TRNC). Until a lasting and equitable solution is found within the context of the United Nations, Turkey shall preserve its position concerning the “Cyprus issue”. Footnote by all the European Union Member States of the OECD and the European Union: The Republic of Cyprus is recognised by all members of the United Nations with the exception of Turkey. The information in this document relates to the area under the effective control of the Government of the Republic of Cyprus. 5 The statistical data for Israel are supplied by and under the responsibility of the relevant Israeli authorities or third party. The use of such data by the OECD is without prejudice to the status of the Golan Heights, East Jerusalem and Israeli settlements in theWest Bank under the terms of international law.

19
Appendix 2 Industry (sector) code of the OECD AMNE ICIO data
Code 1 Code 2 Industry
A 1 Agriculture, forestry and fishing
B 2 Mining and extraction of energy producing products
C10T12 3 Food products, beverages and tobacco
C13T15 4 Textiles, wearing apparel, leather and related products
C16 5 Wood and products of wood and cork
C17T18 6 Paper products and printing
C19 7 Coke and refined petroleum products
C20T21 8 Chemicals and pharmaceutical products
C22 9 Rubber and plastic products
C23 10 Other non-metallic mineral products
C24 11 Basic metals
C25 12 Fabricated metal products
C26 13 Computer, electronic and optical products
C27 14 Electrical equipment
C28 15 Machinery and equipment, nec.
C29 16 Motor vehicles, trailers and semi-trailers
C30 17 Other transport equipment
C31T33 18
Other manufacturing; repair and installation of
machinery and equipment
DTE 19
Electricity, gas, water supply, sewerage, waste and
remediation services
F 20 Construction
G 21 Wholesale and retail trade; repair of motor vehicles
H 22 Transportation and storage
I 23 Accommodation and food services
J58T60 24 Publishing, audiovisual and broadcasting activities
J61 25 Telecommunications
J62T63 26 IT and other information services
K 27 Financial and insurance activities
L 28 Real estate activities
MTN 29 Other business sector services
O 30 Public admin. and defence; compulsory social security
P 31 Education
Q 32 Human health and social work
RTS 33
Arts, entertainment, recreation and other service
activities
T 34 Private households with employed persons
Source: ReadMe_analytical AMNE.xlsx from the OECD (https://www.oecd.org/sti/ind/amne.htm)

20
Appendix 3 Robustness check for the GVC position index
To check the robustness of our GVC position index proposed in Section 2.3, we calculate
the distance from sectors by firm type to consumers of a specific product for all countries
and years covered in the OECD’s AMNE–ICIO data. Our conclusion is that although the
evolution of industrial and trade structures might impact this position index, the general
positions of most industries by firm type are unlikely to change frequently or
significantly because the most important determinants of position are the inherent
properties of an industry.
Given space limitations, we merely present one example as shown in Figures
A1 and A2, which represent the distance of all countries, industries, and firms to
consumers of Chinese firm-made ICT products between 2005 and 2016. The larger the
position indicator (the darker the color represented on the right side) the more upstream
the position of the relevant industry and firm in the value chain.
Figure A1. GVC position index for 2005

21
Figure A2. GVC position index for 2016
Appendix 4 Statistical significance of the measured smile curves
We test the significance of smile curves for both China and the U.S. ICT export-related
value chains during the entire data period (2005–2016) using a weighted quadratic term
regression:
vi = α + β1Di + β2Di2 + ϵi
where vi is the value-added ratio (Y-axis) of a participant i who is involved in Chinese-
or U.S.-owned firms’ ICT value chains, α is the fixed effect, Di is the position (X-axis)
of participant i in the measured value chain (based on a normalized distance measure
given in Equation 2) and ϵi is an error term. As shown in Tables 1 and 2, most value
chains measured appear as U-shaped curves except for the value chain concerning U.S.
domestic firms. In the following sections, we provide a detailed explanation. It should be
noted that the sample upstream is 4,080 strong (60 economies×34 sectors×2 types of

22
firms); the sample downstream is 240 strong (60 economies×2 sectors (transportation
and commerce) ×2 types of firms). However, the number of observations may be smaller
than the total sample size. This is because we only count the participants who have
enjoyed value-added gains because they joined the corresponding value chain.
Table 2a. Testing the smile curve for ICT export-related value chain (2005)
USA_D13 USA_F13 CHN_D13 CHN_F13
FE 0.51 *** (0.49 – 0.53)
0.84 *** (0.81 – 0.86)
1.11 *** (1.08 – 1.13)
1.10 *** (1.07 – 1.13)
dis 0.01 (-0.00 – 0.01)
-0.15 *** (-0.16 – -0.14)
-0.26 *** (-0.27 – -0.25)
-0.27 *** (-0.28 – -0.26)
dis^2 0.00 (-0.00 – 0.00)
0.01 *** (0.01 – 0.01)
0.02 *** (0.02 – 0.02)
0.02 *** (0.02 – 0.02)
Observations 4,087 4,095 4,087 4,095
R2 / R2 adjusted 0.037 / 0.036 0.167 / 0.167 0.382 / 0.382 0.369 / 0.369
* p<0.05 ** p<0.01 *** p<0.001
Table 2b. Testing the smile curve for ICT export-related value chain (2016)
USA_D13 USA_F13 CHN_D13 CHN_F13
FE -0.05 *** (-0.08 – -0.02)
0.70 *** (0.67 – 0.73)
0.94 *** (0.91 – 0.97)
0.94 *** (0.91 – 0.97)
dis 0.28 *** (0.27 – 0.29)
-0.08 *** (-0.09 – -0.06)
-0.22 *** (-0.23 – -0.21)
-0.23 *** (-0.24 – -0.22)
dis^2 -0.02 *** (-0.02 – -0.02)
0.01 *** (0.00 – 0.01)
0.02 *** (0.02 – 0.02)
0.02 *** (0.02 – 0.02)
Observations 4,115 4,123 4,115 4,123
R2 / R2 adjusted 0.466 / 0.466 0.045 / 0.044 0.265 / 0.264 0.255 / 0.255
* p<0.05 ** p<0.01 *** p<0.001

23
Reference
Acemoglu, D., Johnson, S., Mitton, T. (2009). Determinants of Vertical Integration:
Financial Development and Contracting Costs. The Journal of Finance 64 (3): 1251-1290.
Alfaro, L., Antràs, P., Chor, D., Conconi, P. (2015). Internalizing Global Value Chains: A
Firm Level Analysis. NBER Working Paper No. w21582.
Antràs, P., Chor, D. (2013). Organizing the Global Value Chain. Econometrica 81 (6):
2127-2204.
Antràs, P., Chor, D., Fally, T., Hillberry, R. (2012). Measuring the Upstreamness of
Production and Trade Flows. NBER Working Paper No.17819.
Antràs, P., Helpman, E. (2008). Contractual Frictions and Global Sourcing. NBER
Working Paper No.12747.
Arndt, S. (1997). Globalization and the Open Economy. The North American Journal of
Economics and Finance 8 (1): 71-79.
Baldwin, R., Ito, T., Sato, H. (2014). The Smile Curve: Evolving Sources of Value Added
in Manufacturing, Joint Research Program Series, IDE-JETRO.
Cadestin, C., Backer, K. Desnoyers-James, I., Miroudot, S., Rigo, D., Ye, M. (2018a),
Multinational Enterprises and Global Value Chains: The OECD Analytical AMNE
Database, OECD Trade Policy Papers No. 211.
Cadestin, C., Backer, K. Desnoyers-James, I., Miroudot, S., Rigo, D., Ye, M. (2018b),
Multinational Enterprises and Global Value Chains: New Insights on the Trade-
Investment Nexus, OECD Science, Technology and Industry Working Papers No.
2018/05.
Cadestin, C., Backer, K., Miroudot, S., Moussiegt, L., Rigo, D., Ye, M. (2019),
Multinational Enterprises in Domestic Value Chains, OECD Science, Technology and
Industry Policy Papers No. 63.
Campa, J. and Goldberg, L. (1997). The Evolving External Orientation of Manufacturing
Industries: Evidence from Four Countries. NBER Working Paper No. 5919.
Chen, Q. (2014). The Average Propagation Length: An Extended Analysis. Paper
presented in the 22nd International Input-Output Conference, Lisbon, 2014.
Cheng, W., Meng, B., Gao, Y. (2020). China’s Innovation Boom: Miracle or Mirage? IDE

24
Discussion Paper 777.
Corcos, G., Irac, D.M., Mion, G., Verdier, T. (2013). The Determinants of Intrafirm Trade:
Evidence from French Firms. Review of Economics and Statistics 95 (3): 825-838.
Dedrick, J., Kraemer, K.L. (1998). Asia’s Computer Challenge: Threat or Opportunity for
the United States and the World? New York: Oxford University Press.
Dedrick, J., Kraemer, K.L., Linden, G. (2010). Who Profits from Innovation in Global
Value Chains? A Study of the iPod and Notebook PCs, Industrial and Corporate Change
19 (1): 81-116.
Feenstra, R. (1998). Integration of Trade and Disintegration of Production in the Global
Economy. Journal of Economic Perspectives 12 (4): 31-50.
Gereffi, G., Humphrey, J., Sturgeon, T. (2005). The Governance of Global Value Chains,
Review of International Political Economy 12 (1): 78-104.
Gereffi, G., and Fernandez-Stark, K. (2011). Global Value Chain Analysis: A Primer.
Durham, NC: Center on Globalization, Governance and Competitiveness (CGGC), Duke
University.
Grieco, J.M. (1988). Anarchy and the Limits of Cooperation: A Realist Critique of the
Newest Liberal Institutionalism. International Organization 42 (3): 485-507.
Grossman, G. and Helpman, E. (2002a). Outsourcing in a Global Economy. NBER
Working Paper No. 8728.
Grossman, G. and Helpman, E. (2002b). Integration versus Outsourcing in Industry
Equilibrium. Quarterly Journal of Economics 117: 85-120.
Grossman, G.M. and Rossi-Hansberg, E. (2008). Trading Tasks: A Simple Theory of
Offshoring. The American Economic Review 98 (5): 1978-1997.
Hanson, G., Mataloni, Jr. R. J., Slaughter, M. J. (2003). Vertical Production Networks in
Multinational Firms. NBER Working Paper No. 9723.
Hummels, D., Ishii, J. Yi, K. (2001). The Nature and Growth of Vertical Specialization in
World Trade. Journal of International Economics 54: 75–96.
Inomata, S., (2017). Analytical Frameworks for Global Value Chains: An Overview. In
WTO eds. Global Value Chain Development Report 2017.

25
Ito, T., Vézina P.L. (2016). Production Fragmentation, Upstreamness, and Value added:
Evidence from Factory Asia 1990–2005. Journal of The Japanese and International
Economies 42: 1-9.
Johnson, R. and Noguera, G. (2012). Accounting for Intermediates: Production Sharing
and Trade in Value-added, Journal of International Economics 86 (2): 224-236.
Jones, R. and Kierzkowski, H. (1990). The Role of Services in Production and
International Trade: A Theoretical Framework. in R. Jones and A. Krueger (eds.), The
Political Economy of International Trade, Basil Blackwell, Oxford.
Kimura, T. (2003). The “Smile Curve” Phenomenon in the Japanese Assembly-Type
Manufacturing Industry. FRI Research Report No. 167 (in Japanese).
Kimura, T. (2006). The Continuing Smile Curve Phenomenon in Electronic Computing
Equipment and Accessory Equipment: Further Validation for the Smile Curve. Articles
of Economists/Analysts on Japanese Economy, Fujitsu Research Institute.
Klassen, K., Laplante, S.K. (2012). Are US Multinational Corporations Becoming More
Aggressive Income Shifters? Journal of Accounting Research 50 (5): 1245-1285.
Krugman, P. (1995). Growing World Trade: Causes and Consequences, Brookings Papers
on Economic Activity.
Koopman, R., Wang, Z., Wei, S-J. (2014). Tracing Value-added and Double Counting in
Gross Exports, American Economic Review 104 (2): 459-494.
Linden, G., Dedrick, J., Kraemer, K.L. (2009). Innovation and Job Creation in a Global
Economy: The Case of Apple’s iPod. Working Paper, Personal Computing Industry Center,
UC Irvine.
Los, B., Timmer, M.P., de Vries, G.J. Tracing value-added and double counting in gross
exports: comment. American Economic Review 106 (7): 1958-66
Meng, B., Ye, M., Wei, S.J. (2020). Measuring Smile Curves in Global Value Chains,
Oxford Bulletin of Economics and Statistics.
Miller, R.E. and Temurshoev, U. (2013). Output Upstreamness and Input
Downstreamness of Industries/Countries in World Production. GGDC Working Papers
No. 133.
Miroudot, S. and Ye, M. (2019). Multinational production in value-added terms.
Economic Systems Research.

26
Miroudot, S. and Ye, M. (2020). Decomposing value added in gross exports. Economic
Systems Research.
Mudambi, R. (2008). Location, Control and Innovation in Knowledge-Intensive
Industries, Journal of Economic Geography 8 (5): 699-725.
Parteka, A., Wolszczak-Derlacz, J. (2019). Global Value Chains and Wages: Multi-
Country Evidence from Linked Worker-Industry Data. Open Economies Review 30: 505-
539.
Porter, M.E. (1985). The Competitive Advantage: Creating and Sustaining Superior
Performance. NY: Free Press.
Rungi, A., Del Prete, D. (2018). The Smile Curve at the Firm Level: Where Value is Added
along Supply Chains. Economics Letters 164 (C): 38-42.
Saliola, F., Zanfei, A. (2009). Multinational Firms, Global Value Chains and the
Organization of Knowledge Transfer. Research Policy 38(2): 369-381.
Shih, S. (1996). Me-Too is Not My Style: Challenge Difficulties, Break through
Bottlenecks, Create Values (Taipei: The Acer Foundation).
Shin, N., Kraemer, K.L., Dedrick, J. (2012). Value Capture in the Global Electronics
Industry: Empirical Evidence for the “Smiling Curve” Concept, Industry and Innovation
19 (2), 89-107.
Simone, L.D., Klassen, K., Seidman, J. (2017). Unprofitable Affiliates and Income
Shifting Behavior. The Accounting Review 92 (3): 113-136
Stöllinger, R. (2017). Smile Curves Economics vs Comparative Advantages: Does
Functional Specialisation Matter for Economic Growth. The Vienna Institute for
International Economic Studies (WIIW).
Timmer, M.P., Erumban, A.A., Los, B., Stehrer, R., De Vries, G.J. (2014). Slicing up
Global Value Chains. Journal of Economic Perspectives 28 (2): 99-118.
Timmer, M.P., Miroudot, S., de Vries, G.J. (2019). Functional Specialisation in Trade.
Journal of Economic Geography 19 (1), 1-30.
UNCTAD (2013). World Investment Report 2013Global Value Chains: Investment and
Trade for Development, United Nations Conference on Trade and Development, United
Nations Publication.

27
Waltz, K.N. (1959). Man, the State and War. New York: Columbia University Press. (pp.
198)
Waltz, K.N. (1979). Theory of International Politics. University of California, Berkeley.
Addison-Wesley Publishing Company (pp. 126).
Wang, Z., Wei, S-J., Yu, X., Zhu, K. (2017). Characterizing Global Value Chains:
Production Length and Upstreamness. NBER Working Paper No. 23261.
WTO-IDE (2011). Trade Patterns and Global Value Chains in East Asia: From Trade to
Goods to Trade in Tasks, printed by the WTO Secretariat.
World Bank-WTO (2019). Global Value Chain Development Report 2019: Technological
Innovation, Supply Chain Trade and Workers in a Globalized World. Washington, D.C.:
World Bank Group.
Xiao, H., Meng, B., Ye, J., Li, S. (2020). Are Global Value Chains Truly Global? Economic
Systems Research.
Xing, Y., and Detert, H. (2010). How the iPhone Widens the United States Trade Deficit
with the People’s Republic of China, ADBI Working Paper No. 257.
Xing, Y. (2019). How the iPhone widens the US trade deficit with China: The case of the
iPhone X, GRIPS Discussion Papers 19-21.
Xing, Y. (2020). Global Value Chains and the “missing exports” of the United States.
China Economic Review 61(101429).
Ye, M., Meng, B., Wei, S.J. (2015). Measuring Smile Curves in Global Value Chains, IDE
Discussion Paper 530.
Yeats, A. (2001). Just How Big is Global Production Sharing? In L. Cheng and
Kierzkowski, H. (eds.), Globalization of Trade and Production in South-East Asia. New
York: Kluwer Academic Press.
Yi, K.M. (2003). Can Vertical Specialization Explain the Growth of World Trade? Journal
of Political Economy 111 (1): 52-102.