smf dcf training (done) final
DESCRIPTION
example of a dcf using excelclick on the cells to see how each cell of data was done. Especially how to take data from worksheets. (discounted cash flow)TRANSCRIPT

StarhubDiscounted Cash Flow Analysis
2013 2014EBIT $ 419 $ 426 Less Cash Tax 17.0% $ 71 $ 72 NOPAT $ 348 $ 353 Plus: Depreciation and Amortisation $ 260 $ 260 Plus: Other Non-cash charges $ 71 $ 71 Minus: CAPEX $ -247 $ -247 Decrease/ (Increase) in Non-Cash Working Capital $ 38 $ 38 Unlevered free cashflow $ 471 $ 476 Discount Factor 0.94 0.89
Shares outstanding 1718WACC 5.96%NPV $ 2,061
Perpetuity Growth Method PVTerminal Growth Rate 1.0% $ 7,915
Enterprise Value (NPV + Terminal Value) $ 9,975 Equity Value $ 8,720 Fair value per share $ 5.08 Market value per share $ 4.29 Upside 18.4%
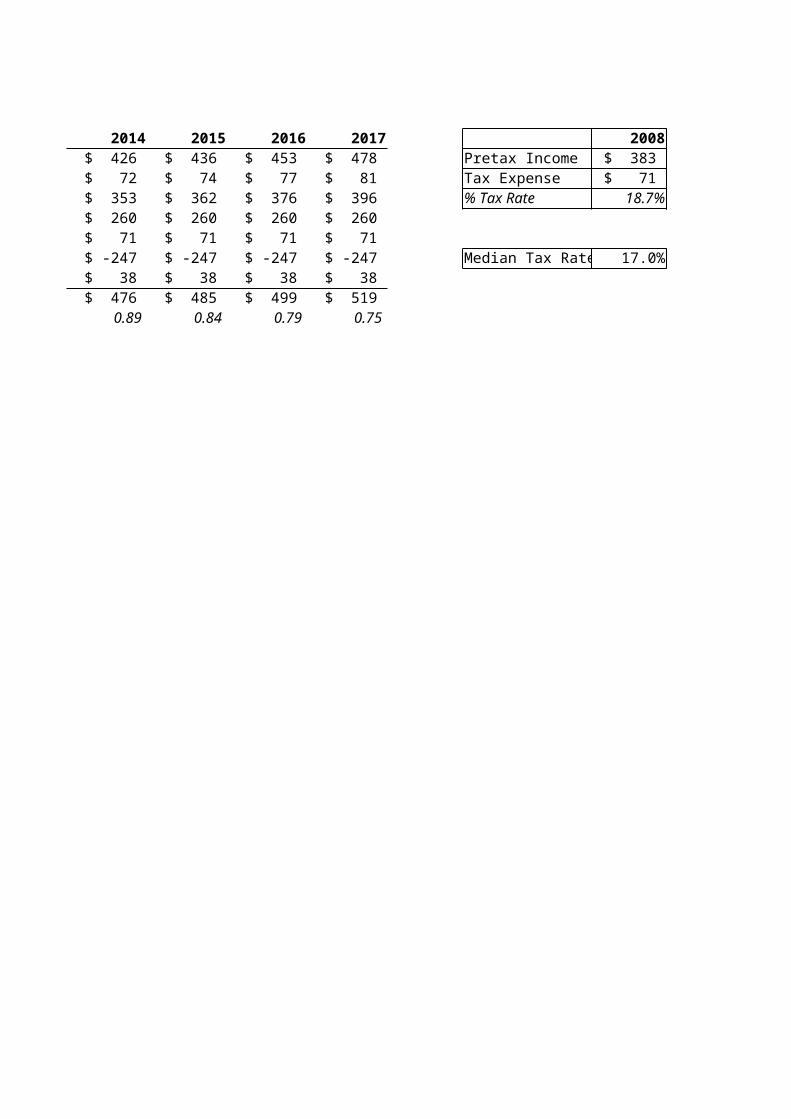
2015 2016 2017 2008 2009 2010 $ 436 $ 453 $ 478 Pretax Income $ 383 $ 385 $ 318 $ 74 $ 77 $ 81 Tax Expense $ 71 $ 65 $ 54 $ 362 $ 376 $ 396 % Tax Rate 18.7% 17.0% 17.1% $ 260 $ 260 $ 260 $ 71 $ 71 $ 71 $ -247 $ -247 $ -247 Median Tax Rate 17.0% $ 38 $ 38 $ 38 $ 485 $ 499 $ 519 0.84 0.79 0.75
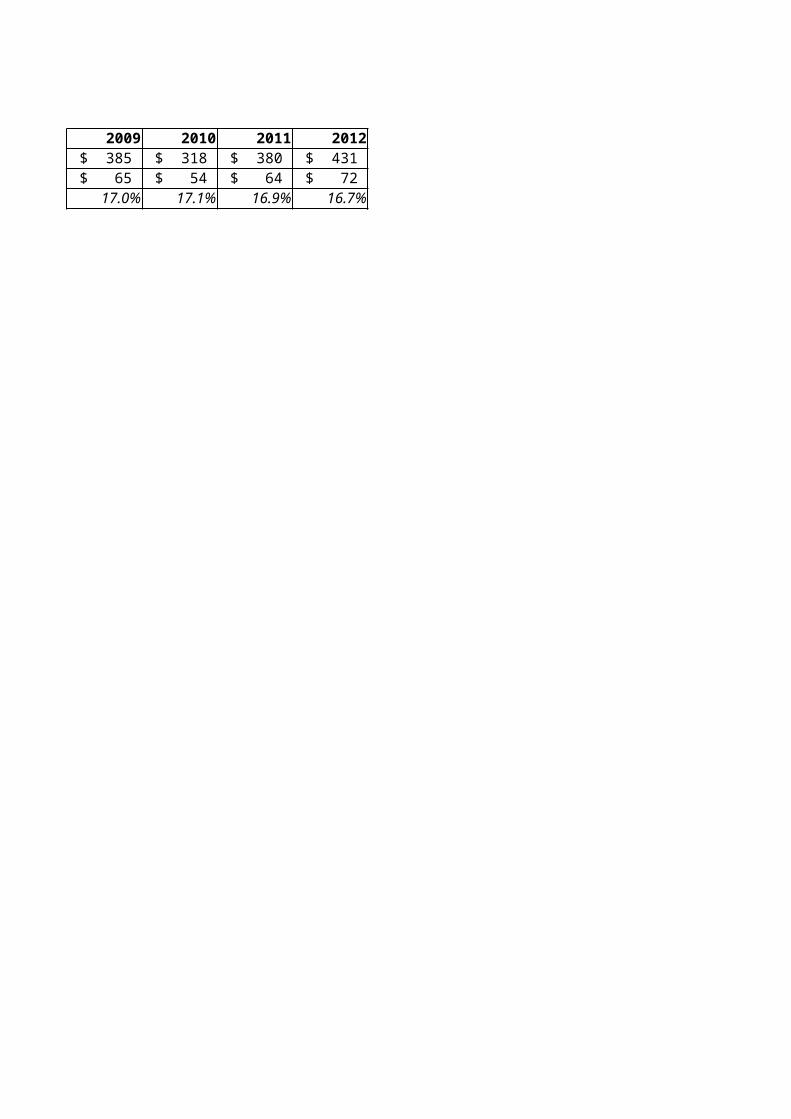
2011 2012 $ 380 $ 431 $ 64 $ 72
16.9% 16.7%
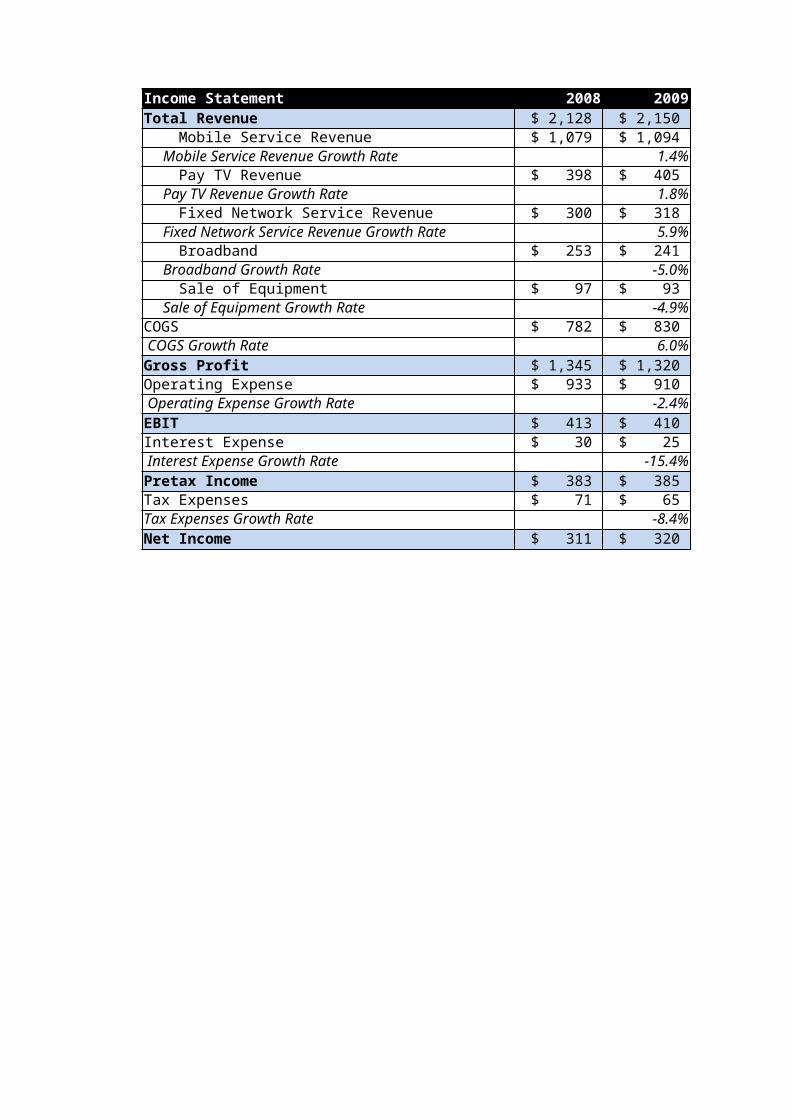
Income Statement 2008 2009 2010Total Revenue $ 2,128 $ 2,150 $ 2,238
$ 1,079 $ 1,094 $ 1,181 1.4% 8.0%
$ 398 $ 405 $ 395 1.8% -2.5%
$ 300 $ 318 $ 332 5.9% 4.5%
$ 253 $ 241 $ 236 -5.0% -1.9%
$ 97 $ 93 $ 93 -4.9% 0.8%
COGS $ 782 $ 830 $ 913 COGS Growth Rate 6.0% 10.0%Gross Profit $ 1,345 $ 1,320 $ 1,325 Operating Expense $ 933 $ 910 $ 984 Operating Expense Growth Rate -2.4% 8.1%EBIT $ 413 $ 410 $ 347 Interest Expense $ 30 $ 25 $ 29 Interest Expense Growth Rate -15.4% 16.5%Pretax Income $ 383 $ 385 $ 318 Tax Expenses $ 71 $ 65 $ 54 Tax Expenses Growth Rate -8.4% -17.1%Net Income $ 311 $ 320 $ 263
Mobile Service Revenue Mobile Service Revenue Growth Rate Pay TV Revenue Pay TV Revenue Growth Rate Fixed Network Service Revenue Fixed Network Service Revenue Growth Rate Broadband Broadband Growth Rate Sale of Equipment Sale of Equipment Growth Rate

2011 2012 2013F 2014F 2015F 2016F 2017F $ 2,312 $ 2,422 $ 2,505 $ 2,598 $ 2,701 $ 2,817 $ 2,947 $ 1,218 $ 1,224 $ 1,252 $ 1,280 $ 1,308 $ 1,338 $ 1,368
3.1% 0.5% 2.2% 2.2% 2.2% 2.2% 2.2% $ 376 $ 396 $ 395 $ 394 $ 392 $ 391 $ 390
-4.9% 5.4% -0.3% -0.3% -0.3% -0.3% -0.3% $ 337 $ 358 $ 376 $ 396 $ 416 $ 438 $ 460
1.5% 6.2% 5.2% 5.2% 5.2% 5.2% 5.2% $ 242 $ 249 $ 250 $ 251 $ 251 $ 252 $ 253
2.4% 3.2% 0.3% 0.3% 0.3% 0.3% 0.3% $ 140 $ 194 $ 232 $ 278 $ 333 $ 398 $ 476
50.1% 38.6% 19.7% 19.7% 19.7% 19.7% 19.7% $ 929 $ 1,011 $ 1,086 $ 1,167 $ 1,254 $ 1,348 $ 1,449
1.7% 8.9% 7.5% 7.5% 7.5% 7.5% 7.5% $ 1,384 $ 1,411 $ 1,419 $ 1,430 $ 1,447 $ 1,469 $ 1,499 $ 1,013 $ 994 $ 999 $ 1,005 $ 1,010 $ 1,015 $ 1,021
2.9% -1.9% 0.5% 0.5% 0.5% 0.5% 0.5% $ 392 $ 443 $ 419 $ 426 $ 436 $ 453 $ 478 $ 12 $ 12 $ 11 $ 10 $ 9 $ 9 $ 8
-58.8% -0.8% -8.1% -8.1% -8.1% -8.1% -8.1% $ 380 $ 431 $ 408 $ 416 $ 427 $ 445 $ 470 $ 64 $ 72 $ 73 $ 75 $ 76 $ 78 $ 79
18.4% 12.1% 1.9% 1.9% 1.9% 1.9% 1.9% $ 316 $ 359 $ 335 $ 341 $ 351 $ 367 $ 391

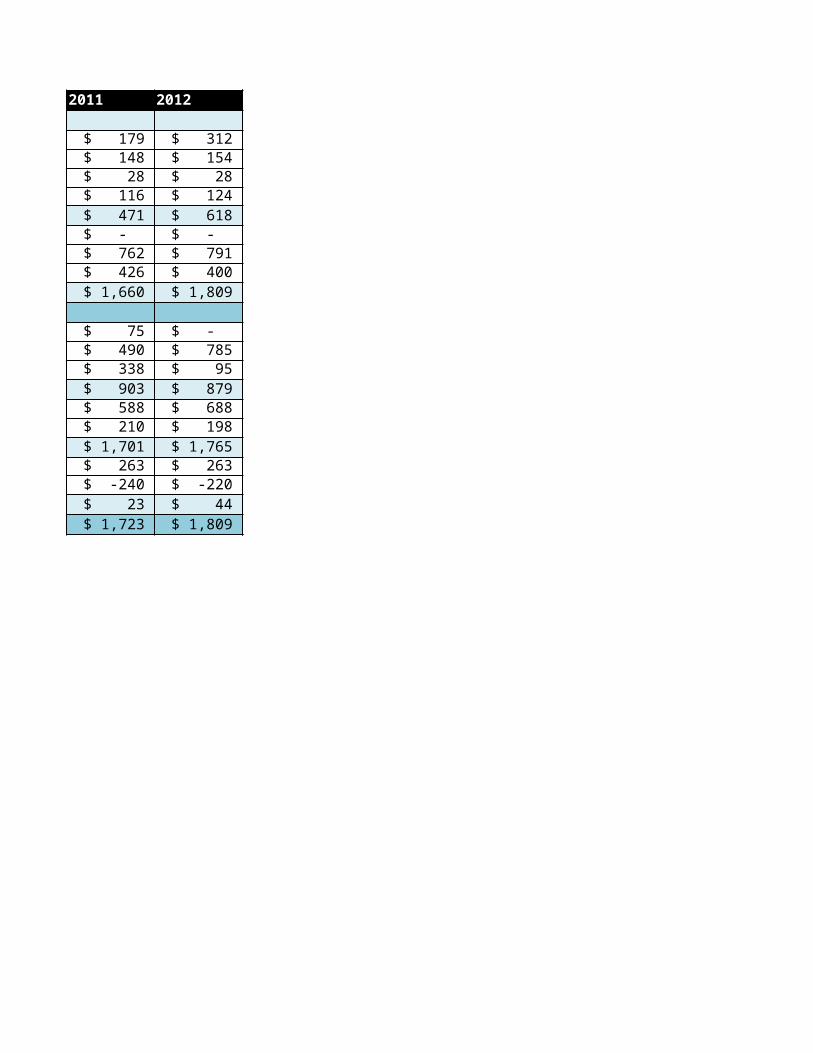
Balance Sheet (in Millions) 2008 2009 2010AssetsCash and Cash Equivalent $ 128 $ 234 $ 238 Receivable $ 148 $ 148 $ 190 Inventories $ 21 $ 28 $ 32 Other Current Assets $ 113 $ 116 $ 102 Current Assets $ 410 $ 526 $ 561 Long-term Investments $ - $ - $ - Net PPE $ 846 $ 785 $ 776 Other Non-Current Assets $ 406 $ 421 $ 456 Total Assets $ 1,661 $ 1,733 $ 1,794 Liabilities and Shareholders' EquityShort-term Borrowing $ 218 $ 290 $ 330 Accounts and Notes Payable $ 379 $ 419 $ 480 Others Current Liabilities $ 211 $ 216 $ 263 Total Current Liabilities $ 808 $ 925 $ 1,073 Long-term Liabilities $ 696 $ 605 $ 475 Others non-current Liabilities $ 50 $ 76 $ 191 Total Liabilities $ 1,553 $ 1,607 $ 1,740 Shareholders Equity $ 255 $ 258 $ 260 Retained Earnings & Other Equity $ -147 $ -132 $ -206 Total Equity $ 108 $ 126 $ 54 Total Liabilities and Shareholders' Equity $ 1,661 $ 1,733 $ 1,794

2011 2012
$ 179 $ 312 $ 148 $ 154 $ 28 $ 28 $ 116 $ 124 $ 471 $ 618 $ - $ - $ 762 $ 791 $ 426 $ 400 $ 1,660 $ 1,809
$ 75 $ - $ 490 $ 785 $ 338 $ 95 $ 903 $ 879 $ 588 $ 688 $ 210 $ 198 $ 1,701 $ 1,765 $ 263 $ 263 $ -240 $ -220 $ 23 $ 44 $ 1,723 $ 1,809
Appendix Cashflow 2008 2009 2010 2011Cashflow from operationsNet income $ 311 $ 320 $ 263 $ 316 Depreciation and Amortisation $ 235 $ 245 $ 260 $ 278 Other Non Cash Charges $ 95 $ 71 $ 118 $ 50 Changes in NCWC $ -72 $ 33 $ 64 $ 38 Total cash from operations $ 570 $ 669 $ 705 $ 681
Cashflow from investingDisposal of Fixed Assets $ 0.1 $ 0.7 $ 2.1 $ 0.5 Capital Expenditures $ -220 $ -231 $ -272 $ -247 Other Investing Activities $ - $ - $ - $ - Total cash from investing $ -220 $ -231 $ -270 $ -246
Cash flow from financingDividend paid $ -308 $ -317 $ -343 $ -343
$ - $ - $ - $ - $ - $ 200 $ 200 $ 188 $ -54 $ -218 $ -290 $ -330 $ 7.9 $ 2.4 $ 2.2 $ 1.7 $ -5.8 $ - $ - $ -9.1 $ - $ - $ - $ -
Total cash from financing $ -360 $ -332 $ -431 $ -494
Net change in cash $ -10 $ 106 $ 3.3 $ -58
Change in Short-Term Borrowings Increase in Long-Term Borrowings Decrease in Long-term Borrowings Increase in Capital Stocks Decrease in Capital Stocks Other Financing Activities

2012
$ 359 $ 273 $ -0.2 $ 42 $ 674
$ 1.0 $ -273 $ - $ -272
$ -343 $ - $ 80 $ -275 $ 221 $ -2.3 $ 51 $ -269
$ 133

Ticker STH SP EquityCompany StarHub LtdStart Date 20011231End Date 20141231Periodicity ACurrency SGDFiling Status Mnemonic MRFiling Most RecentUnits MLN
Field MnemonicFor the period ending
Revenue SALES_REV_TURNSALES_REV_TURN
IS_COGS_TO_FE_AND_PP_AND_G
Gross Profit GROSS_PROFITIS_OPERATING_EXPN
Operating Income IS_OPER_INCIS_INT_EXPENSE
Pretax Income PRETAX_INCIS_INC_TAX_EXP
Income Before XO Items IS_INC_BEF_XO_ITEMNet Income NET_INCOME
Product/Brand Segments Mobile Service Revenue Pay TV Revenue Fixed Network Service Revenue Broadband Sale of Equipment Cost of Revenue Cost of Equipment Sold Cost of Services Traffic Expenses
Operating Expenses
Interest Expense
Income Tax Expense

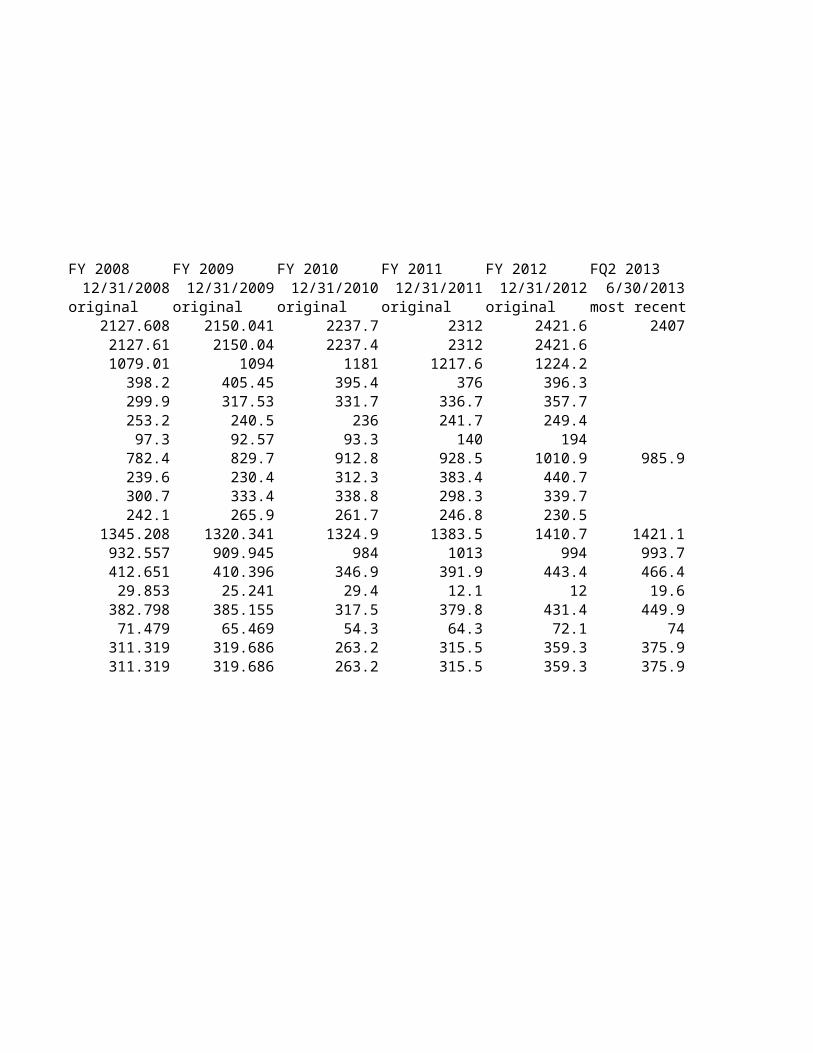
FY 2008 FY 2009 FY 2010 FY 2011 FY 2012 FQ2 201312/31/2008 12/31/2009 12/31/2010 12/31/2011 12/31/2012 6/30/2013
original original original original original most recent2127.608 2150.041 2237.7 2312 2421.6 2407
2127.61 2150.04 2237.4 2312 2421.61079.01 1094 1181 1217.6 1224.2
398.2 405.45 395.4 376 396.3299.9 317.53 331.7 336.7 357.7253.2 240.5 236 241.7 249.4
97.3 92.57 93.3 140 194782.4 829.7 912.8 928.5 1010.9 985.9239.6 230.4 312.3 383.4 440.7300.7 333.4 338.8 298.3 339.7242.1 265.9 261.7 246.8 230.5
1345.208 1320.341 1324.9 1383.5 1410.7 1421.1932.557 909.945 984 1013 994 993.7412.651 410.396 346.9 391.9 443.4 466.4
29.853 25.241 29.4 12.1 12 19.6382.798 385.155 317.5 379.8 431.4 449.9
71.479 65.469 54.3 64.3 72.1 74311.319 319.686 263.2 315.5 359.3 375.9311.319 319.686 263.2 315.5 359.3 375.9
FY 2013 FY 201412/31/2013 12/31/2014
most recent most recent2478.17 2559.83
1265.1 1323.43
455.62 475.67
443.55 460.2
367 381368.2 380.95

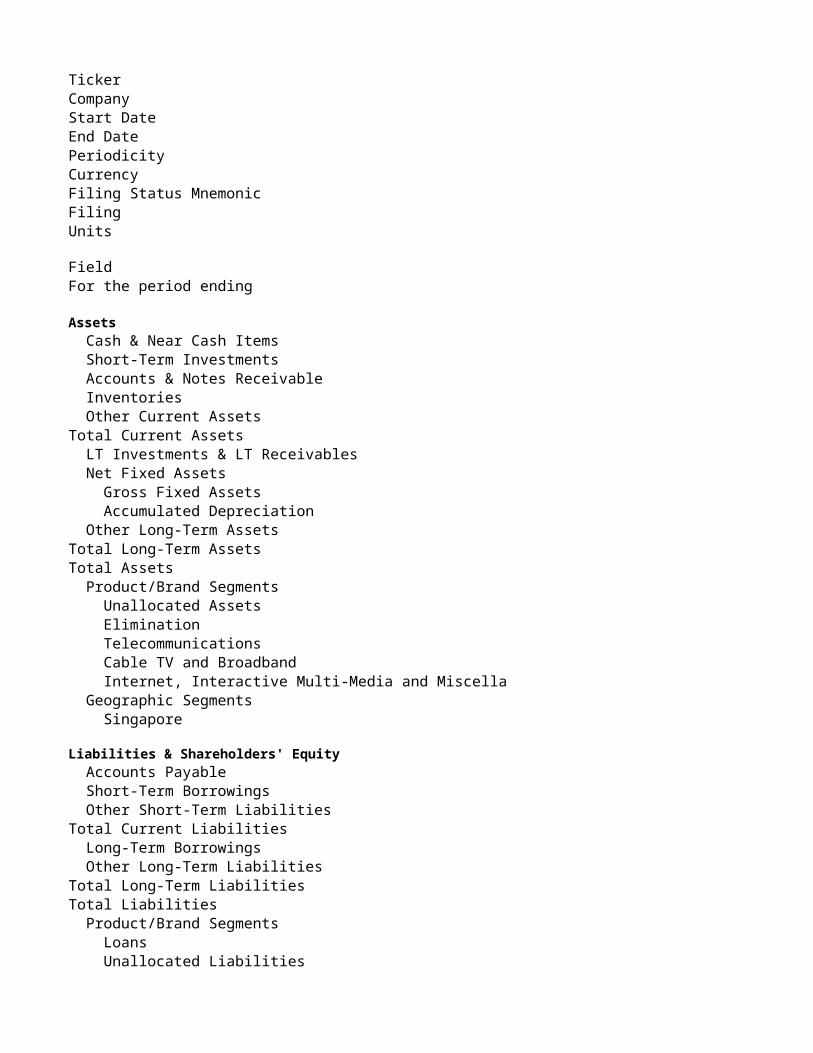
TickerCompanyStart DateEnd DatePeriodicityCurrencyFiling Status MnemonicFilingUnits
FieldFor the period ending
Assets
Total Current Assets
Total Long-Term AssetsTotal Assets
Liabilities & Shareholders' Equity
Total Current Liabilities
Total Long-Term LiabilitiesTotal Liabilities
Cash & Near Cash Items Short-Term Investments Accounts & Notes Receivable Inventories Other Current Assets
LT Investments & LT Receivables Net Fixed Assets Gross Fixed Assets Accumulated Depreciation Other Long-Term Assets
Product/Brand Segments Unallocated Assets Elimination Telecommunications Cable TV and Broadband Internet, Interactive Multi-Media and Miscellaneous Geographic Segments Singapore
Accounts Payable Short-Term Borrowings Other Short-Term Liabilities
Long-Term Borrowings Other Long-Term Liabilities
Product/Brand Segments Loans Unallocated Liabilities Elimination Telecommunications Cable TV and Broadband
Total EquityTotal Liabilities & Equity
Reference Items
Accounting StandardShares OutstandingNumber of Treasury SharesAmount of Treasury SharesPension ObligationsOperating LeasesCapital Leases - Short TermCapital Leases - Long TermCapital Leases - TotalNumber Of ShareholdersOptions Granted During PeriodOptions Outstanding at Period EndNet DebtNet Debt to EquityTangible Common Equity RatioCurrent RatioCash Conversion CycleInventory - Raw MaterialsInventory - Work in ProgressInventory - Finished GoodsOther InventoryPure Retained EarningsGoodwillInvestments in Associated CompaniesNumber of Employees
Internet, Interactive Multi-Media and Miscellaneous Geographic Segments Singapore Total Preferred Equity Minority Interest Share Capital & APIC Retained Earnings & Other Equity

STH SP EquityStarHub Ltd
2001123120121231
ASGDMRMost RecentMLN
Mnemonic FY 2001 FY 2002 FY 2003 FY 200412/31/2001 12/31/2002 12/31/2003 12/31/2004
original original original restated
BS_CASH_NEAR_CASH_ITEM 257.048 66.936 73.818 126.653BS_MKT_SEC_OTHER_ST_INVEST 0 0 0 0BS_ACCT_NOTE_RCV 126.987 116.293 105.219 108.145BS_INVENTORIES 5.475 4.391 5.984 6.351BS_OTHER_CUR_ASSET 70.802 65.132 71.423 103.494BS_CUR_ASSET_REPORT 460.312 252.752 256.444 344.643BS_LT_INVEST 2.588 1.873 1.321 0BS_NET_FIX_ASSET 1158.6121 1134.921 975.905 919.739BS_GROSS_FIX_ASSET 1673.219 1925.8101 2014.54 2223.81BS_ACCUM_DEPR 514.607 790.889 1038.635 1304.071BS_OTHER_ASSETS_DEF_CHRG_OTHER 307.892 575.402 552.458 478.322BS_TOT_NON_CUR_ASSET 1469.0921 1712.196 1529.684 1398.061BS_TOT_ASSET 1929.4041 1964.948 1786.1281 1742.704BS_TOT_ASSET
BS_TOT_ASSET
BS_ACCT_PAYABLE 238.063 279.69 322.208 349.175BS_ST_BORROW 3.504 16.529 30.966 73.527BS_OTHER_ST_LIAB 559.417 299.749 153.508 189.97BS_CUR_LIAB 800.984 595.968 506.682 612.672BS_LT_BORROW 426.453 397.035 355.528 246BS_OTHER_LT_LIABILITIES 136.105 34.465 29.906 25.666NON_CUR_LIAB 562.558 431.5 385.434 271.666BS_TOT_LIAB2 1363.542 1027.468 892.116 884.338BS_TOT_LIAB2
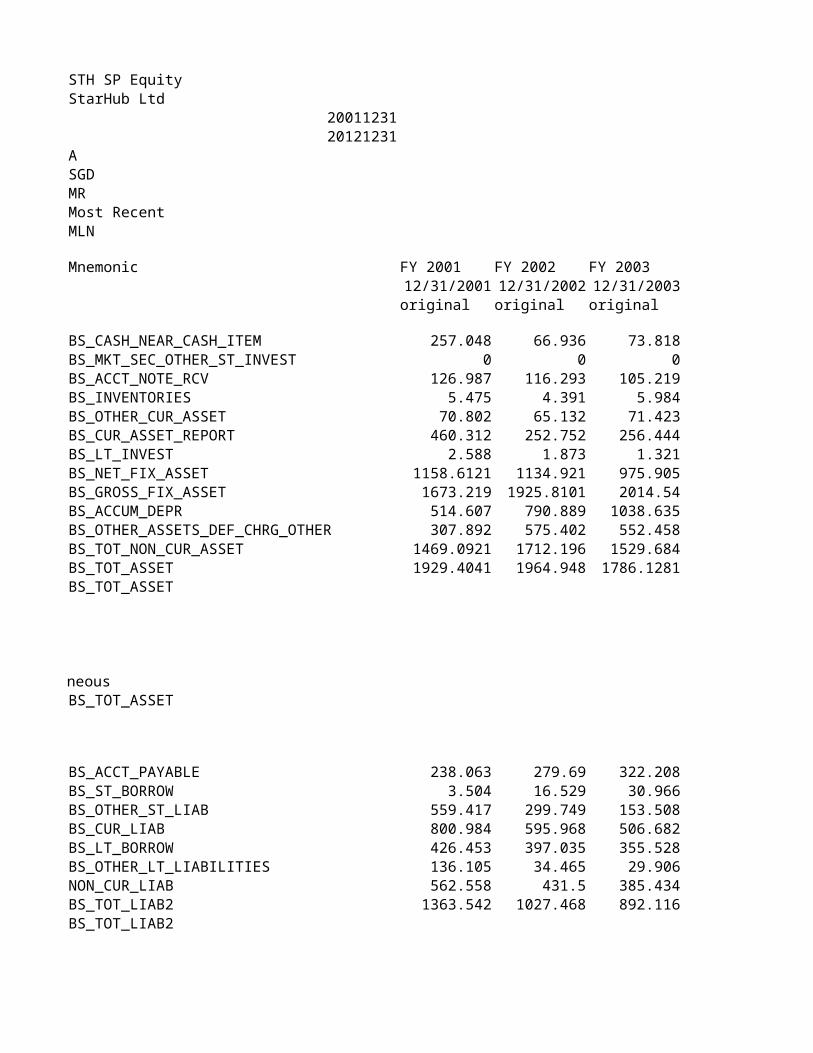
BS_TOT_LIAB2
BS_PFD_EQY 0 0 0 0MINORITY_NONCONTROLLING_INTEREST 0.824 0.607 0.624 0BS_SH_CAP_AND_APIC 551.749 837.255 839.697 857.118BS_RETAIN_EARN 13.289 99.618 53.691 1.248TOTAL_EQUITY 565.862 937.48 894.012 858.366TOT_LIAB_AND_EQY 1929.404 1964.948 1786.128 1742.704
ACCOUNTING_STANDARD SG GAAP SG GAAP SG GAAP SG GAAPBS_SH_OUT 4333.9375 6573.7482 6584.6254 1664.0699BS_NUM_OF_TSY_SH 0 0 0 #N/A N/ABS_AMT_OF_TSY_STOCK 0 0 0 #N/A N/ABS_PENSION_RSRV 0 0 0 0BS_FUTURE_MIN_OPER_LEASE_OBLIG 552.707 829.745 752.07 736.487ST_CAPITAL_LEASE_OBLIGATIONS 0.504 0.529 0.466 #N/A N/ALT_CAPITAL_LEASE_OBLIGATIONS 1.453 1.035 0.028 0BS_TOTAL_CAPITAL_LEASES 1.957 1.564 0.494 #N/A N/ABS_NUM_OF_SHAREHOLDERS #N/A N/A #N/A N/A #N/A N/A 14149BS_OPTIONS_GRANTED 27.6159 113.3668 61.8186 14.5161BS_OPTIONS_OUTSTANDING 64.4539 168.1231 210.2632 45.3931NET_DEBT 172.909 346.628 312.676 192.874NET_DEBT_TO_SHRHLDR_EQTY 30.5567 36.9744 34.9745 22.4699TCE_RATIO 22.4029 33.5142 36.1401 37.0522CUR_RATIO 0.5747 0.4241 0.5061 0.5625CASH_CONVERSION_CYCLE #N/A N/A -431.135 -438.0505 -233.1113INVTRY_RAW_MATERIALS 0 0 0 #N/A N/AINVTRY_IN_PROGRESS 0 0 0 #N/A N/AINVTRY_FINISHED_GOODS 0 0 0 #N/A N/ABS_OTHER_INV 5.475 4.391 5.984 6.351BS_PURE_RETAINED_EARNINGS -132.232 -29.526 -75.453 -130.894BS_GOODWILL 0 258.874 241.021 223.168BS_INVEST_IN_ASSOC_CO 0.847 0 0 0NUM_OF_EMPLOYEES 2651 2680 2755 2702

FY 2005 FY 2006 FY 2007 FY 2008 FY 2009 FY 2010 FY 201112/31/2005 12/31/2006 12/31/2007 12/31/2008 12/31/2009 12/31/2010 12/31/2011
original original original original original original original
174.477 50.186 137.975 128.327 234.193 237.5 179.20 0 0 0 0 0 0
116.571 130.397 128.836 147.887 147.946 190.4 169.213.117 12.98 19.848 20.505 28.195 31.8 37.2106.18 108.346 94.971 112.801 116.091 101.7 149.2
410.345 301.909 381.63 409.52 526.425 561.4 534.80 0 0 0 0 0 0
957.443 919.503 893.97 845.654 785.133 776 761.92422.457 2550.495 2666.043 2822.672 2910.884 3083.6 3173.71465.014 1630.992 1772.073 1977.018 2125.751 2307.6 2411.8
472.611 505.151 443.89 406.095 421.053 456.1 426.41430.054 1424.654 1337.86 1251.749 1206.186 1232.1 1188.31840.399 1726.563 1719.49 1661.269 1732.611 1793.5 1723.1
1840.4 1726.56 1719.49 1661.27368.18 385.71 312.28 245.39-66.77 -612.56 -123.79 -159.96
1058.82 1482.72 1103.54 1181.78470.37 439.24 422.33 382.92
9.8 31.45 5.14 11.151840.4 1726.56 1719.49 1661.271840.4 1726.56 1719.49 1661.27
388.619 388.249 416.469 379.119 419.222 479.5 490110.5 0 124.32 217.892 290.392 330.4 75
178.651 155.042 178.635 210.899 215.852 263.2 338.3677.77 543.291 719.424 807.91 925.466 1073.1 903.3
132.5 633 843.68 695.787 605.395 475 587.553.224 62.787 48.729 49.519 75.934 191.4 209.7
185.724 695.787 892.409 745.306 681.329 666.4 797.2863.494 1239.078 1611.833 1553.216 1606.795 1739.5 1700.5
863.49 1239.08 1611.83 1553.22968 913.68
31.41 44.24 33.95 38.81-347.27 -612.56 -123.79 -159.96451.23 1014.26 461.13 476.7726.35 790.82 270.47 281.98

1.77 2.32 2.08 2863.49 1239.08 1611.83 1553.22863.49 1239.08 1611.83 1553.22
0 0 0 0 0 0 00 0 0 0 0 0 0
873.261 236.403 247.207 255.116 257.514 260.3 262.8103.644 251.082 -139.55 -147.063 -131.698 -206.3 -240.2976.905 487.485 107.657 108.053 125.816 54 22.6
1840.399 1726.563 1719.49 1661.269 1732.611 1793.5 1723.1
SG GAAP SG GAAP SG GAAP SG GAAP SG GAAP IAS/IFRS IAS/IFRS1679.0307 1696.0717 1699.776 1709.7489 1712.834 1716.8522 1717.3
#N/A N/A 0 5.517 2.2031 1.092 0.0127 1.976#N/A N/A 0 16.223 6 2.974 0.1 5.5
0 0 0 0 0 0 0678.102 617.682 629.388 567.345 502.742 453.2 389
0 0 0 0 0 0 00 0 0 0 0 0 00 0 0 0 0 0 0
6347 5627 5905 7751 14688 14179 1461411.6647 #N/A N/A 0 0 0 0 038.7742 23.6133 14.961 8.044 5.996 4.011 2.731
68.523 582.814 830.025 785.352 661.594 567.9 483.37.0143 119.5553 770.9903 726.8211 525.8425 1051.6667 2138.4956
42.9209 10.6537 -17.8601 -21.3192 -22.0157 -29.6296 -30.8580.6054 0.5557 0.5305 0.5069 0.5688 0.5232 0.5921
-234.8556 -222.5794 -176.8621 -152.6886 -138.1668 -139.3889 -147.5093#N/A N/A 0 #N/A N/A #N/A N/A #N/A N/A 0 #N/A N/A#N/A N/A 0 #N/A N/A #N/A N/A #N/A N/A 0 #N/A N/A#N/A N/A 0 #N/A N/A #N/A N/A #N/A N/A #N/A N/A #N/A N/A
13.117 12.98 #N/A N/A #N/A N/A #N/A N/A #N/A N/A #N/A N/A-35.892 107.807 135.342 139.005 141.981 62.1 34.3223.168 220.292 220.292 220.292 220.292 220.3 220.3
0 0 0 0 0 0 0#N/A N/A 2670 #N/A N/A #N/A N/A #N/A N/A #N/A N/A #N/A N/A

FY 201212/31/2012
original
3120
154.328.1
123.6618
0791.1
3352.12561
399.51190.61808.6
784.60
94.6879.2687.5198.4885.9
1765.1

00
263.1-219.6
43.51808.6
IAS/IFRS1718.4235
0.07280.2
0322.4
000
130590
1.571375.5
863.2184-25.0425
0.7029-196.5648
#N/A N/A#N/A N/A#N/A N/A#N/A N/A
50.2220.3
0#N/A N/A

TickerCompanyStart DateEnd DatePeriodicityCurrencyFiling Status MnemonicFilingUnits
FieldFor the period ending
Cash From Operating Activities
Cash From Operations
Cash From Investing Activities
Cash From Investing Activities
Cash from Financing Activities
Cash from Financing ActivitiesNet Changes in Cash
Reference Items
EBITDATrailing 12M EBITDA MarginCash Paid for TaxesCash Paid for InterestInterest Received
Net Income Depreciation & Amortization Other Non-Cash Adjustments Changes in Non-Cash Capital
Disposal of Fixed Assets Capital Expenditures Product/Brand Segments Elimination Telecommunications Cable TV and Broadband Internet, Interactive Multi-Media and Miscellaneous Geographic Segments Singapore Increase in Investments Decrease in Investments Other Investing Activities
Dividends Paid Change in Short-Term Borrowings Increase in Long-Term Borrowings Decrease in Long-term Borrowings Increase in Capital Stocks Decrease in Capital Stocks Other Financing Activities

Free Cash FlowFree Cash Flow to FirmFree Cash Flow to EquityFree Cash Flow per Basic SharePrice to Free Cash FlowCash Flow to Net Income

STH SP EquityStarHub Ltd
2001123120130630
ASGDMRMost RecentMLN
Mnemonic FY 2001 FY 2002 FY 2003 FY 200412/31/2001 12/31/2002 12/31/2003 12/31/2004
original original original restated
CF_NET_INC -28.165 81.637 -53.495 -54.689CF_DEPR_AMORT 247.104 313.602 332.986 339.607CF_OTHER_NON_CASH_ADJUST -321.012 -311.547 -70.076 45.056CF_CHNG_NON_CASH_WORK_CAP 54.424 51.878 41.177 -7.05CF_CASH_FROM_OPER -47.649 135.57 250.592 322.924
CF_DISP_FIX_ASSET 0.104 0.166 2.229 0.569CF_CAP_EXPEND_PRPTY_ADD -462.68 -314.596 -221.311 -220.557CF_CAP_EXPEND_PRPTY_ADD
CF_CAP_EXPEND_PRPTY_ADD
CF_INCR_INVEST 0 0 0 0CF_DECR_INVEST 0 0 0 0CF_OTHER_INV_ACT -1.178 3.813 0 -0.628CF_CASH_FROM_INV_ACT -463.754 -310.617 -219.082 -220.616
CF_DVD_PAID 0 0 0 0CF_INCR_ST_BORROW 0 0 0 0CF_INCR_LT_BORROW 75 170.4 99 36CF_REIMB_LT_BORROW -94.561 -186.793 -126.07 -102.894CF_INCR_CAP_STOCK 1.126 1.328 2.442 17.421CF_DECR_CAP_STOCK 0 0 0 0CF_OTHER_FNC_ACT 0 0 0 0CF_CASH_FROM_FNC_ACT -18.435 -15.065 -24.628 -49.473CF_NET_CHNG_CASH -529.838 -190.112 6.882 52.835
EBITDA 239.369 411.076 299.369 330.003EBITDA_MARGIN 30.7805 45.0815 26.7726 24.3508CF_CASH_PAID_FOR_TAX #N/A N/A #N/A N/A #N/A N/A #N/A N/ACF_ACT_CASH_PAID_FOR_INT_DEBT 16.105 15.525 14.239 16.242CF_INTEREST_RECEIVED #N/A N/A #N/A N/A #N/A N/A #N/A N/A

CF_FREE_CASH_FLOW -510.329 -179.026 29.281 102.367CF_FREE_CASH_FLOW_FIRM #N/A N/A #N/A N/A #N/A N/A #N/A N/AFREE_CASH_FLOW_EQUITY #N/A N/A -195.253 4.44 36.042FREE_CASH_FLOW_PER_SH -0.3421 -0.1142 0.0178 0.0617PX_TO_FREE_CASH_FLOW #N/A N/A #N/A N/A #N/A N/A 22.6727CASH_FLOW_TO_NET_INC -0.8896 1.32 #N/A N/A #N/A N/A

FY 2005 FY 2006 FY 2007 FY 2008 FY 2009 FY 2010 FY 201112/31/2005 12/31/2006 12/31/2007 12/31/2008 12/31/2009 12/31/2010 12/31/2011
original original original original original original original
221.403 360.172 330.339 311.319 319.686 263.2 315.5203.798 211.043 226.12 235.125 245.079 259.5 277.8
39.478 16.117 89.248 95.467 71.445 118.4 49.729.593 -9.839 31.504 -72.084 32.597 63.5 38.3
494.272 577.493 677.211 569.827 668.807 704.6 681.3
0.292 9.142 2.121 0.146 0.66 2.1 0.5-247.663 -247.595 -212.886 -219.768 -231.397 -272.1 -246.5
-236.96 -200.3 -219.91 -222.17-0.07 -0.23 -0.3
-167.32 -133.95 -172.73 -163.94-69.51 -66.35 -46.95 -57.93
-0.06-236.81 -200.3 -219.45 -221.58-236.81 -200.3 -219.45 -221.58
0 0 0 0 0 0 00 0 0 0 0 0 00 0 0 0 0 0 0
-247.371 -238.453 -210.765 -219.622 -230.737 -270 -246
-138.693 -216.473 -265.942 -307.656 -316.71 -343.1 -343.30 0 0 0 0 0 0
17 633 335 0 200 200 187.5-93.527 -243 0 -54.321 -217.892 -290.4 -330.416.143 18.82 10.804 7.909 2.398 2.2 1.7
0 -655.678 -458.519 -5.785 0 0 -9.10 0 0 0 0 0 0
-199.077 -463.331 -378.657 -359.853 -332.204 -431.3 -493.647.824 -124.291 87.789 -9.648 105.866 3.3 -58.3
461.58 564.961 639.6104 647.776 655.475 606.4 669.729.3865 31.3038 31.7631 30.4462 30.4866 27.0993 28.9663
#N/A N/A 0 0 -0.269 0 0 014.183 10.785 22.093 28.517 24.391 26.8 21.8
#N/A N/A #N/A N/A #N/A N/A #N/A N/A #N/A N/A #N/A N/A 2

246.609 329.898 464.325 350.059 437.41 432.5 434.8257.2596 #N/A N/A 486.361 372.2638 457.3744 454.5508 451.8294
170.374 729.04 801.446 295.884 420.178 344.2 292.40.1475 0.1758 0.2632 0.2055 0.2555 0.2521 0.2534
17.6863 16.3162 10.6773 9.4396 8.414 10.4306 11.48612.2324 1.6034 2.05 1.8304 2.0921 2.6771 2.1594

FY 2012 FQ2 201312/31/2012 6/30/2013
original most recent
359.3 375.9272.5 271.2
-0.2 -32.5142 7.5
673.6 622.09
1 0.8-272.7 -311.6
0 00 00 0
-271.7 -310.8
-343.4 -343.9#N/A N/A
80 230-275 -200
221.1 1.1-2.3 050.5 19.4
-269.1 -293.4132.8 17.89
715.9 737.629.5631 30.64
54 77.919.9 19.2
4

400.9 310.49417.5574 326.89
206.9 341.290.2335 0.18
16.2302 24.021.8748 1.52