smells like teen spirit: improving bug prediction performance using the intensity of code smells
TRANSCRIPT
“Teen Spirit” is a typically murky Cobain exploration of meaning and
meaninglessness”
Some bad practices might “smell” good in other contexts
Preamble
“Bad Code Smells are symptoms of poor design or implementation choices”
[Martin Fowler]

Code Smells Hinder Comprehensibilityand Maintainability of the Source Code
[Abbes et al. - CSMR 2011]

Classes affected by code smells are more change- and fault-prone than classes not
participating in design flawsF. Khomh, M. Di Penta, Y. G. Guéhéneuc, G. Antoniol
EMSE 2012

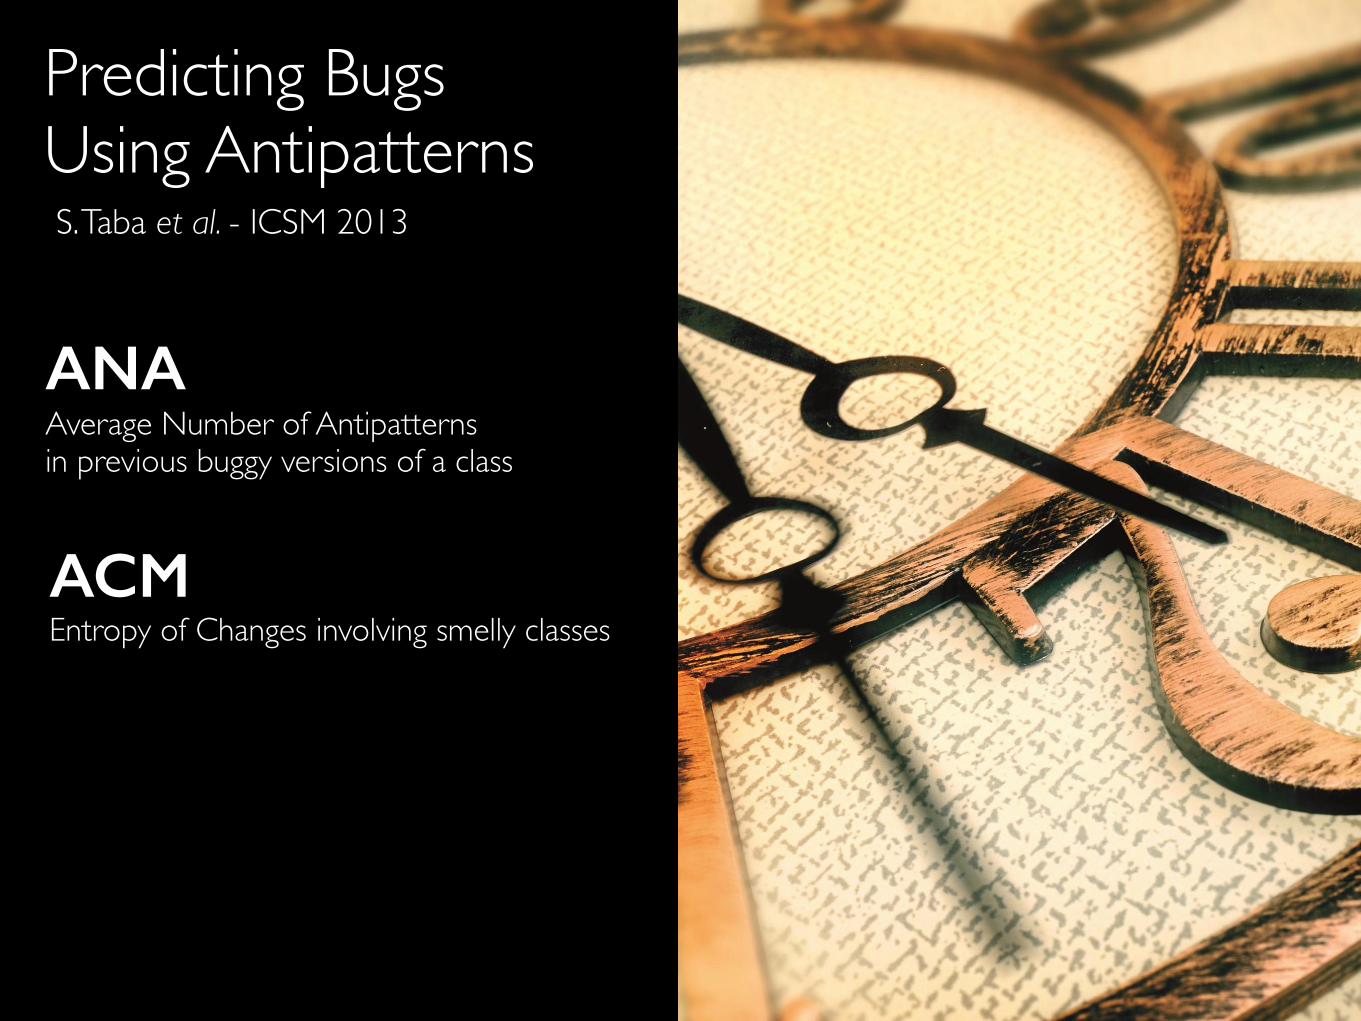
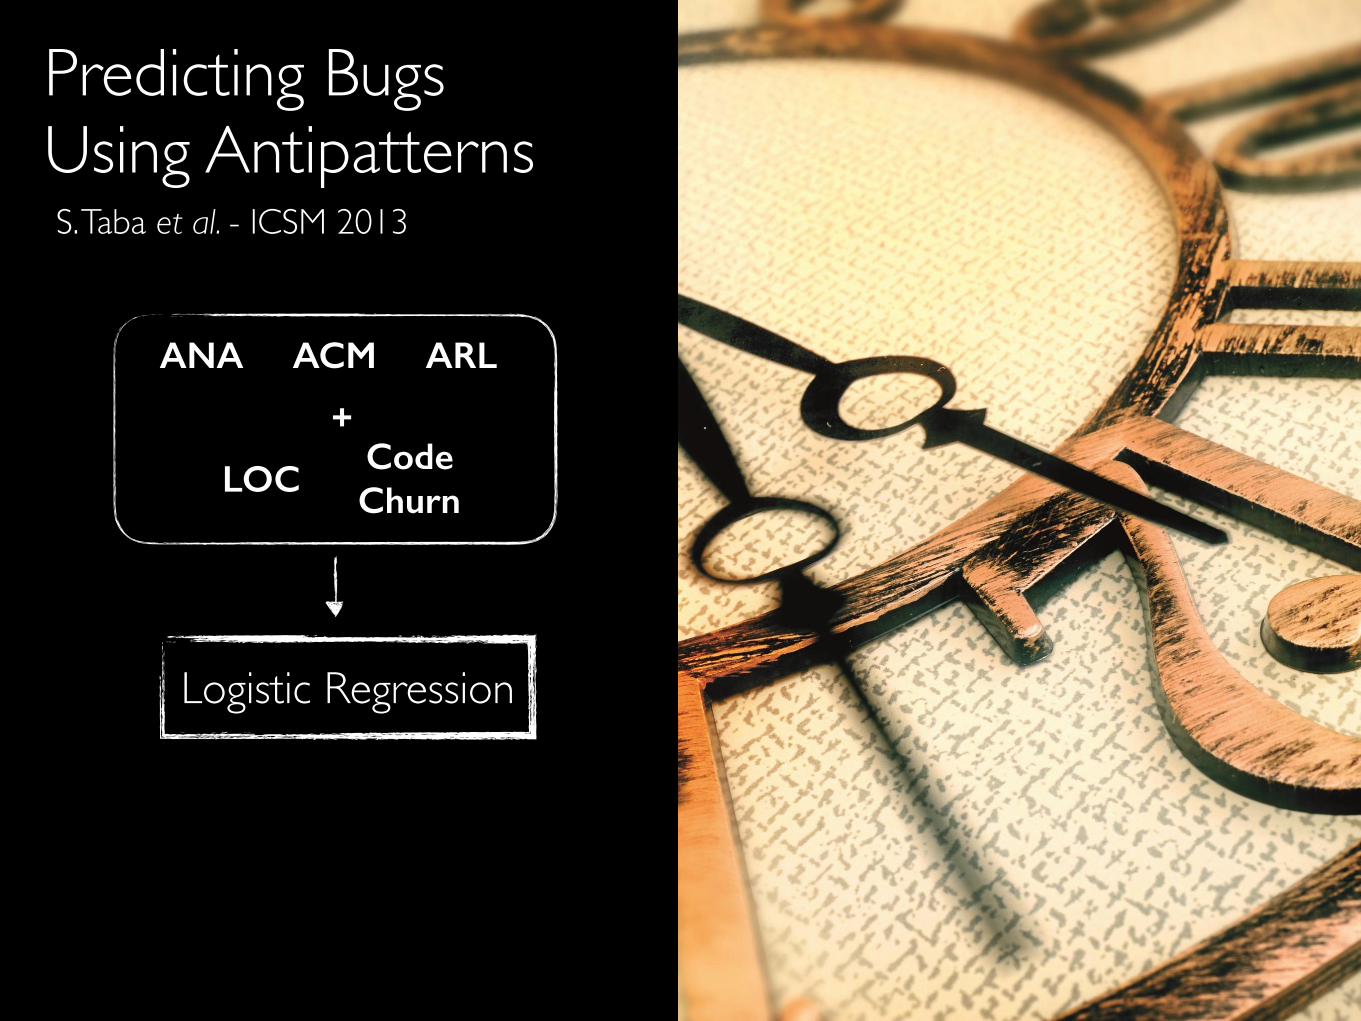
Predicting Bugs Using AntipatternsS. Taba et al. - ICSM 2013
ANA Average Number of Antipatterns in previous buggy versions of a class
Predicting Bugs Using AntipatternsS. Taba et al. - ICSM 2013
ACM Entropy of Changes involving smelly classes
ANA Average Number of Antipatterns in previous buggy versions of a class
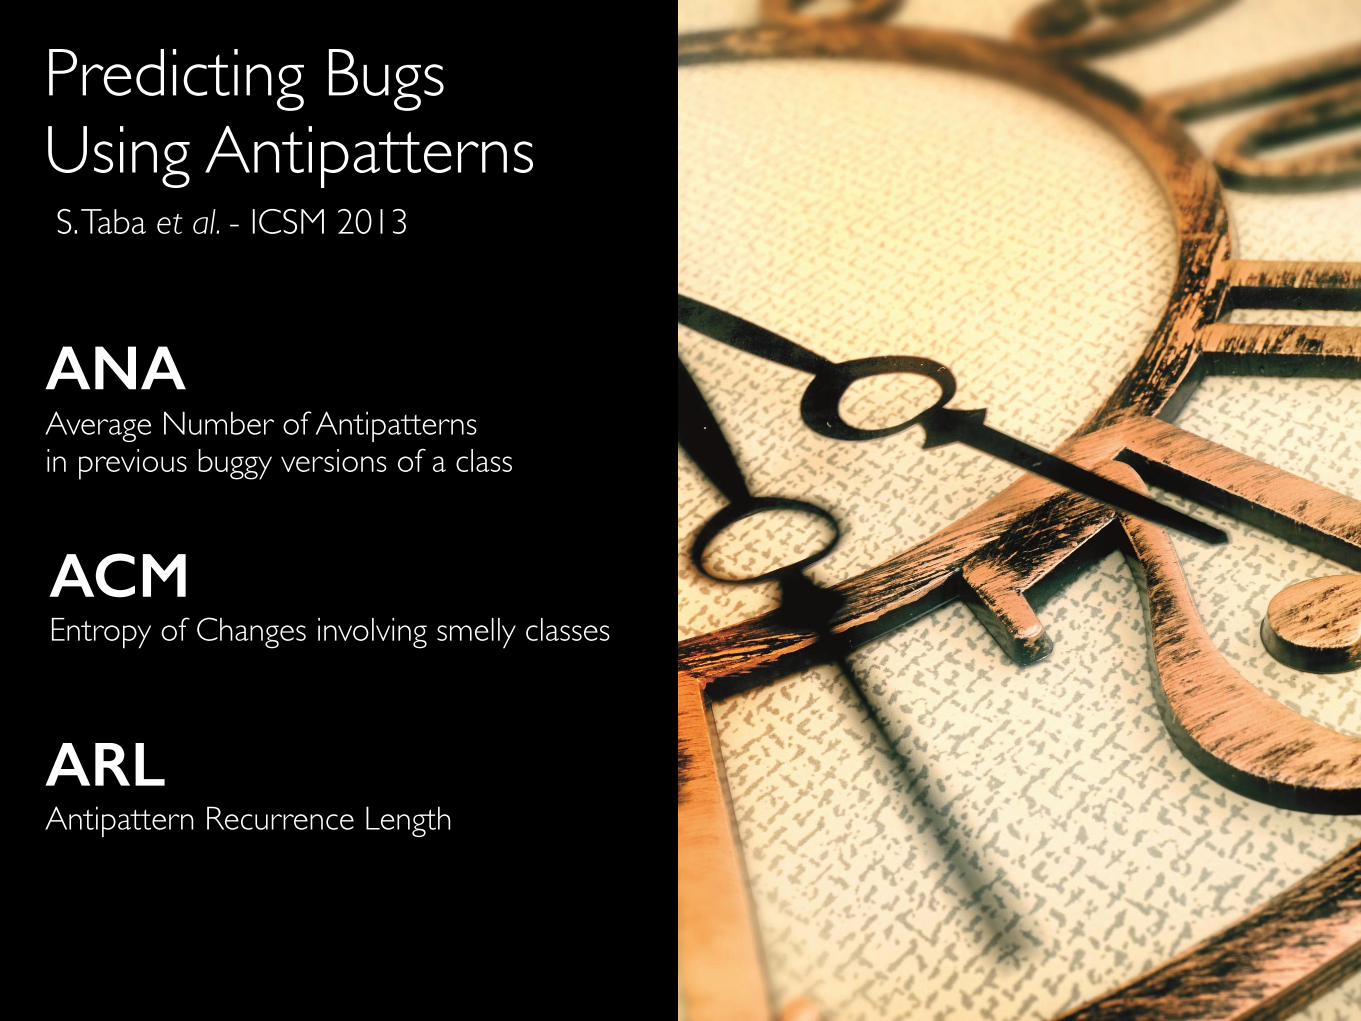
Predicting Bugs Using AntipatternsS. Taba et al. - ICSM 2013
ACM Entropy of Changes involving smelly classes
ARL Antipattern Recurrence Length
ANA Average Number of Antipatterns in previous buggy versions of a class

Predicting Bugs Using AntipatternsS. Taba et al. - ICSM 2013
ACM ARLANA
+
LOCCode Churn
Predicting Bugs Using AntipatternsS. Taba et al. - ICSM 2013
ACM ARLANA
+
LOCCode Churn
Logistic Regression
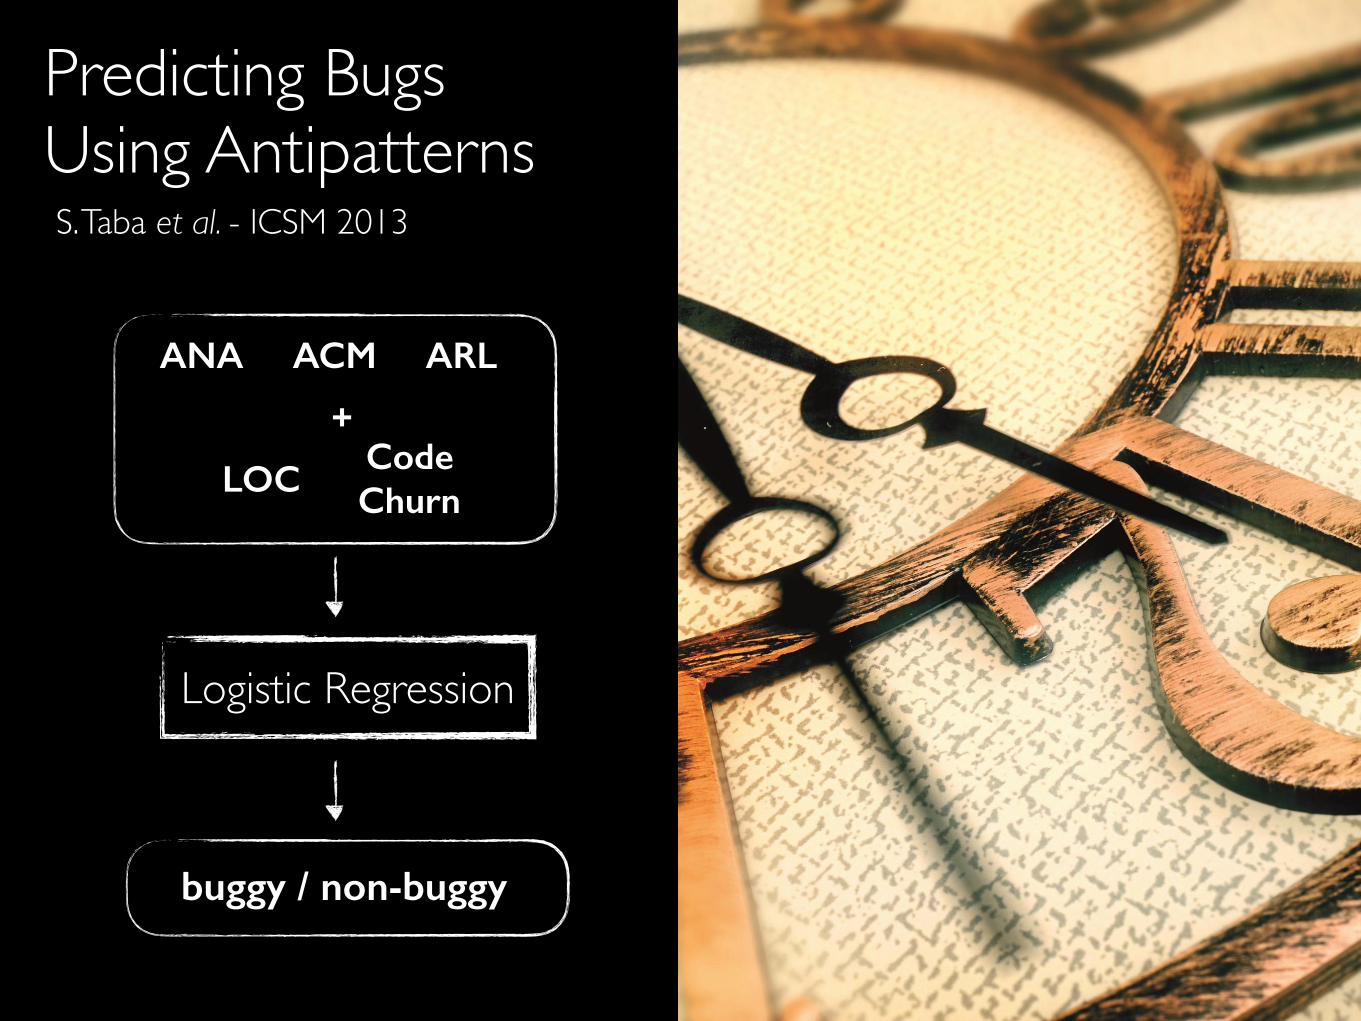
Predicting Bugs Using AntipatternsS. Taba et al. - ICSM 2013
ACM ARLANA
+
LOCCode Churn
Logistic Regression
buggy / non-buggy
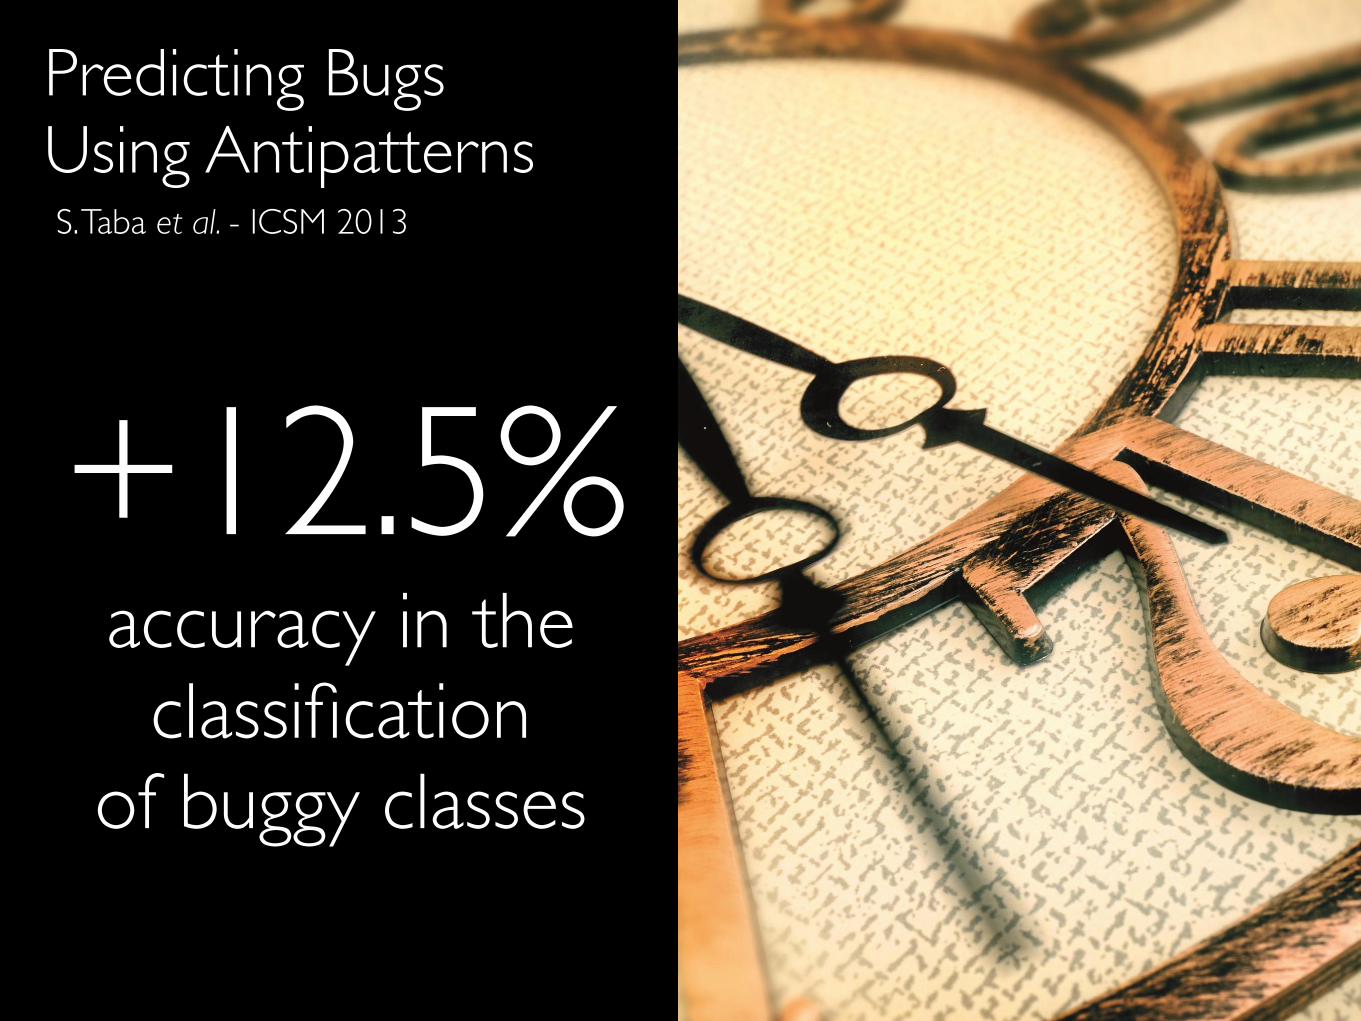
Predicting Bugs Using AntipatternsS. Taba et al. - ICSM 2013
+12.5% accuracy in the classification
of buggy classes
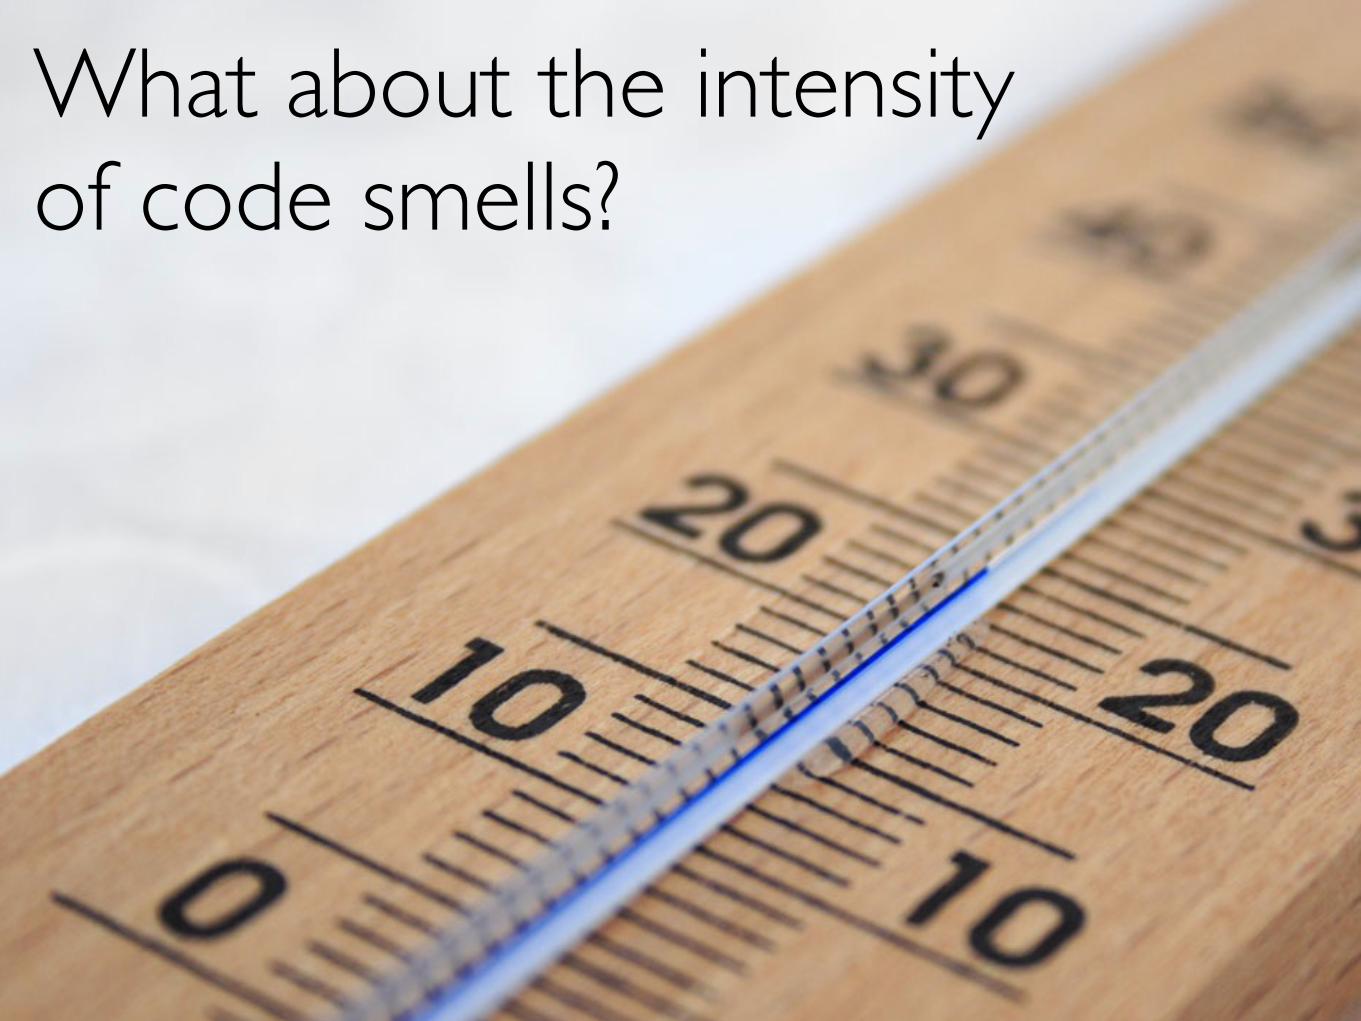
What about the intensity of code smells?
Smells Like Teen Spirit: Improving Bug Prediction Performance using the Intensity of Code Smells
Fabio Palomba*, Marco Zanoni+, Francesca Arcelli Fontana+, Andrea De Lucia*, Rocco Oliveto°*University of Salerno, +University of Milano-Bicocca, °University of Molise

The severity of design flaws can help a machine learner in distinguishing those
components having higher probability to be subject of bugs in the future
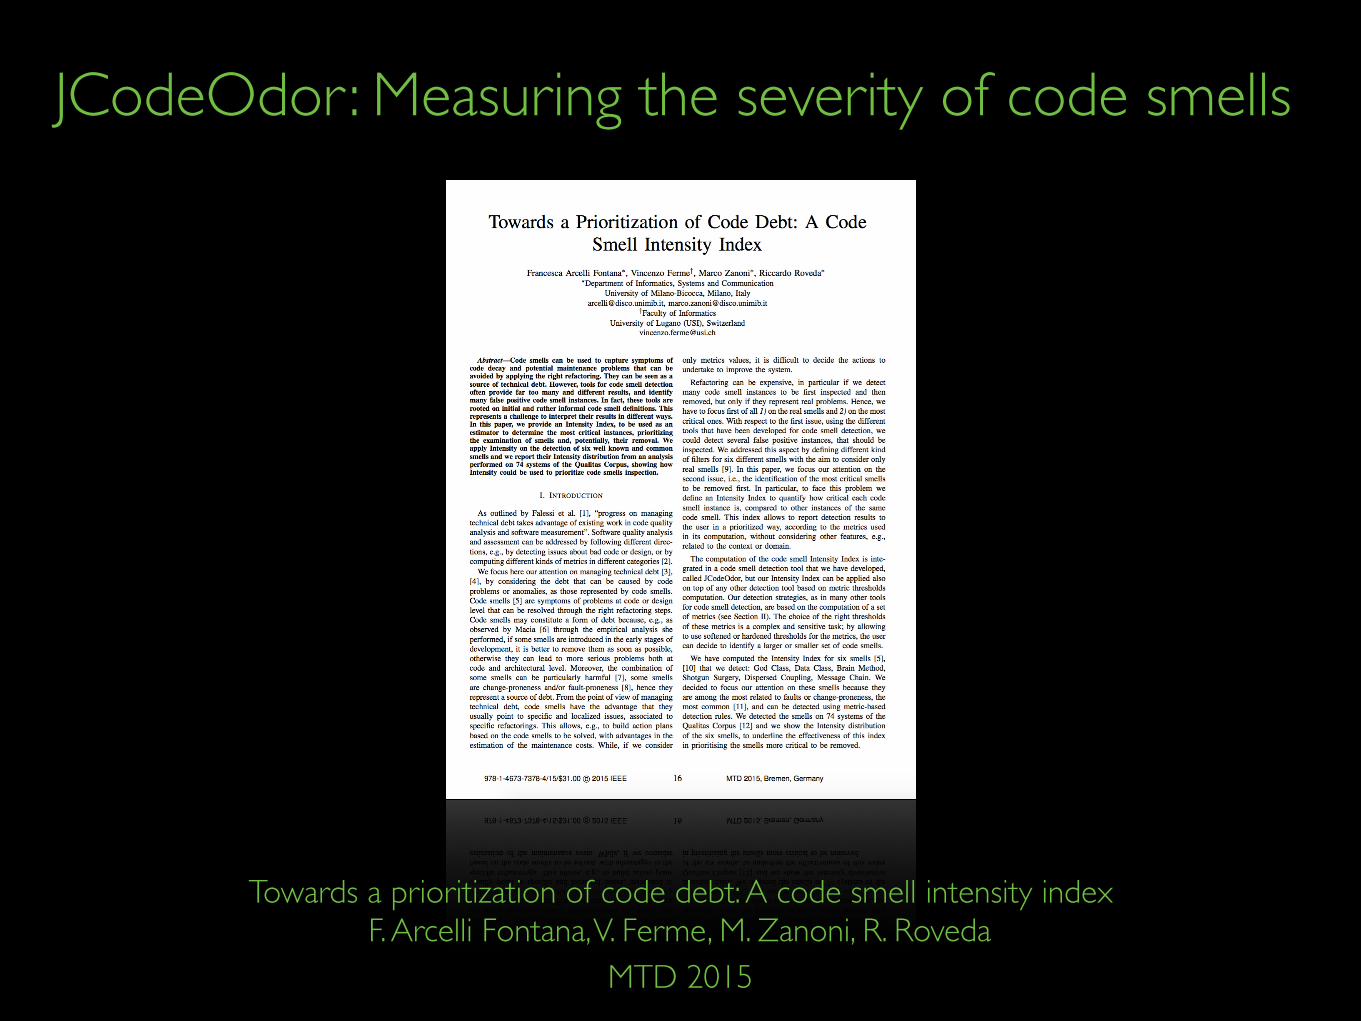
JCodeOdor: Measuring the severity of code smells
F. Arcelli Fontana, V. Ferme, M. Zanoni, R. RovedaTowards a prioritization of code debt: A code smell intensity index
MTD 2015
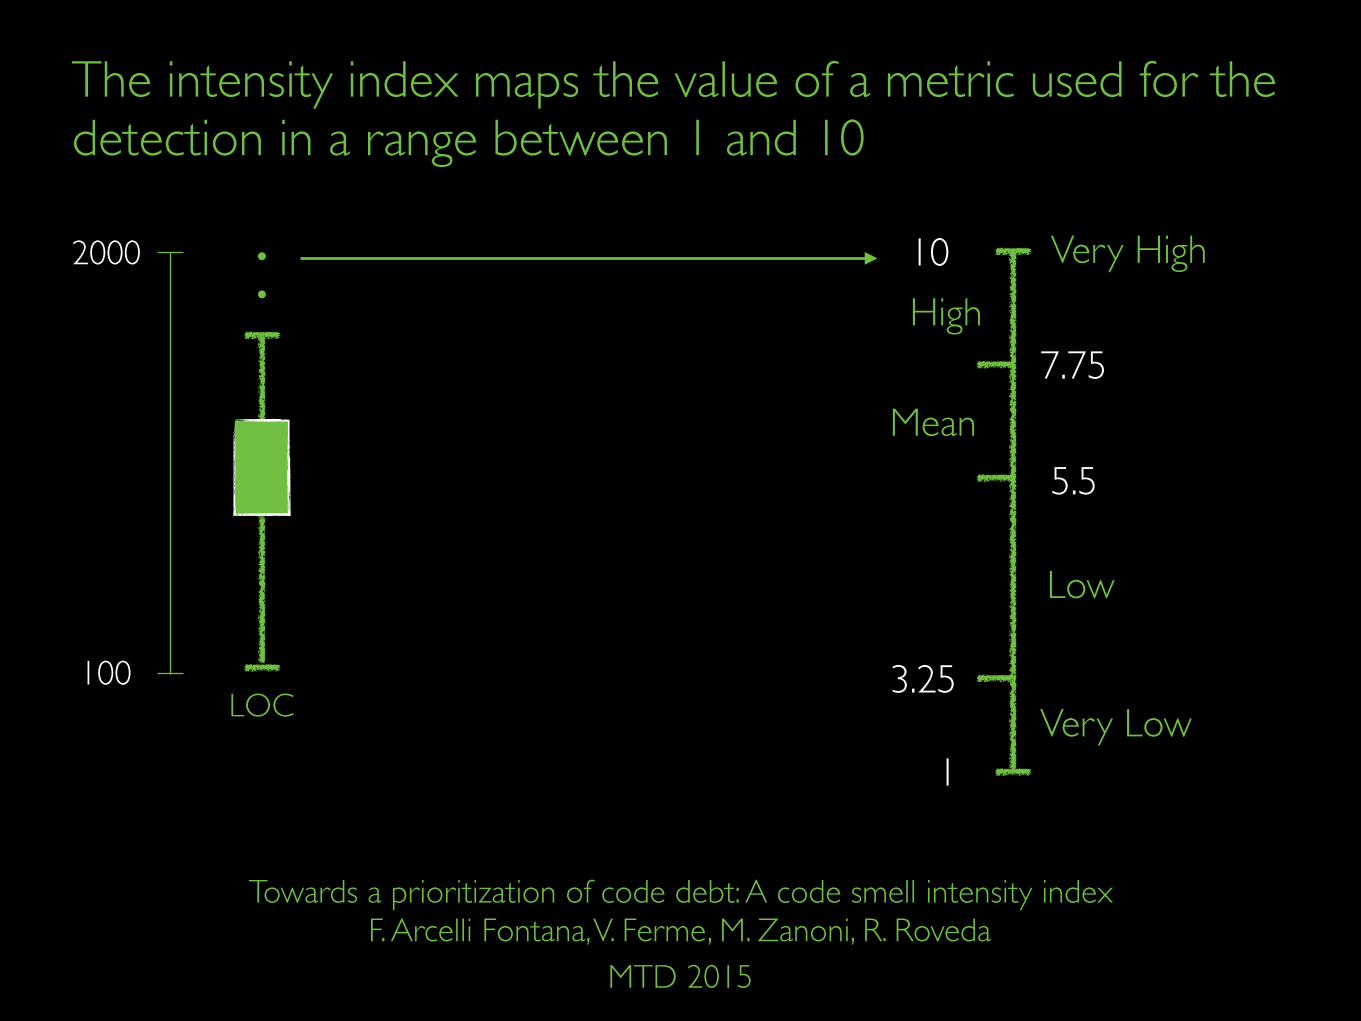
The intensity index maps the value of a metric used for the detection in a range between 1 and 10
F. Arcelli Fontana, V. Ferme, M. Zanoni, R. RovedaTowards a prioritization of code debt: A code smell intensity index
MTD 2015
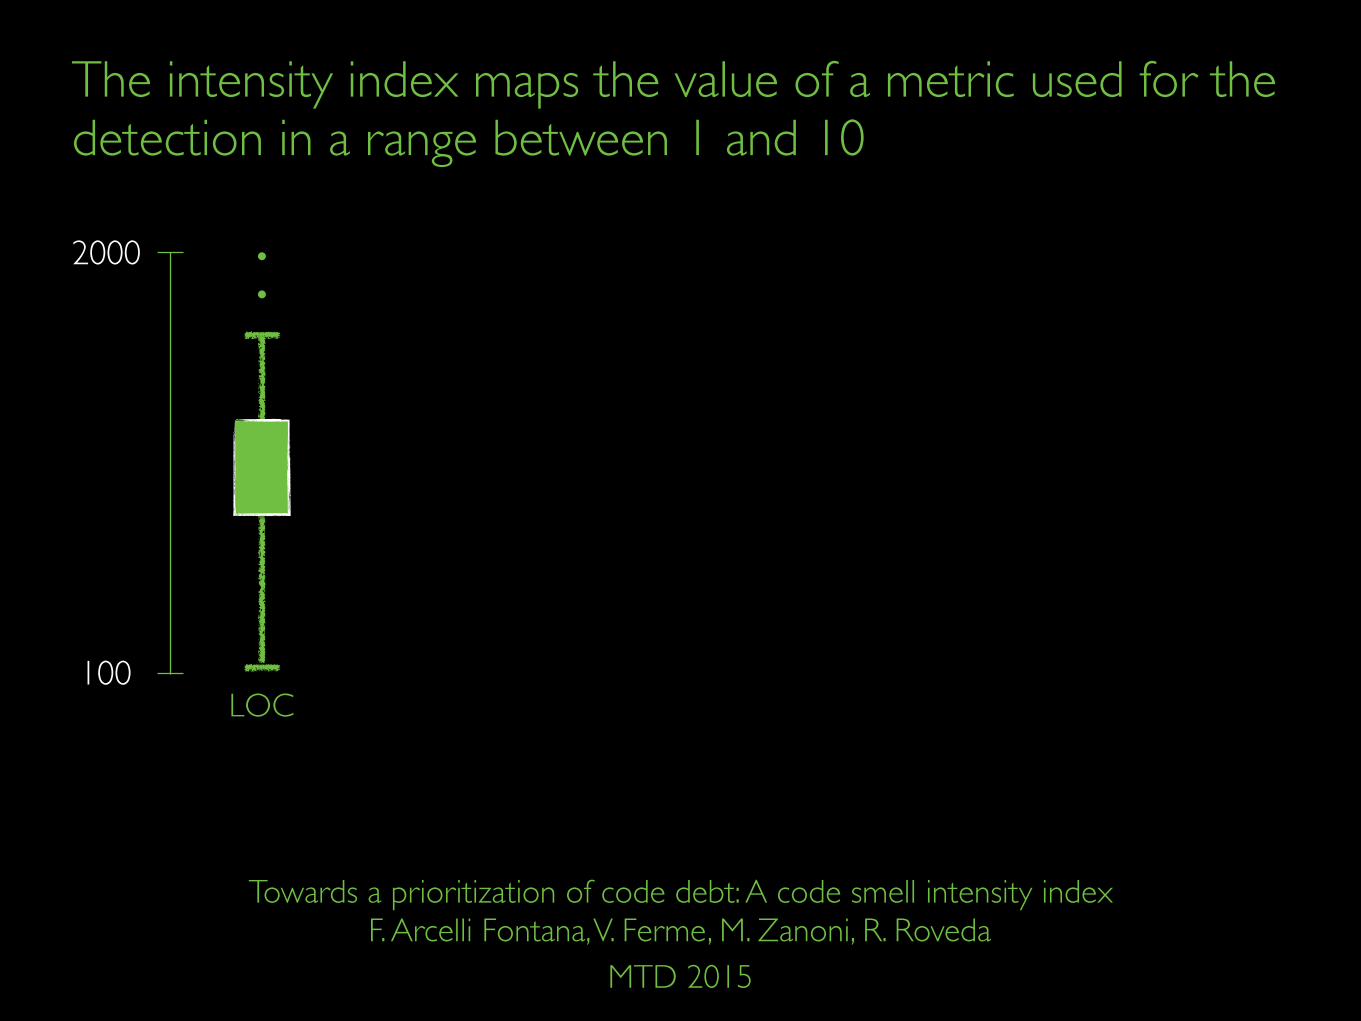
The intensity index maps the value of a metric used for the detection in a range between 1 and 10
F. Arcelli Fontana, V. Ferme, M. Zanoni, R. RovedaTowards a prioritization of code debt: A code smell intensity index
MTD 2015
LOC100
2000
The intensity index maps the value of a metric used for the detection in a range between 1 and 10
F. Arcelli Fontana, V. Ferme, M. Zanoni, R. RovedaTowards a prioritization of code debt: A code smell intensity index
MTD 2015
LOC100
2000 Very High
Very Low
High
Low
Mean
1
3.25
5.5
7.75
10
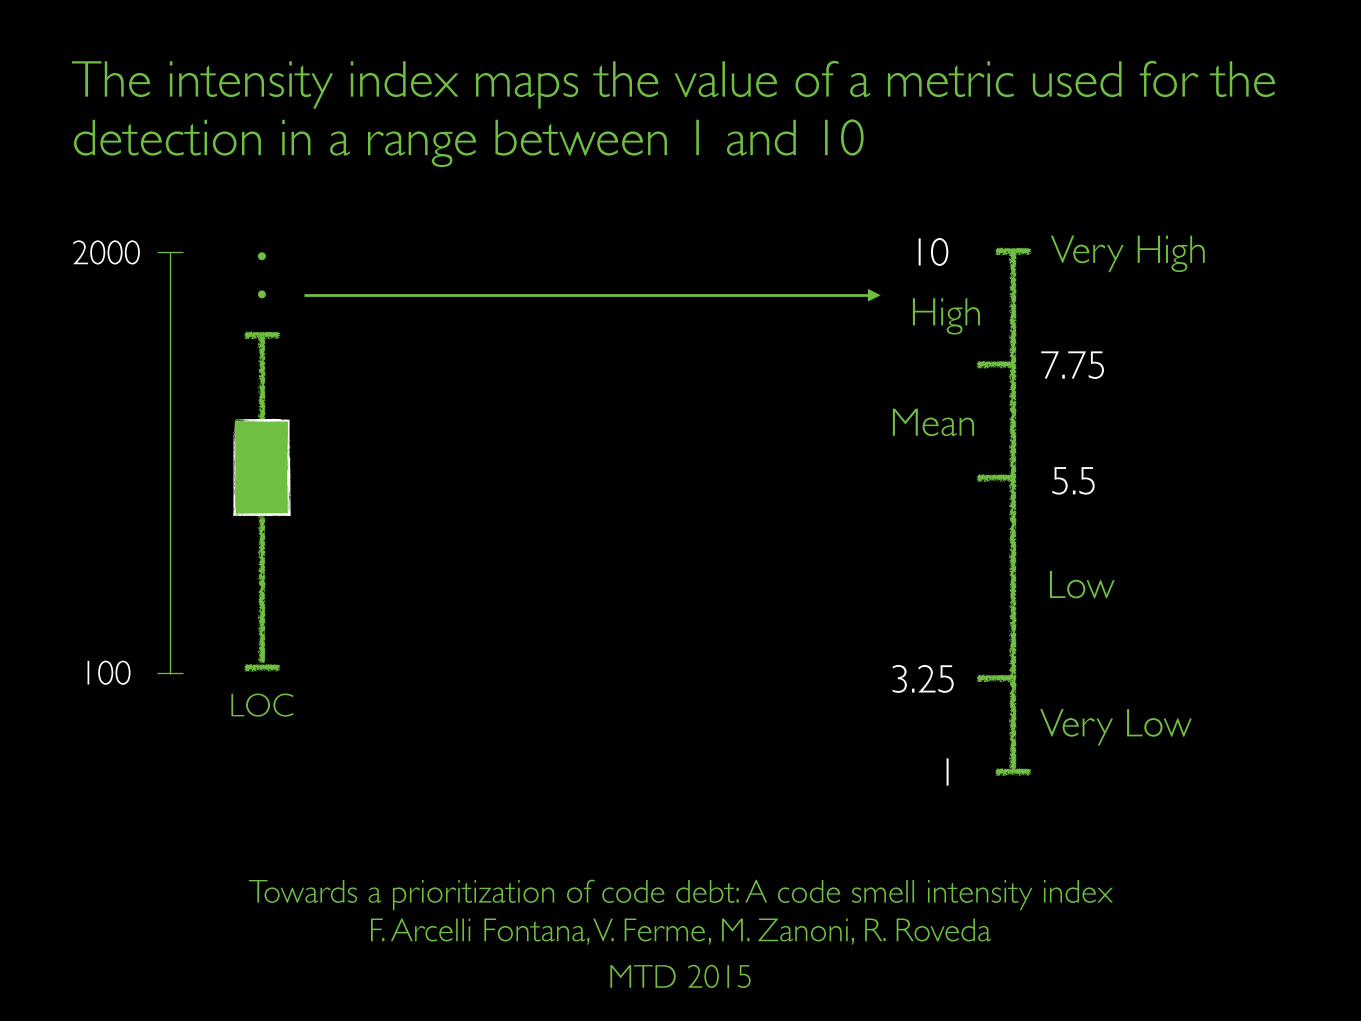
The intensity index maps the value of a metric used for the detection in a range between 1 and 10
F. Arcelli Fontana, V. Ferme, M. Zanoni, R. RovedaTowards a prioritization of code debt: A code smell intensity index
MTD 2015
LOC100
2000 Very High
Very Low
High
Low
Mean
1
3.25
5.5
7.75
10
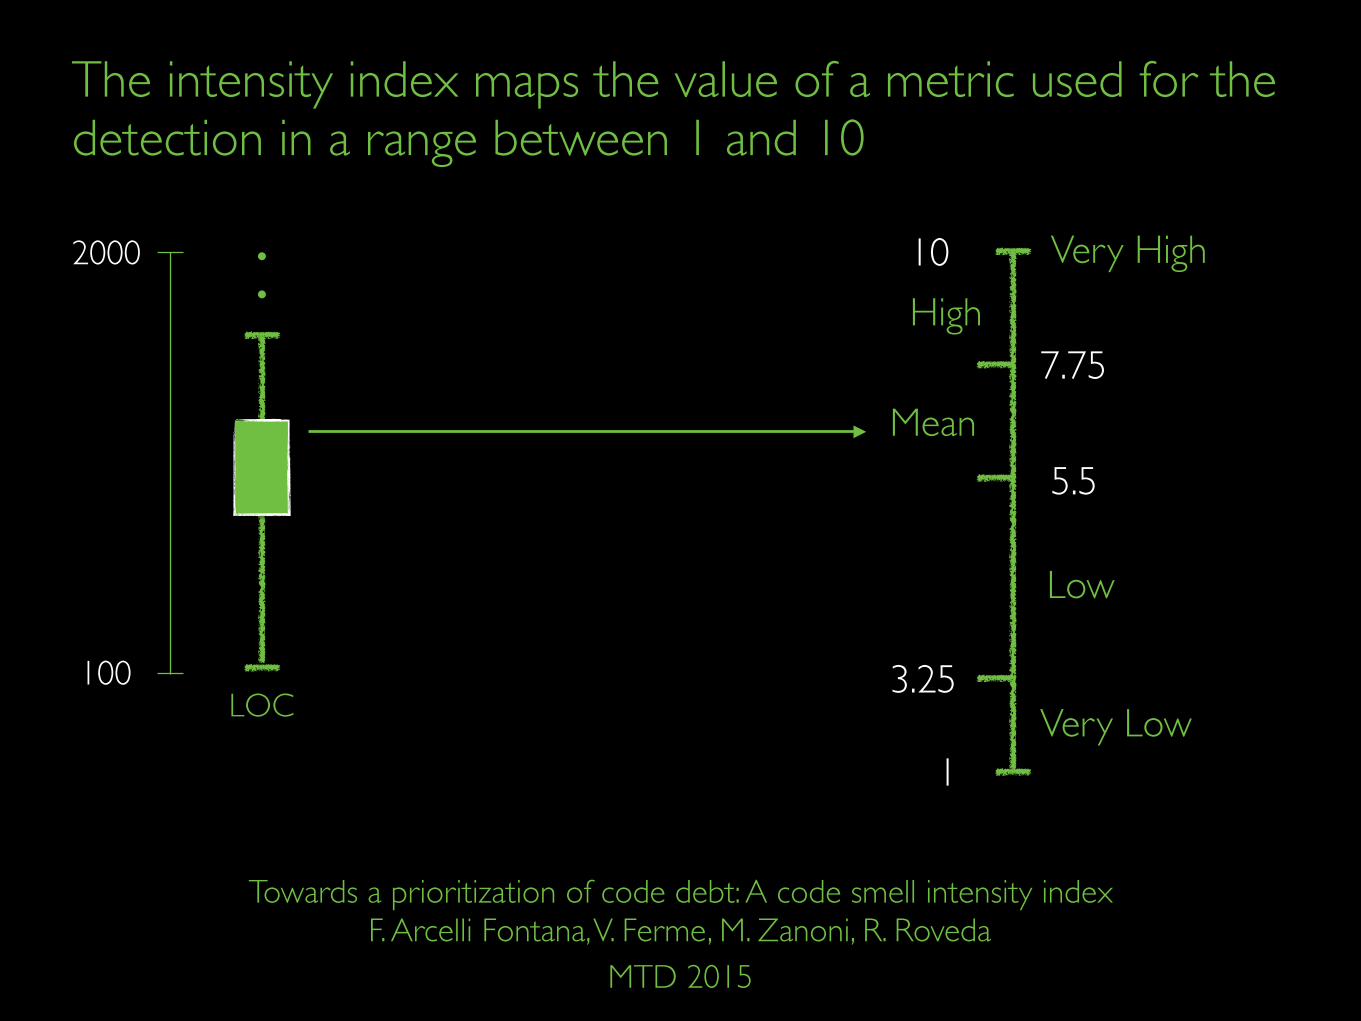
The intensity index maps the value of a metric used for the detection in a range between 1 and 10
F. Arcelli Fontana, V. Ferme, M. Zanoni, R. RovedaTowards a prioritization of code debt: A code smell intensity index
MTD 2015
LOC100
2000 Very High
Very Low
High
Low
Mean
1
3.25
5.5
7.75
10
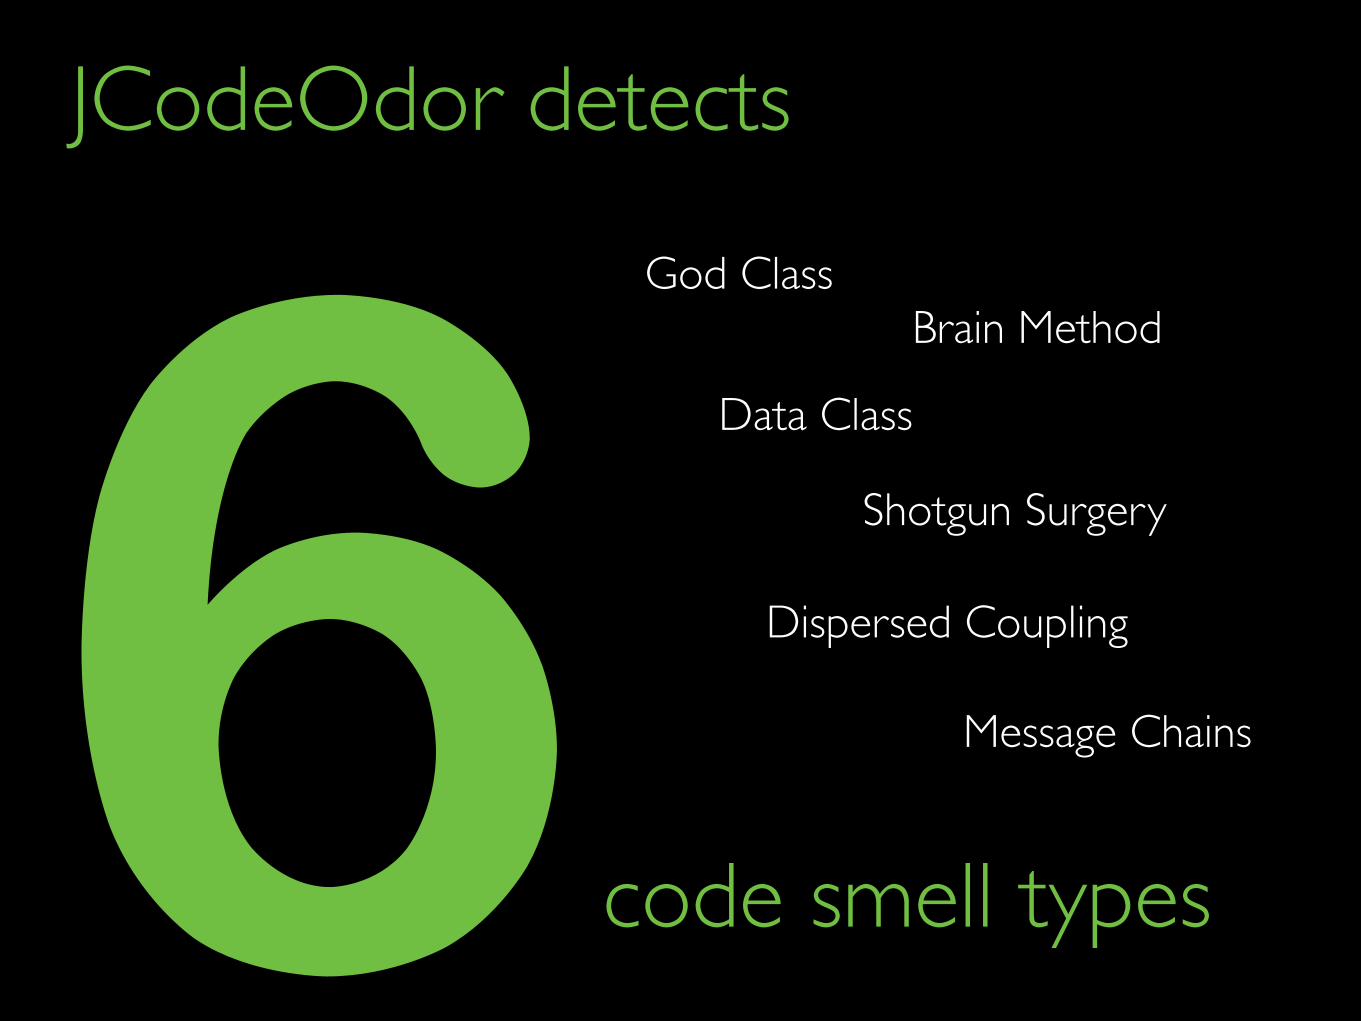
6code smell types
God ClassBrain Method
Data Class
Shotgun Surgery
Dispersed Coupling
JCodeOdor detects
Message Chains
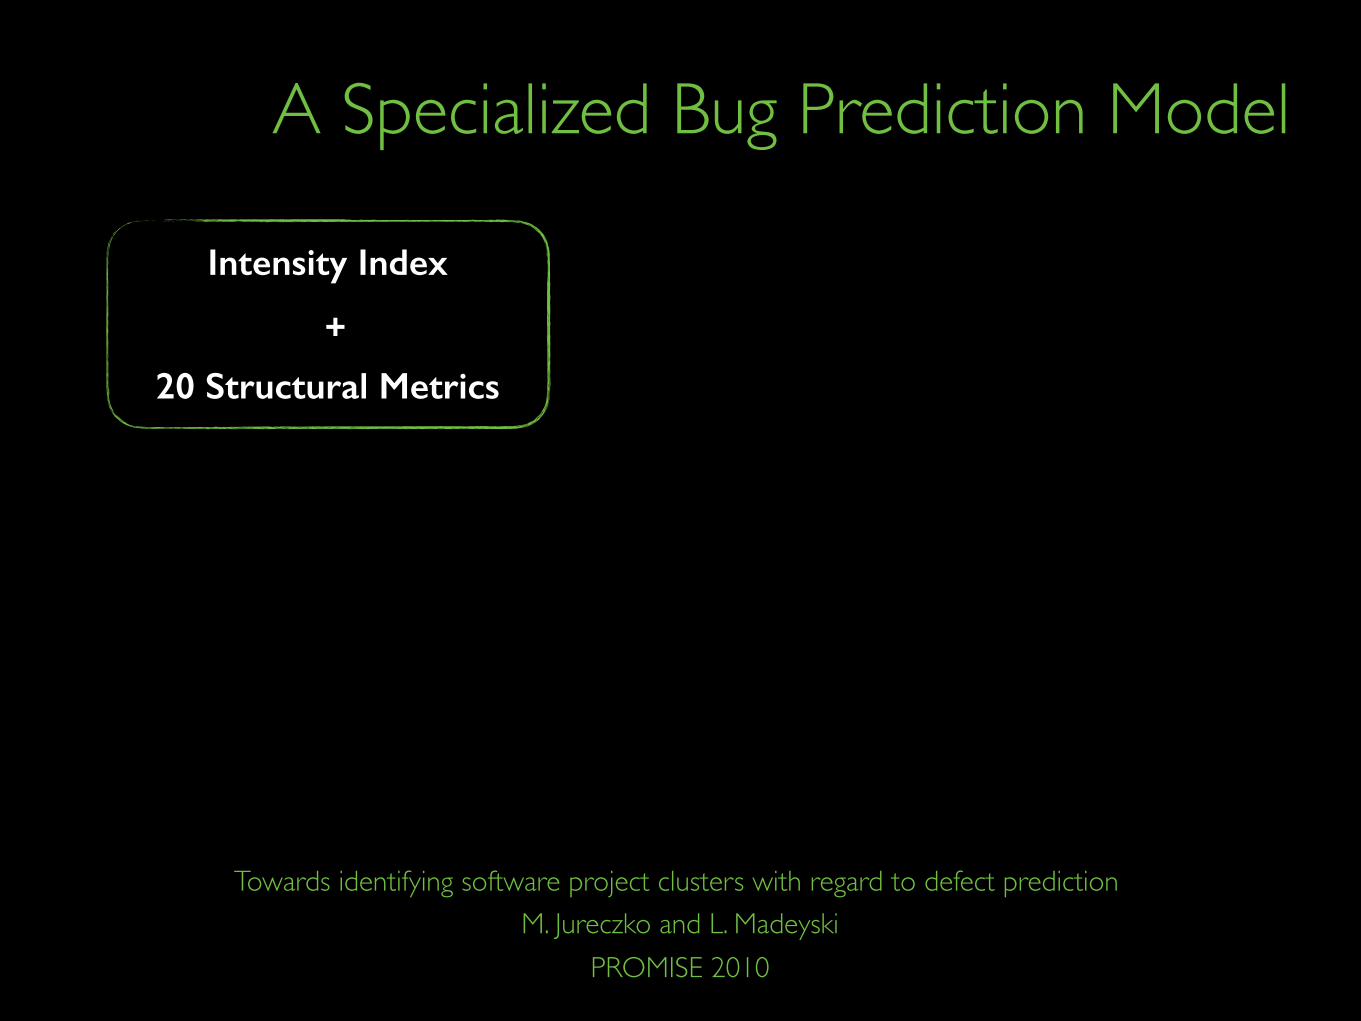
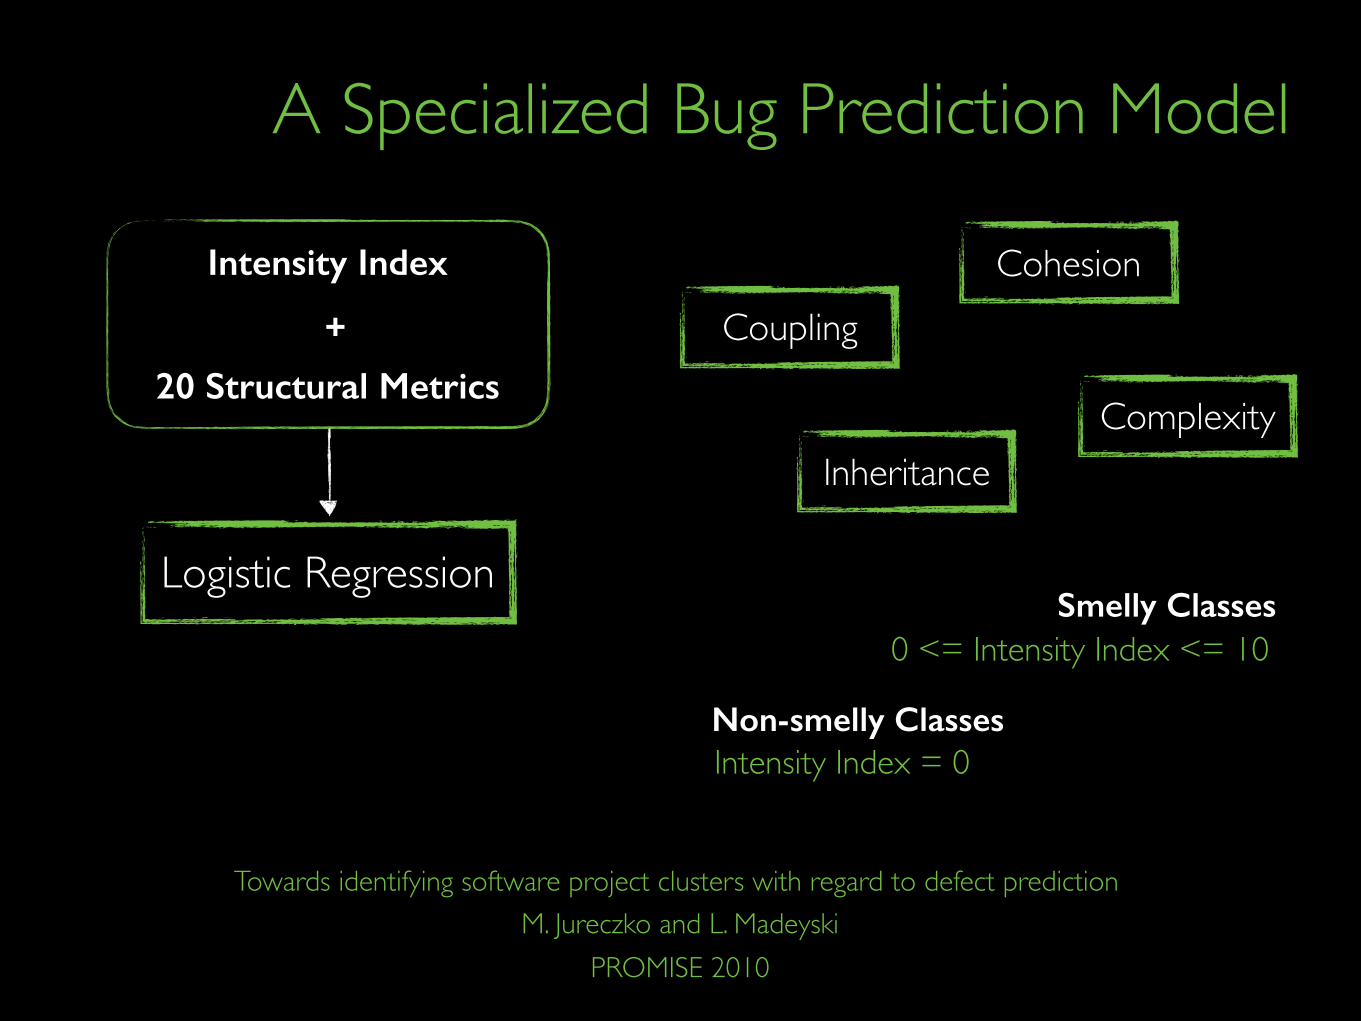
A Specialized Bug Prediction Model
Intensity Index
+
20 Structural Metrics
M. Jureczko and L. MadeyskiTowards identifying software project clusters with regard to defect prediction
PROMISE 2010
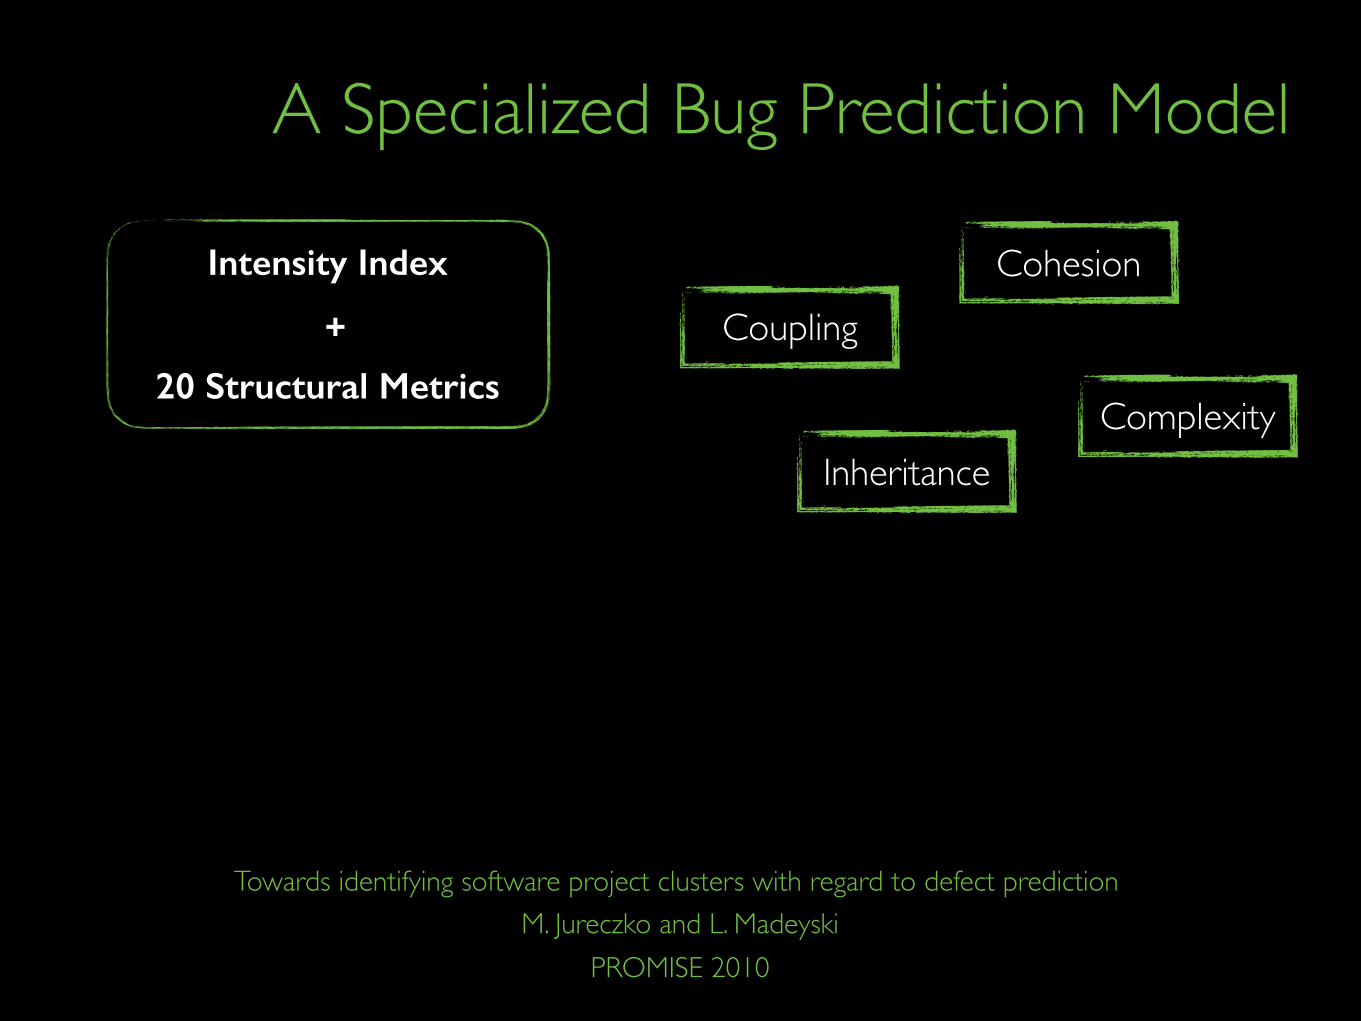
A Specialized Bug Prediction Model
Intensity Index
+
20 Structural Metrics
CohesionCoupling
ComplexityInheritance
M. Jureczko and L. MadeyskiTowards identifying software project clusters with regard to defect prediction
PROMISE 2010
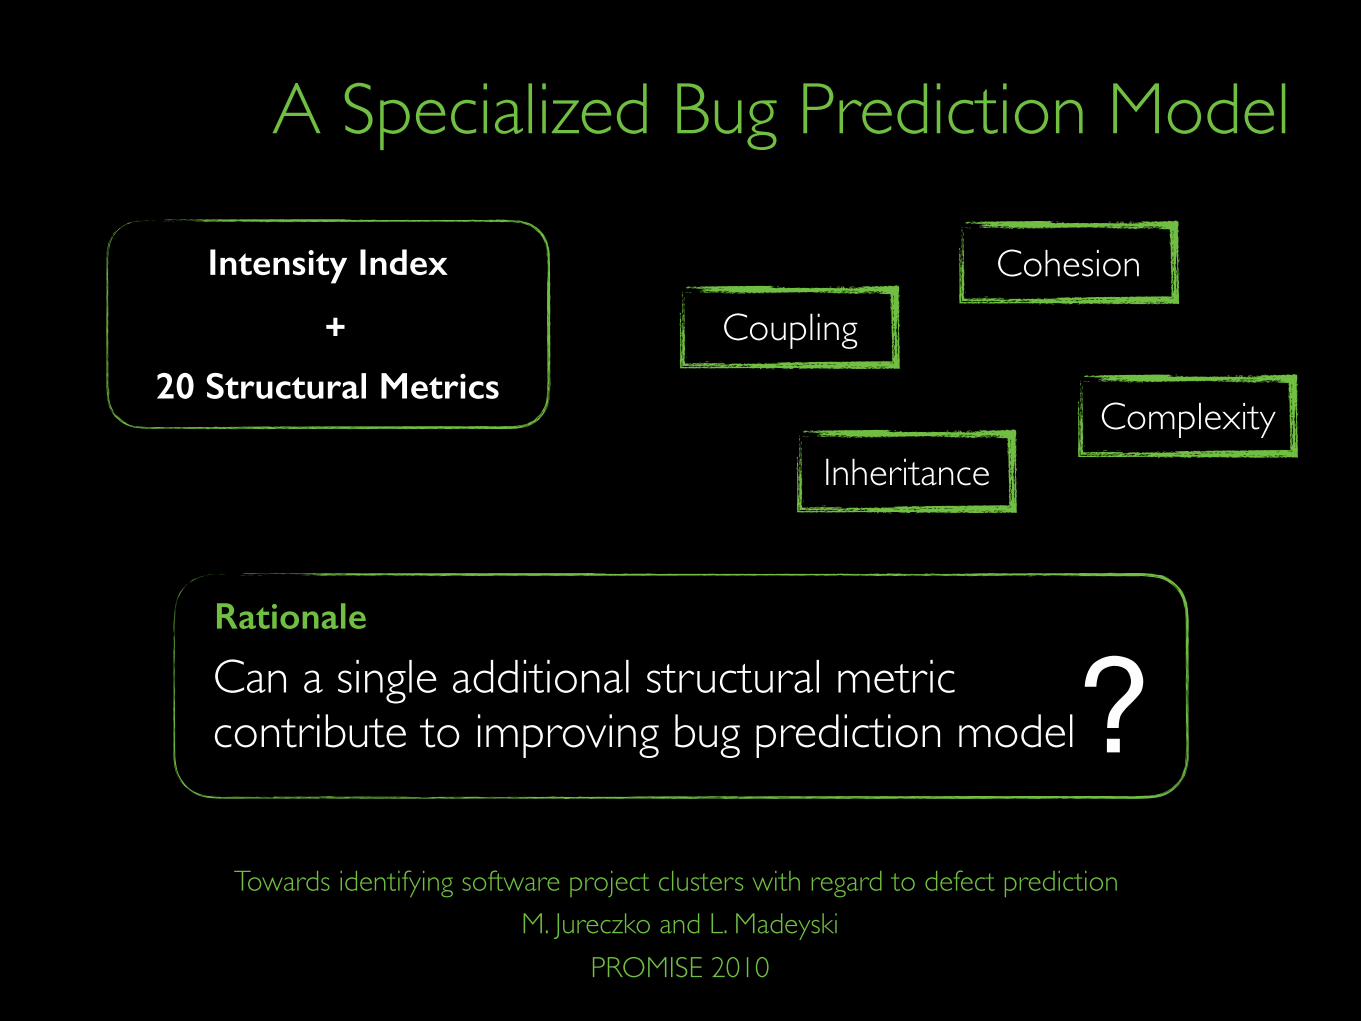
A Specialized Bug Prediction Model
Intensity Index
+
20 Structural Metrics
CohesionCoupling
ComplexityInheritance
Can a single additional structural metric contribute to improving bug prediction model?Rationale
M. Jureczko and L. MadeyskiTowards identifying software project clusters with regard to defect prediction
PROMISE 2010
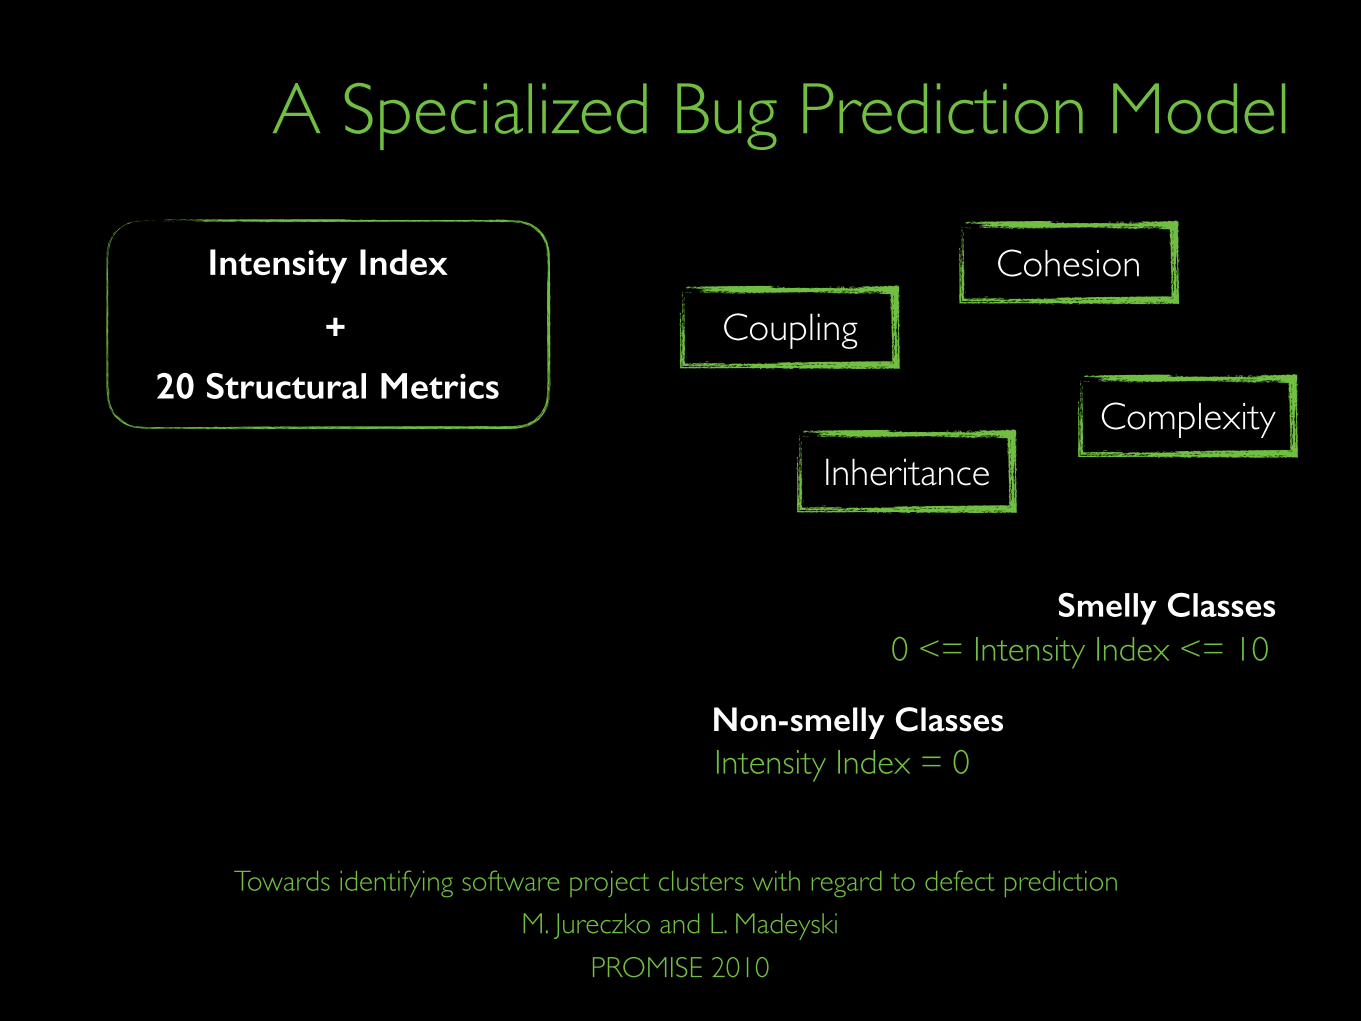
A Specialized Bug Prediction Model
Intensity Index
+
20 Structural Metrics
0 <= Intensity Index <= 10
Intensity Index = 0
Smelly Classes
Non-smelly Classes
M. Jureczko and L. MadeyskiTowards identifying software project clusters with regard to defect prediction
PROMISE 2010
CohesionCoupling
ComplexityInheritance
A Specialized Bug Prediction Model
Intensity Index
+
20 Structural Metrics
0 <= Intensity Index <= 10Smelly Classes
Non-smelly Classes
M. Jureczko and L. MadeyskiTowards identifying software project clusters with regard to defect prediction
PROMISE 2010
CohesionCoupling
ComplexityInheritance
Logistic Regression
Intensity Index = 0
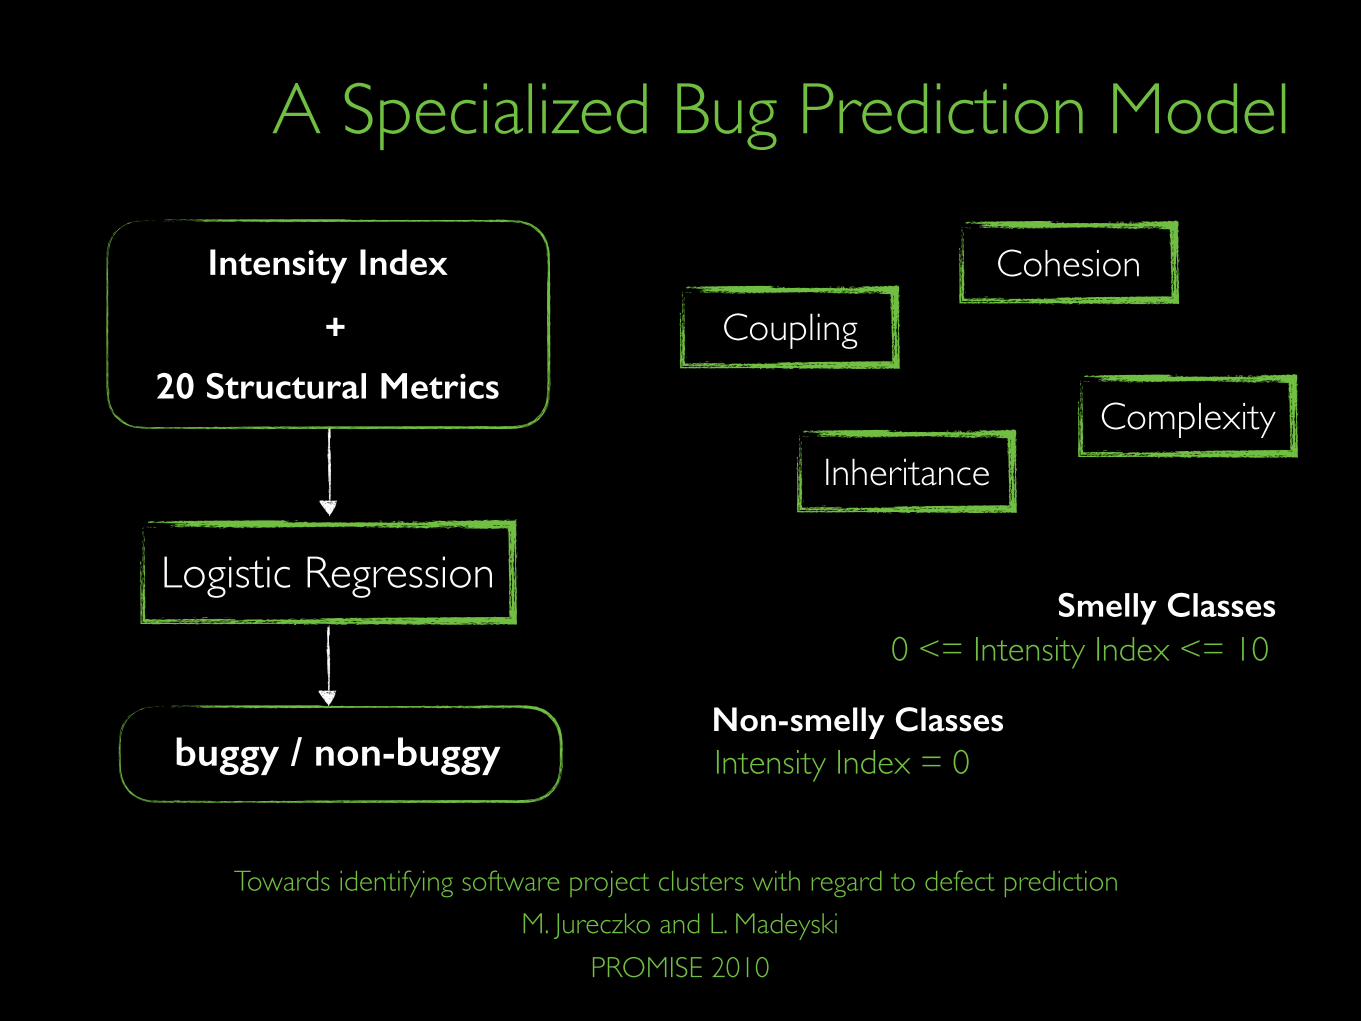
A Specialized Bug Prediction Model
Intensity Index
+
20 Structural Metrics
0 <= Intensity Index <= 10Smelly Classes
Non-smelly Classes
M. Jureczko and L. MadeyskiTowards identifying software project clusters with regard to defect prediction
PROMISE 2010
CohesionCoupling
ComplexityInheritance
Logistic Regression
buggy / non-buggy Intensity Index = 0

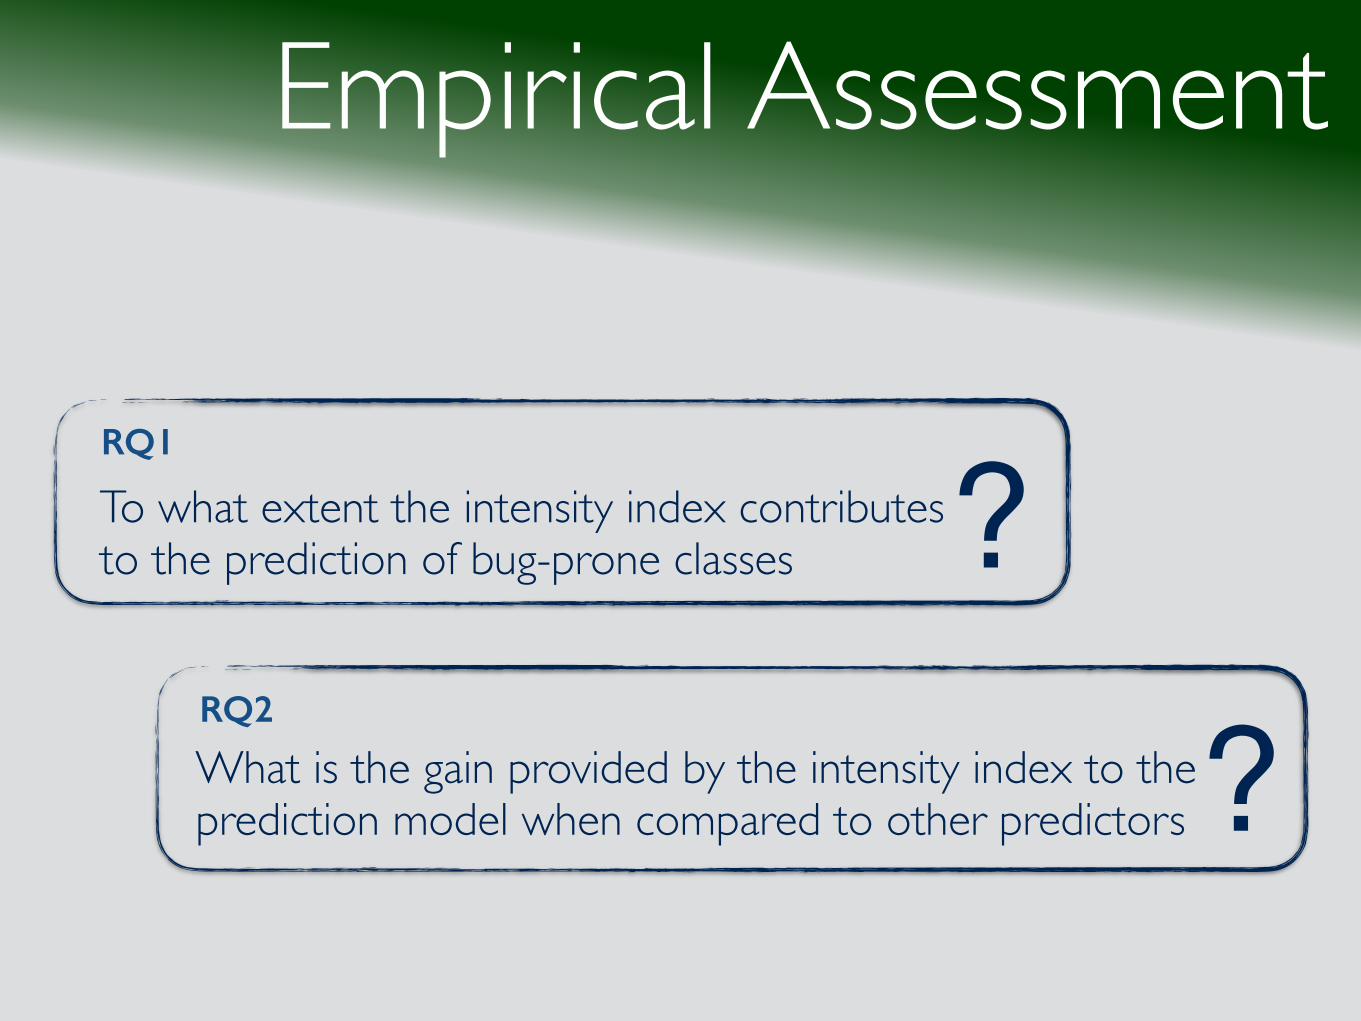
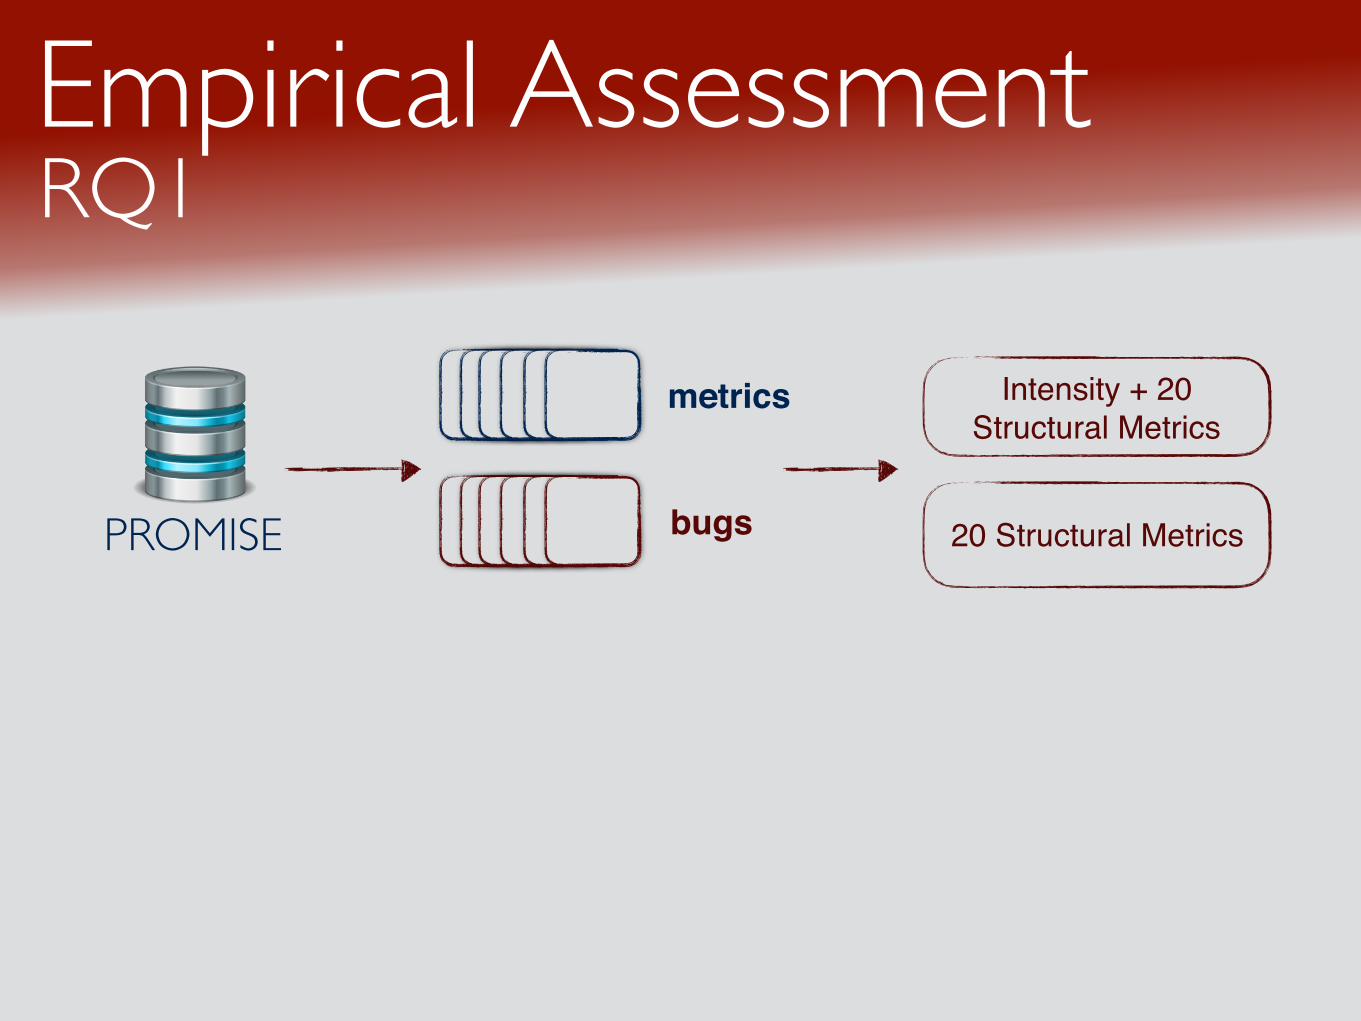
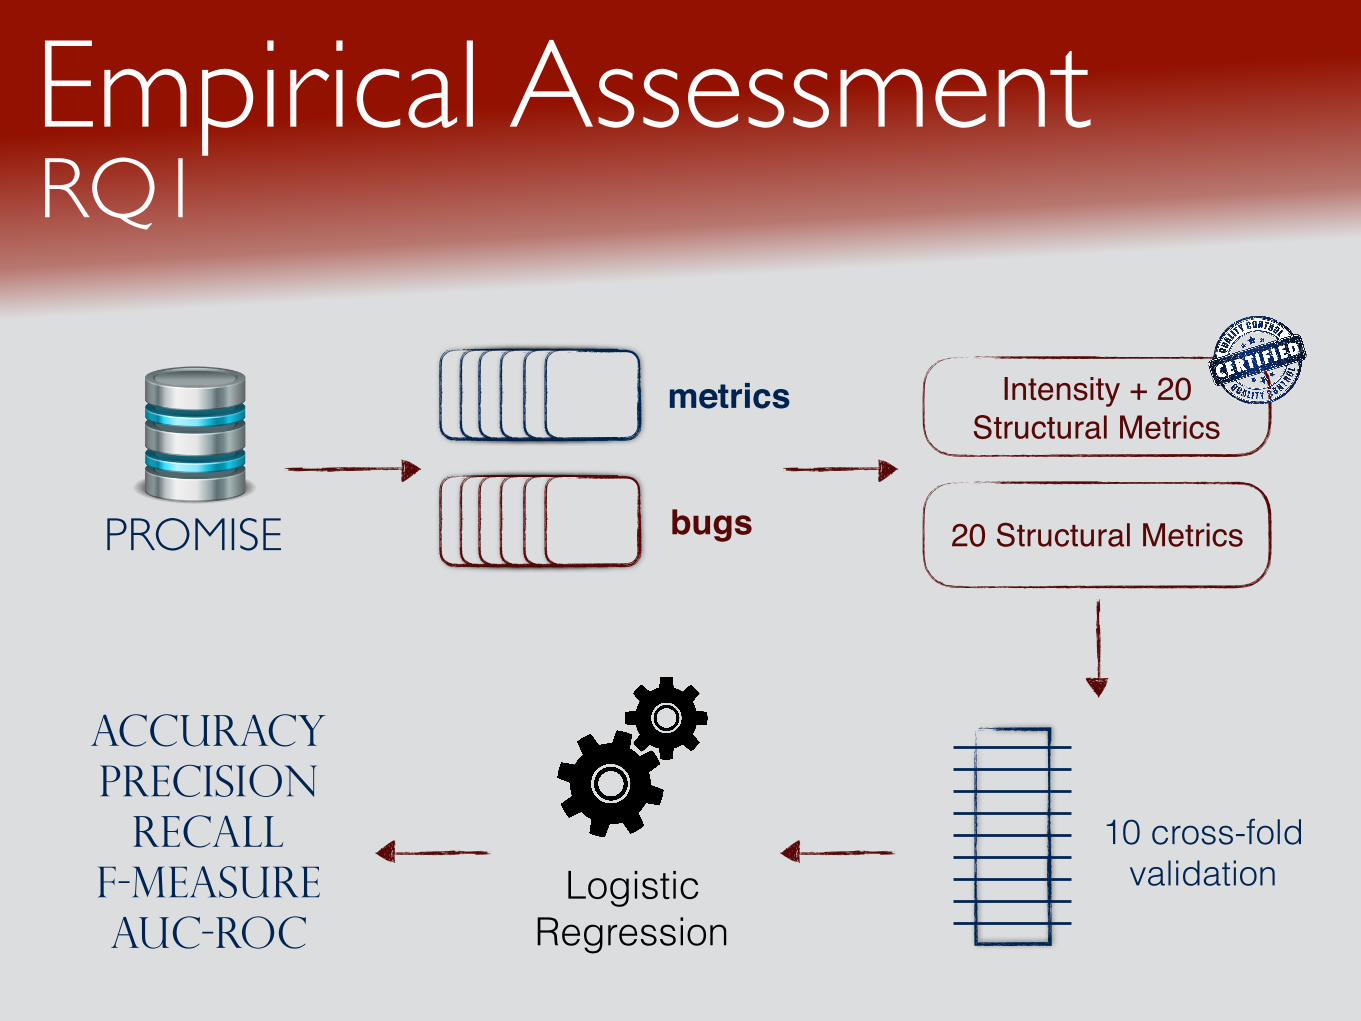
Empirical Assessment
Empirical Assessment
To what extent the intensity index contributes to the prediction of bug-prone classes
RQ1
?What is the gain provided by the intensity index to the prediction model when compared to other predictors
RQ2
?

PROMISE
RQ1Empirical Assessment
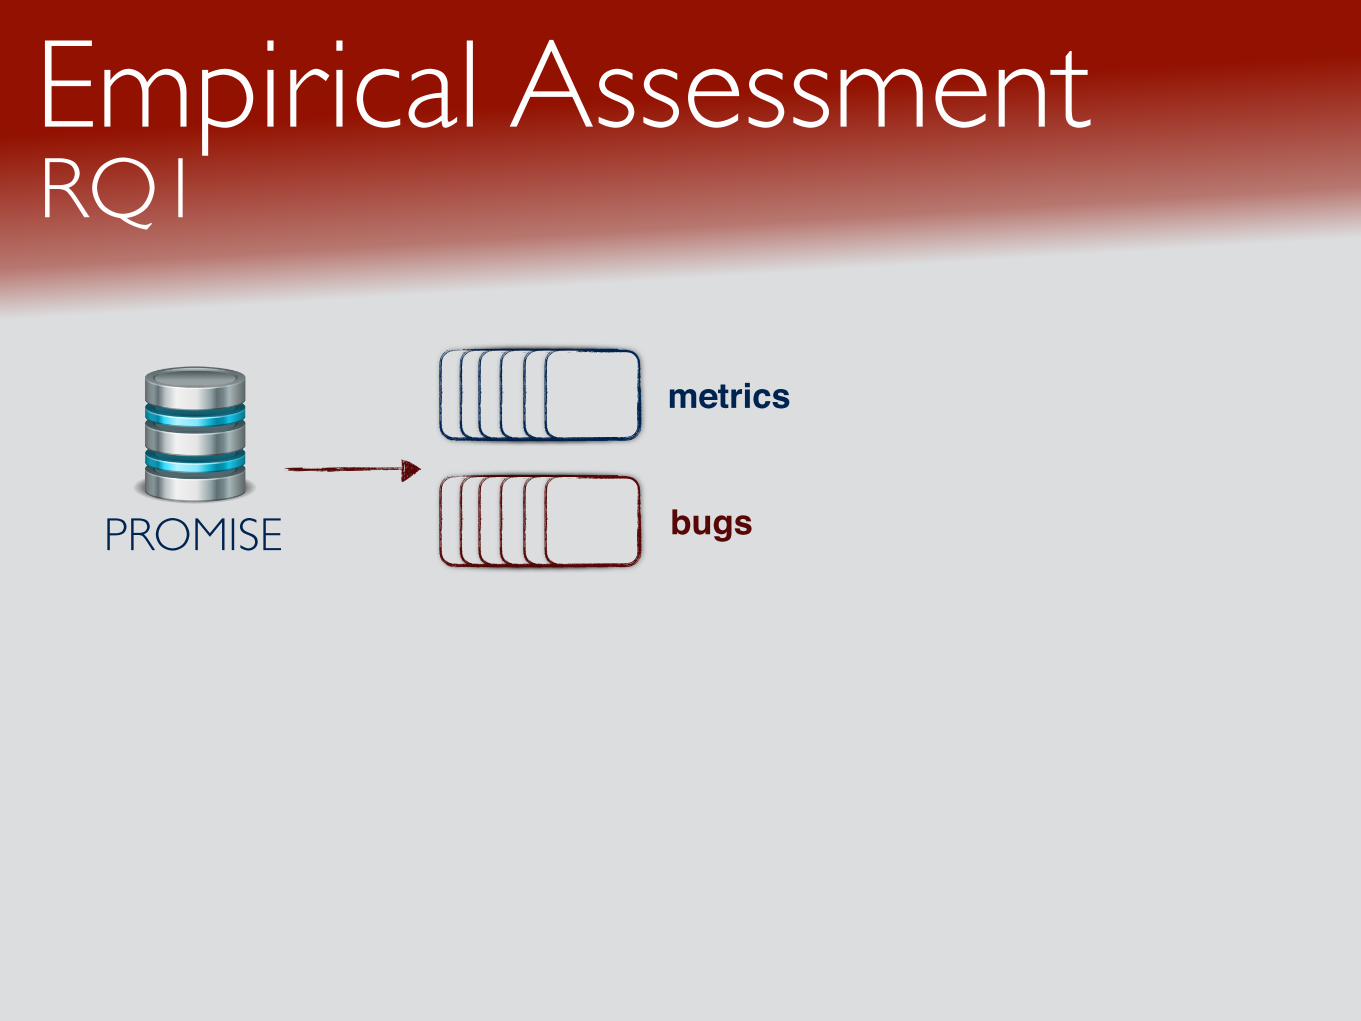
PROMISE
metrics
bugs
RQ1Empirical Assessment
PROMISE
Intensity + 20 Structural Metrics
20 Structural Metrics
metrics
bugs
RQ1Empirical Assessment
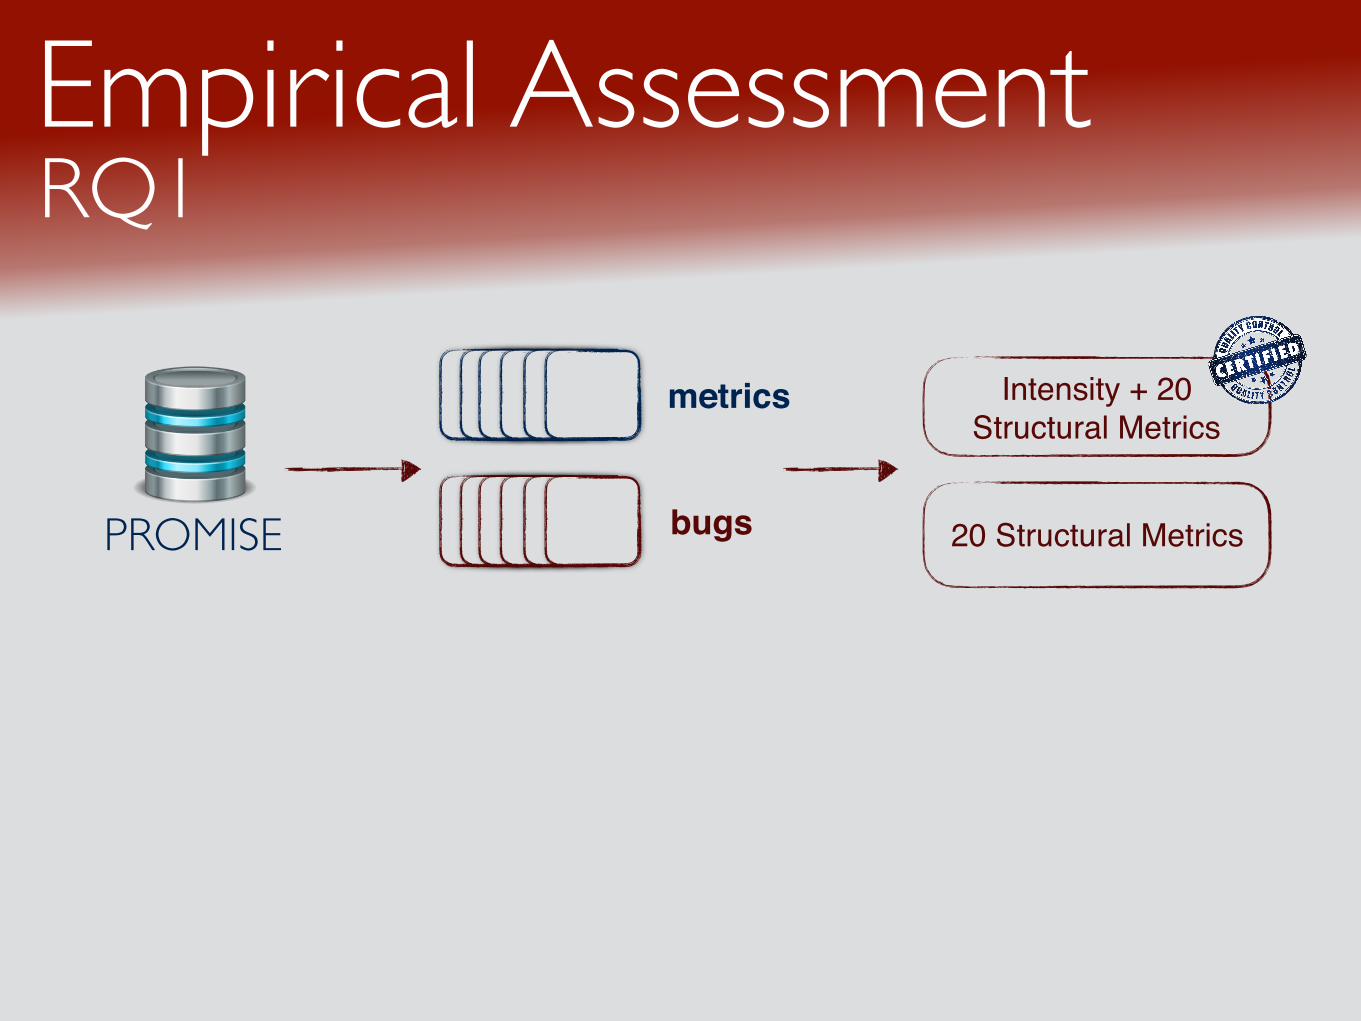
PROMISE
Intensity + 20 Structural Metrics
20 Structural Metrics
metrics
bugs
RQ1Empirical Assessment
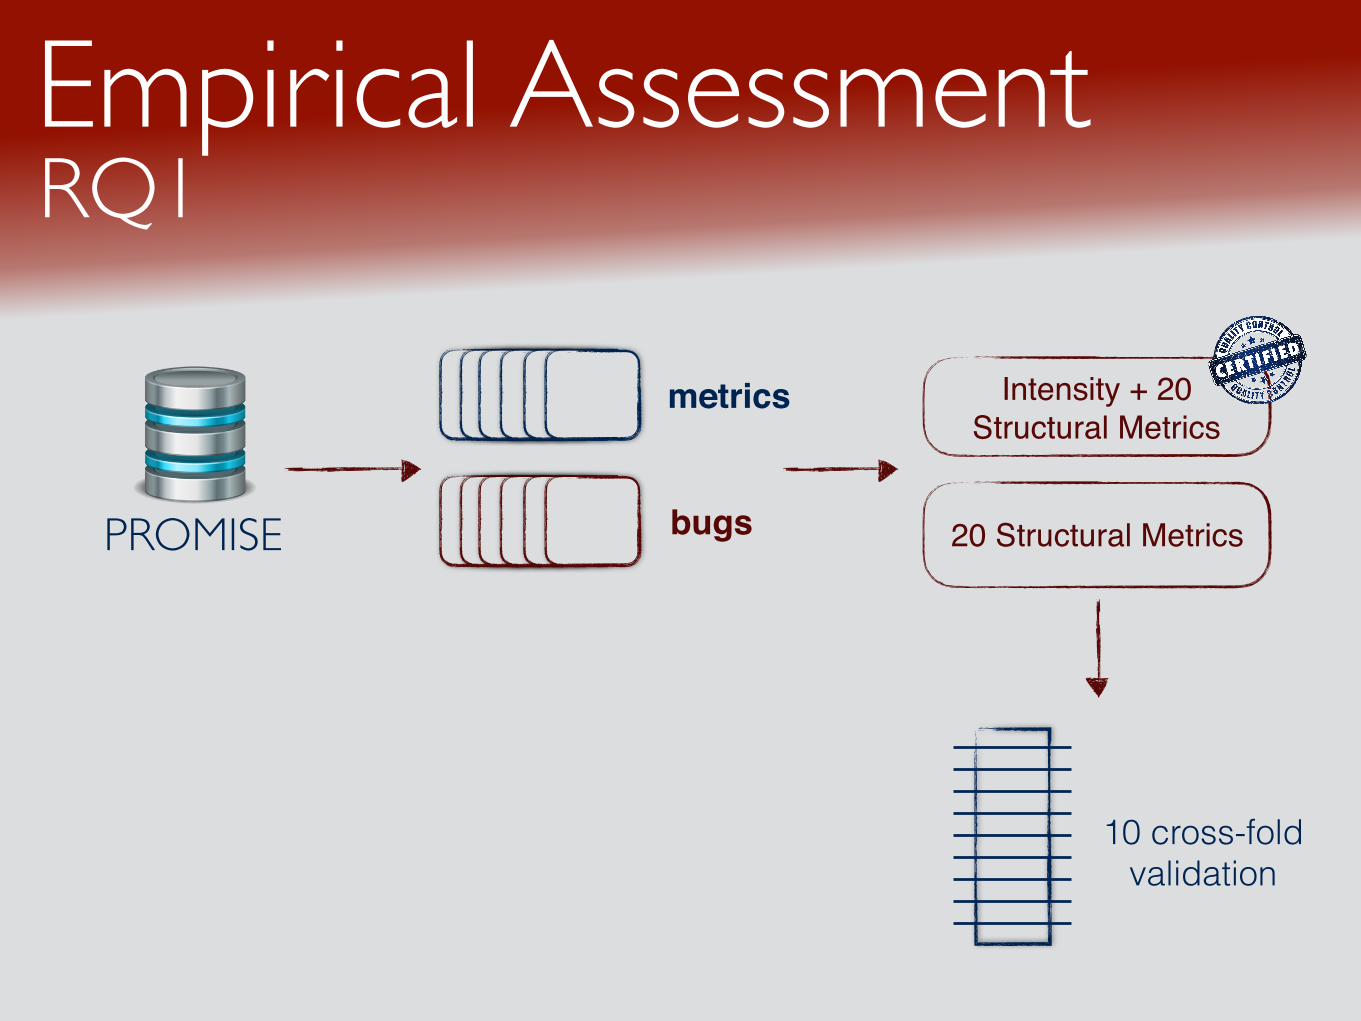
PROMISE
Intensity + 20 Structural Metrics
20 Structural Metrics
10 cross-fold validation
metrics
bugs
RQ1Empirical Assessment
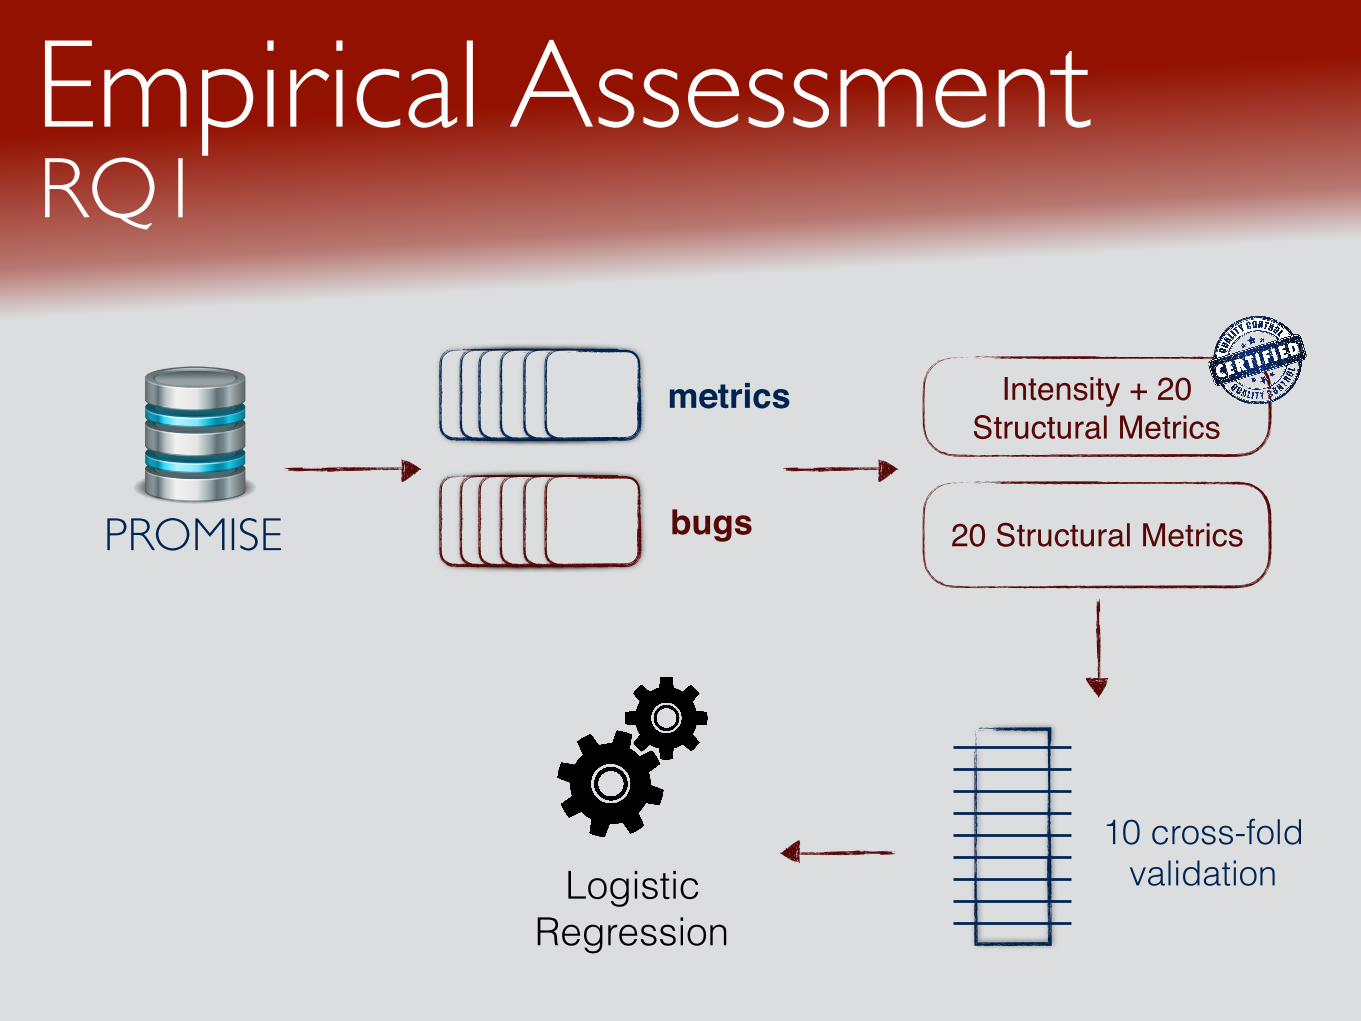
PROMISE
Intensity + 20 Structural Metrics
20 Structural Metrics
Logistic Regression
10 cross-fold validation
metrics
bugs
RQ1Empirical Assessment
PROMISE
Intensity + 20 Structural Metrics
20 Structural Metrics
Logistic Regression
10 cross-fold validation
Accuracy Precision
Recall F-Measure AUC-ROC
metrics
bugs
RQ1Empirical Assessment

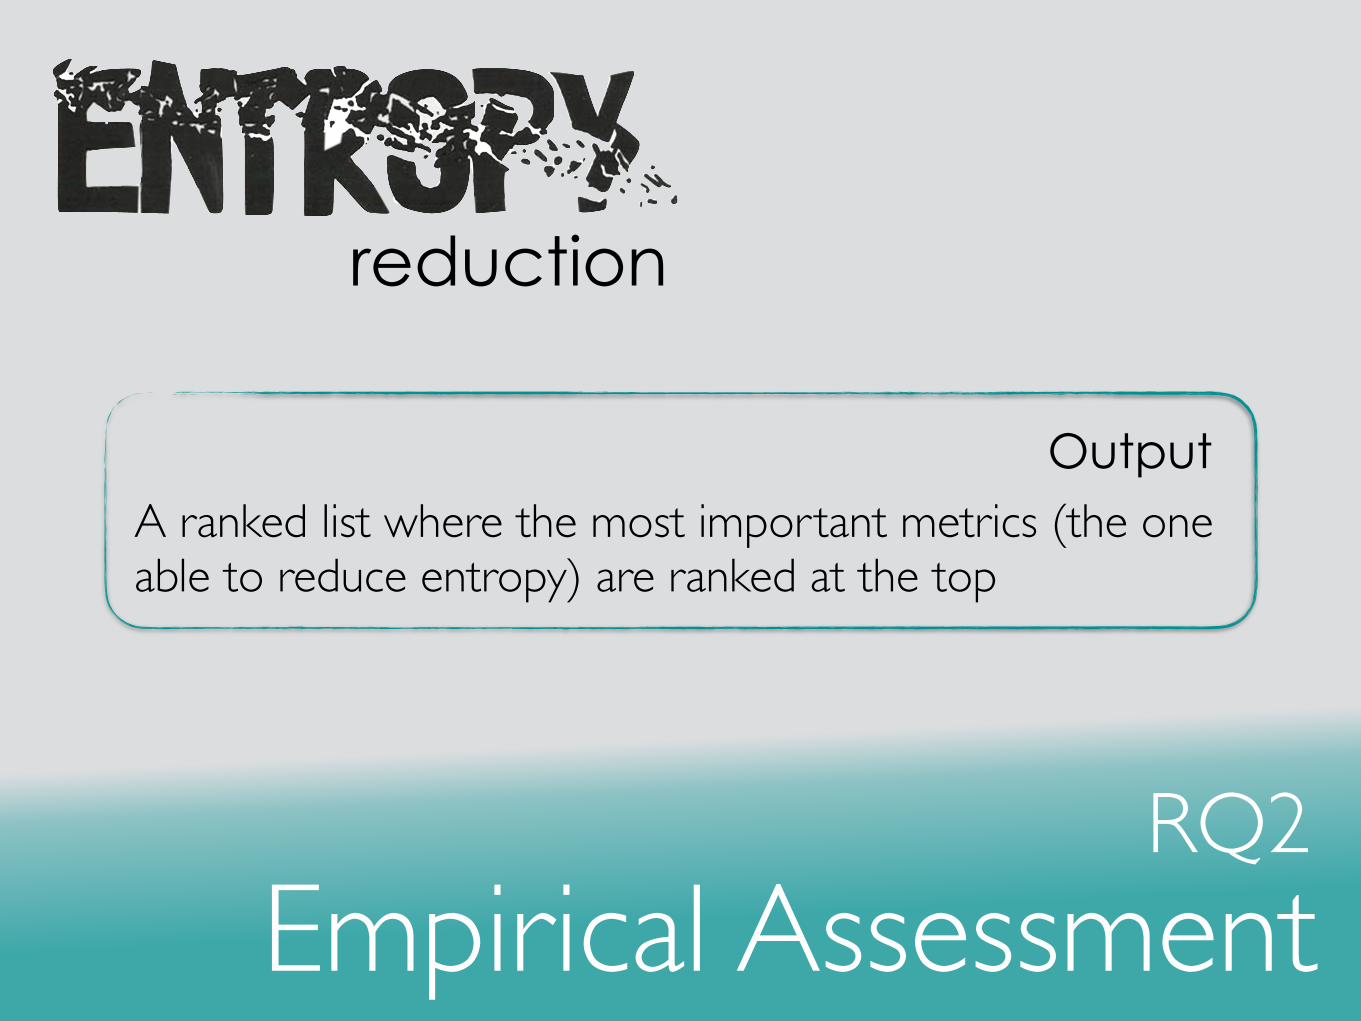
RQ2Empirical Assessment
reduction
Quantifying how much uncertainly in the model is reduced after splitting the model on a given attribute
Information Gain Algorithm
RQ2Empirical Assessment
reduction
A ranked list where the most important metrics (the one able to reduce entropy) are ranked at the top
Output

Analysis of the Results
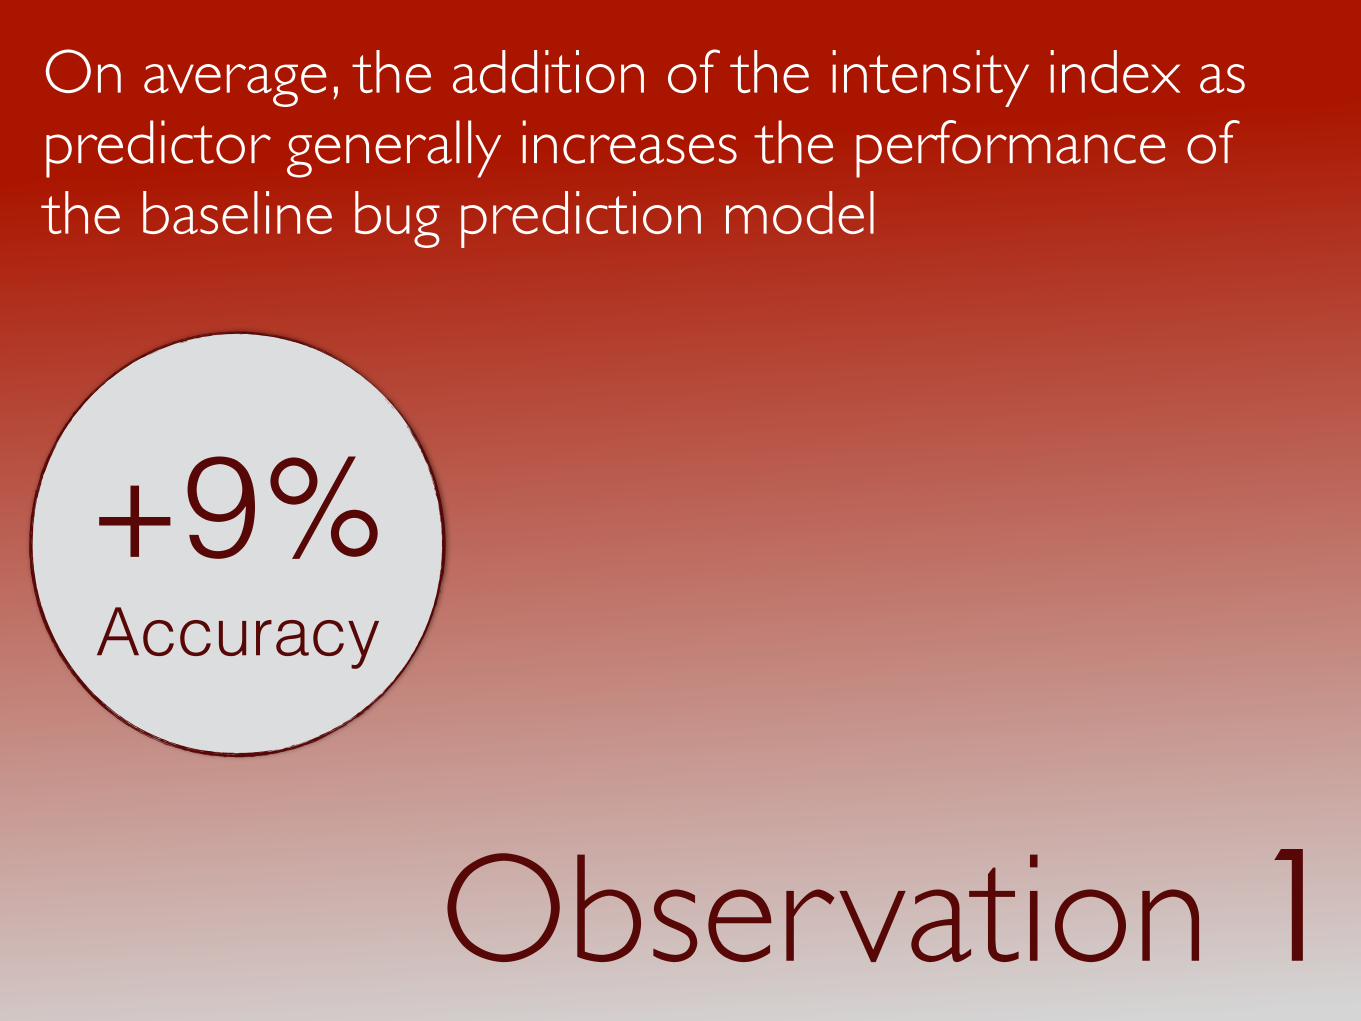
+9% Accuracy
Observation 1
On average, the addition of the intensity index as predictor generally increases the performance of the baseline bug prediction model
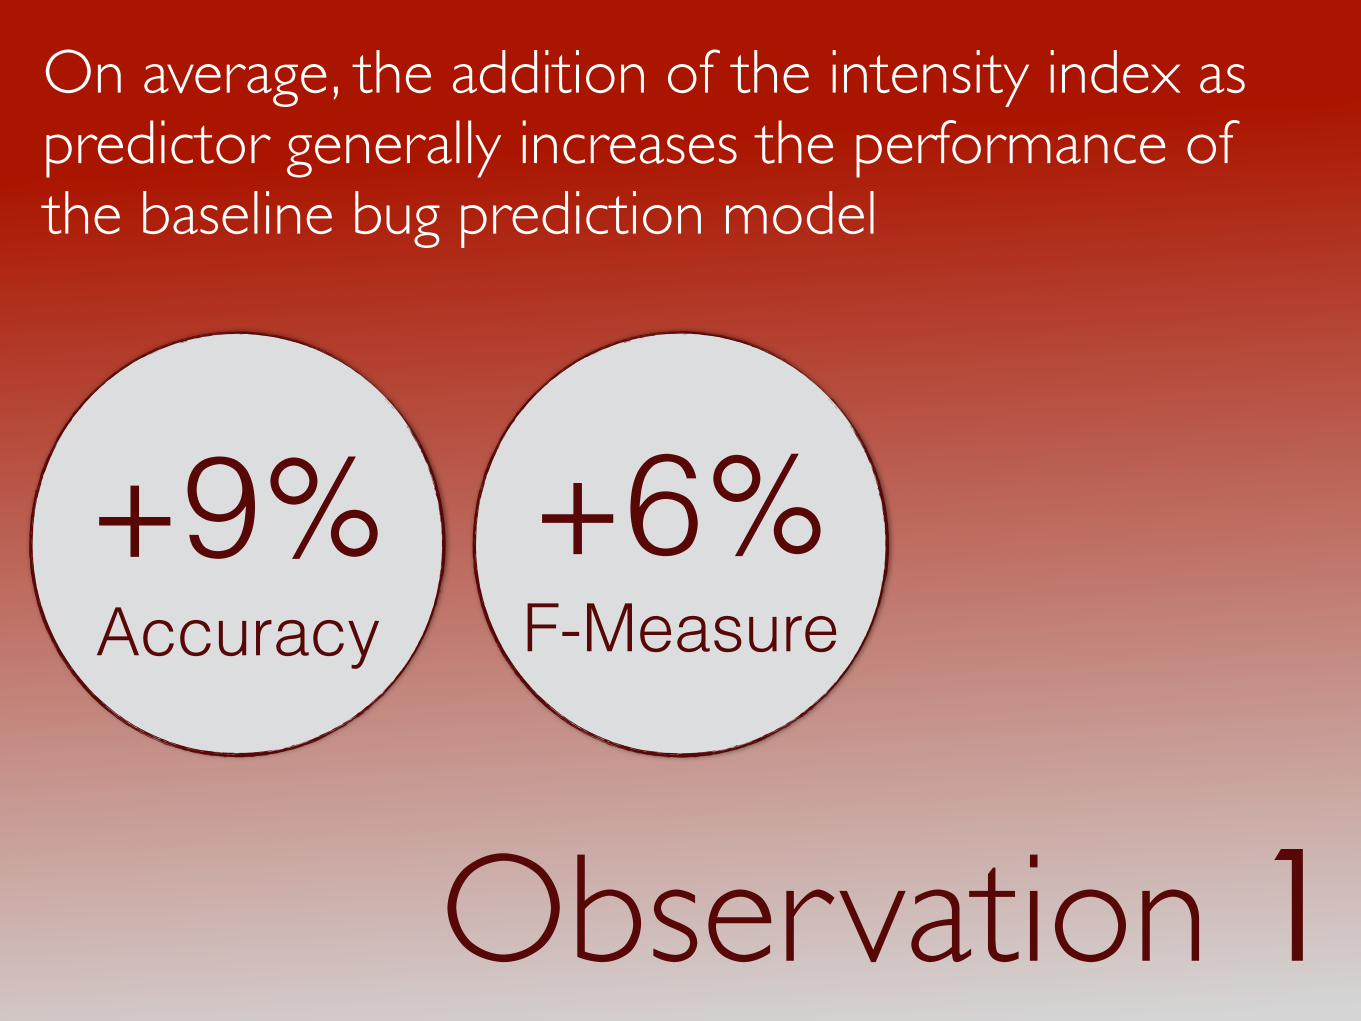
+9% Accuracy
Observation 1
+6% F-Measure
On average, the addition of the intensity index as predictor generally increases the performance of the baseline bug prediction model
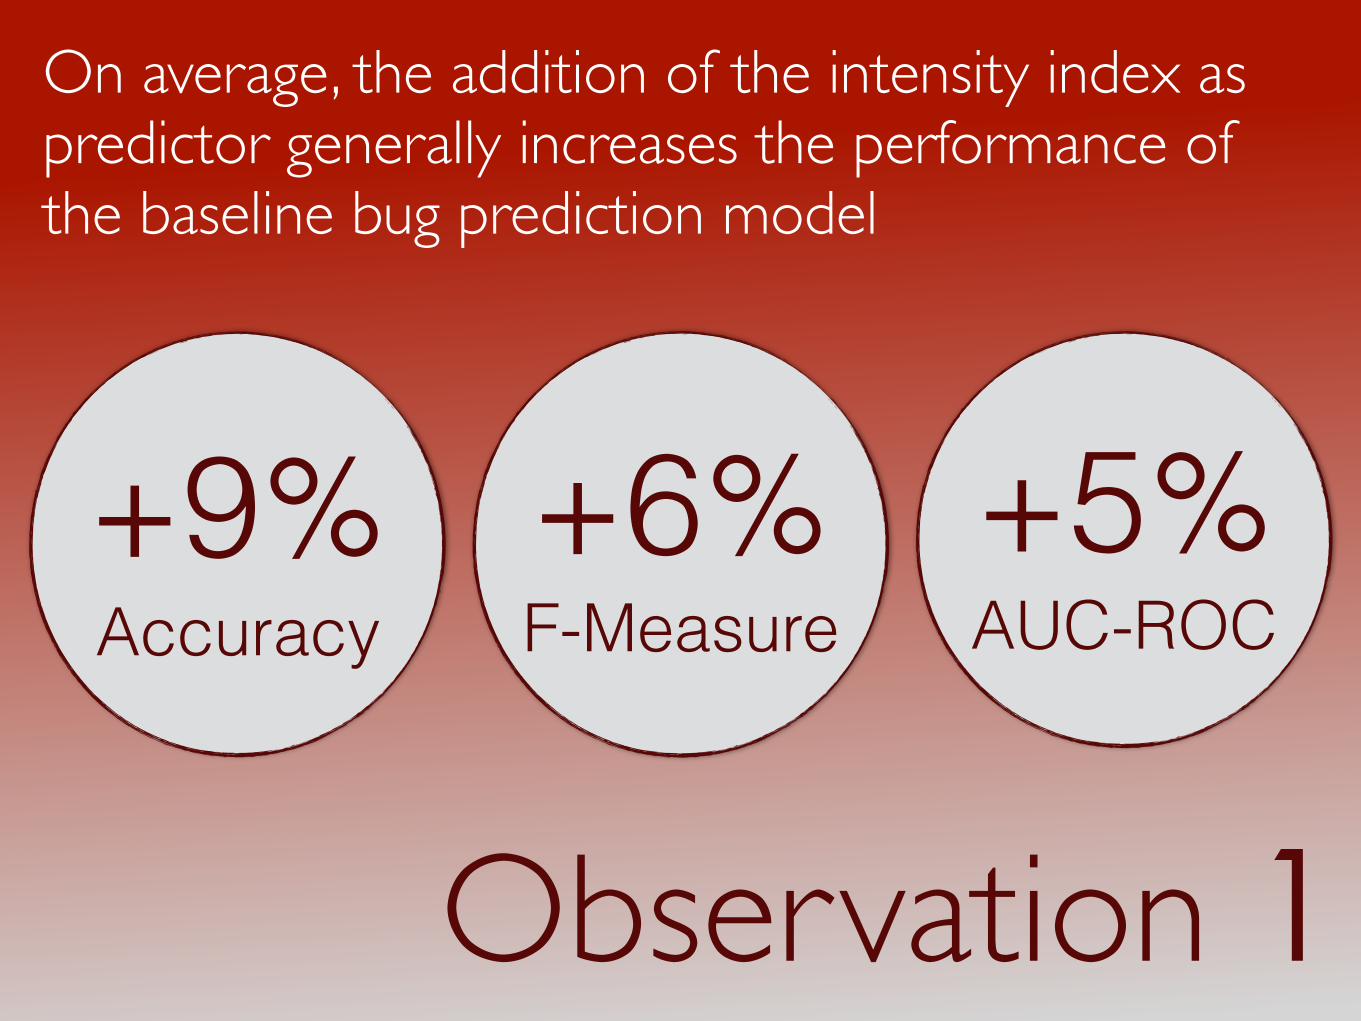
+5% AUC-ROC
+9% Accuracy
Observation 1
+6% F-Measure
On average, the addition of the intensity index as predictor generally increases the performance of the baseline bug prediction model
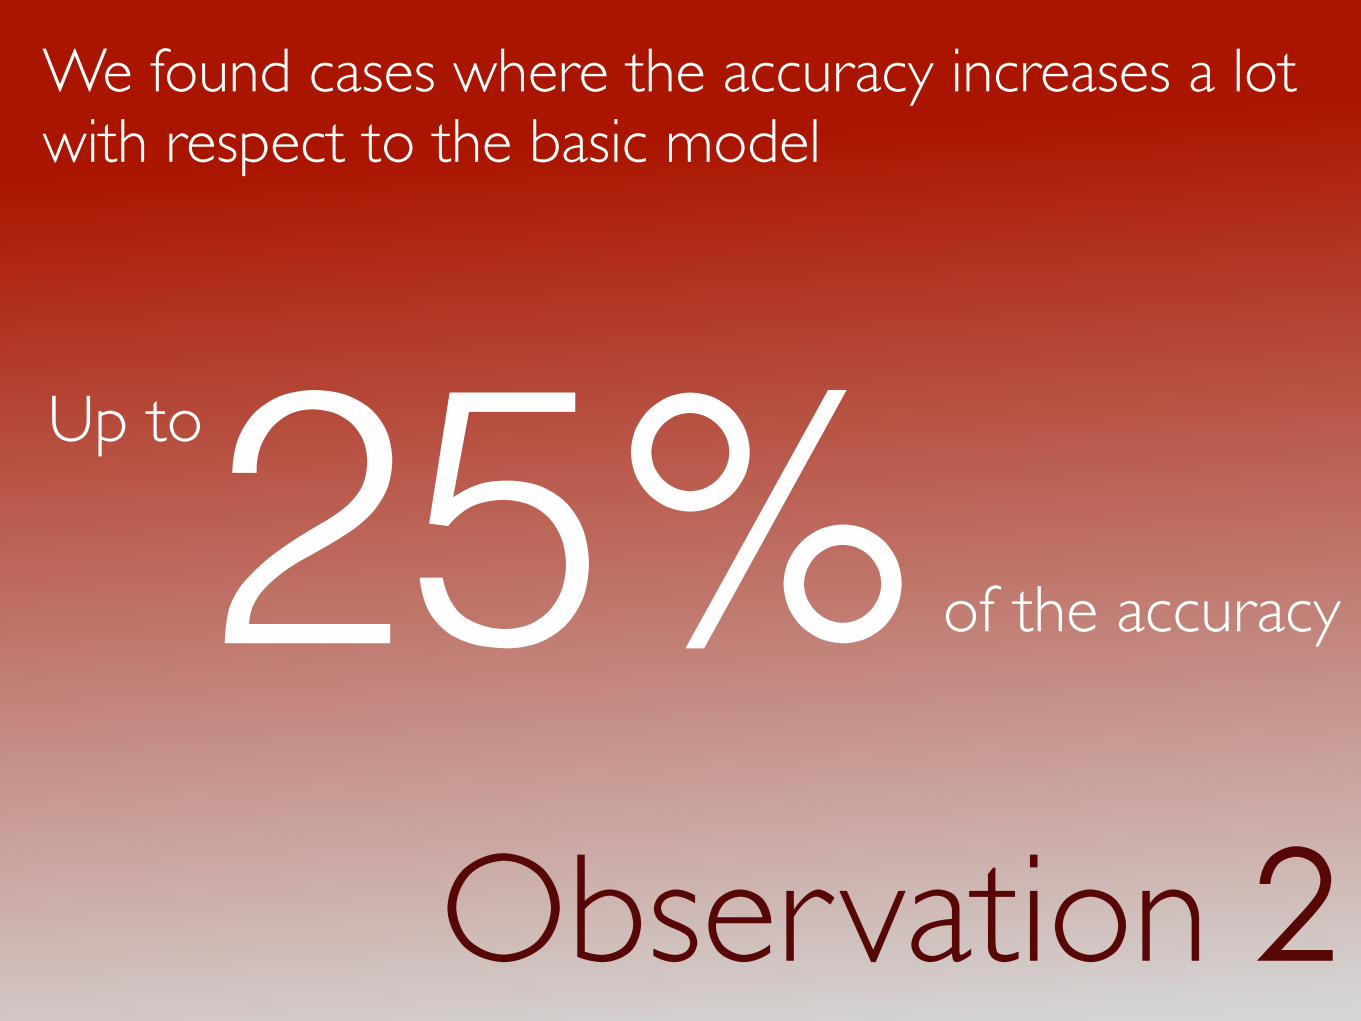
We found cases where the accuracy increases a lot with respect to the basic model
Observation 2
25%Up to
of the accuracy
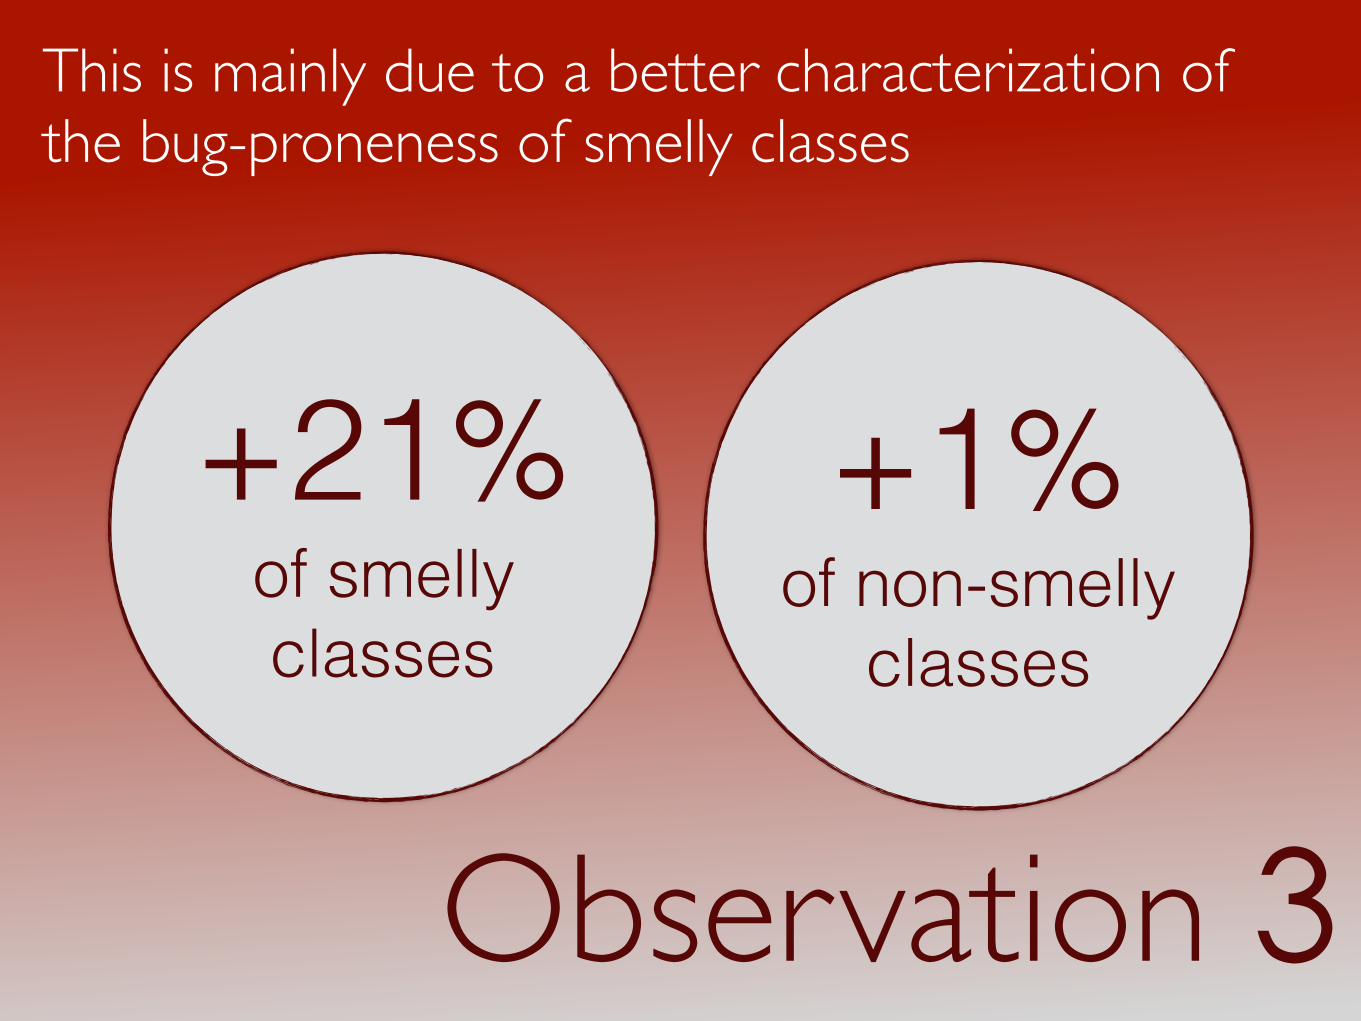
Observation 3
This is mainly due to a better characterization of the bug-proneness of smelly classes
+21% of smelly classes
+1% of non-smelly
classes

Observation 4
The CBO metric is the more relevant one, followed by the RFC and LCOM
V. Basili, L. Briand, W. melo“A Validation of Object-Oriented Design Metrics as Quality Indicators”TSE 1996
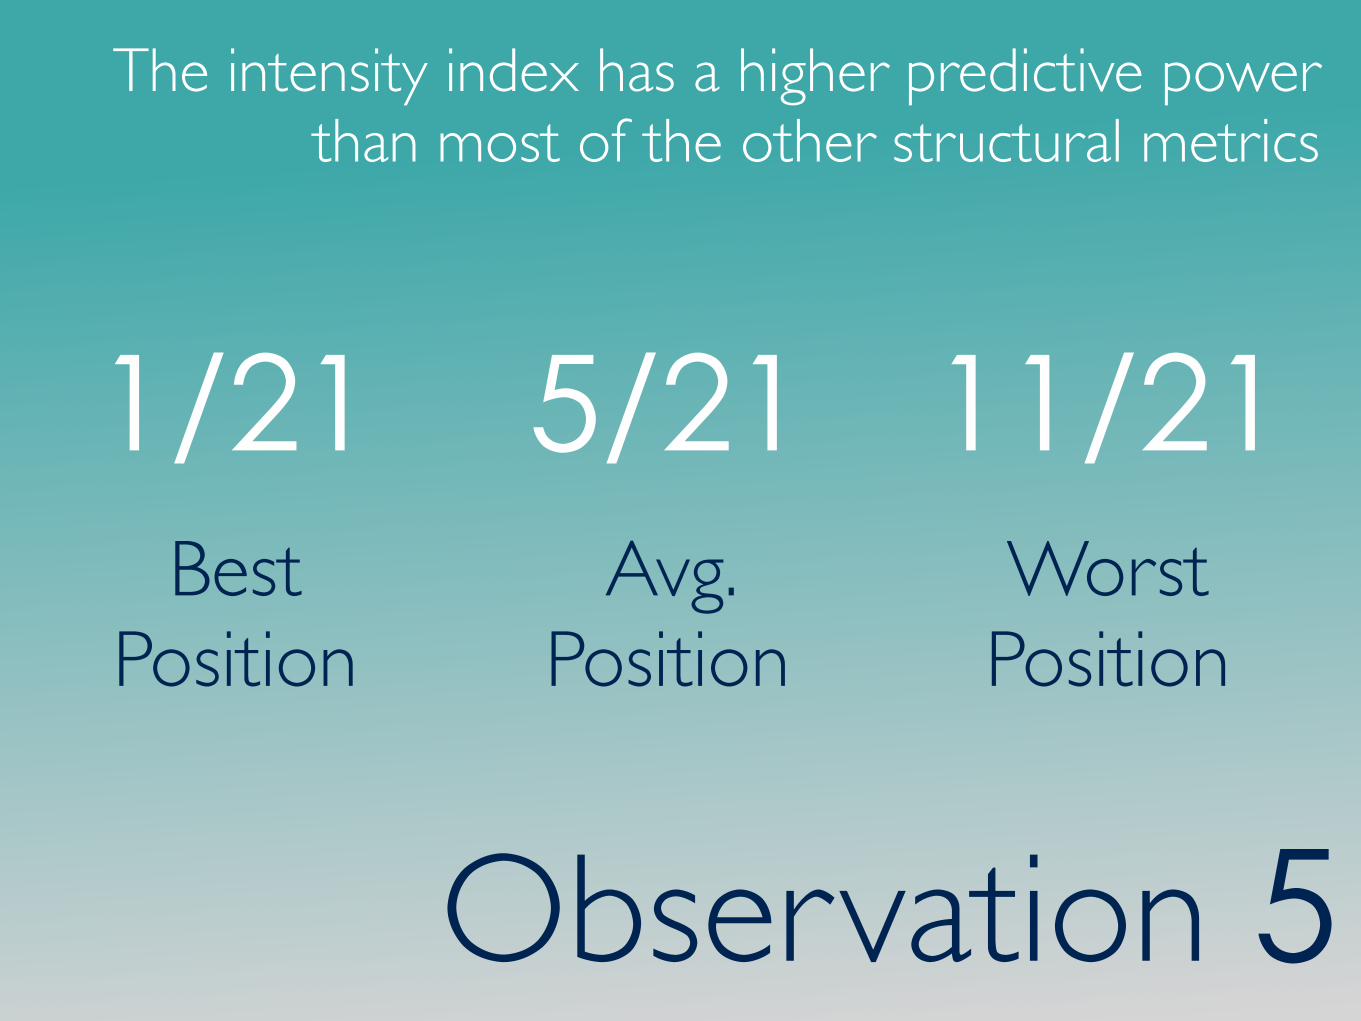
Observation 5
The intensity index has a higher predictive power than most of the other structural metrics
11/211/21 5/21Best
PositionAvg.
PositionWorst Position
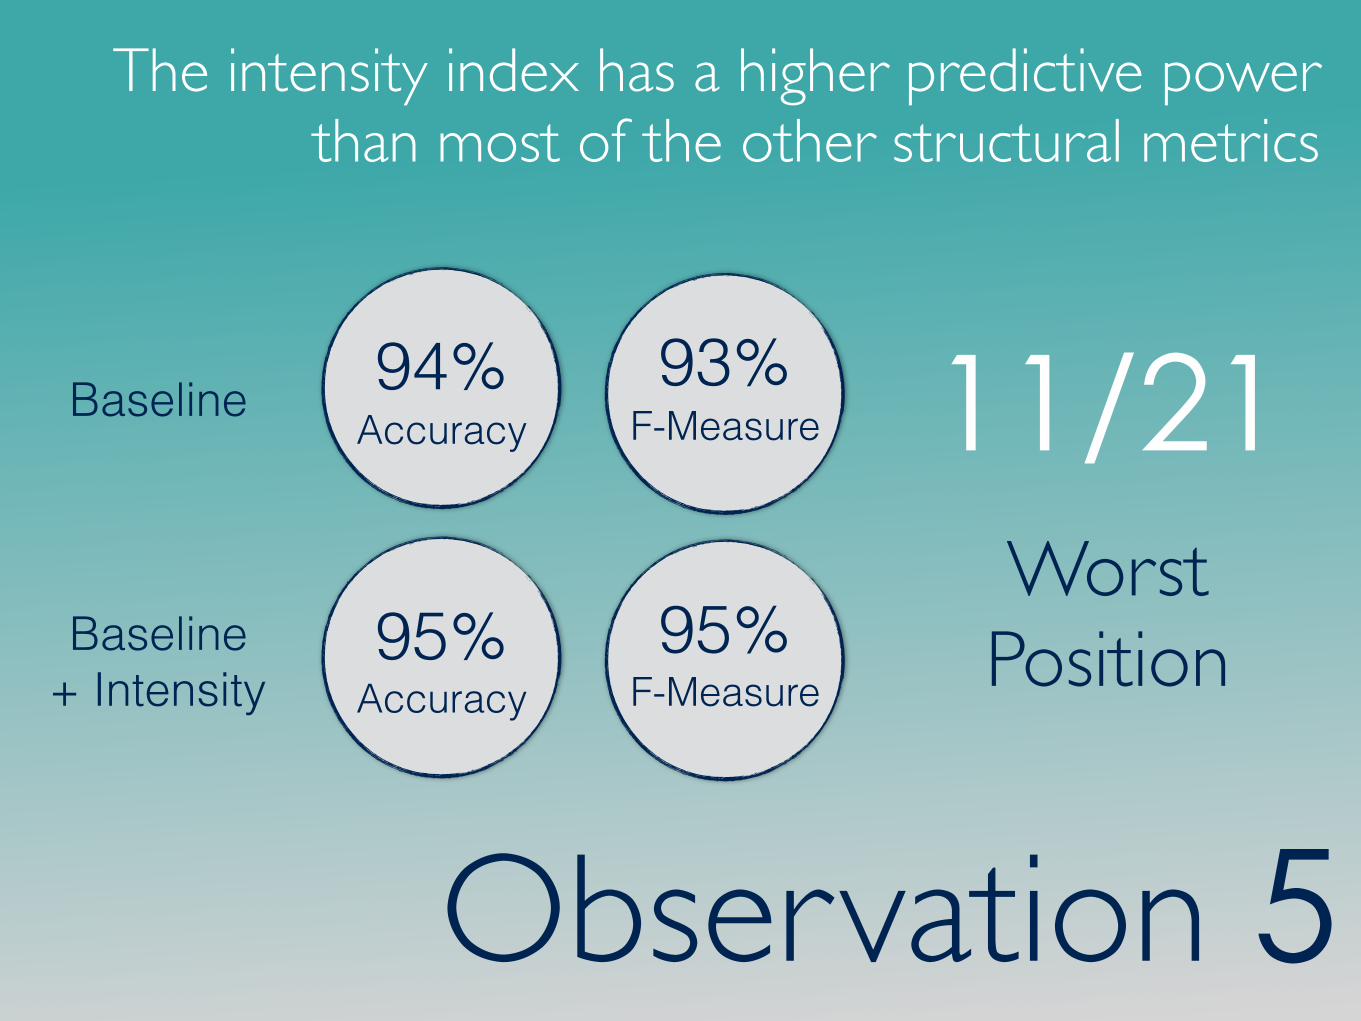
93% F-Measure
Observation 5
The intensity index has a higher predictive power than most of the other structural metrics
11/21Worst Position
94% AccuracyBaseline
Baseline + Intensity
95% F-Measure
95% Accuracy

Closing Remarks

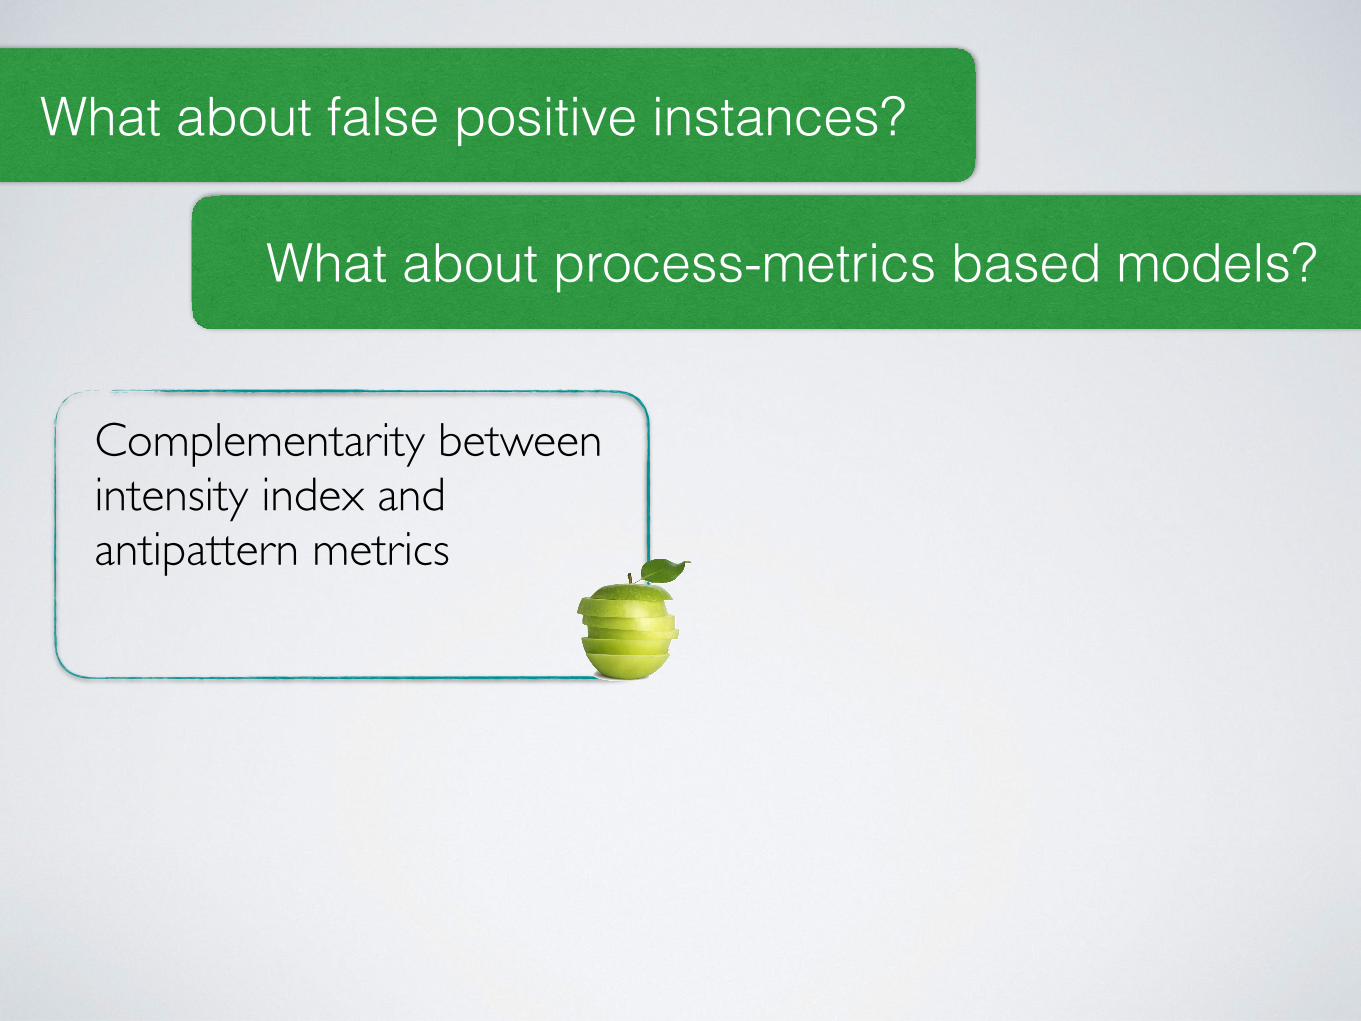
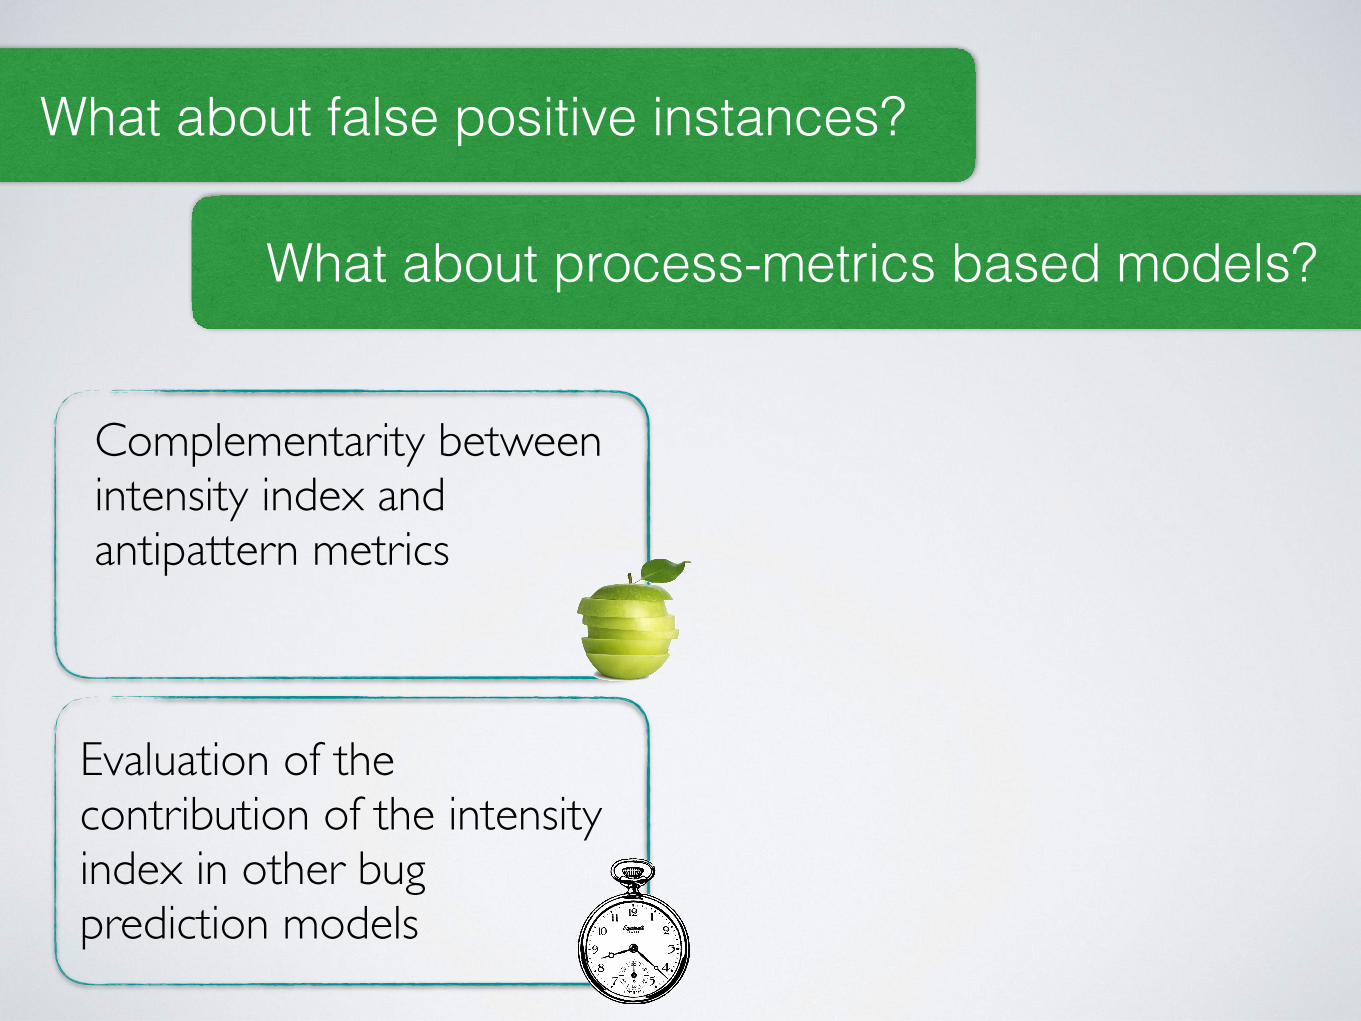
What about false positive instances?
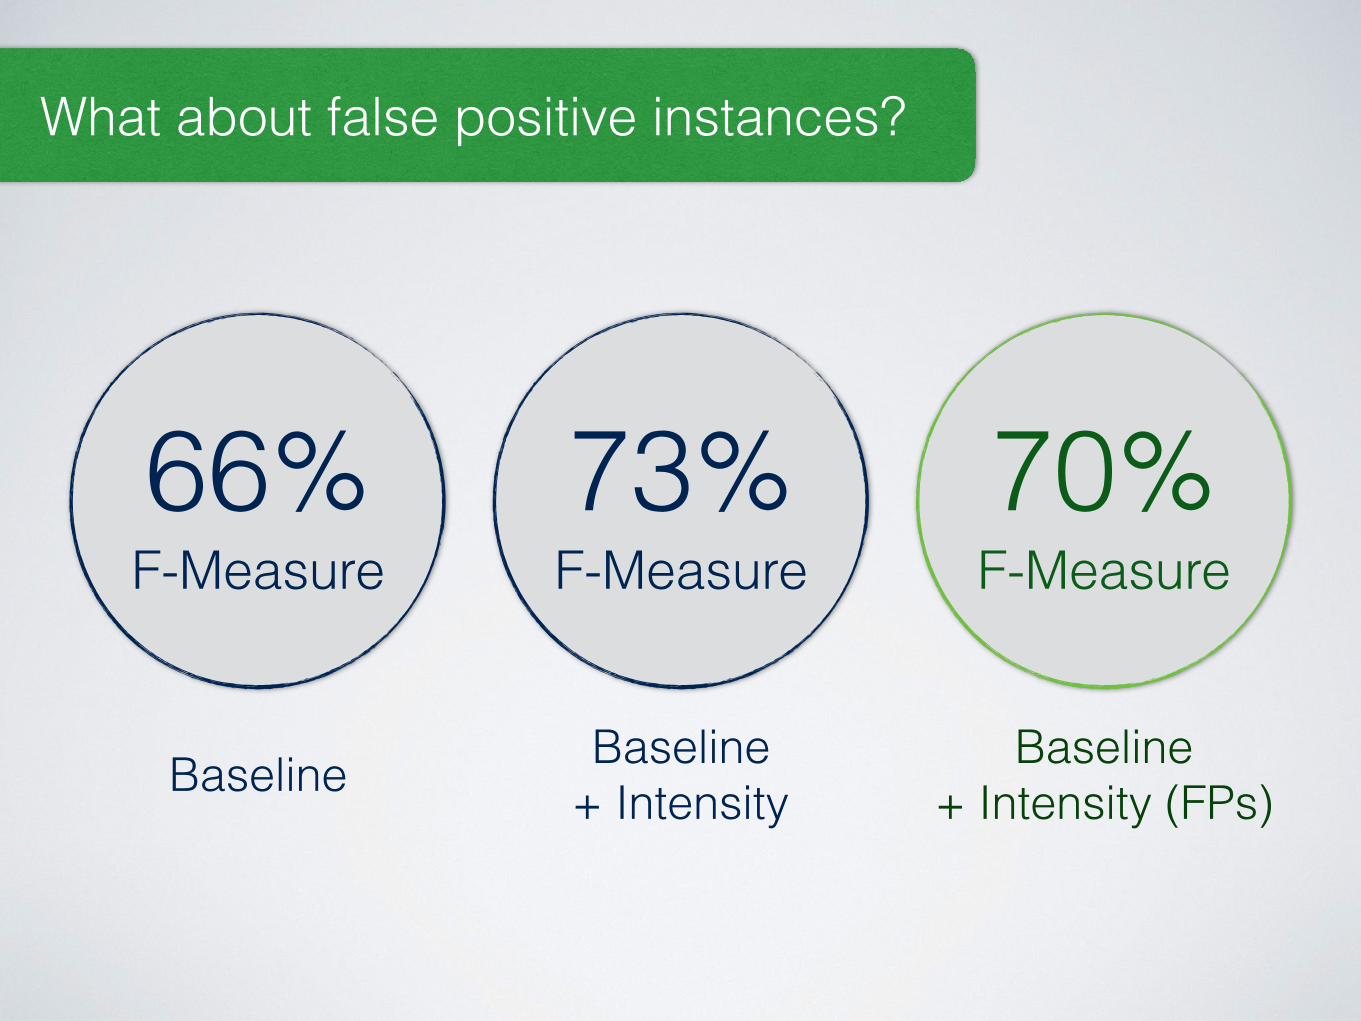
Baseline Baseline + Intensity
Baseline + Intensity (FPs)
70% F-Measure
66% F-Measure
73% F-Measure
What about false positive instances?
What about false positive instances?
What about process-metrics based models?
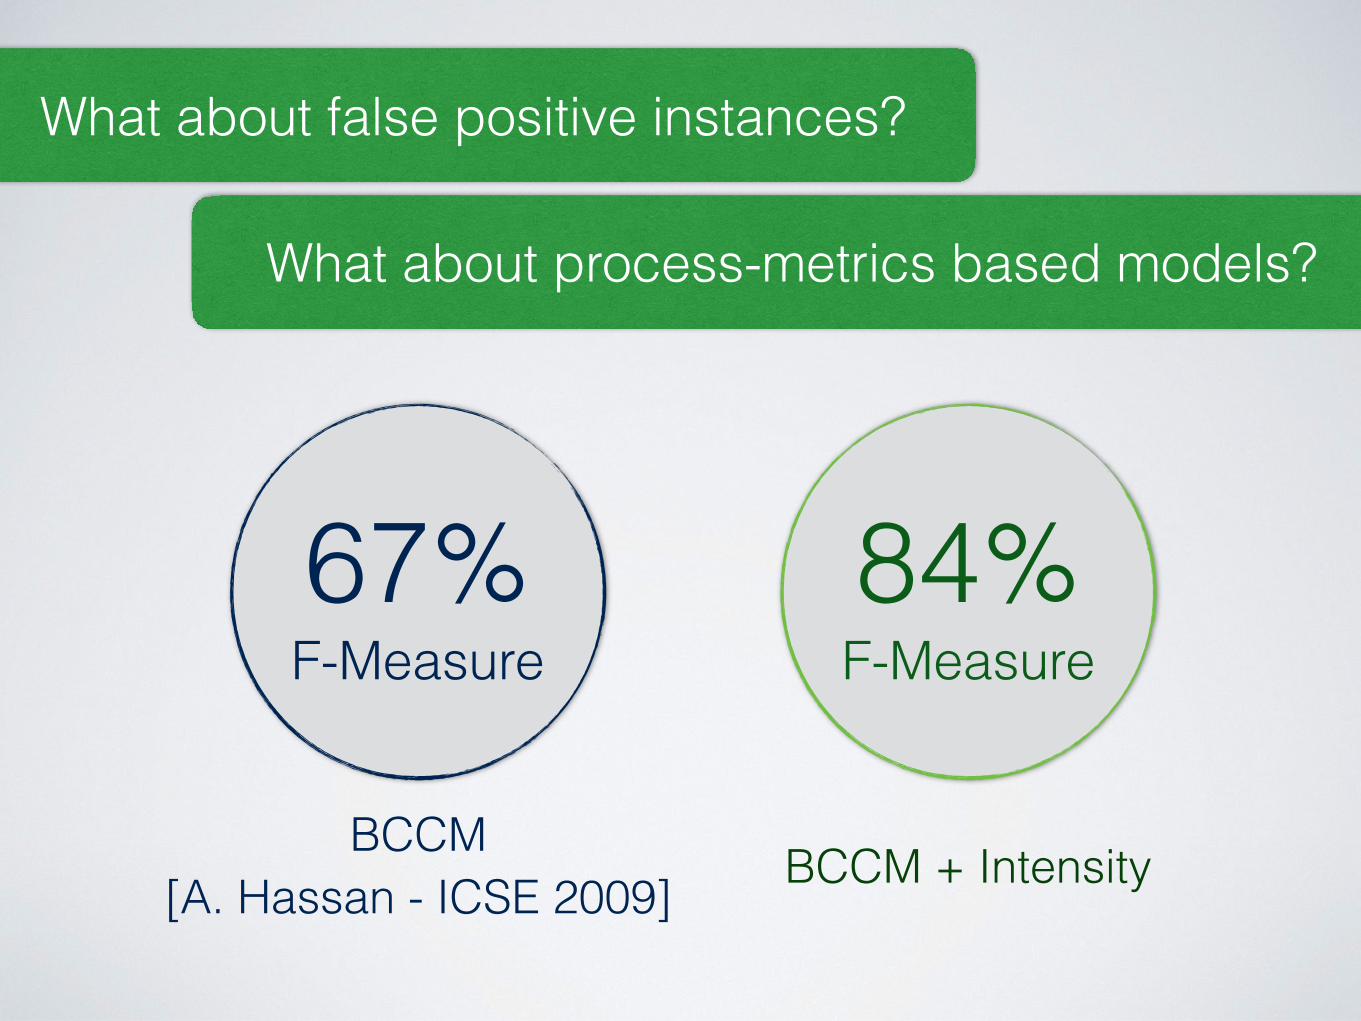
What about false positive instances?
What about process-metrics based models?
[A. Hassan - ICSE 2009] BCCM + Intensity
84% F-Measure
67% F-Measure
BCCM
What about false positive instances?
What about process-metrics based models?
Complementarity between intensity index and antipattern metrics
What about false positive instances?
What about process-metrics based models?
Complementarity between intensity index and antipattern metrics
Evaluation of the contribution of the intensity index in other bug prediction models
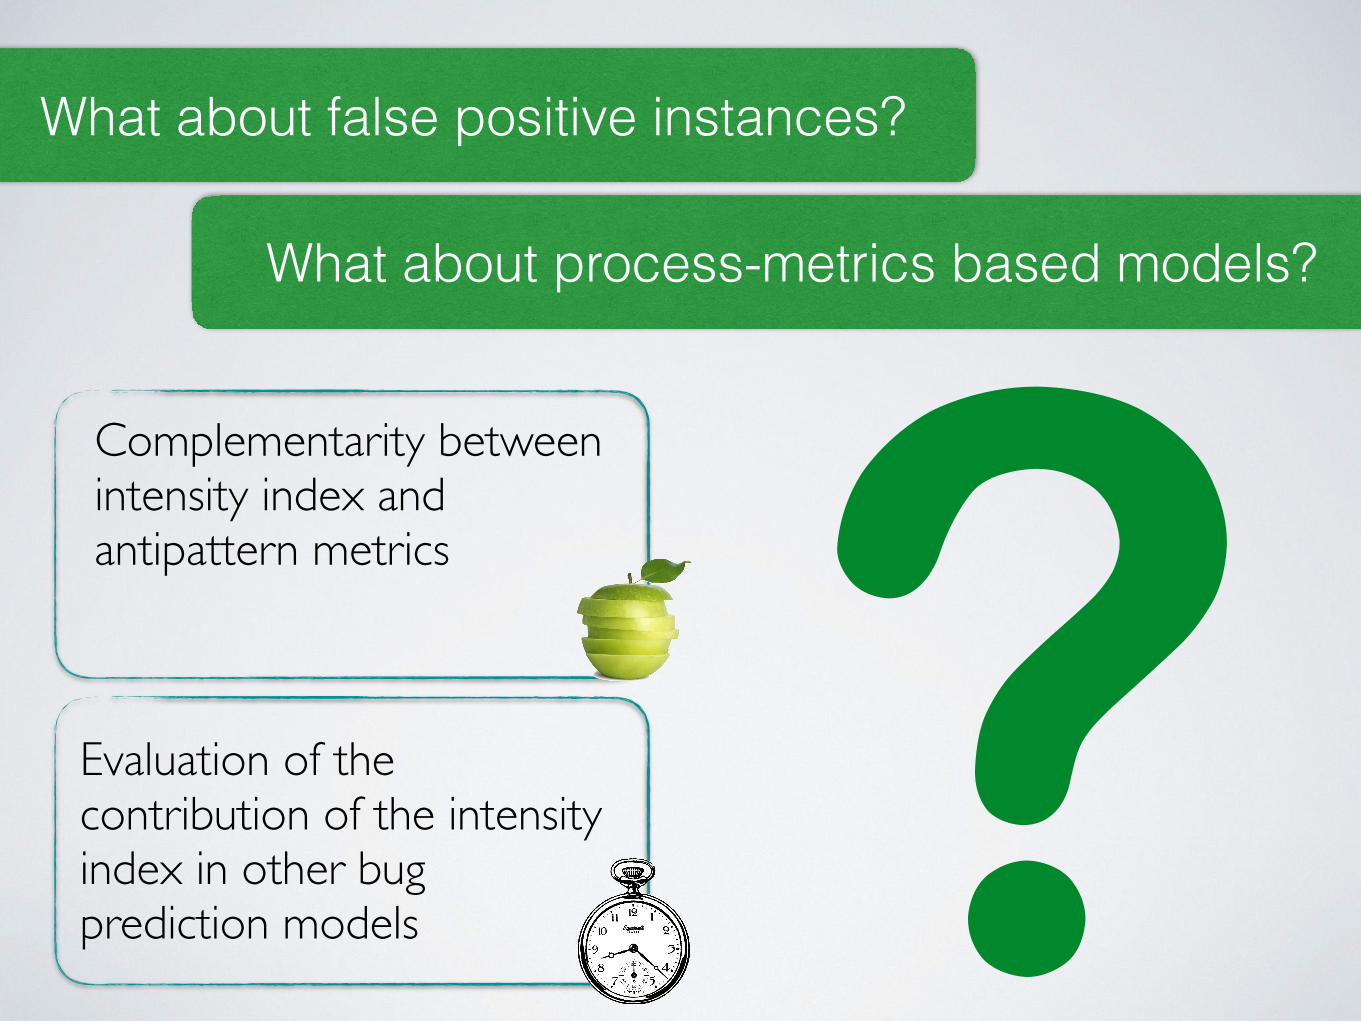
What about false positive instances?
What about process-metrics based models?
Complementarity between intensity index and antipattern metrics
Evaluation of the contribution of the intensity index in other bug prediction models ?

Smells Like Teen Spirit: Improving Bug Prediction Performance using the Intensity of Code Smells
Fabio Palomba*, Marco Zanoni+, Francesca Arcelli Fontana+, Andrea De Lucia*, Rocco Oliveto°*University of Salerno, +University of Milano-Bicocca, °University of Molise