sme internationalization and finance in asia€¦ · · 2015-07-16sme internationalization and...
TRANSCRIPT

SME Internationalization and Finance in AsiaAn Empirical Exploration
Ganeshan Wignaraja
Advisor
Asian Development Bank
Manila
16 July 20151

Introduction and Contents1.
2
• Motivation: Policy spotlight on the role of SMEs to promote jobs and inclusive growth in Asia
• Open question: how to encourage SME internationalization and financing in Asia?
• Contents:
1. SMEs in supply chain trade and characteristics of firms
2. SME finance and characteristics of bank borrowers
3. Policy Implications and conclusion
• Focus on Southeast Asia and PRC

SMEs Make up the Majority of Firms in Asia
3
62.258.5
48.0
89.7
56.5
0.0
10.0
20.0
30.0
40.0
50.0
60.0
70.0
80.0
90.0
100.0
Asia Europe and CentralAsia
Latin America and theCaribbean
Middle East and NorthAfrica
Sub-Saharan Africa
Distribution of Enterprise Sizes across Regions (%)
Small Medium Large
Note: SME are firms with less than 100 employees. Uses recent data from the World Enterprise Surveys.Asia refers to Afghanistan, Bangladesh, Bhutan, PRC, Indonesia, Kazakhstan, Kyrgyz Republic, the Lao PDR, Nepal, Pakistan, the Philippines, Sri Lanka, Tajikistan, Timor-Leste, Uzbekistan, and Viet Nam. Source: ADB–OECD Study on Enhancing Financial Accessibility for SMEs: Lessons from recent crises. Philippines: Asian Development Bank, 2013

SMEs Contribute Much to Economic Activity but Less to Trade in Asia
4
Note: SME definition varies by country.Use most recently available data* percent of the private nonfarm GDP in 2008** estimateSource: Various statistical agencies (ASEAN SME data, Business in Asia, DTI Philippines, PRC Ministry of Industry and Information Technology, European Commission fact sheet, Small Business and Entrepreneurship Council)
49.4
79
70
40
35
40
77.0
97.2
61.0
77.9
58.9
87.5
70.2
0 50 100
United…
Germany
Pakistan
Banglade…
Sri Lanka
India
Vietnam
Indonesia
Philippines
Thailand
Malaysia
Korea,…
Japan
SME share of total employment (%)
46
53.8
30
22.5
52
17
40.0
57.8
35.7
38.7
31.9
49.4
50.0
0 50 100
United States *
Germany
Pakistan
Bangladesh
Sri Lanka
India
Vietnam
Indonesia
Philippines
Thailand
Malaysia
Korea, Republic of
Japan
SME Contribution to GDP (%)
33.7
55.9
25
11.3
20
40
20.0
15.8
20.0
29.5
19
30.9
53.8
0 20 40 60
United States *
Germany
Pakistan
Bangladesh
Sri Lanka
India
Vietnam
Indonesia
Philippines
Thailand
Malaysia
Korea, Republic of
Japan
SMEs share of total exports (%)
**

SMEs in Supply Chain Trade2.
5

Rise of Factory Asia, but Concentrated in Some Asian Economies
Note: Supply chain trade is defined as trade in parts and components using the gross trade approach of Athukorala (2011) .
6
0.1
0.1
0.8
0.0
0.0
0.0
0.2
0.8
1.0
1.1
1.7
2.0
2.7
4.8
7.9
25.0
0.0 5.0 10.0 15.0 20.0 25.0 30.0
Sri Lanka
Pakistan
India
Brunei Darussalam
Lao People's Dem. Rep.
Myanmar
Cambodia
Indonesia
Philippines
Viet Nam
Singapore
Thailand
Malaysia
Rep. of Korea
Japan
China
Sou
th A
sia
ASE
AN
East
Asi
aShare of world supply chain exports,
2001-2013 (%)
2001-2004
2005-2008
2009-2013
ASEAN accounted for 9.3% of world supply chain trade over the period 2009-2013
Peoples Rep. of

7
SMEs and Large Firms in Supply Chain Trade in Southeast Asia*
• SME engagement varies by economy. Large firms dominate.
22.0
46.2
29.6
20.1
6.3
21.4
72.1
82.4
91.1
51.1 52
64.6
0
10
20
30
40
50
60
70
80
90
100
All Countries Malaysia Thailand Philippines Indonesia Viet Nam
%
Role of large firms and SMEs in supply chains
SMEs in supply chains as apercentage of all SMEs
Large firms in supply chains asa percentage of all large firms
Source: Wignaraja, G., (2015), “Factors Affecting Entry into Supply Chain Trade: An Analysis of Firms in Southeast Asia” Asia and the Pacific Policy Studies, March
Note: * Direct exporters and tier 1 suppliers only. Tier 2 suppliers excluded.

What Explains Entry into Supply Chain Trade in Southeast Asia?
8
• Various attempts to measure supply chain trade (e.g. trade in value added) but little on the characteristics of firms in supply chains in Asia
• Wignaraja (2015) examines 5,900 firms in 5 Southeast Asian economies (Malaysia, Thailand, Philippines, Indonesia and Vietnam). World Bank data collected by random sampling
• Main findings: Firm heterogeneity matters Higher SME engagement in some economies but large firms dominate Apart from firm size, technological capabilities, skills, access to credit
and foreign ownership affect whether firms join supply chains Tackling residual supply-side and policy constraints can further firms,
including SMEs, joining supply chains Caution about use of cluster policies and selective interventions to
promote SME engagement in supply chains
8

Factors Influencing Joining Supply Chain Trade in Southeast Asian Firms
VariableAll firms in Supply Chains SMEs in Supply Chains
Sign Significance Sign Significance
Firm Size + 1% + 1%
Firm Size squared - 1%
Firm Age - 10% - 10%
Firm ISO certified + 1% + 1%
Firm has Patents + 1% + 1%
GM has degree + 5% +
GM’s experience + +
Workers have HS education
+ 1% + 1%
Foreign Ownership + 1% + 1%
Access to Credit + 1% + 10%
Country Dummies -/+ 1-10% +/- 1-5%
*Dependent variable is binary: 1 if part of production network, 0 otherwise.9

10
Affordable and High Quality Support Systems Are Important
Source: Wignaraja (2013).

SMEs Face Many Barriers, Including Access to Finance
11Source: Wignaraja, G., (2015), “Factors Affecting Entry into Supply Chain Trade: An Analysis of Firms in Southeast Asia” Asia and the Pacific Policy Studies, March
SMEs Access to Finance3.
12

SME Credit Gap is Severe in Asia
13
Note: Credit gap” is the difference between formal credit provided to SMEs and total estimated potential need for formal credit based on McKinsey & Co. estimates. Uses the IFC Enterprise Finance Gap Database (2011)Source: From the IFC report “Closing the Credit Gap for Formal and Informal MSMEs” (2013)
In South and East Asia and the Pacific approximate 9 million of all formal SMEs do not have sufficient access to finance (IFC, 2013).

14
SME Credit Gap Varies Across Asia
Note: “Credit gap” is the difference between formal credit provided to SMEs and total estimated potential need for formal credit based on McKinsey & Co. estimates. Source; IFC Enterprise Finance Gap Database (2011).
Region CountryTotal Credit Gap (US $
Billions)
Average Credit value Gap per Enterprise
(US$)
ASE
AN
Singapore 7.1 856,000
Brunei Darussalam 7.2 736,000Malaysia 8 126,000
Thailand 11.8 126,000
Philippines 2 59,000
Cambodia 0.4 50,000
Vietnam 4.3 42,000
Indonesia 11.8 29,000Lao PDR 0.2 13,000
East
Asi
a Hong Kong 10.2 733,000Republic of Korea 28.5 503,000PRC 62.7 44,000
Sou
th A
sia
Sri Lanka 0.1 54,000India 3.4 54,000
Pakistan 2.9 51,000Bangladesh 1.8 17,000
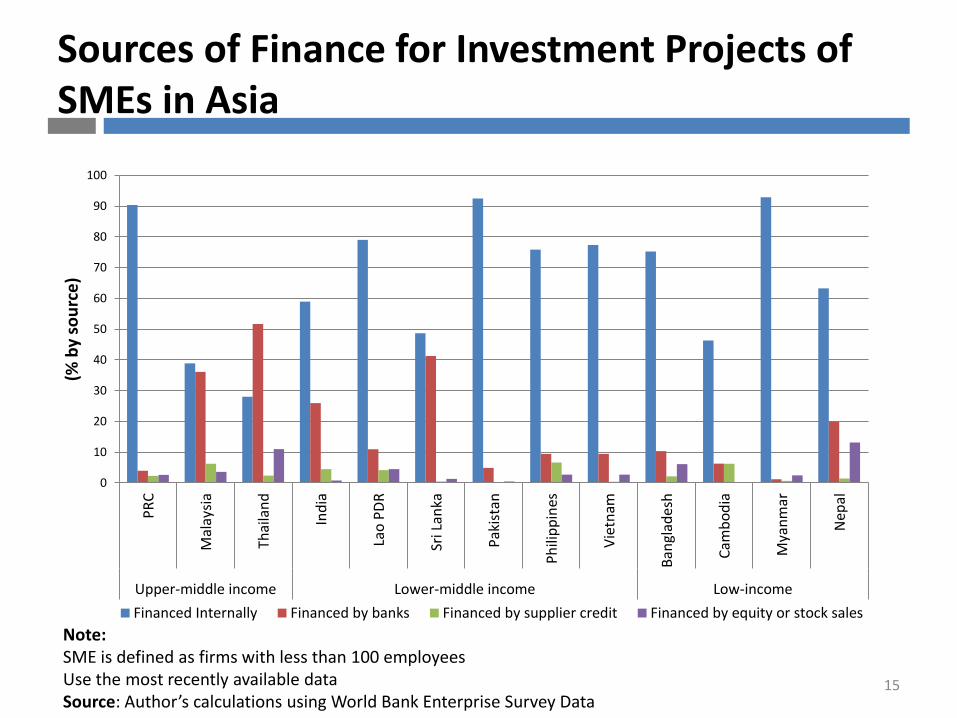
Sources of Finance for Investment Projects of SMEs in Asia
15
Note: SME is defined as firms with less than 100 employeesUse the most recently available dataSource: Author’s calculations using World Bank Enterprise Survey Data
0
10
20
30
40
50
60
70
80
90
100
PR
C
Mal
aysi
a
Thai
lan
d
Ind
ia
Lao
PD
R
Sri L
anka
Pak
ista
n
Ph
ilip
pin
es
Vie
tnam
Ban
glad
esh
Cam
bo
dia
Mya
nm
ar
Nep
al
Upper-middle income Lower-middle income Low-income
(% b
y so
urc
e)
Financed Internally Financed by banks Financed by supplier credit Financed by equity or stock sales
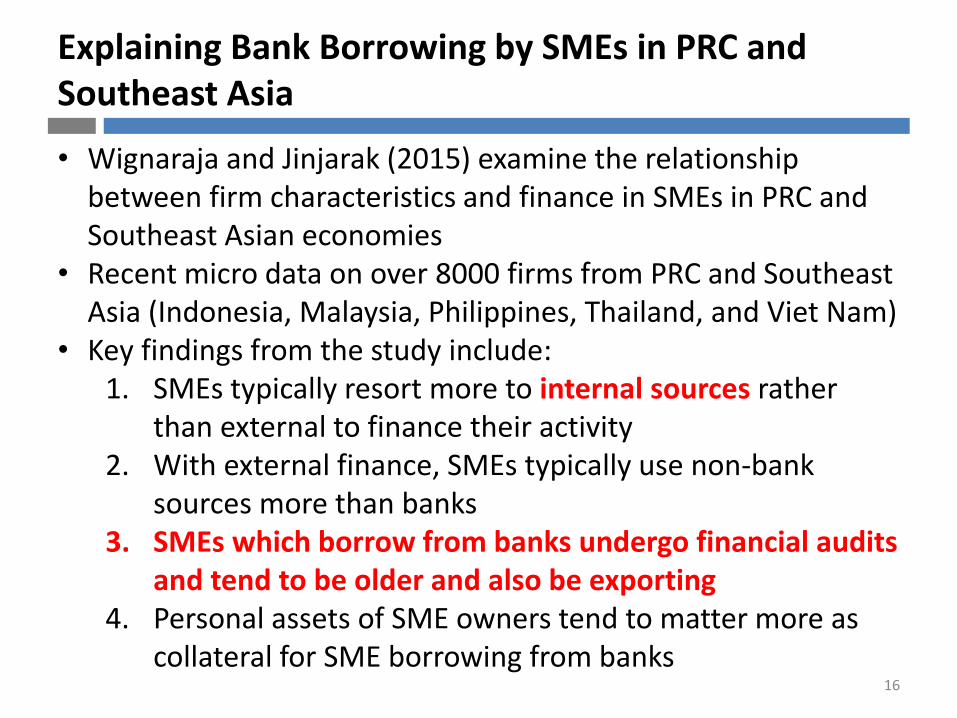
Explaining Bank Borrowing by SMEs in PRC and Southeast Asia
• Wignaraja and Jinjarak (2015) examine the relationship between firm characteristics and finance in SMEs in PRC and Southeast Asian economies
• Recent micro data on over 8000 firms from PRC and Southeast Asia (Indonesia, Malaysia, Philippines, Thailand, and Viet Nam)
• Key findings from the study include:1. SMEs typically resort more to internal sources rather
than external to finance their activity2. With external finance, SMEs typically use non-bank
sources more than banks3. SMEs which borrow from banks undergo financial audits
and tend to be older and also be exporting4. Personal assets of SME owners tend to matter more as
collateral for SME borrowing from banks16

17
Influence of Firm Characteristics on Bank Borrowing
Y = Bank
Borrowing (%
working capital)
Firm Size (number of employees)
≤ 25 > 25 & ≤ 100 > 100 & 250 ≤ > 250
Firm age .52 .37 .49 .30
(.21)** (.14)*** (.16)*** (.13)**
Export participation .30 .15 .12 .10
(.09)*** (.05)*** (.05)** (.05)**
Foreign ownership -21.77 -29.83 -15.42 -21.93
(8.51)** (4.23)*** (4.60)*** (3.94)***
Managerial experience -.52 -.45 .10 .28
(.22)** (.15)*** (.19) (.16)*
Financial audit 9.37 1.27 3.97 8.89
(4.30)** (3.16) (4.58) (4.46)**
ISO certification -18.23 -11.54 -6.88 -1.26
(6.60)*** (3.18)*** (3.99)* (4.03)
Labor Intensive 5.44 9.13 20.11 17.07
Industries (5.53) (4.67)* (6.76)*** (6.50)***
Capital Intensive 16.12 12.62 20.14 2.52
Industries (5.01)*** (4.13)*** (6.16)*** (6.05)
constant -73.61 -26.43 -38.62 -22.15
(6.26)*** (5.31)*** (8.00)*** (8.08)***
Pseudo R-sq. .01 .01 .01 .01
observations 2,859 2,729 1,336 1,156
Note: This table reports regression results of lender type (dummy dependent variable) on firm characteristics (control variables) for firms at different sizes. The estimation method is Probit. The analysis pools firm observations across PRC, Malaysia, Thailand, Indonesia, Philippines, and Viet Nam. Standard errors are in parentheses; *** (**, *) denotes statistical significance at 1 (5, 10) percent level.Source: Wignaraja and Jinjarak (2015).
18
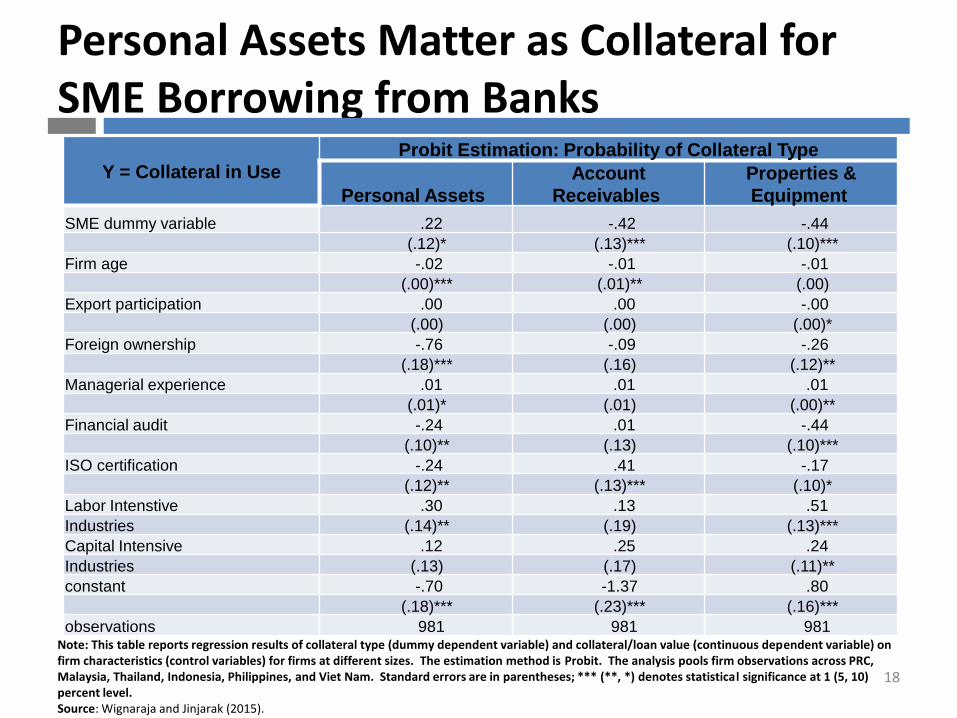
Personal Assets Matter as Collateral for SME Borrowing from Banks
Y = Collateral in Use
Probit Estimation: Probability of Collateral Type
Personal Assets
Account
Receivables
Properties &
Equipment
SME dummy variable .22 -.42 -.44
(.12)* (.13)*** (.10)***
Firm age -.02 -.01 -.01
(.00)*** (.01)** (.00)
Export participation .00 .00 -.00
(.00) (.00) (.00)*
Foreign ownership -.76 -.09 -.26
(.18)*** (.16) (.12)**
Managerial experience .01 .01 .01
(.01)* (.01) (.00)**
Financial audit -.24 .01 -.44
(.10)** (.13) (.10)***
ISO certification -.24 .41 -.17
(.12)** (.13)*** (.10)*
Labor Intenstive .30 .13 .51
Industries (.14)** (.19) (.13)***
Capital Intensive .12 .25 .24
Industries (.13) (.17) (.11)**
constant -.70 -1.37 .80
(.18)*** (.23)*** (.16)***
observations 981 981 981 Note: This table reports regression results of collateral type (dummy dependent variable) and collateral/loan value (continuous dependent variable) on firm characteristics (control variables) for firms at different sizes. The estimation method is Probit. The analysis pools firm observations across PRC, Malaysia, Thailand, Indonesia, Philippines, and Viet Nam. Standard errors are in parentheses; *** (**, *) denotes statistical significance at 1 (5, 10) percent level.Source: Wignaraja and Jinjarak (2015).
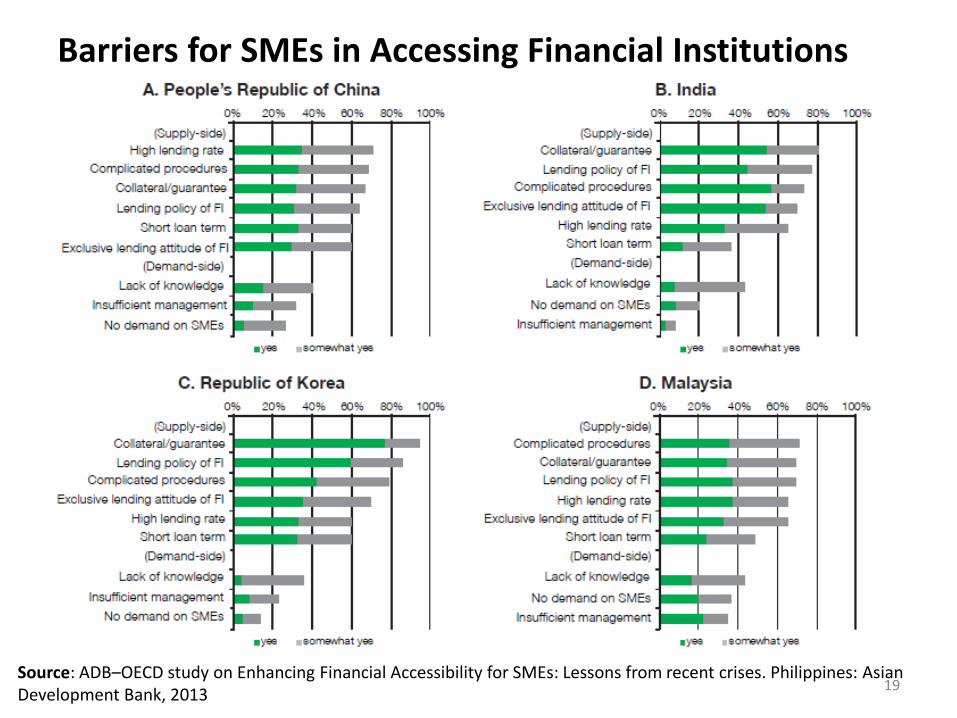
Barriers for SMEs in Accessing Financial Institutions
19Source: ADB–OECD study on Enhancing Financial Accessibility for SMEs: Lessons from recent crises. Philippines: Asian Development Bank, 2013

Policy Implications and Conclusion4.
20

Policy Implications
21
• No one size fits all solution to SME internationalization and finance in Asia
• Sustain open trade regimes, invest in traditional and ICT infrastructure, and streamline business regulations
• Affordable and high quality technical, marketing and other business support are useful to develop SMEs
• Develop a sound and effective financial system
Support bank privatization
Facilitate entry of reputable foreign financial firms
Foster stock and bond market development
Ensure adequate macroprudential regulation and capacity

Policy Implications
22
• Increase financial access for SMEs Introduce better credit rating and databases
Expand partial credit guarantees
Introduce innovative schemes to expand collateral
Scale up microfinance and link it to the financial system at large
Promote technology (e-finance) and alternative delivery (mobile banking)
Support private equity, venture capital and angel financing
Teach financial literacy from school onwards

Conclusion
23
• Firm-level analysis useful to explore links between trade, finance and SMEs
• SMEs important in Asia but are underrepresented in exports and supply chain trade SMEs that join supply chain trade are bigger, build technological capability
and skills, have greater access to credit and some foreign ownership
• The credit gap is severe - about 9 million Asian SMEs affected
• SMEs typically rely on internal or non-bank sources of finance for their activity
• SME characteristics influence bank borrowing Older, financially audited, exporting SMEs tend to borrow from banks Personal assets of SMEs matter as collateral
• No panacea for SME internationalization or financing

24
Selected References
• Wignaraja, G., (2015), “Factors Affecting Entry into Supply Chain Trade: An Analysis of Firms in Southeast Asia” Asia and the Pacific Policy Studies, March http://onlinelibrary.wiley.com/doi/10.1002/app5.78/full
• Wignaraja, G., and Jinjarak, Y., (2015). “Why SMEs Do Not Borrow from Banks? Evidence from People’s Republic of China and Southeast Asia”. ADBI Working Paper, No. 509. Tokyo: Asian Development Bank Institute. Available at: http://www.adbi.org/files/2015.01.09.wp509.why.do.sme.not.borrow.from.banks.pdf
• Jinjarak, Y., Mutuc, P.J., and Wignaraja, G. (2014), “Does Finance Really Matter for the Participation of SMEs in International Trade?” ADBI Working Paper, No. 470. Tokyo: Asian Development Bank Institute. Available at: http://www.adbi.org/files/2014.03.28.wp470.finance.matter.smes.trade.pdf
• Yoshino, N., Morgan, P. and Wignaraja, G. (2015), “Financial Education in Asia: Assessment and Recommendations”, Asian Development Bank Institute Working Papers No. 534, http://www.adb.org/sites/default/files/publication/161053/adbi-wp534.pdf