sme challenges 2015 | bdc · face challenges related to ... the main challenges for all firms are...
TRANSCRIPT
1
SME CHALLENGES
BDC VIEWPOINTS STUDY – SEPTEMBER 2015
Research and Market Intelligence at BDC
2
Executive summary
> The most challenging business functions for business leaders in Canada are sales and marketing, finance (treasury) and
human resources (HR).
Although sales and marketing is the most challenging business function overall, we found that finance (treasury) ties sales and
marketing as the most challenging for firms with revenues of $2 million or less and that human resources is the most challenging
for firms with revenues above $2 million.
> In most cases, the business leader is responsible for the business functions. Results are highest for general management,
as 84% of respondents said they are personally responsible for that function, and lowest for information technology, as
56% of respondents said they are personally responsible.
Not surprisingly, personal responsibility for the functions tends to be higher among smaller firms.
> The main sales and marketing challenges are increasing the number of customer prospects (58%), developing and
executing a sales and marketing plan (54%) and converting prospects into customers (52%). Respondents have a slight
preference for self-serve resources when it comes to learning about addressing marketing challenges and for hiring an
external expert to help resolve such issues.
> Obtaining additional financing (57%), managing cash flow (45%) and understanding the financing options available to their
company (42%) are the main finance-related challenges.
There are some gender differences regarding finance challenges, which are highlighted on page 12.
Self-serve is the preferred method for learning more about and solving finance-related challenges and issues. However, firms with
lower revenues have a slight preference for hiring an external expert to help them resolve financial challenges.
> Recruiting employees (51%), establishing the right compensation mix (40%) and improving employee engagement (38%) are
at the top of the list of HR challenges. To learn more about or to resolve HR issues, respondents slightly prefer using self-
serve resources to leveraging a peer group.
N.B. Throughout this report whenever you see this icon you can click on it to access relevant information pertaining to
the topic at hand.

3
Executive summary (cont’d)
> Respondents tend to be more comfortable with information technology (IT), operations and general management, but many
face challenges related to these business functions.
− In terms of IT, the main challenges are improving or developing a website and online presence (52%) and integrating or improving
the use of social media and other digital channels (48%). Hiring external help is the preferred method for addressing IT-related
issues.
− Operations challenges tend to be more common in product-oriented firms. The main challenges for all firms are managing costs
(45%), improving employee productivity and skills (40%) and obtaining additional financing (39%).
> To keep abreast of issues and for training purposes, respondents use a range of content formats. The most widely used
formats are document templates; internal training; infographics, short texts and articles; networking events and peer learning;
and white papers, reports and eBooks.
We found that service-oriented firms are slightly more inclined to use these formats more regularly.
> In-house training for employees by employees is the most common training format. It is followed by webinars, online training
and e-learning courses, and peer networks.
− The use of in-house training is significantly higher in companies with more employees.
− Webinars, online training and e-learning resonate with a greater percentage of women and service-oriented firms.
− Peer networks are appealing to both low- and high-revenue firms and to service-oriented organizations.
> Respondents used industry or business associations and private companies more extensively than any other type of
training supplier.
> To get a sense of what type of training would be most beneficial to their organization, we asked respondents to identify the
business function, the format and the supplier. We found that sales and marketing (44%) is the business function most would
focus on. Respondents are most likely to prefer webinars, online training or e-learning courses (28%) and external trainers or
consultants (25%). Furthermore, industry or business associations (41%) or private companies (27%) are the preferred
providers.
> The majority of business leaders consider continuous improvement to be important.
Business leaders in service-oriented firms are more inclined to participate in training activities and to extend that opportunity to
employees.

4
HIGH-LEVEL RESULTS

5
Functions common to all businesses
Sales and marketing
Finance (treasury) Operations
Human resources Information technology
Management and
leadership
CLIENTS
Core functions
Support functions
N.B. Throughout this report whenever you see this icon you can click on it to access relevant information pertaining to the topic at hand.

6
Most challenging business functions
How would you describe your company’s comfort level with each of the
six main functions of the business? Please use a scale of 0 to 10,
where 0 means “It’s a challenge” and 10 means “We excel at it.”
Base: All respondents. Those who preferred not to answer were
excluded from the calculation base. Totals may not equal 100% due to
rounding.
27%
25%
22%
26%
27%
31%
34%
32%
37%
13%
16%
11%
Sales and marketing(n=758)
Finance (treasury)(n=759)
Human resources(n=744)
Challenge (0-4) Neutral (5-6) Good (7-8) Excellent (9-10)
Average score
out of 10
6.1
> Overall, business leaders struggle the most with sales
and marketing, finance (treasury) and human resources
(HR).
These three functions tend to be a greater challenge for
businesses in accommodation and food services, those in
professional, scientific and technical services, and those
with yearly revenues of less than $500,000.
> Sales and marketing is the most challenging function,
with the lowest average score of the six functions
respondents were asked to evaluate, particularly among
the following:
Firms with revenues lower than $500,000 (5.4), compared to
those with revenues from $1 million to $2 million (6.5) or from $2
million to $5 million (6.4).
Firms that are strictly B2B (5.6), compared to those that operate in
both the B2B and B2C realms (6.1).
> Finance (treasury) is an important challenge for many
Canadian businesses (6.0), especially the following:
Companies with fewer than five employees (5.7) or between five
and 19 employees (6.1), compared to those with 20 to 49
employees (7.0) or 50 employees or more (7.3).
Those with revenues of less than $500,000 (5.4).
> Nearly half of respondents (score of 7 or more: 48%) said
their company is quite comfortable with the HR function.
It is a greater challenge for the following:
6.0
5.9

7
Least challenging business functions
How would you describe your company’s comfort level with each of the
six main functions of the business? Please use a scale of 0 to 10,
where 0 means “It’s a challenge” and 10 means “We excel at it.”
Base: All respondents. Those who preferred not to answer were
excluded from the calculation base. Totals may not equal 100% due to
rounding.
6%
9%
16%
21%
19%
25%
51%
52%
39%
22%
20%
21%
General management(n=756)
Operations (n=757)
Information technology(n=758)
Challenge (0-4) Neutral (5-6) Good (7-8) Excellent (9-10)
Average score
out of 10
7.2
6.7
7.1
> Out of the six functions, respondents indicated that their
company is most comfortable with general
management, operations and information technology.
> The general management function obtained the highest
average score at 7.2 out of 10.
There are no significant differences between sub-groups
for this function.
> The operations function obtained an average score of
7.1 out of 10.
It represents a greater challenge for companies with more
than 50 employees (6.9).
> Information technology, a critical support function,
obtained a respectable score of 6.7 out of 10. However,
the following differences among sub-groups are worth
mentioning:
Businesses offering professional, scientific and technical
services (7.3) are much more at ease with the IT function than
manufacturers (6.1).
This is also the case for businesses that have an active advisory
board (7.5), compared to those that do not have an advisory
board or board of directors (6.6).
Finally, companies that offer a mix of products and services
(7.0) are much more comfortable with the IT function than
product-oriented firms are (6.4).

8
Responsibility for business functions
General
management
Finance
(treasury)
Sales and
marketing Operations
Human
resources
Information
technology
The business leader 84% 70% 69% 66% 66% 56%
A partner or co-owner 20% 18% 22% 27% 24% 17%
An employee assigned to this
function 7% 13% 15% 15% 11% 13%
An assigned employee who is also
responsible for other functions 4% 5% 7% 9% 9% 11%
Someone outside the company 0% 8% 6% 1% 3% 16%
Don’t know/refused to answer 0% 1% 1% 1% 2% 1%
(n=760) Multiple answers allowed
> We asked respondents to indicate who in their company is responsible for the various business functions. We found that the
owner, entrepreneur or main business leader is often responsible for many of the functions. This confirms our perception
that many Canadian entrepreneurs wear multiple hats within the company.
It is, therefore, not surprising to see that respondents (business leaders) tend to be personally responsible for multiple functions in
companies with fewer employees, lower revenues and a single owner. As the business expands, these responsibilities tend to
shift to partners or key employees. For this reason, in many cases—especially among smaller firms—training and support should be
geared toward business leaders.
Furthermore, we found that women in our survey were much more likely than men to be responsible for their company’s finances
(82% vs. 67%) and human resources (77% vs. 62%).
> Helping Canadian entrepreneurs delegate functions to key people in order to focus on more strategic aspects of the
business would also help them transition from “being the company” to “running the company.”
9
Main sales and marketing challenges
Main sales and marketing challenges
(n=318) Multiple answers allowed
58%
54%
52%
46%
42%
37%
34%
Increasing the number ofcustomer prospects
Developing and executing a salesand marketing plan
Converting prospects intocustomers
Identifying growth opportunities(e.g., new clients, markets,
products, services)
Differentiating our products andservices from those of competitors
Understanding the effectiveness ofour marketing and sales activities
Obtaining additional financing forsales and marketing activities
Base: Respondents who allocated a score of 0 to 6 to sales and
marketing functions. Respondents were limited to answering challenge-
related questions for up to three business functions.
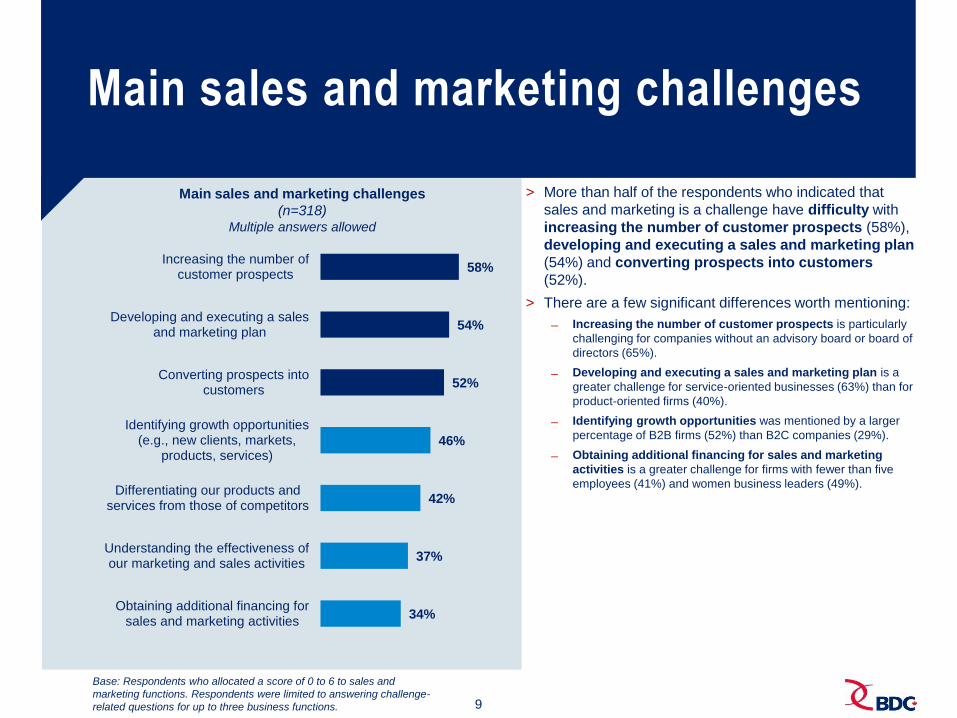
> More than half of the respondents who indicated that
sales and marketing is a challenge have difficulty with
increasing the number of customer prospects (58%),
developing and executing a sales and marketing plan
(54%) and converting prospects into customers
(52%).
> There are a few significant differences worth mentioning:
Increasing the number of customer prospects is particularly
challenging for companies without an advisory board or board of
directors (65%).
Developing and executing a sales and marketing plan is a
greater challenge for service-oriented businesses (63%) than for
product-oriented firms (40%).
Identifying growth opportunities was mentioned by a larger
percentage of B2B firms (52%) than B2C companies (29%).
Obtaining additional financing for sales and marketing
activities is a greater challenge for firms with fewer than five
employees (41%) and women business leaders (49%).

10
Other sales and marketing challenges
Other sales and marketing challenges
(n=318) Multiple answers allowed
33%
33%
31%
29%
27%
26%
24%
22%
20%
18%
2%
Conducting market research
Integrating or improving the use ofsocial media and other digital channels
Understanding the market andcompetitive landscape
Improving or developing a website andonline presence
Determining the right pricing for ourproducts and services
Finding the right distribution channelsfor our products and services
Finding, recruiting, and retainingskilled sales and marketing employees
Determining the right product andservice mix
Integrating or improving marketingautomation
Leveraging analytics
Other
> Additional sales and marketing challenges were
mentioned by one-third or fewer of the respondents who
reported the sales and marketing function as challenging.
> There are a few significant differences worth mentioning:
Finding the right distribution channels for our products and
services is more challenging for women (38% vs. 23% for men).
Finding, recruiting and retaining skilled sales and marketing
employees is particularly challenging for companies with five to
19 employees (34%) and for those with 20 to 49 employees
(40%), compared to those with fewer than five employees
(14%). In fact, results seem to indicate that finding, recruiting,
and retaining skilled sales and marketing employees is
increasingly challenging as a company gains more employees.
Base: Respondents who allocated a score of 0 to 6 to sales and
marketing functions. Respondents were limited to answering challenge-
related questions for up to three business functions.

11
Learning and problem-solving (sales and marketing challenges)
Preference for learning more about addressing these
challenges
(n=305)
26%
23%
23%
19%
8%
Use self-serve resources
Leverage a peer group
Hire an external expert
Take a group training courseoffered by an external expert
Leverage internal companyresources
Preference for resolving an important issue related to these
challenges
(n=308)
29%
23%
22%
17%
9%
Hire an external expert
Use self-serve resources
Leverage a peer group
Take a group training courseoffered by an external expert
Leverage internal companyresources
Base: Respondents who allocated a score of 0 to 6 to sales and
marketing functions. Those who preferred not to answer were excluded
from the calculation base. Totals may not equal 100% due to rounding.
> When it comes to learning more about addressing
sales and marketing challenges, respondents have a
slight preference for using self-serve resources
(26%) followed by leveraging a peer group (23%) and
hiring an external expert (23%).
> As for business leaders’ preference for resolving an
important issue related to sales and marketing, they
prefer the same three methods but in a different order:
hire an external expert (29%), use self-serve resources
(23%) and leverage a peer group (22%).
> There are a few significant differences worth mentioning:
Some respondents identified a preference for hiring an
external expert to resolve important issues with their sales
and marketing challenges. Although the differences are not
statistically significant due to the sample size, many
respondents (65%) between the ages of 25 and 34 would prefer
to hire an external expert. That is also the case among
respondents from the Atlantic provinces (49%), and respondents
in information and cultural industries (44%), transportation and
warehousing (44%) and the construction industry (42%). There
is also a greater preference for going that route among women
(38%) than among men (26%).
Product-oriented firms (35%) have a stronger preference for
self-serve resources than do service-oriented companies
(16%) for resolving important issues in sales and marketing.
Conversely, service-oriented firms (23%) have a significantly
stronger preference for taking a group course than product-
oriented companies do (7%).

12
Finance (treasury) challenges
Finance (treasury) challenges
(n=289) Multiple answers allowed
Base: Respondents who allocated a score of 0 to 6 to the finance
function. Respondents were limited to answering challenge-related
questions for up to three business functions.
> The main challenges identified by respondents who face
finance-related challenges are obtaining additional
financing (57%), managing cash flow (45%), and
understanding the financing options available to
them (42%).
> An important proportion of business leaders who face
finance-related challenges struggle with developing
forecasts and budgets (39%) and establishing and
tracking key performance indicators (37%).
> There are a few significant differences worth mentioning:
− Obtaining additional financing was identified as a challenge
by a significantly greater percentage of men (64% vs. 42% of
women).
− Developing forecasts and budgets is a greater challenge for
women than for men (52% vs. 35%). So, too, is establishing and
tracking performance indicators (49% vs. 34%).
− The more service-oriented a company is, the more likely it was
to identify establishing and tracking key performance
indicators as a challenge (product-oriented 16%; mix of product
and service orientation 36%; and service-oriented 50%).
− Gender differences also exist in terms of collecting accounts
receivable (men 25% vs. women 9%) and meeting legal and
government requirements (men 26% vs. women 8%).
− Although the differences are not statistically significant due to
the sample size, managing cash flow is a greater challenge for
more than seven out of 10 respondents in the arts,
entertainment and recreation (81%), construction (77%) and
accommodation and food services (73%) industries.
57%
45%
42%
39%
37%
27%
23%
22%
15%
13%
11%
3%
Obtaining additional financing
Managing cash inflows and outflows
Understanding the financing optionsavailable to my company
Developing forecasts and budgets
Establishing and tracking keyperformance indicators
Managing expenses
Collecting accounts receivable
Meeting legal and governmentrequirements
Understanding financial reports
Understanding how my businessmakes a profit
Finding, recruiting and retainingskilled finance employees
Other

13
Learning and problem-solving (finance challenges)
Preference for learning more about addressing these
challenges
(n=271)
34%
21%
20%
18%
7%
Use self-serve resources
Leverage a peer group
Hire an external expert
Take a group training courseoffered by an external expert
Leverage internal companyresources
Preference for resolving an important issue related to these
challenges
(n=276)
30%
29%
20%
13%
7%
Use self-serve resources
Hire an external expert
Leverage a peer group
Take a group training courseoffered by an external expert
Leverage internal companyresources
> One-third of business leaders facing finance-related
challenges (34%) prefer using self-serve resources to
learn more about addressing finance-related issues,
while one in five are more inclined to leverage a peer
group (21%) or hire an external expert (20%).
> There is a significant difference worth mentioning:
− Compared to women (10%), men (24%) are significantly more
likely to prefer leveraging a peer group to learn more about
addressing finance-related challenges.
> In terms of resolving an important issue in finance,
respondents either prefer using self-serve resources
(30%) or hiring an external expert (29%).
> There is a significant difference worth mentioning:
− Once again, men (24%) are significantly more likely than
women (10%) to prefer leveraging a peer group.
Base: Respondents who allocated a score of 0 to 6 to the finance
function. Those who preferred not to answer were excluded from the
calculation base. Totals may not equal 100% due to rounding.

14
Main human resources challenges
Main human resources challenges
(n=327) Multiple answers allowed
51%
40%
38%
33%
33%
28%
28%
Recruiting employees
Establishing the right compensationmix
Improving employee engagement
Improving the hiring process
Evaluating employee performance
Improving the skillsets of theworkforce
Creating growth opportunities forkey employees
> The main issues reported by those facing human
resources challenges are recruiting employees (51%),
establishing the right compensation mix (40%) and
improving employee engagement (38%).
> More than one-quarter of respondents with HR
challenges expressed a certain level of difficulty in
improving their hiring process (33%), evaluating
employee performance (33%), improving the skillsets
of their workforce (28%) and creating growth
opportunities for key employees (28%).
> There are a few significant differences worth mentioning:
− Recruiting employees is a greater challenge for firms with five
to 19 employees (61%), compared to those with fewer than five
employees (44%). Although the difference is not statistically
significant due to the sample size, companies with 50 or more
employees also expressed a challenge in recruiting (69%).
− Evaluating employee performance was mentioned by a
significantly larger percentage of firms with five to 19 employees
(48%).
− Improving the skillsets of the workforce resonates mostly
among companies with five to 19 employees (38%) and those
with 20 to 49 employees (45%).
Base: Respondents who allocated a score of 0 to 6 to the HR function.
Respondents were limited to answering challenge-related questions for
up to three business functions.
15
Other human resources challenges
Other human resources challenges
(n=327) Multiple answers allowed
20%
20%
19%
18%
17%
17%
15%
11%
4%
3%
6%
Finding, recruiting and retainingskilled human resources employees
Developing a succession plan for allkey positions
Improving two-way communicationswith employees
Providing or improving the employeebenefits program
Retaining employees
Developing workplace policies
Implementing a formalorganizational structure
Mitigating generational differences
Addressing labour and union issues
Maintaining a safe work environment
Other
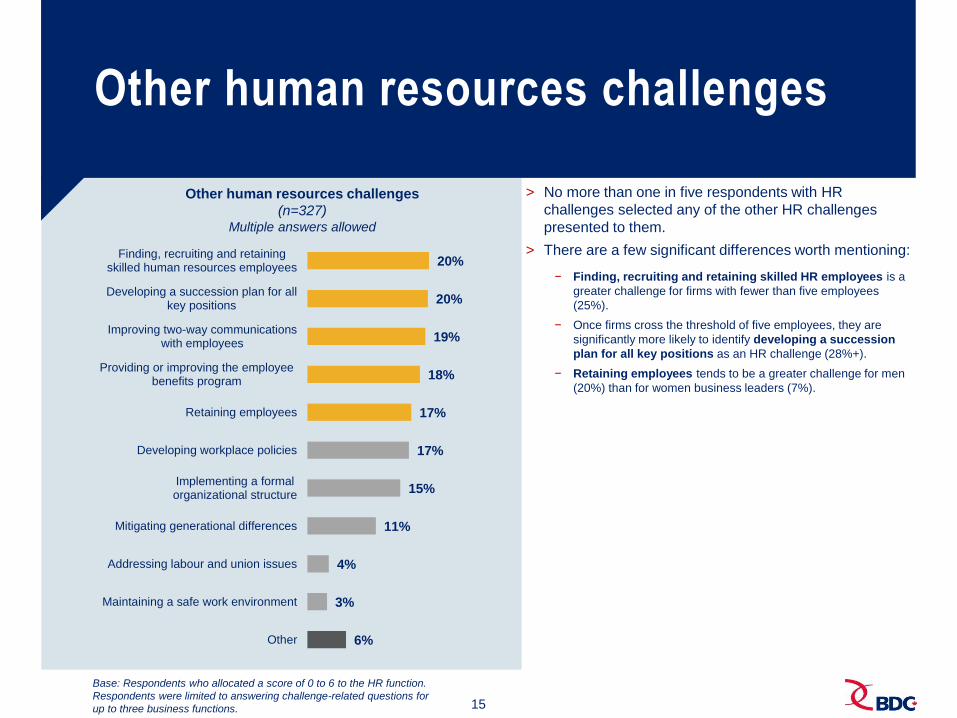
> No more than one in five respondents with HR
challenges selected any of the other HR challenges
presented to them.
> There are a few significant differences worth mentioning:
− Finding, recruiting and retaining skilled HR employees is a
greater challenge for firms with fewer than five employees
(25%).
− Once firms cross the threshold of five employees, they are
significantly more likely to identify developing a succession
plan for all key positions as an HR challenge (28%+).
− Retaining employees tends to be a greater challenge for men
(20%) than for women business leaders (7%).
Base: Respondents who allocated a score of 0 to 6 to the HR function.
Respondents were limited to answering challenge-related questions for
up to three business functions.

16
Learning and problem-solving (HR challenges)
Preference for learning more about addressing these
challenges
(n=310)
32%
29%
16%
15%
8%
Use self-serve resources
Leverage a peer group
Take a group training courseoffered by an external expert
Hire an external expert
Leverage internal companyresources
Preference for resolving an important issue with these
challenges
(n=316)
30%
25%
20%
15%
11%
Use self-serve resources
Leverage a peer group
Hire an external expert
Leverage internal companyresources
Take a group training courseoffered by an external expert
> Both in terms of learning and problem-solving, business
leaders facing HR challenges and issues prefer
using self-serve resources or leveraging a peer
group.
> Similar percentages of respondents faced with HR
challenges would rather use self-serve resources
(32%) or leverage a peer group (29%) to learn more
about addressing HR challenges.
> When it comes to resolving important issues in
human resources, the top two preferences remain the
same, but greater percentages of respondents selected
two of the less popular choices: hiring an external expert
and leveraging internal company resources.
> There are a few significant differences worth mentioning:
− When it comes to learning about HR challenges, B2B
companies (21%) are significantly more likely to hire an
external expert than B2C firms are (3%).
− The more product-oriented the firm, the more likely it is to prefer
using self-serve resources to resolve HR issues (product-
oriented 43%; mix of product and service orientation 35%; and
service-oriented 18%).
− Companies with 50 or more employees are significantly
more likely to prefer leveraging internal company resources
to learn more about addressing HR challenges and to resolve
such issues.
Base: Respondents who allocated a score of 0 to 6 to the HR function. Those
who preferred not to answer were excluded from the calculation base. Totals may
not equal 100% due to rounding.

17
Main information technology challenges
Main information technology challenges
(n=250) Multiple answers allowed
52%
48%
38%
33%
32%
30%
30%
Improving or developing a websiteand online presence
Integrating or improving the use ofsocial media and other digital
channels
Setting up and managing ourinfrastructure
Keeping informed about businesstechnology trends and best
practices
Determining and making the rightsoftware investments
Assessing and managingtechnology security risks
Finding the right technologyservice providers
> The main items identified by respondents facing
information technology challenges are closely
related to marketing: improving or developing a
website and online presence (52%) and integrating or
improving the use of social media and other digital
channels (48%).
> Setting up and managing their company’s
infrastructure, such as telephone systems, servers,
hardware and software, is an important challenge
(38%).
> At least three out of 10 business leaders said that
keeping informed (33%), determining the right software
investments (32%), dealing with technology security
risks (30%) and finding the right technology service
providers (30%) is a challenge for them.
> There are a few significant differences worth
mentioning:
− Finding the right technology service providers tends to be
a greater issue for women than for men (44% vs. 26%).
Base: Respondents who allocated a score of 0 to 6 to the IT function.
Respondents were limited to answering challenge-related questions for
up to three business functions.

18
Other information technology challenges
Other information technology challenges
(n=250) Multiple answers allowed
29%
26%
26%
24%
23%
21%
10%
6%
Responding to day-to-daytechnology issues
Evaluating existing technologyassets and developing a roadmap
for future investments
Determining and making the righthardware investments
Finding the right tech systems andintegrators to meet complex needs
across the business
Reducing information technologycosts
Finding simple software solutionsto address specific needs
Finding, recruiting and retainingskilled IT employees
Other
> From responding to day-to-day technology issues
(29%) and handling investment-related issues (26%)
to reducing information technology costs (23%) and
finding simple software solutions (21%), these
respondents are dealing with numerous and diverse
information technology challenges.
> There are a few significant differences worth
mentioning:
− Reducing information technology costs is a greater
challenge for women than for men (46% vs. 17%) and for
service-oriented businesses (31%) than for product-oriented
firms (12%).
Base: Respondents who allocated a score of 0 to 6 to the IT function.
Respondents were limited to answering challenge-related questions for
up to three business functions.

19
Preference for learning more about addressing these
challenges
(n=237)
32%
27%
17%
12%
11%
Hire an external expert
Use self-serve resources
Leverage a peer group
Take a group training courseoffered by an external expert
Leverage internal companyresources
Preference for resolving an important issue with these
challenges
(n=243)
> Information technology is the only function of the six
measured for which business leaders preferred to hire
an external expert to learn more about addressing
challenges (32%) and to resolve important issues
(40%).
> Respondents also like using self-serve resources to
learn more about addressing challenges (27%) and to
resolve issues (24%).
Learning and problem-solving (IT challenges)
Base: Respondents who allocated a score of 0 to 6 to the IT function.
Those who preferred not to answer were excluded from the calculation
base. Totals may not equal 100% due to rounding.
40%
24%
14%
12%
10%
Hire an external expert
Use self-serve resources
Take a group training courseoffered by an external expert
Leverage a peer group
Leverage internal companyresources
20
Main operations challenges
Main operations challenges
(n=142) Multiple answers allowed
45%
40%
39%
35%
33%
28%
27%
Managing costs
Improving employee productivityand skills
Obtaining additional financing foroperations
Finding, recruiting and retainingskilled workers
Managing production capacity
Dealing with an inadequatephysical location
Managing inventory
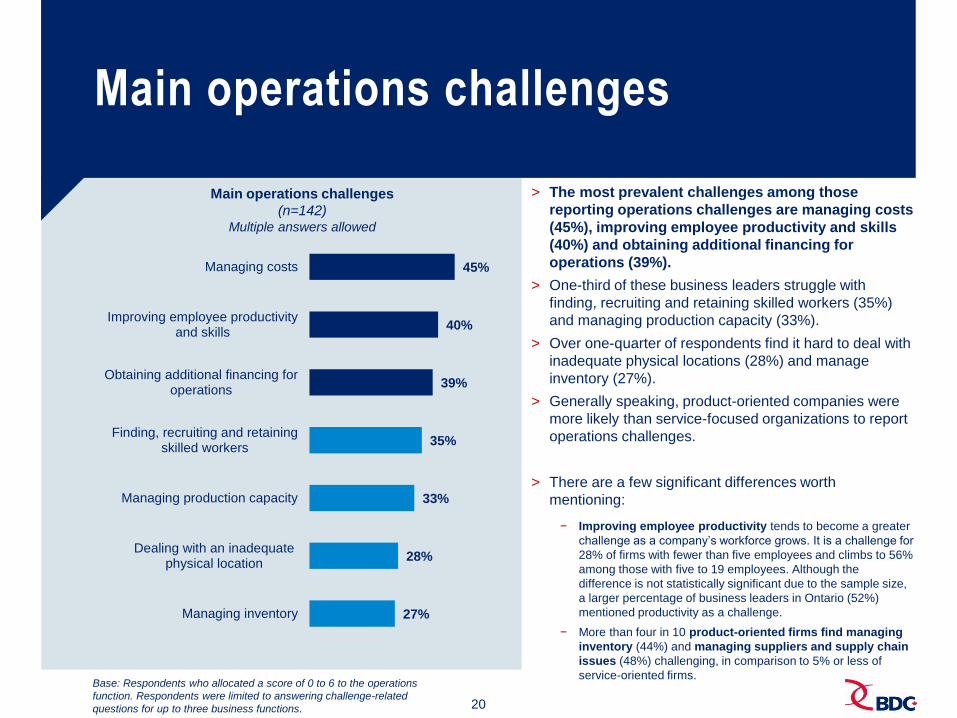
> The most prevalent challenges among those
reporting operations challenges are managing costs
(45%), improving employee productivity and skills
(40%) and obtaining additional financing for
operations (39%).
> One-third of these business leaders struggle with
finding, recruiting and retaining skilled workers (35%)
and managing production capacity (33%).
> Over one-quarter of respondents find it hard to deal with
inadequate physical locations (28%) and manage
inventory (27%).
> Generally speaking, product-oriented companies were
more likely than service-focused organizations to report
operations challenges.
> There are a few significant differences worth
mentioning:
− Improving employee productivity tends to become a greater
challenge as a company’s workforce grows. It is a challenge for
28% of firms with fewer than five employees and climbs to 56%
among those with five to 19 employees. Although the
difference is not statistically significant due to the sample size,
a larger percentage of business leaders in Ontario (52%)
mentioned productivity as a challenge.
− More than four in 10 product-oriented firms find managing
inventory (44%) and managing suppliers and supply chain
issues (48%) challenging, in comparison to 5% or less of
service-oriented firms. Base: Respondents who allocated a score of 0 to 6 to the operations
function. Respondents were limited to answering challenge-related
questions for up to three business functions.
21
Other operations challenges
Other operations challenges
(n=142) Multiple answers allowed
26%
25%
23%
23%
21%
19%
10%
4%
5%
Managing suppliers and supplychain issues
Acquiring equipment, machineryor technology
Addressing legal, regulatory orcompliance requirements
Dealing with quality control issues
Automating routine or manualtasks
Handling distribution and logistics
Obtaining or maintaining ISO andother certifications
Maintaining a safe workenvironment
Other
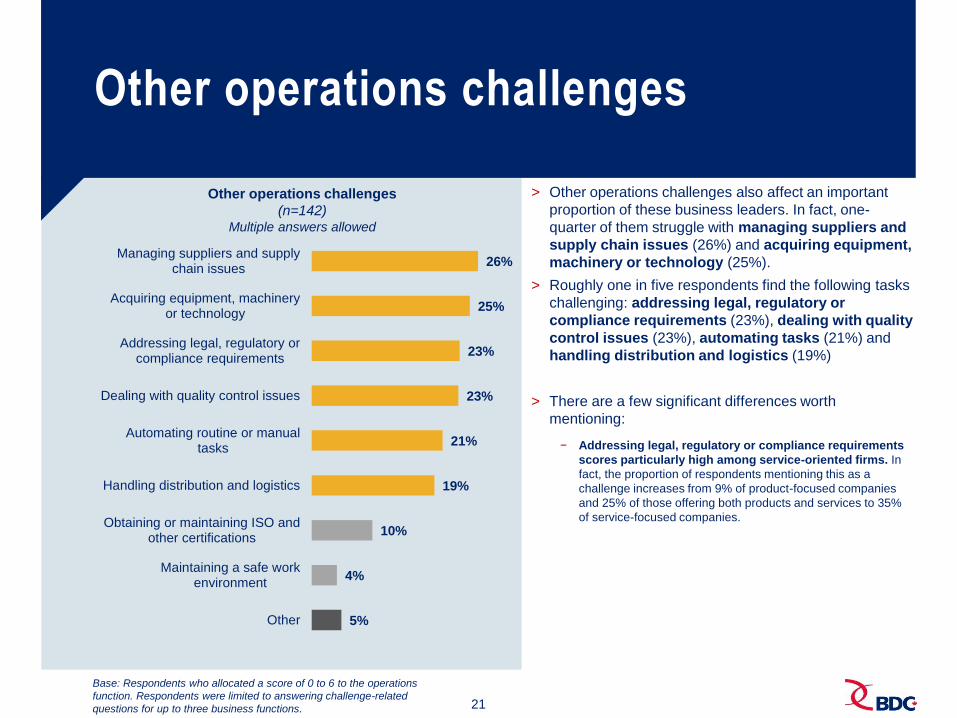
> Other operations challenges also affect an important
proportion of these business leaders. In fact, one-
quarter of them struggle with managing suppliers and
supply chain issues (26%) and acquiring equipment,
machinery or technology (25%).
> Roughly one in five respondents find the following tasks
challenging: addressing legal, regulatory or
compliance requirements (23%), dealing with quality
control issues (23%), automating tasks (21%) and
handling distribution and logistics (19%)
> There are a few significant differences worth
mentioning:
− Addressing legal, regulatory or compliance requirements
scores particularly high among service-oriented firms. In
fact, the proportion of respondents mentioning this as a
challenge increases from 9% of product-focused companies
and 25% of those offering both products and services to 35%
of service-focused companies.
Base: Respondents who allocated a score of 0 to 6 to the operations
function. Respondents were limited to answering challenge-related
questions for up to three business functions.
22
Preference for learning more about addressing these
challenges
(n=136)
28%
24%
18%
18%
12%
Use self-serve resources
Leverage a peer group
Hire an external expert
Take a group training courseoffered by an external expert
Leverage internal companyresources
Preference for resolving an important issue with these
challenges
(n=138)
Learning and problem-solving (operations challenges)
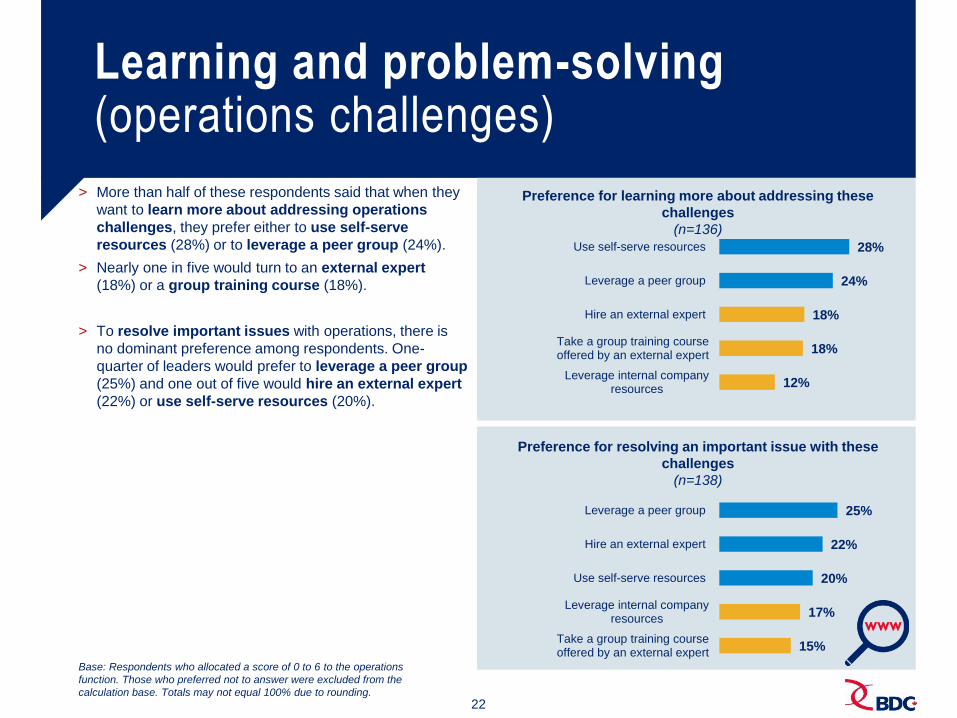
> More than half of these respondents said that when they
want to learn more about addressing operations
challenges, they prefer either to use self-serve
resources (28%) or to leverage a peer group (24%).
> Nearly one in five would turn to an external expert
(18%) or a group training course (18%).
> To resolve important issues with operations, there is
no dominant preference among respondents. One-
quarter of leaders would prefer to leverage a peer group
(25%) and one out of five would hire an external expert
(22%) or use self-serve resources (20%).
Base: Respondents who allocated a score of 0 to 6 to the operations
function. Those who preferred not to answer were excluded from the
calculation base. Totals may not equal 100% due to rounding.
25%
22%
20%
17%
15%
Leverage a peer group
Hire an external expert
Use self-serve resources
Leverage internal companyresources
Take a group training courseoffered by an external expert
23
Main management challenges
Main general management challenges
(n=140) Multiple answers allowed
41%
38%
34%
32%
30%
29%
29%
28%
Making time for long-term planningwhile managing day-to-day
activities
Evaluating growth opportunities(e.g., expansion, mergers and
acquisitions)
Creating and updating the businessplan and model
Improving managerial skills andcapabilities
Developing better networks,alliances and partnerships
Dealing with owners’ time constraints
Clarifying the strategic orientationof the company
Determining the value of thecompany
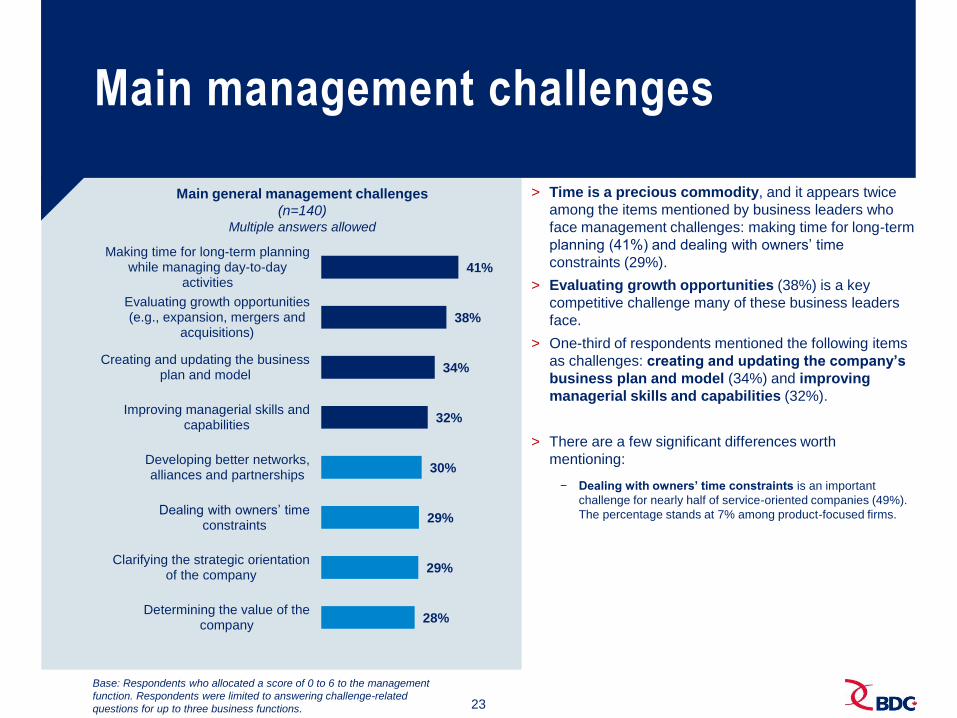
> Time is a precious commodity, and it appears twice
among the items mentioned by business leaders who
face management challenges: making time for long-term
planning (41%) and dealing with owners’ time
constraints (29%).
> Evaluating growth opportunities (38%) is a key
competitive challenge many of these business leaders
face.
> One-third of respondents mentioned the following items
as challenges: creating and updating the company’s
business plan and model (34%) and improving
managerial skills and capabilities (32%).
> There are a few significant differences worth
mentioning:
− Dealing with owners’ time constraints is an important
challenge for nearly half of service-oriented companies (49%).
The percentage stands at 7% among product-focused firms.
Base: Respondents who allocated a score of 0 to 6 to the management
function. Respondents were limited to answering challenge-related
questions for up to three business functions.

24
Other management challenges
Other general management challenges
(n=140) Multiple answers allowed
25%
25%
24%
22%
21%
14%
13%
8%
7%
4%
Fostering innovation andcontinuous improvement
Measuring company performance
Improving decision-makingprocesses
Increasing communication andcollaboration among leaders
Carrying out succession planning(change of ownership)
Developing a succession plan forall key positions
Establishing an emergency anddisaster continuity plan
Creating and maximizing theexpertise of an active board
Finding, recruiting and retainingskilled managers
Other
> Many of the other management challenges are
strategic in nature, such as fostering innovation and
continuous improvement (25%), measuring company
performance (25%) and improving decision-making
processes (24%).
> Increasing communication and collaboration among
leaders (22%) and carrying out a succession plan (21%)
resonate among one in five business leaders facing
management challenges.
Base: Respondents who allocated a score of 0 to 6 to the management
function. Respondents were limited to answering challenge-related
questions for up to three business functions.

25
Preference for learning more about addressing these
challenges
(n=134)
26%
25%
22%
20%
8%
Leverage a peer group
Use self-serve resources
Take a group training courseoffered by an external expert
Hire an external expert
Leverage internal companyresources
Preference for resolving an important issue with these
challenges
(n=135)
28%
23%
23%
15%
10%
Leverage a peer group
Hire an external expert
Use self-serve resources
Take a group training courseoffered by an external expert
Leverage internal companyresources
> Business leaders facing management challenges
have a slight preference for leveraging a peer group
to learn about addressing these challenges (26%) and to
resolve issues in this field (28%).
> Self-serve resources are quite popular among one-
quarter of respondents to these two questions (learning,
25%; problem-solving, 23%).
Learning and problem-solving (management challenges)
Base: Respondents who allocated a score of 0 to 6 to the management
function. Those who preferred not to answer were excluded from the
calculation base. Totals may not equal 100% due to rounding.

26
Content format use
Content format
Use this
format
regularly
Use this
format once in
a while
Seldom use
this format
Never use this
format
Don’t know/
No opinion
Document templates (business plan,
cash flow spreadsheets) 42% 31% 14% 11% 2%
Internal training (employees training
other employees) 41% 28% 14% 13% 5%
Infographics, short texts and articles 32% 31% 20% 14% 3%
Networking events and peer learning 28% 37% 22% 13% 1%
White papers, reports and eBooks 25% 29% 22% 21% 4%
Mentoring 24% 28% 23% 23% 2%
Webinars 23% 35% 22% 18% 3%
Podcasts and short videos 17% 33% 24% 23% 3%
Diagnostic tools and assessments 16% 29% 27% 22% 6%
External training (sending employees to
training courses) 15% 35% 28% 18% 5%
Business coaching 15% 22% 29% 30% 4%
E-learning or massive open online
courses (MOOCs) 14% 22% 29% 32% 3%
One-on-one consulting services 12% 25% 31% 29% 3%
Web-based business networking and
discussion groups 12% 23% 30% 32% 3%

27
> There are a few significant differences worth mentioning:
− Use of external training tends to increase with workforce size and
revenues. It has greater appeal among service-oriented firms.
− Business coaching is more predominant in firms that have both an
advisory board and board of directors (29%) or simply an advisory
board (28%). The same phenomenon can be observed regarding
mentoring (41%+).
Content format use (cont’d)
Content format
Use this
format
regularly
Use this
format
once in a
while
Document templates
(business plan, cash flow
spreadsheets) 42% 31%
Internal training (employees
training other employees) 41% 28%
Infographics, short texts and
articles 32% 31%
Networking events and peer
learning 28% 37%
White papers, reports and
eBooks 25% 29%
Mentoring 24% 28%
Webinars 23% 35%
Podcasts and short videos 17% 33%
> The most frequently used formats are document templates
(42% regularly) and internal training (41% regularly).
− Use of Internal training is quite common among those in the Prairies
and in B2C firms (51%). Furthermore, it tends to increase as revenues
and the number of employees rise.
> Written content, whether printed or electronic, is also quite
popular. It includes infographics, short texts and articles
(32% regularly), as well as white papers, reports and eBooks
(25% regularly).
− A significantly larger percentage of respondents in companies with
revenues less than $500,000 and in firms with fewer than five
employees mentioned using infographics, short texts and articles,
as well as white papers, reports and eBooks, regularly. The latter are
generally more popular among service-oriented companies.
− Women are also more likely than men to use written content regularly.
> More visual formats, such as webinars (23% regularly) and
podcasts and short videos (17% regularly) have gained in
popularity as business technology has improved.
− Women are more likely than men to use them (33% vs. 20%).
> A preference for human interactions is reflected in the fact
that many business leaders participate in networking events
and peer learning (28% regularly) and in mentoring activities
(24% regularly).
− More than one-third of service-oriented firms (37%) leverage networking
regularly.
> One-third of firms with fewer than five employees (32%)
indicated that they never use one-on-one consulting.
28
Training format use
Use this format
regularly
Use this format
once in a while
Never use this
format
Don’t know/
No opinion
In-house training for employees by
employees (n=744) 51% 33% 14% 2%
Webinars, online training or e-learning
courses (n=751) 31% 50% 17% 2%
Peer networks (entrepreneurs addressing
topics with other entrepreneurs) (n=749) 21% 47% 28% 3%
Off-site training (may include attendees from
multiple companies) (n=748) 11% 58% 28% 3%
External trainers or consultants at your
company site (n=750) 9% 46% 43% 2%
Other (n=668) 7% 17% 26% 51%
Note: Respondents who preferred not to answer were excluded from the
calculation base. Totals may not equal 100% due to rounding.
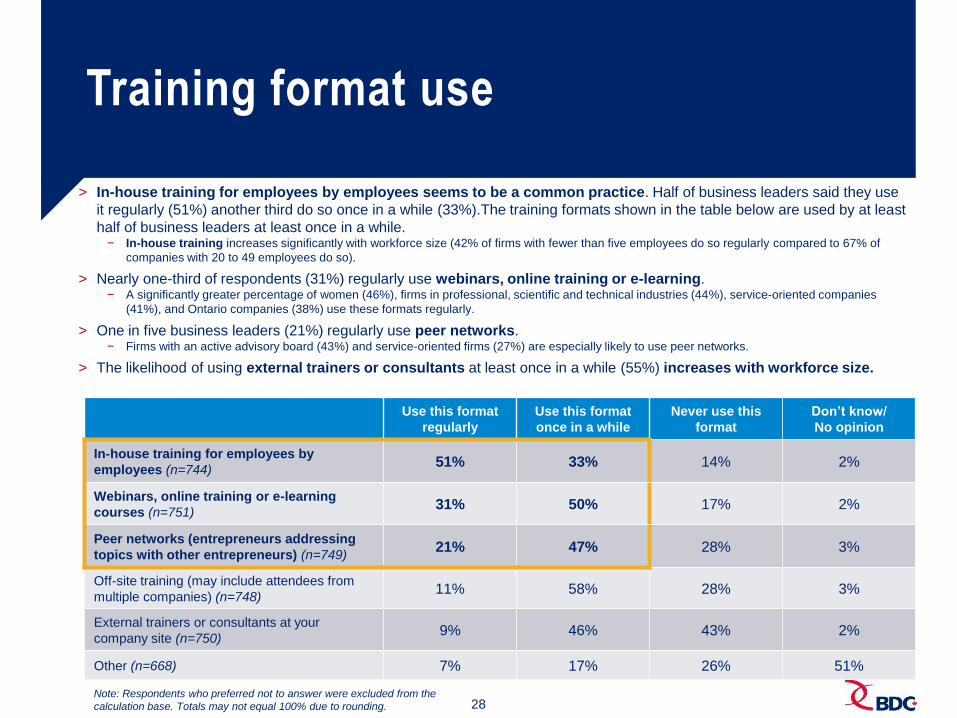
> In-house training for employees by employees seems to be a common practice. Half of business leaders said they use
it regularly (51%) another third do so once in a while (33%).The training formats shown in the table below are used by at least
half of business leaders at least once in a while. − In-house training increases significantly with workforce size (42% of firms with fewer than five employees do so regularly compared to 67% of
companies with 20 to 49 employees do so).
> Nearly one-third of respondents (31%) regularly use webinars, online training or e-learning. − A significantly greater percentage of women (46%), firms in professional, scientific and technical industries (44%), service-oriented companies
(41%), and Ontario companies (38%) use these formats regularly.
> One in five business leaders (21%) regularly use peer networks. − Firms with an active advisory board (43%) and service-oriented firms (27%) are especially likely to use peer networks.
> The likelihood of using external trainers or consultants at least once in a while (55%) increases with workforce size.
29
Training supplier use
Use this supplier
regularly
Use this supplier
once in a while
Never use this
supplier
Don’t know/
No opinion
Industry or business associations (n=711) 27% 59% 12% 1%
Private companies (n=707) 21% 50% 28% 1%
Government programs (n=707) 11% 48% 41% 1%
University or technical institutes (n=706) 9% 42% 47% 1%
Financial institutions (n=705) 3% 41% 53% 3%
Other (n=634) 4% 10% 36% 51%
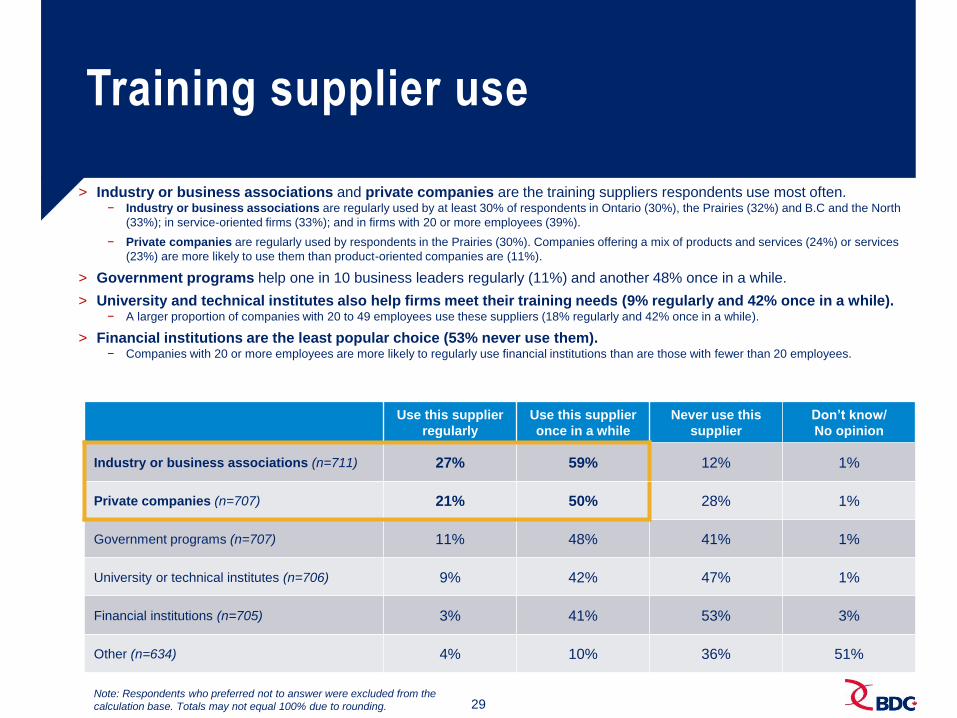
> Industry or business associations and private companies are the training suppliers respondents use most often. − Industry or business associations are regularly used by at least 30% of respondents in Ontario (30%), the Prairies (32%) and B.C and the North
(33%); in service-oriented firms (33%); and in firms with 20 or more employees (39%).
− Private companies are regularly used by respondents in the Prairies (30%). Companies offering a mix of products and services (24%) or services
(23%) are more likely to use them than product-oriented companies are (11%).
> Government programs help one in 10 business leaders regularly (11%) and another 48% once in a while.
> University and technical institutes also help firms meet their training needs (9% regularly and 42% once in a while). − A larger proportion of companies with 20 to 49 employees use these suppliers (18% regularly and 42% once in a while).
> Financial institutions are the least popular choice (53% never use them). − Companies with 20 or more employees are more likely to regularly use financial institutions than are those with fewer than 20 employees.
Note: Respondents who preferred not to answer were excluded from the
calculation base. Totals may not equal 100% due to rounding.

30
In summary: Most beneficial training
Training related to…
(n=730)
44%
14%
13%
11%
9%
7%
3%
Sales andmarketing
Finance
Operations
Informationtechnology
Generalmanagement
Humanresources
Other
Training using…
(n=722)
28%
25%
18%
15%
12%
2%
Webinars, onlinetraining or e-learning
courses
External trainers orconsultants at your
company site
Peer networks(entrepreneurs
addressing topicswith other
entrepreneurs)
Off-site training(may include
attendees frommultiple companies)
In-house trainers(employees training
employees)
Other
41%
27%
14%
8%
5%
5%
Industry orbusiness
associations
Privatecompanies
Governmentprograms
University ortechnicalinstitutes
Financialinstitutions
Other
Training offered by…
(n=700)
Note: Respondents who preferred not to answer were excluded from the
calculation base. Totals may not equal 100% due to rounding.

31
Most beneficial training function
Training related to…
(n=730)
44%
14%
13%
11%
9%
7%
3%
Sales and marketing
Finance
Operations
Information technology
General management
Human resources
Other
> Many business leaders believe that training related to sales
and marketing (44%) would be the most beneficial for
their organization.
> Financial training would be the most beneficial according to
14% of business leaders.
> Operations resonates among 13% of respondents.
− This is especially true among firms with 50 or more employees
(25%) and those with revenues ranging from $5 million to $10
million (29%).
> Just over one in 10 respondents (11%) would most value
training related to information technology.
> Fewer than one in 10 respondents believe general
management (9%) and human resources (7%) training
would be the most beneficial types of training.
Note: Respondents who preferred not to answer were excluded from the
calculation base. Total may not equal 100% due to rounding.
32
Most beneficial training format
Training using…
(n=722)
28%
25%
18%
15%
12%
2%
Webinars, online trainingor e-learning courses
External trainers orconsultants at your
company site
Peer networks(entrepreneurs
addressing topics withother entrepreneurs)
Off-site training (mayinclude attendees from
multiple companies)
In-house trainers(employees training
employees)
Other
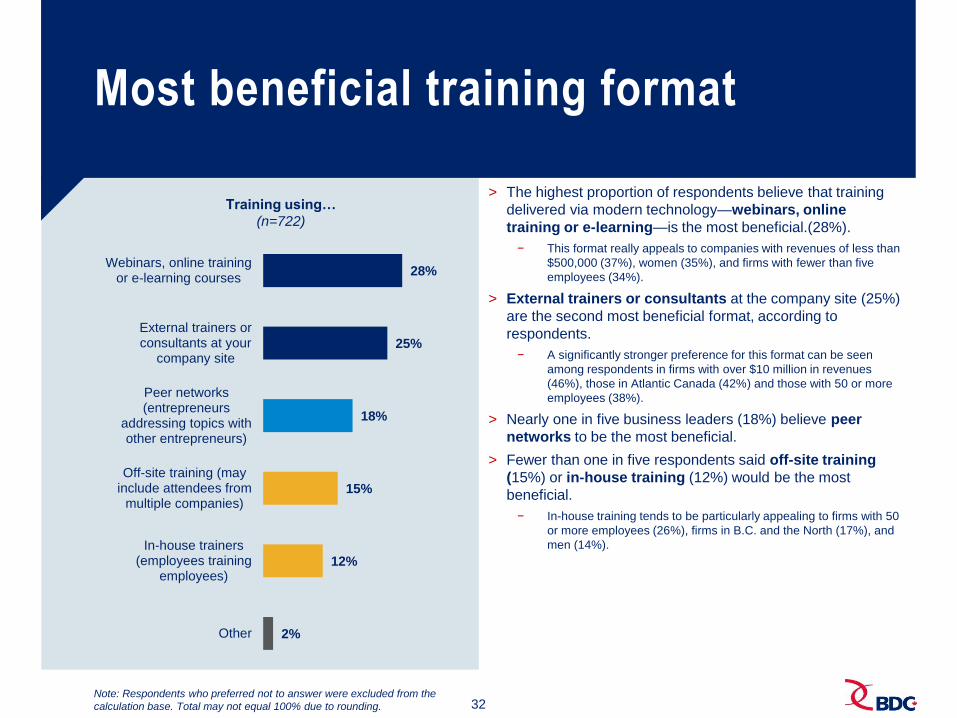
> The highest proportion of respondents believe that training
delivered via modern technology—webinars, online
training or e-learning—is the most beneficial.(28%).
− This format really appeals to companies with revenues of less than
$500,000 (37%), women (35%), and firms with fewer than five
employees (34%).
> External trainers or consultants at the company site (25%)
are the second most beneficial format, according to
respondents.
− A significantly stronger preference for this format can be seen
among respondents in firms with over $10 million in revenues
(46%), those in Atlantic Canada (42%) and those with 50 or more
employees (38%).
> Nearly one in five business leaders (18%) believe peer
networks to be the most beneficial.
> Fewer than one in five respondents said off-site training
(15%) or in-house training (12%) would be the most
beneficial.
− In-house training tends to be particularly appealing to firms with 50
or more employees (26%), firms in B.C. and the North (17%), and
men (14%).
Note: Respondents who preferred not to answer were excluded from the
calculation base. Total may not equal 100% due to rounding.

33
Most beneficial training supplier
Training offered by…
(n=700)
41%
27%
14%
8%
5%
5%
Industry or businessassociations
Private companies
Government programs
University or technicalinstitutes
Financial institutions
Other
> The greatest proportion of respondents believe that industry
or business associations would be the type of training
supplier most beneficial to their business (41%).
− This is the case everywhere in Canada (43%+) except Quebec
(26%).
> Private companies are the preferred choice of 27% of
respondents.
− Private companies are more appealing to firms with 20 or more
employees (36%+) than to those with fewer than five employees
(23%). Firms with four to five owners also selected them more
frequently than other types of firms did (51%).
> Government programs are deemed most beneficial by 14%
of business leaders.
− Although not statistically significant due to sample size, a larger
percentage of respondents in the arts, entertainment and
recreation sector (29%) and in the accommodation and food
services sector (25%) selected government programs as the most
potentially beneficial supplier.
> Fewer than one in 10 business leaders (8%) selected
university or technical institutes.
> Financial institutions complete the list at 5%.
Note: Respondents who preferred not to answer were excluded from the
calculation base. Total may not equal 100% due to rounding.
34
Training mindset
In terms of training, which of the following statements best reflects
your own position? (n=759)
I participate in various business training activities…
With regard to employee training at large, which of the following
statements best reflects your company’s reality? (n=725)
Employees are offered the opportunity to participate in various
training activities…
30%
45%
22%
3%
On a regular basis
As needed
Seldom
Never
23%
54%
18%
5%
On a regular basis
As needed
Seldom
Never
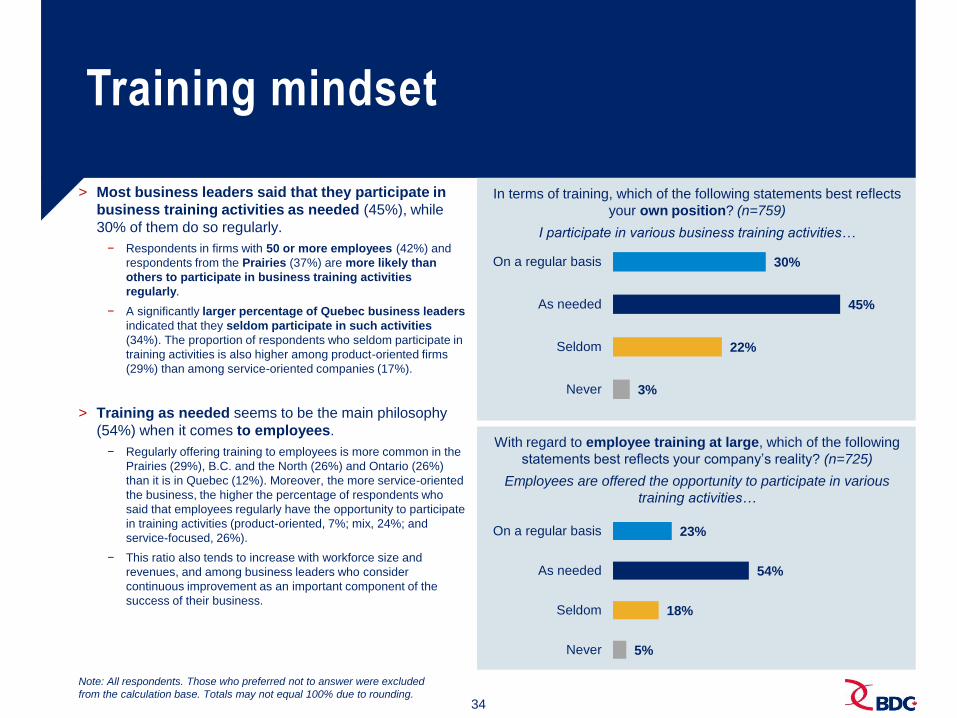
> Most business leaders said that they participate in
business training activities as needed (45%), while
30% of them do so regularly.
− Respondents in firms with 50 or more employees (42%) and
respondents from the Prairies (37%) are more likely than
others to participate in business training activities
regularly.
− A significantly larger percentage of Quebec business leaders
indicated that they seldom participate in such activities
(34%). The proportion of respondents who seldom participate in
training activities is also higher among product-oriented firms
(29%) than among service-oriented companies (17%).
> Training as needed seems to be the main philosophy
(54%) when it comes to employees.
− Regularly offering training to employees is more common in the
Prairies (29%), B.C. and the North (26%) and Ontario (26%)
than it is in Quebec (12%). Moreover, the more service-oriented
the business, the higher the percentage of respondents who
said that employees regularly have the opportunity to participate
in training activities (product-oriented, 7%; mix, 24%; and
service-focused, 26%).
− This ratio also tends to increase with workforce size and
revenues, and among business leaders who consider
continuous improvement as an important component of the
success of their business.
Note: All respondents. Those who preferred not to answer were excluded
from the calculation base. Totals may not equal 100% due to rounding.

35
Continuous improvement
Importance of continuous improvement
on a scale of 0 to 10
(n=721)
60%
32%
7%
2%
Very important (9-10)
Important (7-8)
Neutral (5-6)
Not important (0-4)
> The majority of respondents consider continuous
improvement to be very important (60%) to the success
of their business. Respondents gave this priority an
average score of 8.6 out of 10.
− Firms with yearly revenues ranging between $500,000 and $1 million
are much more likely to consider continuous improvement very
important (73% and 9.1 average score).
− Younger entrepreneurs (i.e., under 44 years of age) are much more
likely than any other respondents to have allocated a score of 10 to
the overall importance of continuous improvement.
Average score
out of 10:
8.6
Note: All respondents. Those who preferred not to answer were excluded
from the calculation base. Total may not equal 100% due to rounding.

36
Added value beyond funding
In your opinion, how could BDC provide you with additional value beyond funding? (n=314)
1. Provide training
2. Offer business coaching
3. Foster networking opportunities
4. Provide information for entrepreneurs
5. Foster internal and external collaboration
6. Offer mentoring
7. Miscellaneous responses

37
RESPONDENT PROFILE

38
56%
32%
8% 2% 2%
Fewer than 5 5 to 19 20 to 49 50 to 99 100 or more
22%
15%
12%
5%
4%
4%
3%
3%
3%
3%
3%
2%
2%
2%
2%
1%
1%
1%
12%
Professional, scientific and…
Manufacturing
Retail (fewer than 20 employees)
Wholesale trade
Construction
Other services (except public…
Information and cultural industries
Finance and insurance
Accommodation and food services
Arts, entertainment and recreation
Educational services
Transportation and warehousing
Management of companies and…
Health care and social assistance
Retail (20 or more employees)
Agriculture, forestry, fishing and…
Real estate, and rental and leasing
Mining, quarrying, and oil and gas…
Other
Region
Number of
employees Sector/
industry
Note that results have been weighted by region and number of employees.
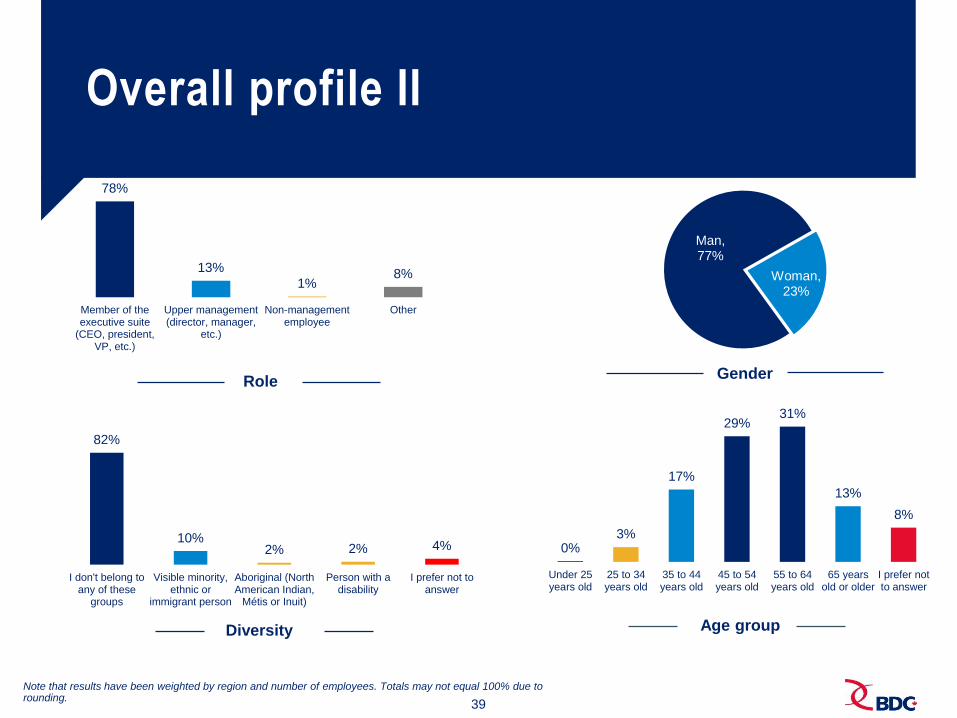
Overall profile I
21%
15%
36%
22%
7%
39
Man, 77%
Woman, 23%
82%
10% 2% 2% 4%
I don't belong toany of these
groups
Visible minority,ethnic or
immigrant person
Aboriginal (NorthAmerican Indian,
Métis or Inuit)
Person with adisability
I prefer not toanswer
Role
Age group
0% 3%
17%
29% 31%
13%
8%
Under 25years old
25 to 34years old
35 to 44years old
45 to 54years old
55 to 64years old
65 yearsold or older
I prefer notto answer
78%
13%
1% 8%
Member of theexecutive suite
(CEO, president,VP, etc.)
Upper management(director, manager,
etc.)
Non-managementemployee
Other
Note that results have been weighted by region and number of employees. Totals may not equal 100% due to rounding.
Diversity
Gender
Overall profile II

40
45%
37%
18%
Our products and/orservices are geared
toward other businesses(B2B)
Our products and/orservices are geared
toward both businesses(B2B) and consumers
(B2C)
Our products and/orservices are geared
toward consumers (B2C)
Target market
Boards
5% 7% 14%
74%
We have both anactive advisory
board AND a boardof directors
We have an activeadvisory board
We have a board ofdirectors
No, we don’t have an advisory board or a board of directors
Note that results have been weighted by region and number of employees. Totals may not equal 100% due to rounding.
Offering
Overall profile III
21%
40% 39%
We are a product-oriented company
We offer a mix ofproducts and services
We are a service-oriented company
41
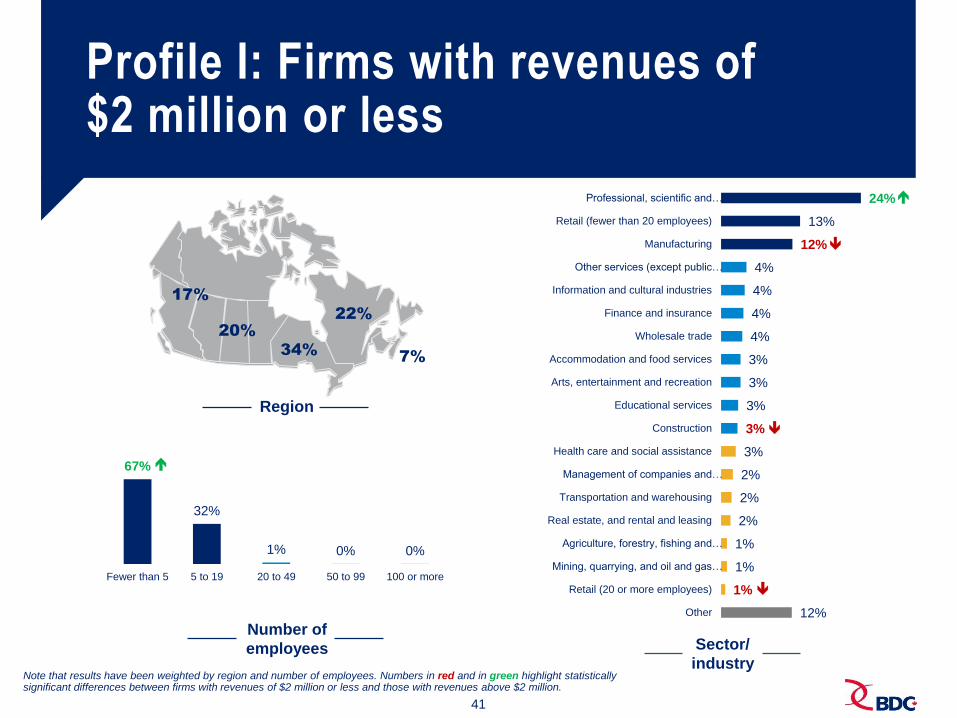
67%
32%
1% 0% 0%
Fewer than 5 5 to 19 20 to 49 50 to 99 100 or more
24%
13%
12%
4%
4%
4%
4%
3%
3%
3%
3%
3%
2%
2%
2%
1%
1%
1%
12%
Professional, scientific and…
Retail (fewer than 20 employees)
Manufacturing
Other services (except public…
Information and cultural industries
Finance and insurance
Wholesale trade
Accommodation and food services
Arts, entertainment and recreation
Educational services
Construction
Health care and social assistance
Management of companies and…
Transportation and warehousing
Real estate, and rental and leasing
Agriculture, forestry, fishing and…
Mining, quarrying, and oil and gas…
Retail (20 or more employees)
Other
Region
Number of
employees Sector/
industry
Profile I: Firms with revenues of $2 million or less
Note that results have been weighted by region and number of employees. Numbers in red and in green highlight statistically significant differences between firms with revenues of $2 million or less and those with revenues above $2 million.
17%
20%
34%
22%
7%
42
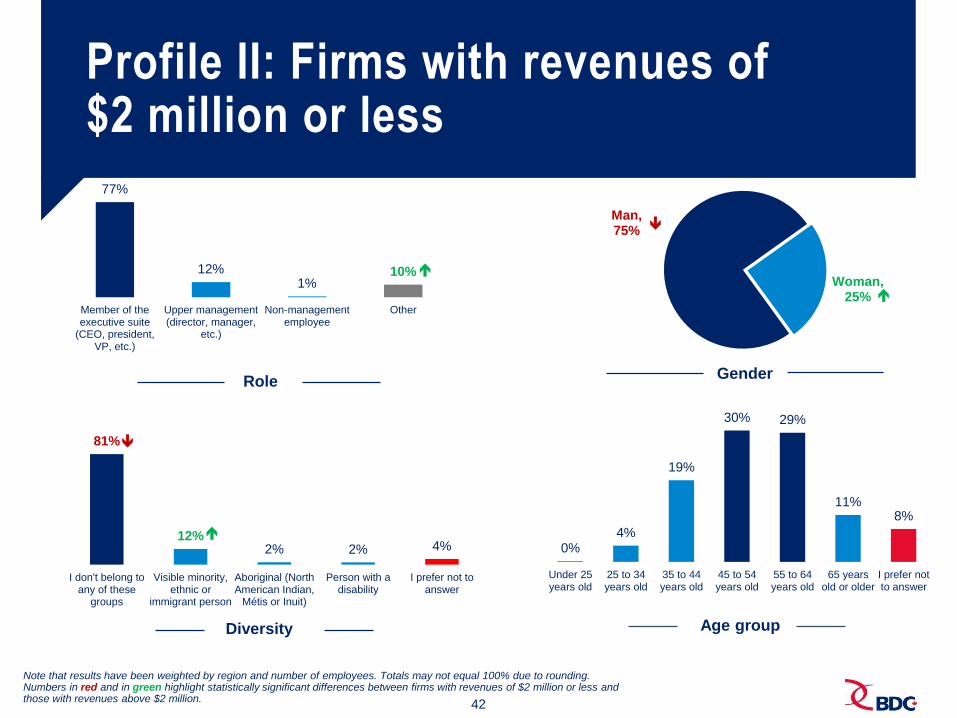
Man, 75%
Woman, 25%
81%
12% 2% 2% 4%
I don't belong toany of these
groups
Visible minority,ethnic or
immigrant person
Aboriginal (NorthAmerican Indian,
Métis or Inuit)
Person with adisability
I prefer not toanswer
Role
Age group
0% 4%
19%
30% 29%
11% 8%
Under 25years old
25 to 34years old
35 to 44years old
45 to 54years old
55 to 64years old
65 yearsold or older
I prefer notto answer
77%
12% 1%
10%
Member of theexecutive suite
(CEO, president,VP, etc.)
Upper management(director, manager,
etc.)
Non-managementemployee
Other
Diversity
Gender
Profile II: Firms with revenues of $2 million or less
Note that results have been weighted by region and number of employees. Totals may not equal 100% due to rounding. Numbers in red and in green highlight statistically significant differences between firms with revenues of $2 million or less and those with revenues above $2 million.
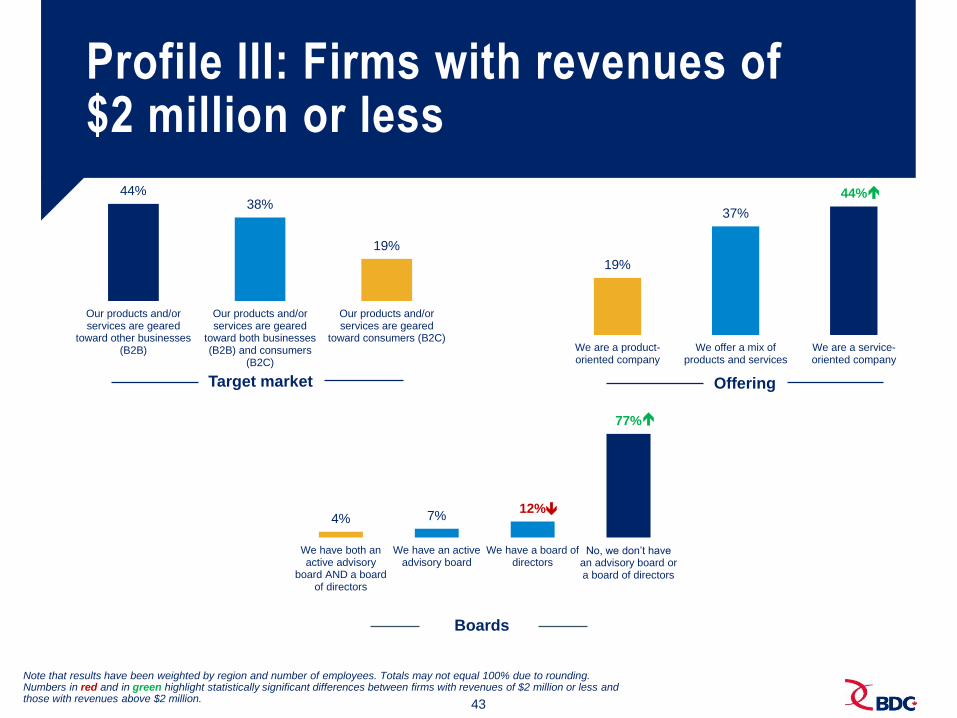
43
44% 38%
19%
Our products and/orservices are geared
toward other businesses(B2B)
Our products and/orservices are geared
toward both businesses(B2B) and consumers
(B2C)
Our products and/orservices are geared
toward consumers (B2C)
Target market
Boards
4% 7% 12%
77%
We have both anactive advisory
board AND a boardof directors
We have an activeadvisory board
We have a board ofdirectors
No, we don’t have an advisory board or a board of directors
Note that results have been weighted by region and number of employees. Totals may not equal 100% due to rounding. Numbers in red and in green highlight statistically significant differences between firms with revenues of $2 million or less and those with revenues above $2 million.
Offering
19%
37%
44%
We are a product-oriented company
We offer a mix ofproducts and services
We are a service-oriented company
Profile III: Firms with revenues of $2 million or less

44
CONTEXT, OBJECTIVES AND METHODOLOGY
45
Context, objectives and methodology
> The Consulting team mandated BDC’s research and market intelligence (R&MI) team to provide insight on various
entrepreneurial needs.
> The objective of the study was to gain additional information regarding the following:
− the business functions at which business leaders believe their organization excels and those they find more challenging
− more in-depth information about the types of challenges associated with these business functions
− those responsible for these business functions
− business leaders’ preference for learning about challenges associated with these business functions, as well as their preference
for resolving issues related to the business functions
− the types of content formats they use
− the types of training formats they use
− the types of training suppliers they use
− business leaders’ mindset about training and continuous improvement
− information about the types of content, formats and suppliers that business leaders believe would be the most beneficial to their
organization
> The questionnaire was available online between June 16 and June 28. An email invitation was sent on Tuesday, June 16, to
4,277 business leaders who are members of the BDC ViewPoints panel. A total of 760 respondents completed the entire
survey.
> Results were weighted by region and number of employees in order to extrapolate results to the entire Canadian business
landscape.
> The resulting report was written by BDC’s R&MI team.

46
RESULTS, BY COMPANY REVENUE

47
Business functions
Base: All respondents. Those who preferred not to answer were excluded from the calculation base.
Numbers in red and in green highlight statistically significant differences between firms with revenues of
$2 million or less and those with revenues above $2 million.
Total
Revenues of
$2 million or
less
Revenues
above
$2 million
Sales and marketing 5.9 5.7 6.4
Finance (treasury) 6.0 5.7 7.0
Human resources 6.1 6.0 6.1
Information technology 6.7 6.8 6.5
Operations 7.1 7.0 7.3
General management 7.2 7.2 7.3
> For firms with revenues of $2 million or less, finance (treasury) and sales and marketing are tied for the most
challenging business function (average score of 5.7 out of 10). As a reminder to the reader, the lower the average score
the more challenging the business function is perceived.
> Human resources rounds off the top three most challenging business functions (6.0)
> Overall results (total) are nearly identical to those among firms with revenues of $2 million or less.
This is due, in part, to the fact that firms with revenues of $2 million or less tend to be smaller firms, which comprise the majority of
businesses in Canada (companies with one to nine employees represent 75% of Canadian businesses).

48
Head of business function
General management Finance (treasury) Sales and marketing
Who is responsible? Total
Revenues
of
$2 million
or less
Revenues
above
$2 million
Total
Revenues
of
$2 million
or less
Revenues
above
$2 million
Total
Revenues
of
$2 million
or less
Revenues
above
$2 million
The business leader 84% 87% 73% 70% 76% 52% 69% 77% 40%
A partner or co-owner 20% 20% 23% 18% 19% 13% 22% 22% 25%
An employee assigned to
this function 7% 4% 19% 13% 7% 34% 15% 9% 39%
An assigned employee
who is also responsible
for other functions
4% 4% 6% 5% 3% 12% 7% 6% 12%
Someone outside the
company 0% 0% 0% 8% 10% 4% 6% 7% 4%
Don’t know/refused to
answer 0% 0% 1% 1% 1% 0% 1% 1% 1%
> From the results presented below, we can clearly see that in the majority of cases, these business functions are the
business leader’s responsibility. This is especially true for firms with revenues of $2 million or less.
Base: All respondents. Those who preferred not to answer were excluded from the calculation base. Numbers in red and in green highlight statistically significant
differences between firms with revenues of $2 million or less and those with revenues above $2 million.

49
Head of business function (cont’d)
Operations Human resources Information technology
Who is responsible? Total
Revenues
of
$2 million
or less
Revenues
above
$2 million
Total
Revenues
of
$2 million
or less
Revenues
above
$2 million
Total
Revenues
of
$2 million
or less
Revenues
above
$2 million
The business leader 66% 73% 39% 66% 74% 42% 56% 64% 29%
A partner or co-owner 27% 25% 31% 24% 24% 21% 17% 17% 17%
An employee assigned to
this function 15% 10% 35% 11% 7% 27% 13% 8% 30%
An assigned employee
who is also responsible
for other functions
9% 8% 15% 9% 6% 21% 11% 8% 21%
Someone outside the
company 1% 1% 0% 3% 2% 3% 16% 15% 20%
Don’t know/ refused to
answer 1% 1% 0% 2% 2% 0% 1% 1% 0%
Base: All respondents. Those who preferred not to answer were excluded from the calculation base. Numbers in red and in green highlight statistically significant
differences between firms with revenues of $2 million or less and those with revenues above $2 million.
50
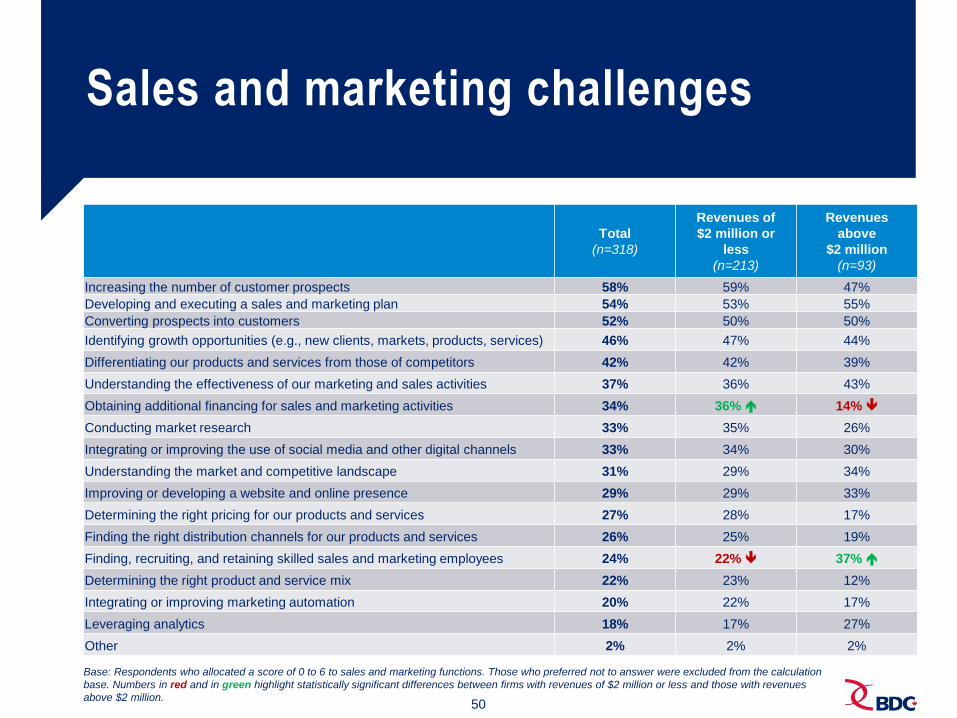
Sales and marketing challenges
Total
(n=318)
Revenues of
$2 million or
less
(n=213)
Revenues
above
$2 million
(n=93)
Increasing the number of customer prospects 58% 59% 47%
Developing and executing a sales and marketing plan 54% 53% 55%
Converting prospects into customers 52% 50% 50%
Identifying growth opportunities (e.g., new clients, markets, products, services) 46% 47% 44%
Differentiating our products and services from those of competitors 42% 42% 39%
Understanding the effectiveness of our marketing and sales activities 37% 36% 43%
Obtaining additional financing for sales and marketing activities 34% 36% 14%
Conducting market research 33% 35% 26%
Integrating or improving the use of social media and other digital channels 33% 34% 30%
Understanding the market and competitive landscape 31% 29% 34%
Improving or developing a website and online presence 29% 29% 33%
Determining the right pricing for our products and services 27% 28% 17%
Finding the right distribution channels for our products and services 26% 25% 19%
Finding, recruiting, and retaining skilled sales and marketing employees 24% 22% 37%
Determining the right product and service mix 22% 23% 12%
Integrating or improving marketing automation 20% 22% 17%
Leveraging analytics 18% 17% 27%
Other 2% 2% 2%
Base: Respondents who allocated a score of 0 to 6 to sales and marketing functions. Those who preferred not to answer were excluded from the calculation
base. Numbers in red and in green highlight statistically significant differences between firms with revenues of $2 million or less and those with revenues
above $2 million.
51
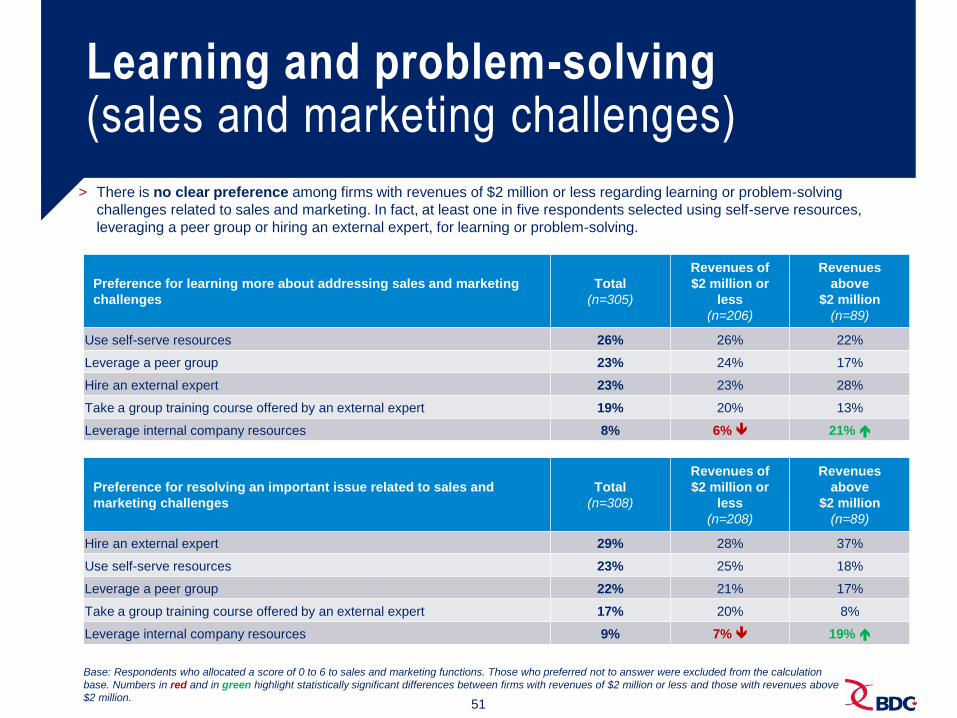
Learning and problem-solving (sales and marketing challenges)
Preference for learning more about addressing sales and marketing
challenges
Total
(n=305)
Revenues of
$2 million or
less
(n=206)
Revenues
above
$2 million
(n=89)
Use self-serve resources 26% 26% 22%
Leverage a peer group 23% 24% 17%
Hire an external expert 23% 23% 28%
Take a group training course offered by an external expert 19% 20% 13%
Leverage internal company resources 8% 6% 21%
Preference for resolving an important issue related to sales and
marketing challenges
Total
(n=308)
Revenues of
$2 million or
less
(n=208)
Revenues
above
$2 million
(n=89)
Hire an external expert 29% 28% 37%
Use self-serve resources 23% 25% 18%
Leverage a peer group 22% 21% 17%
Take a group training course offered by an external expert 17% 20% 8%
Leverage internal company resources 9% 7% 19%
> There is no clear preference among firms with revenues of $2 million or less regarding learning or problem-solving
challenges related to sales and marketing. In fact, at least one in five respondents selected using self-serve resources,
leveraging a peer group or hiring an external expert, for learning or problem-solving.
Base: Respondents who allocated a score of 0 to 6 to sales and marketing functions. Those who preferred not to answer were excluded from the calculation
base. Numbers in red and in green highlight statistically significant differences between firms with revenues of $2 million or less and those with revenues above
$2 million.
52
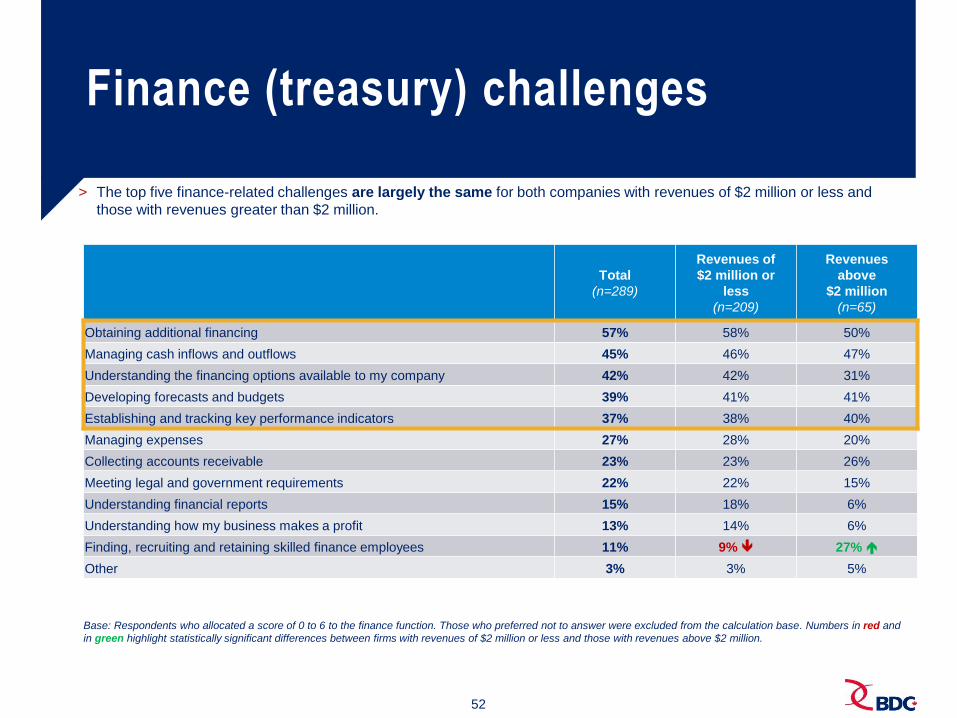
Finance (treasury) challenges
Total
(n=289)
Revenues of
$2 million or
less
(n=209)
Revenues
above
$2 million
(n=65)
Obtaining additional financing 57% 58% 50%
Managing cash inflows and outflows 45% 46% 47%
Understanding the financing options available to my company 42% 42% 31%
Developing forecasts and budgets 39% 41% 41%
Establishing and tracking key performance indicators 37% 38% 40%
Managing expenses 27% 28% 20%
Collecting accounts receivable 23% 23% 26%
Meeting legal and government requirements 22% 22% 15%
Understanding financial reports 15% 18% 6%
Understanding how my business makes a profit 13% 14% 6%
Finding, recruiting and retaining skilled finance employees 11% 9% 27%
Other 3% 3% 5%
Base: Respondents who allocated a score of 0 to 6 to the finance function. Those who preferred not to answer were excluded from the calculation base. Numbers in red and
in green highlight statistically significant differences between firms with revenues of $2 million or less and those with revenues above $2 million.
> The top five finance-related challenges are largely the same for both companies with revenues of $2 million or less and
those with revenues greater than $2 million.

53
Learning and problem-solving (finance challenges)
Preference for learning more about addressing finance challenges Total
(n=271)
Revenues of
$2 million or
less
(n=199)
Revenues
above
$2 million
(n=58)
Use self-serve resources 34% 33% 36%
Leverage a peer group 21% 23% 17%
Hire an external expert 20% 19% 30%
Take a group training course offered by an external expert 18% 19% 10%
Leverage internal company resources 7% 6% 8%
Preference for resolving an important issue related to finance
challenges
Total
(n=276)
Revenues of
$2 million or
less
(n=204)
Revenues
above
$2 million
(n=58)
Use self-serve resources 30% 26% 41%
Hire an external expert 29% 32% 26%
Leverage a peer group 20% 22% 13%
Take a group training course offered by an external expert 13% 14% 15%
Leverage internal company resources 7% 7% 6%
> Although total results indicate a slight preference for using self-serve resources to learn about and resolve issues related to
finance, one-third of firms with revenues of $2 million or less (32%) prefer hiring an external expert to resolve an important
finance-related issue.
Base: Respondents who allocated a score of 0 to 6 to the finance function. Those who
preferred not to answer were excluded from the calculation base.

54
Human resources challenges
Total
(n=327)
Revenues of
$2 million or
less
(n=203)
Revenues
above
$2 million
(n=113)
Recruiting employees 51% 49% 58%
Establishing the right compensation mix 40% 39% 47%
Improving employee engagement 38% 36% 46%
Improving the hiring process 33% 30% 44%
Evaluating employee performance 33% 33% 36%
Improving the skillsets of the workforce 28% 27% 33%
Creating growth opportunities for key employees 28% 27% 31%
Finding, recruiting and retaining skilled human resources employees 20% 20% 15%
Developing a succession plan for all key positions 20% 15% 35%
Improving two-way communications with employees 19% 17% 27%
Providing or improving an employee benefits program 18% 19% 17%
Retaining employees 17% 16% 21%
Developing workplace policies 17% 18% 14%
Implementing a formal organizational structure 15% 17% 12%
Mitigating generational differences 11% 9% 18%
Addressing labour and union issues 4% 3% 4%
Maintaining a safe work environment 3% 3% 5%
Other 6% 7% 4%
Base: Respondents who allocated a score of 0 to 6 to the HR function. Those who preferred not to answer were excluded from the calculation base. Numbers in red and in
green highlight statistically significant differences between firms with revenues of $2 million or less and those with revenues above $2 million.

55
Learning and problem-solving (HR challenges)
Preference for learning more about addressing HR challenges Total
(n=310)
Revenues of
$2 million or
less
(n=193)
Revenues
above
$2 million
(n=107)
Use self-serve resources 32% 33% 24%
Leverage a peer group 29% 31% 24%
Take a group training course offered by an external expert 16% 15% 21%
Hire an external expert 15% 15% 18%
Leverage internal company resources 8% 6% 13%
Preference for resolving an important issue related to HR challenges Total
(n=316)
Revenues of
$2 million or
less
(n=195)
Revenues
above
$2 million
(n=111)
Use self-serve resources 30% 31% 26%
Leverage a peer group 25% 28% 17%
Hire an external expert 20% 21% 20%
Leverage internal company resources 15% 11% 27%
Take a group training course offered by an external expert 11% 10% 10%
> Firms with revenues of $2 million or less prefer to learn more about addressing and resolving human resources challenges
by using self-serve resources or leveraging a peer group.
Base: Respondents who allocated a score of 0 to 6 to the HR function. Those who preferred not to answer were excluded from the calculation base. Numbers
in red and in green highlight statistically significant differences between firms with revenues of $2 million or less and those with revenues above $2 million.
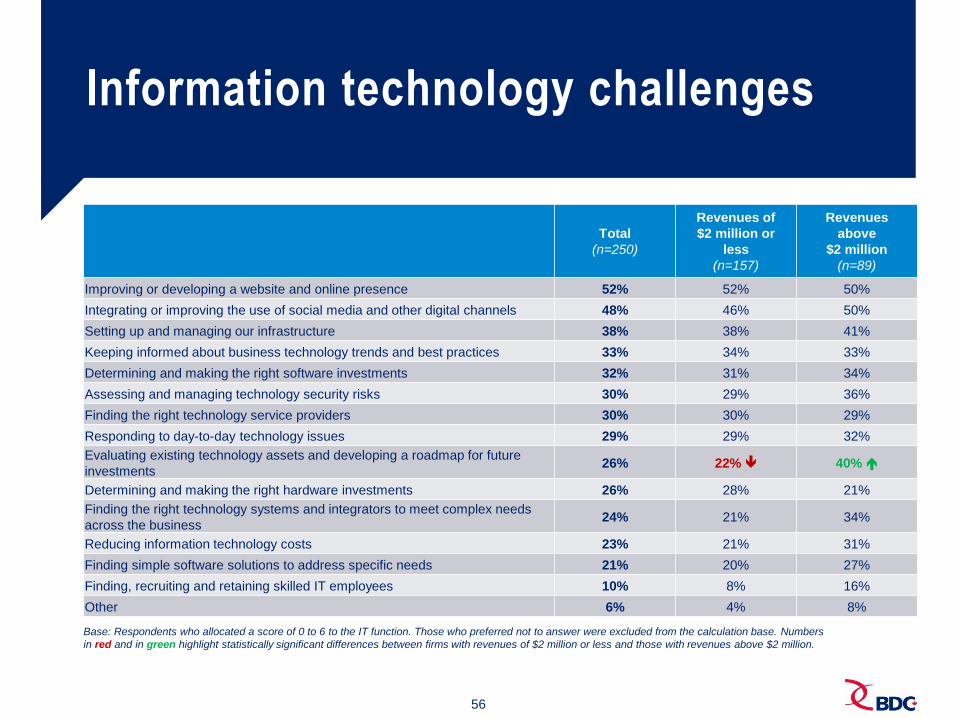
56
Information technology challenges
Total
(n=250)
Revenues of
$2 million or
less
(n=157)
Revenues
above
$2 million
(n=89)
Improving or developing a website and online presence 52% 52% 50%
Integrating or improving the use of social media and other digital channels 48% 46% 50%
Setting up and managing our infrastructure 38% 38% 41%
Keeping informed about business technology trends and best practices 33% 34% 33%
Determining and making the right software investments 32% 31% 34%
Assessing and managing technology security risks 30% 29% 36%
Finding the right technology service providers 30% 30% 29%
Responding to day-to-day technology issues 29% 29% 32%
Evaluating existing technology assets and developing a roadmap for future
investments 26% 22% 40%
Determining and making the right hardware investments 26% 28% 21%
Finding the right technology systems and integrators to meet complex needs
across the business 24% 21% 34%
Reducing information technology costs 23% 21% 31%
Finding simple software solutions to address specific needs 21% 20% 27%
Finding, recruiting and retaining skilled IT employees 10% 8% 16%
Other 6% 4% 8%
Base: Respondents who allocated a score of 0 to 6 to the IT function. Those who preferred not to answer were excluded from the calculation base. Numbers
in red and in green highlight statistically significant differences between firms with revenues of $2 million or less and those with revenues above $2 million.
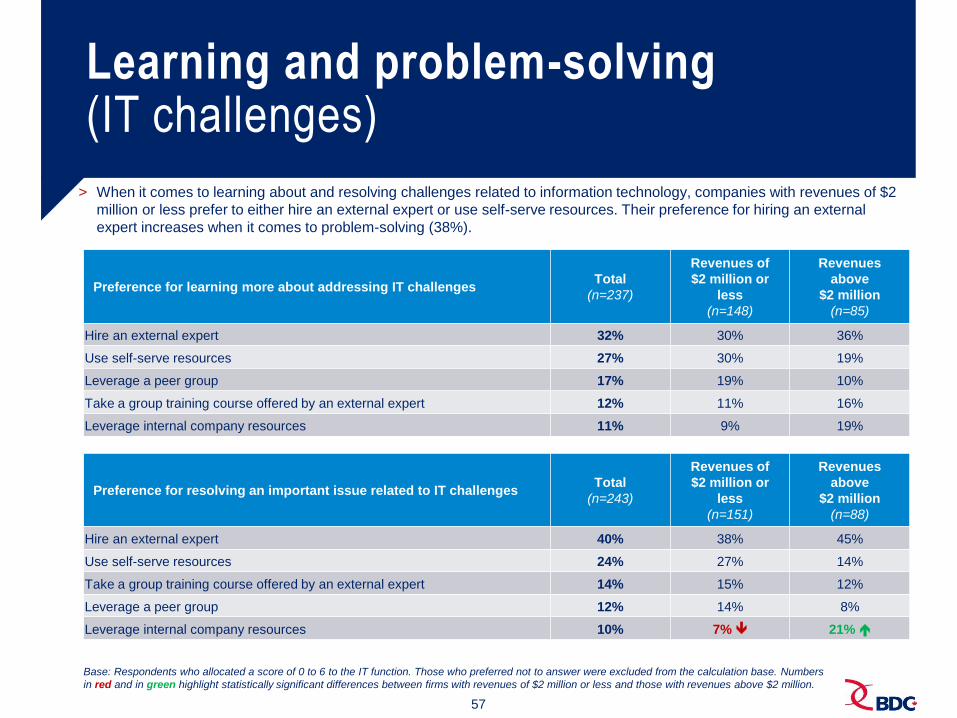
57
Learning and problem-solving (IT challenges)
Preference for learning more about addressing IT challenges Total
(n=237)
Revenues of
$2 million or
less
(n=148)
Revenues
above
$2 million
(n=85)
Hire an external expert 32% 30% 36%
Use self-serve resources 27% 30% 19%
Leverage a peer group 17% 19% 10%
Take a group training course offered by an external expert 12% 11% 16%
Leverage internal company resources 11% 9% 19%
Preference for resolving an important issue related to IT challenges Total
(n=243)
Revenues of
$2 million or
less
(n=151)
Revenues
above
$2 million
(n=88)
Hire an external expert 40% 38% 45%
Use self-serve resources 24% 27% 14%
Take a group training course offered by an external expert 14% 15% 12%
Leverage a peer group 12% 14% 8%
Leverage internal company resources 10% 7% 21%
> When it comes to learning about and resolving challenges related to information technology, companies with revenues of $2
million or less prefer to either hire an external expert or use self-serve resources. Their preference for hiring an external
expert increases when it comes to problem-solving (38%).
Base: Respondents who allocated a score of 0 to 6 to the IT function. Those who preferred not to answer were excluded from the calculation base. Numbers
in red and in green highlight statistically significant differences between firms with revenues of $2 million or less and those with revenues above $2 million.
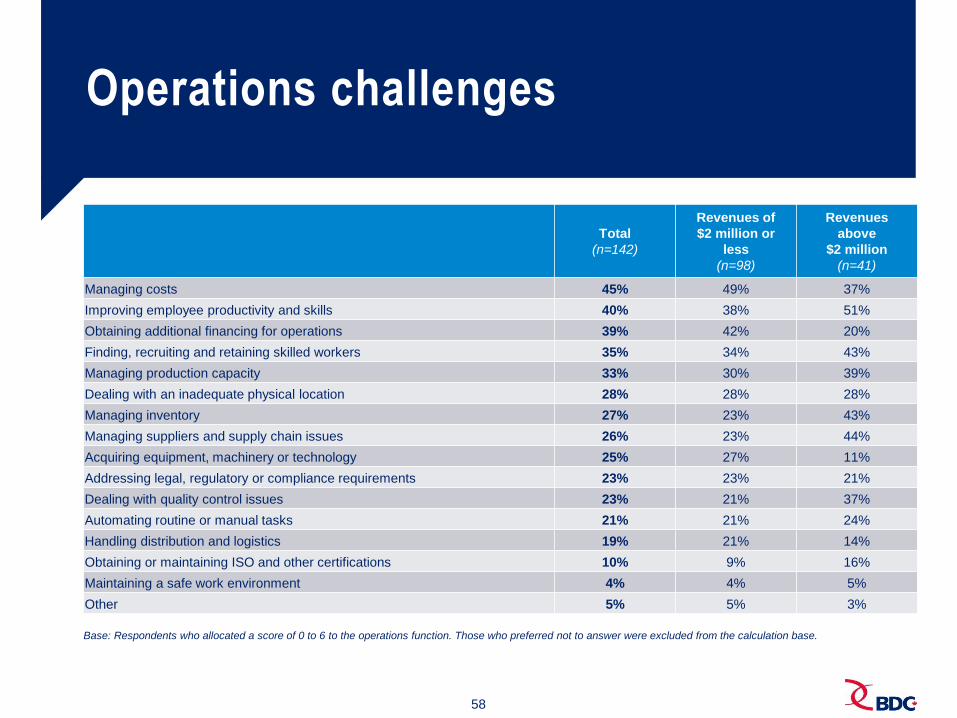
58
Operations challenges
Total
(n=142)
Revenues of
$2 million or
less
(n=98)
Revenues
above
$2 million
(n=41)
Managing costs 45% 49% 37%
Improving employee productivity and skills 40% 38% 51%
Obtaining additional financing for operations 39% 42% 20%
Finding, recruiting and retaining skilled workers 35% 34% 43%
Managing production capacity 33% 30% 39%
Dealing with an inadequate physical location 28% 28% 28%
Managing inventory 27% 23% 43%
Managing suppliers and supply chain issues 26% 23% 44%
Acquiring equipment, machinery or technology 25% 27% 11%
Addressing legal, regulatory or compliance requirements 23% 23% 21%
Dealing with quality control issues 23% 21% 37%
Automating routine or manual tasks 21% 21% 24%
Handling distribution and logistics 19% 21% 14%
Obtaining or maintaining ISO and other certifications 10% 9% 16%
Maintaining a safe work environment 4% 4% 5%
Other 5% 5% 3%
Base: Respondents who allocated a score of 0 to 6 to the operations function. Those who preferred not to answer were excluded from the calculation base.

59
Learning and problem-solving (operations challenges)
Preference for learning more about addressing operations challenges Total
(n=136)
Revenues of
$2 million or
less
(n=93)
Revenues
above
$2 million
(n=40)
Use self-serve resources 28% 31% 18%
Leverage a peer group 24% 26% 19%
Hire an external expert 18% 16% 25%
Take a group training course offered by an external expert 18% 16% 20%
Leverage internal company resources 12% 11% 18%
Preference for resolving an important issue related to operations
challenges
Total
(n=138)
Revenues of
$2 million or
less
(n=96)
Revenues
above
$2 million
(n=39)
Leverage a peer group 25% 28% 16%
Hire an external expert 22% 21% 25%
Use self-serve resources 20% 20% 15%
Leverage internal company resources 17% 17% 22%
Take a group training course offered by an external expert 15% 13% 23%
> Respondents in firms with revenues of $2 million or less prefer using self-serve resources (31%) or leveraging a peer group
(26%) to learn more about addressing operations challenges. This contrasts with respondents in companies with revenues
greater than $2 million, who tend to prefer to hiring an external expert (25%) or taking a group training course (20%).
> To resolve operations issues, firms with revenues of $2 million or less have a slight preference for leveraging a peer group
(28%).
Base: Respondents who allocated a score of 0 to 6 to the operations function. Those who
preferred not to answer were excluded from the calculation base.

60
Management challenges
Total
(n=140)
Revenues of
$2 million or
less
(n=91)
Revenues
above
$2 million
(n=45)
Making time for long-term planning while managing day-to-day activities 41% 45% 31%
Evaluating growth opportunities (e.g., expansion, mergers and acquisitions) 38% 42% 23%
Creating and updating the business plan and model 34% 35% 31%
Improving managerial skills and capabilities 32% 34% 31%
Developing better networks, alliances and partnerships 30% 35% 14%
Dealing with owners’ time constraints 29% 32% 24%
Clarifying the strategic orientation of the company 29% 27% 33%
Determining the value of the company 28% 33% 12%
Fostering innovation and continuous improvement 25% 22% 33%
Measuring company performance 25% 23% 27%
Improving decision-making processes 24% 22% 35%
Increasing communication and collaboration among leaders 22% 16% 44%
Carrying out succession planning (change of ownership) 21% 20% 23%
Developing a succession plan for all key positions 14% 13% 17%
Establishing an emergency and disaster continuity plan 13% 12% 12%
Creating and maximizing the expertise of an advisory board and/or board of
directors 8% 9% 5%
Finding, recruiting and retaining skilled managers 7% 5% 14%
Other 4% 5% 4%
Base: Respondents who allocated a score of 0 to 6 to the management function. Those who preferred not to answer were excluded from the calculation base.
Numbers in red and in green highlight statistically significant differences between firms with revenues of $2 million or less and those with revenues above $2
million.

61
Learning and problem-solving (management challenges)
Preference for learning more about addressing management
challenges
Total
(n=134)
Revenues of
$2 million or
less
(n=89)
Revenues
above
$2 million
(n=42)
Leverage a peer group 26% 28% 22%
Use self-serve resources 25% 28% 8%
Take a group training course offered by an external expert 22% 21% 28%
Hire an external expert 20% 17% 34%
Leverage internal company resources 8% 7% 8%
Preference for resolving an important issue related to management
challenges
Total
(n=135)
Revenues of
$2 million or
less
(n=88)
Revenues
above
$2 million
(n=43)
Leverage a peer group 28% 30% 26%
Hire an external expert 23% 23% 27%
Use self-serve resources 23% 25% 10%
Leverage internal company resources 10% 7% 16%
Take a group training course offered by an external expert 15% 15% 20%
> Respondents in firms with revenues of $2 million or less prefer leveraging a peer group (28%) or using self-serve resources
(28%) to learn more about addressing management challenges. They also prefer leveraging a peer group (30%) to resolve
management issues.
> Firms with higher revenues prefer to hire an external expert to learn about and resolve management challenges and issues.
Base: Respondents who allocated a score of 0 to 6 to the management function. Those
who preferred not to answer were excluded from the calculation base.
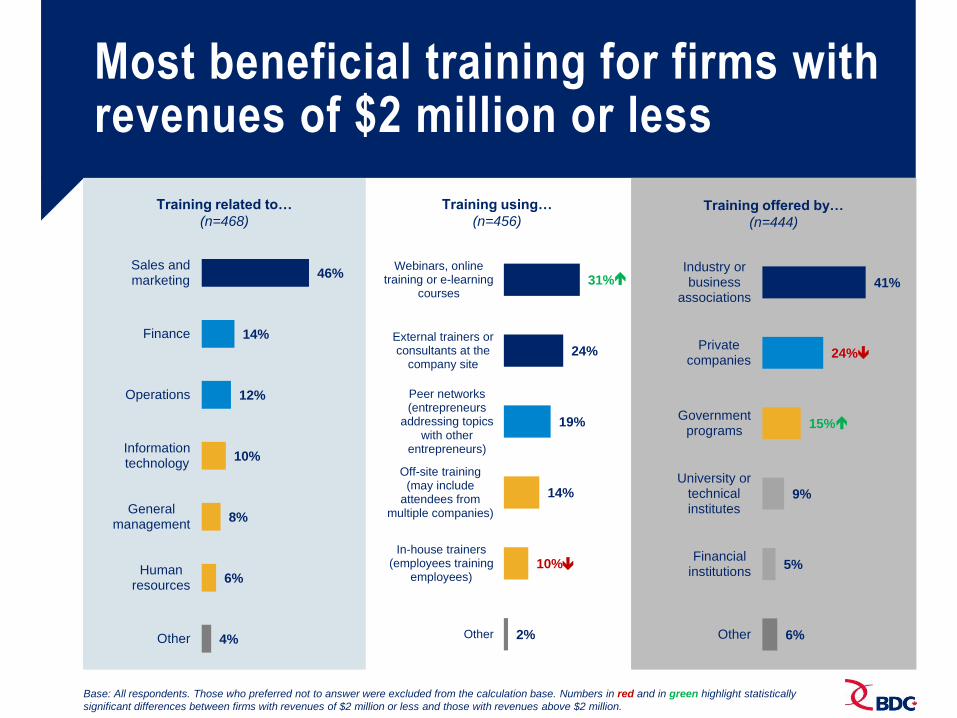
62
Most beneficial training for firms with revenues of $2 million or less
Training related to…
(n=468)
46%
14%
12%
10%
8%
6%
4%
Sales andmarketing
Finance
Operations
Informationtechnology
Generalmanagement
Humanresources
Other
Training using…
(n=456)
31%
24%
19%
14%
10%
2%
Webinars, onlinetraining or e-learning
courses
External trainers orconsultants at the
company site
Peer networks(entrepreneurs
addressing topicswith other
entrepreneurs)
Off-site training(may include
attendees frommultiple companies)
In-house trainers(employees training
employees)
Other
41%
24%
15%
9%
5%
6%
Industry orbusiness
associations
Privatecompanies
Governmentprograms
University ortechnicalinstitutes
Financialinstitutions
Other
Training offered by…
(n=444)
Base: All respondents. Those who preferred not to answer were excluded from the calculation base. Numbers in red and in green highlight statistically
significant differences between firms with revenues of $2 million or less and those with revenues above $2 million.
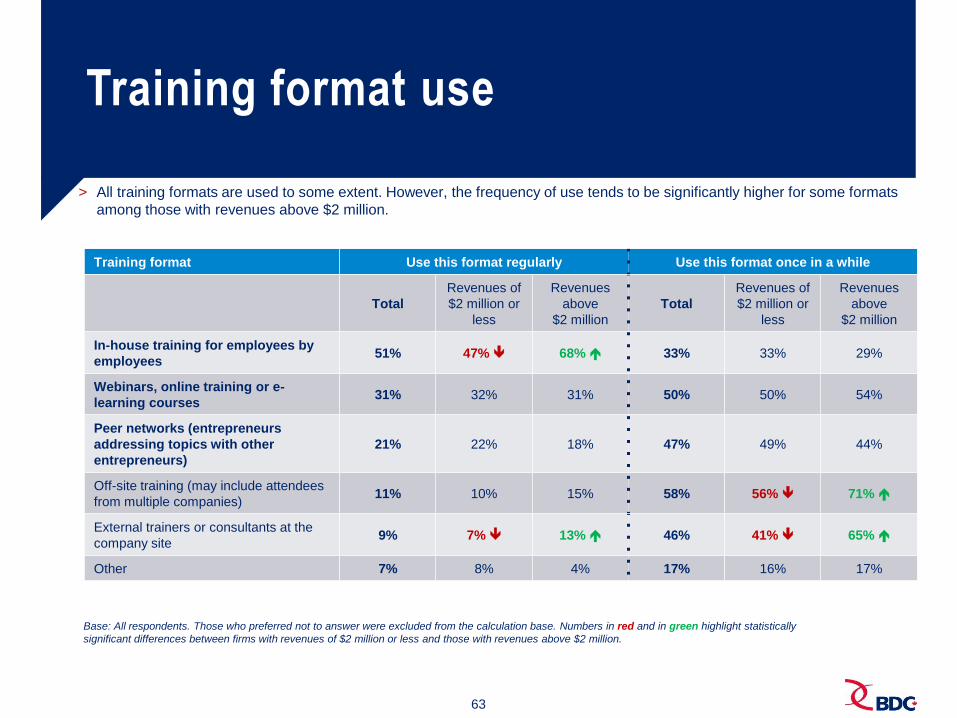
63
Training format use
Training format Use this format regularly Use this format once in a while
Total
Revenues of
$2 million or
less
Revenues
above
$2 million
Total
Revenues of
$2 million or
less
Revenues
above
$2 million
In-house training for employees by
employees 51% 47% 68% 33% 33% 29%
Webinars, online training or e-
learning courses 31% 32% 31% 50% 50% 54%
Peer networks (entrepreneurs
addressing topics with other
entrepreneurs)
21% 22% 18% 47% 49% 44%
Off-site training (may include attendees
from multiple companies) 11% 10% 15% 58% 56% 71%
External trainers or consultants at the
company site 9% 7% 13% 46% 41% 65%
Other 7% 8% 4% 17% 16% 17%
> All training formats are used to some extent. However, the frequency of use tends to be significantly higher for some formats
among those with revenues above $2 million.
Base: All respondents. Those who preferred not to answer were excluded from the calculation base. Numbers in red and in green highlight statistically
significant differences between firms with revenues of $2 million or less and those with revenues above $2 million.

64
Content format use
Content format Use this format regularly Use this format once in a while
Total
(n=760)
Revenues of
$2 million or
less
(n=480)
Revenues
above
$2 million
(n=250)
Total
(n=760)
Revenues of
$2 million or
less
(n=480)
Revenues
above
$2 million
(n=250)
Document templates (business plan,
cash flow spreadsheets) 42% 41% 47% 31% 32% 31%
Internal training (employees training
other employees) 41% 35% 61% 28% 28% 30%
Infographics, short texts and articles 32% 35% 27% 31% 31% 32%
Networking events and peer learning 28% 29% 27% 37% 36% 39%
White papers, reports and eBooks 25% 26% 20% 29% 28% 31%
Mentoring 24% 22% 32% 28% 31% 22%
Webinars 23% 24% 23% 35% 34% 39%
Podcasts and short videos 17% 18% 14% 33% 35% 31%
Diagnostic tools and assessments 16% 14% 19% 29% 28% 33%
External training (sending employees to
training courses) 15% 12% 25% 35% 33% 43%
Business coaching 15% 14% 17% 22% 20% 25%
E-learning or massive open online
courses (MOOCs) 14% 15% 12% 22% 23% 18%
One-on-one consulting services 12% 13% 12% 25% 24% 27%
Web-based business networking and
discussion groups 12% 13% 11% 23% 23% 21%

65
Training supplier use
Training supplier Use this format regularly Use this format once in a while
Total
Revenues of
$2 million or
less
Revenues
above
$2 million
Total
Revenues of
$2 million or
less
Revenues
above
$2 million
Industry or business associations 27% 26% 31% 59% 60% 57%
Private companies 21% 20% 26% 50% 48% 58%
Government programs 11% 11% 9% 48% 49% 49%
University or technical institutes 9% 9% 10% 42% 42% 41%
Financial institutions 3% 2% 3% 41% 39% 48%
Other 4% 4% 2% 10% 10% 9%
> The frequencies with which firms with lower revenues and those with higher revenues use various types of training suppliers
are quite similar. Although the difference is not statistically significant, higher revenue firms use private companies more
frequently than lower revenue firms do.
Note: respondents who preferred not to answer were excluded from the calculation base. Totals may not equal 100% due to rounding.
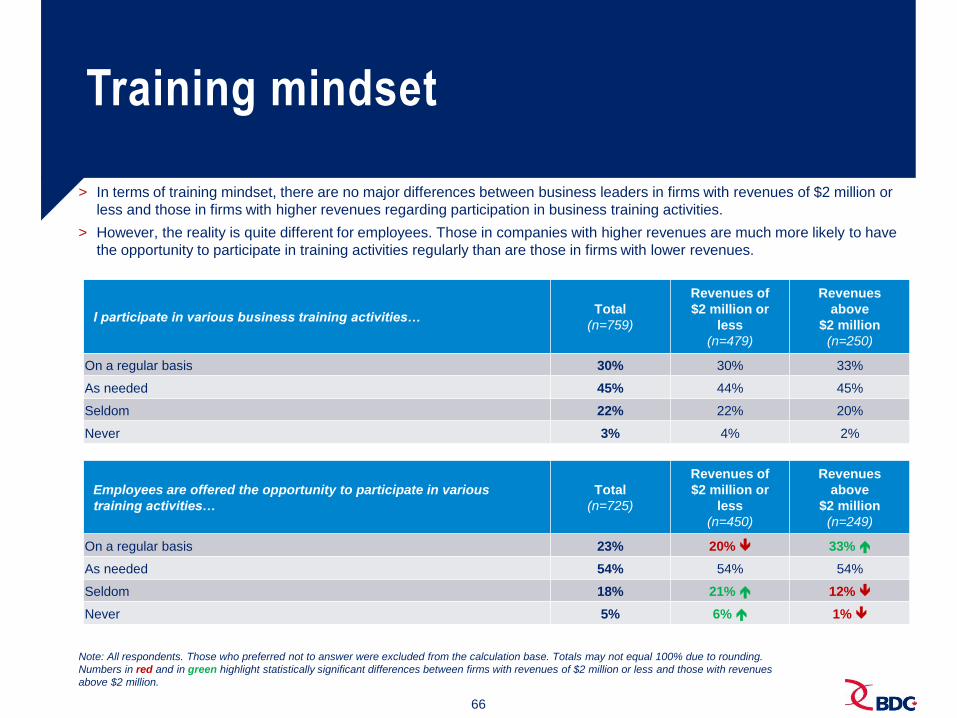
66
Training mindset
I participate in various business training activities… Total
(n=759)
Revenues of
$2 million or
less
(n=479)
Revenues
above
$2 million
(n=250)
On a regular basis 30% 30% 33%
As needed 45% 44% 45%
Seldom 22% 22% 20%
Never 3% 4% 2%
Employees are offered the opportunity to participate in various
training activities…
Total
(n=725)
Revenues of
$2 million or
less
(n=450)
Revenues
above
$2 million
(n=249)
On a regular basis 23% 20% 33%
As needed 54% 54% 54%
Seldom 18% 21% 12%
Never 5% 6% 1%
> In terms of training mindset, there are no major differences between business leaders in firms with revenues of $2 million or
less and those in firms with higher revenues regarding participation in business training activities.
> However, the reality is quite different for employees. Those in companies with higher revenues are much more likely to have
the opportunity to participate in training activities regularly than are those in firms with lower revenues.
Note: All respondents. Those who preferred not to answer were excluded from the calculation base. Totals may not equal 100% due to rounding.
Numbers in red and in green highlight statistically significant differences between firms with revenues of $2 million or less and those with revenues
above $2 million.

67
Continuous improvement
Importance of continuous improvement Total
(n=721)
Revenues of
$2 million or
less
(n=469)
Revenues
above
$2 million
(n=223)
Very important (9 to 10 out of 10) 60% 60% 59%
Important (7 to 8 out of 10) 32% 31% 36%
Neutral (5 to 6 out of 10) 7% 7% 4%
Not important (0 to 4 out of 10) 2% 3% 1%
Average score 8.58 8.55 8.63
> Continuous improvement is equally important to business leaders in firms with revenues of $2 million or less and to business
leaders in firms with revenues above $2 million.
Note: All respondents. Those who preferred not to answer were excluded from the calculation base. Totals may not equal 100% due to rounding.
