smartphone applications (apps) for heart rate measurement in children: comparison with...
TRANSCRIPT
ORIGINAL ARTICLE
Smartphone Applications (Apps) for Heart Rate Measurementin Children: Comparison with Electrocardiography Monitor
Chi-Lin Ho • Yun-Ching Fu • Ming-Chih Lin •
Sheng-Ching Chan • Betau Hwang •
Sheng-Ling Jan
Received: 6 August 2013 / Accepted: 6 November 2013
� Springer Science+Business Media New York 2013
Abstract Heart rate (HR) measurement is essential for
children with abnormal heart beats. The purpose of this
study was to determine whether HR measurement by
smartphone applications (apps) could be a feasible alter-
native to an electrocardiography (ECG) monitor. A total of
40 children, median age of 4.3 years, were studied. Using
four free smartphone apps, pulse rates were measured at the
finger (or toe) and earlobe, and compared with baseline
HRs measured by ECG monitors. Significant correlations
between measured pulse rates and baseline HRs were
found. Both correlation and accuracy rate were higher in
the earlobe group than the finger/toe group. When HR was
\120 beats per min (bpm), the accuracy rates were not
different between the two different measuring sites for each
app (median of 65 vs 76 %). The accuracy rates in the
finger/toe group were significantly lower than those in the
earlobe group for all apps when HR was C120 bpm (27 vs
65 %). There were differences among apps in their abilities
to measure pulse rates. Taking children’s pulse rate from
the earlobe would be more accurate, especially for tachy-
cardia. However, we do not recommend that smartphone
apps should not be used for routine medical use or used as
the sole form of HR measurement because the results of
their accuracy are not good enough.
Keywords Children � Electrocardiography monitor �Heart rate � Pulse rate � Smartphone apps
Introduction
Due to the difficulty in identifying heartbeat abnormalities in
children, monitoring heart rate (HR) is important, particularly
in children with palpitations or tachycardia, which may occur
at home or outside the hospital [12]. Monitoring HR outside
the clinical setting is also necessary for children at risk of
developing bradycardia in the event of permanent pacemaker
dysfunction [2], or tachycardia in early-stage severe entero-
virus 71 infection [4]. However, palpating the pulses or lis-
tening to heart sounds may be challenging for caregivers who
are not trained in these medical skills. Currently, pediatric
patients may have to travel a considerable distance to visit a
clinic or hospital for uncertainty of arrhythmia attack.
Therefore, there is an urgent need for a convenient modality
which would allow parents or caregivers to accurately mea-
sure HR in children outside the clinical setting.
Nowadays, many free software applications (apps) that
utilize the processing capabilities of smartphones are
available which allow users to obtain their HR. These free
HR apps allow users to determine their heartbeats per min
(bpm) within seconds, and they are designed for self-use.
The user needs to put the tip of the finger on the camera
C.-L. Ho � Y.-C. Fu � M.-C. Lin � S.-L. Jan (&)
Department of Pediatrics, Taichung Veterans General Hospital,
160, Sec. 3, Chung-Kang Road, Taichung 40705, Taiwan
e-mail: [email protected]
C.-L. Ho
Department of Pediatrics, Chang Bing Show Chwan Memorial
Hospital, Changhua County, Taiwan
Y.-C. Fu � M.-C. Lin � S.-L. Jan
Institute of Clinical Medicine, School of Medicine, National
Yang-Ming University, Taipei, Taiwan
S.-C. Chan
Department of Nursing, Ta-Jen University, Pingtung County,
Taiwan
B. Hwang
Department of Pediatrics, Zhongxiao Branch, Taipei City
Hospital, Taipei, Taiwan
123
Pediatr Cardiol
DOI 10.1007/s00246-013-0844-8
lens and the light emitting diode (LED) flashlight simul-
taneously. The apps then record the changes in light and
shadow accompanying the arterial pulsation and process
these to obtain the pulse rates. These smartphone apps are
not intended for medical use and to date no research has
been conducted to determine their accuracy for use in
children [3]. The purpose of this study was to determine the
accuracy of a selection of smartphone apps for HR mea-
surement in children with a view to assessing their feasi-
bility for use as an alternative to an electrocardiography
(ECG) monitor.
Methods
A prospective study of children who underwent ECG
monitoring at Taichung Veterans General Hospital
(TCVGH) between September 2012 and March 2013 was
conducted. The study was approved by the hospital’s
Institutional Review Board [IRB TCVGH No. CF13009].
Patients who were premature babies (whose fingers or toes
were too small to cover the camera and LED of the
smartphone simultaneously), older than 18 years of age, in
a critical condition with unstable vital signs or could not
obtain written informed consent were excluded. The
patients’ demographic data and vital signs were collected.
The device we used in this study was the iPhone 4S (Apple
Inc., CA, USA). Using the keyword ‘heart rate’, five free
apps for measuring HR in the order of search results were
downloaded from the App Store and used to measure the
pulse rates at the patient’s finger (or toe) and earlobe. ECG
monitors were connected to the patient’s chest wall with
leads. If the patient’s index finger was too small to cover
the camera lens and the flashlight simultaneously, the big
toe was used instead. Pulse rate was measured three times
at each site and for no more than 20 s each time. The room
temperature was in the range of 20 �C (68 �F) to 25 �C
(77 �F). Because it was difficult for some children to
cooperate and stay sufficiently still during HR measure-
ments, we decided to take the pulse rate for no more than
20 s in this study.
When the pulse rate showed on the smartphone’s screen
consistently, we stopped the timer and recorded the HR
displayed on the ECG monitor and the pulse rate on the
smartphone simultaneously. The mean values of the pulse
rates measured by the apps, the HRs on the ECG monitors,
and the durations of the measurements were recorded. The
definition of accuracy was (1) when HR was B100 bpm the
difference was within 5 bpm, or (2) when HR was
[100 bpm the difference was within 5 % of heartbeats, by
referring to the specifications of bedside monitor (The
Philips SureSigns VM8). According to the definition of
accuracy, patients were divided into two groups: accurate
and inaccurate (including pulse rates that could not be
measured), and statistical analyses were performed.
Patients were also divided into two groups according to the
HR (\120 and C120 bpm) to determine the feasibility of
using these apps to measure tachycardia outside the
hospital.
Statistical Analysis
Categorical variables were summarized as frequencies with
percentages, and continuous variables as mean ± standard
deviation. PASW statistics 18.0 for Windows (SPSS Inc.,
Chicago, IL, USA) was used for the statistical analyses.
The paired t test was used to compare the pulse rates
measured by the apps and the HRs measured by the ECG
monitor. Pearson’s correlation and linear regression ana-
lysis were performed and the scatter plots were drawn.
Independent samples t test was used to determine signifi-
cant variables. Chi squared test was used to compare the
percentage accuracy of the HR measurement between dif-
ferent groups. A pvalue of 0.05 was used for hypothesis
testing.
Results
A total of 126 patients who were admitted to pediatric and
neonatal intensive care units in our hospital (TCVGH) and
underwent ECG monitoring were enrolled in this study. Of
these, 40 (age range from 3 days to 15.1 years, median
4.3 years) were eligible and consented to participate in the
study. The patients’ data and vital signs are summarized in
Table 1. The diseases of these children included cardiac
Table 1 Demographic data and vital signs of patients
Mean ± SD Range
Gender 26M/14F
Age 5.7 ± 5.4 3 days–
15.1 years
Body weight (kg) 23.1 ± 19.9 3.0–72.0
Body length (cm) 104.7 ± 40.6 48–170
Body temperature (�C) 36.6 ± 0.7 35.2–39.2
Respiratory rate (breaths/min) 34 ± 16 14–95
Systolic blood pressure (mmHg) 106 ± 24 58–162
Diastolic blood pressure (mmHg) 59 ± 15 25–92
Pulse pressure (mmHg) 47 ± 13 20–80
SpO2 (%) 97 ± 6 62–100
Capillary refill time (s) 1.3 ± 0.7 1–4
Baseline heart rate (bpm) 112 ± 23 52–158
bpm beats per min, F females, M males, SpO2 oxygen saturation
measured by pulse oximeter
Pediatr Cardiol
123
diseases (bradycardia in one child, carditis in two, cyanotic
congenital heart diseases in three, non-cyanotic congenital
heart diseases in four, idiopathic pulmonary arterial
hypertension in one), infections (pneumonia in four chil-
dren, severe enterovirus 71 infection in two), neurologic
diseases (brain tumor in two children, cerebrovascular
accident in one, encephalopathy or encephalitis in six,
epilepsy in three, head injury in one), newborns with
abdominal tumor in one child, neonatal jaundice in two,
neonatal infection in one, prematurity in one, respiratory
distress in one, and others (malignancy in one child,
nephritis in two, pancreatitis in one). One of the smart-
phone apps crashed frequently and needed to be removed
and re-downloaded from the App store numerous times. At
some point, the app was removed from the store so research
on this app was discontinued. The other four apps were
named apps A through D. Because of copyright issues, we
do not provide the full name of the apps and the devel-
opers. We substituted some letters by ‘x’, and the apps used
in this study were listed as the follows:
App A—Cardioxxxxx (MaxxxPinxx Lxx)
App B—Hexxx Rxxx Moxxxx (Jxxx Lxx)
App C—Hexxx Rxxx – Frxx (Cxx Resxxxxx)
App D—Inxxxxx Hexxx Rxxx (Azxxxx Ixx).
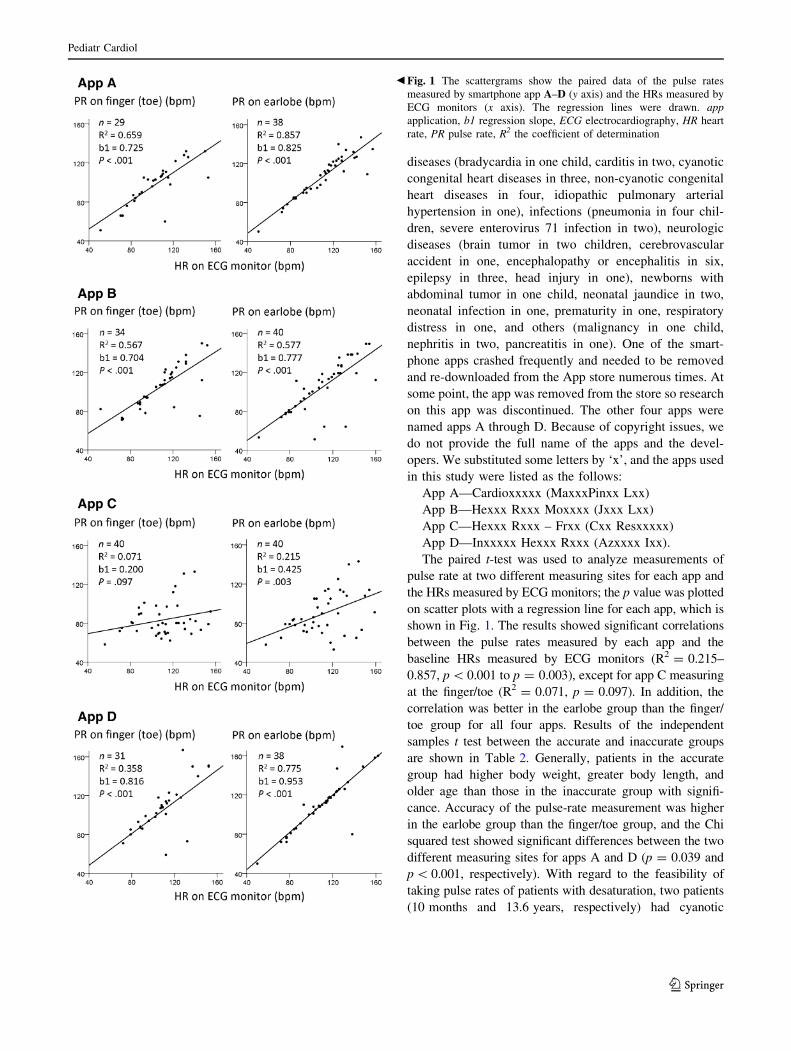
The paired t-test was used to analyze measurements of
pulse rate at two different measuring sites for each app and
the HRs measured by ECG monitors; the p value was plotted
on scatter plots with a regression line for each app, which is
shown in Fig. 1. The results showed significant correlations
between the pulse rates measured by each app and the
baseline HRs measured by ECG monitors (R2 = 0.215–
0.857, p \ 0.001 to p = 0.003), except for app C measuring
at the finger/toe (R2 = 0.071, p = 0.097). In addition, the
correlation was better in the earlobe group than the finger/
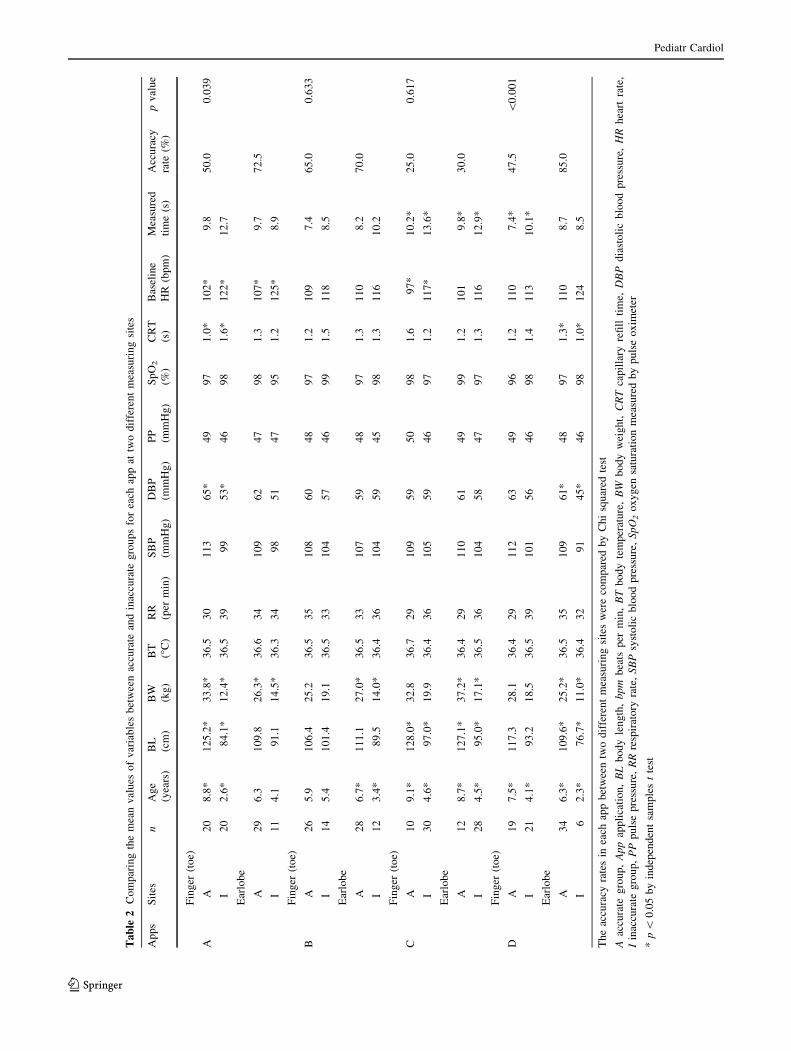
toe group for all four apps. Results of the independent
samples t test between the accurate and inaccurate groups
are shown in Table 2. Generally, patients in the accurate
group had higher body weight, greater body length, and
older age than those in the inaccurate group with signifi-
cance. Accuracy of the pulse-rate measurement was higher
in the earlobe group than the finger/toe group, and the Chi
squared test showed significant differences between the two
different measuring sites for apps A and D (p = 0.039 and
p \ 0.001, respectively). With regard to the feasibility of
taking pulse rates of patients with desaturation, two patients
(10 months and 13.6 years, respectively) had cyanotic
Fig. 1 The scattergrams show the paired data of the pulse rates
measured by smartphone app A–D (y axis) and the HRs measured by
ECG monitors (x axis). The regression lines were drawn. app
application, b1 regression slope, ECG electrocardiography, HR heart
rate, PR pulse rate, R2 the coefficient of determination
b
Pediatr Cardiol
123
Ta
ble
2C
om
par
ing
the
mea
nv
alu
eso
fv
aria
ble
sb
etw
een
accu
rate
and
inac
cura
teg
rou
ps
for
each
app
attw
od
iffe
ren
tm
easu
rin
gsi
tes
Ap
ps
Sit
esn
Ag
e
(yea
rs)
BL
(cm
)
BW
(kg
)
BT
(�C
)
RR
(per
min
)
SB
P
(mm
Hg
)
DB
P
(mm
Hg
)
PP
(mm
Hg
)
Sp
O2
(%)
CR
T
(s)
Bas
elin
e
HR
(bp
m)
Mea
sure
d
tim
e(s
)
Acc
ura
cy
rate
(%)
pv
alu
e
Fin
ger
(to
e)
AA
20
8.8
*1
25
.2*
33
.8*
36
.53
01
13
65
*4
99
71
.0*
10
2*
9.8
50
.00
.03
9
I2
02
.6*
84
.1*
12
.4*
36
.53
99
95
3*
46
98
1.6
*1
22
*1
2.7
Ear
lob
e
A2
96
.31
09
.82
6.3
*3
6.6
34
10
96
24
79
81
.31
07
*9
.77
2.5
I1
14
.19
1.1
14
.5*
36
.33
49
85
14
79
51
.21
25
*8
.9
Fin
ger
(to
e)
BA
26
5.9
10
6.4
25
.23
6.5
35
10
86
04
89
71
.21
09
7.4
65
.00
.63
3
I1
45
.41
01
.41
9.1
36
.53
31
04
57
46
99
1.5
11
88
.5
Ear
lob
e
A2
86
.7*
11
1.1
27
.0*
36
.53
31
07
59
48
97
1.3
11
08
.27
0.0
I1
23
.4*
89
.51
4.0
*3
6.4
36
10
45
94
59
81
.31
16
10
.2
Fin
ger
(to
e)
CA
10
9.1
*1
28
.0*
32
.83
6.7
29
10
95
95
09
81
.69
7*
10
.2*
25
.00
.61
7
I3
04
.6*
97
.0*
19
.93
6.4
36
10
55
94
69
71
.21
17
*1
3.6
*
Ear
lob
e
A1
28
.7*
12
7.1
*3
7.2
*3
6.4
29
11
06
14
99
91
.21
01
9.8
*3
0.0
I2
84
.5*
95
.0*
17
.1*
36
.53
61
04
58
47
97
1.3
11
61
2.9
*
Fin
ger
(to
e)
DA
19
7.5
*1
17
.32
8.1
36
.42
91
12
63
49
96
1.2
11
07
.4*
47
.5\
0.0
01
I2
14
.1*
93
.21
8.5
36
.53
91
01
56
46
98
1.4
11
31
0.1
*
Ear
lob
e
A3
46
.3*
10
9.6
*2
5.2
*3
6.5
35
10
96
1*
48
97
1.3
*1
10
8.7
85
.0
I6
2.3
*7
6.7
*1
1.0
*3
6.4
32
91
45
*4
69
81
.0*
12
48
.5
Th
eac
cura
cyra
tes
inea
chap
pb
etw
een
two
dif
fere
nt
mea
suri
ng
site
sw
ere
com
par
edb
yC
hi
squ
ared
test
Aac
cura
teg
rou
p,
Ap
pap
pli
cati
on
,B
Lb
od
yle
ng
th,
bp
mb
eats
per
min
,B
Tb
od
yte
mp
erat
ure
,B
Wb
od
yw
eig
ht,
CR
Tca
pil
lary
refi
llti
me,
DB
Pd
iast
oli
cb
loo
dp
ress
ure
,H
Rh
eart
rate
,
Iin
accu
rate
gro
up
,P
Pp
uls
ep
ress
ure
,R
Rre
spir
ato
ryra
te,
SB
Psy
sto
lic
blo
od
pre
ssu
re,
Sp
O2
ox
yg
ensa
tura
tio
nm
easu
red
by
pu
lse
ox
imet
er
*p\
0.0
5b
yin
dep
end
ent
sam
ple
st
test
Pediatr Cardiol
123
congenital heart diseases and low SpO2 (89 and 62 %,
respectively), and the accuracy of the apps in these patients
was moderately high (75 and 62.5 %, respectively).
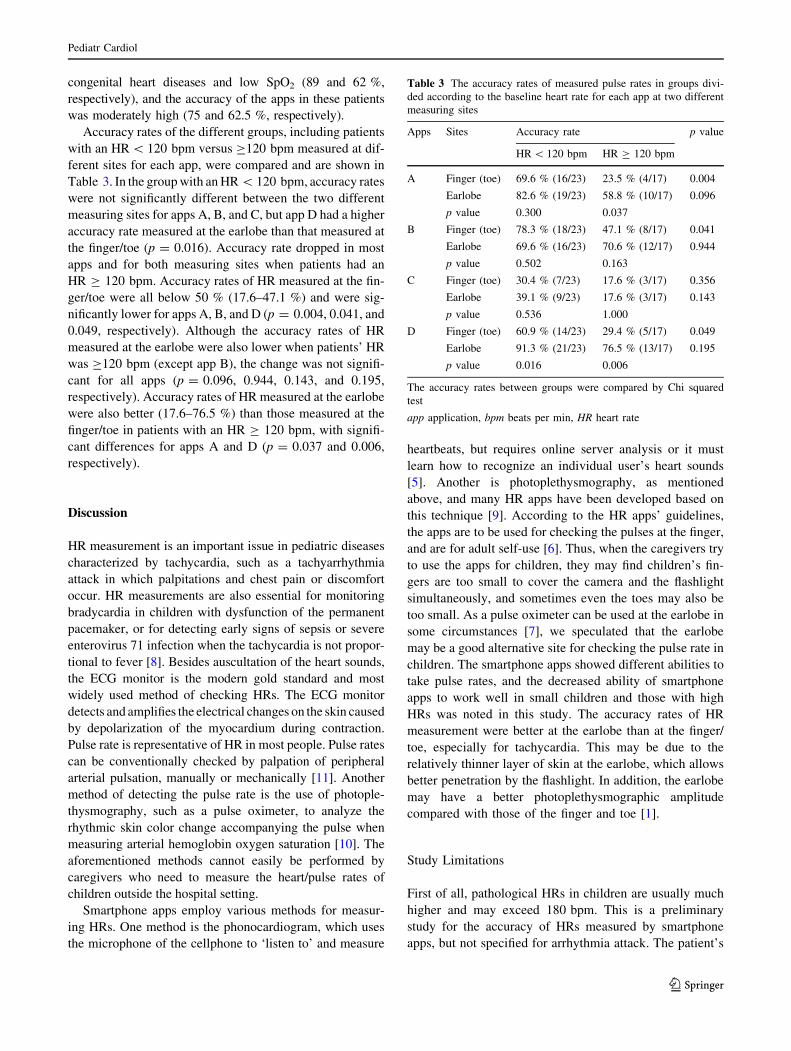
Accuracy rates of the different groups, including patients
with an HR \ 120 bpm versus C120 bpm measured at dif-
ferent sites for each app, were compared and are shown in
Table 3. In the group with an HR \ 120 bpm, accuracy rates
were not significantly different between the two different
measuring sites for apps A, B, and C, but app D had a higher
accuracy rate measured at the earlobe than that measured at
the finger/toe (p = 0.016). Accuracy rate dropped in most
apps and for both measuring sites when patients had an
HR C 120 bpm. Accuracy rates of HR measured at the fin-
ger/toe were all below 50 % (17.6–47.1 %) and were sig-
nificantly lower for apps A, B, and D (p = 0.004, 0.041, and
0.049, respectively). Although the accuracy rates of HR
measured at the earlobe were also lower when patients’ HR
was C120 bpm (except app B), the change was not signifi-
cant for all apps (p = 0.096, 0.944, 0.143, and 0.195,
respectively). Accuracy rates of HR measured at the earlobe
were also better (17.6–76.5 %) than those measured at the
finger/toe in patients with an HR C 120 bpm, with signifi-
cant differences for apps A and D (p = 0.037 and 0.006,
respectively).
Discussion
HR measurement is an important issue in pediatric diseases
characterized by tachycardia, such as a tachyarrhythmia
attack in which palpitations and chest pain or discomfort
occur. HR measurements are also essential for monitoring
bradycardia in children with dysfunction of the permanent
pacemaker, or for detecting early signs of sepsis or severe
enterovirus 71 infection when the tachycardia is not propor-
tional to fever [8]. Besides auscultation of the heart sounds,
the ECG monitor is the modern gold standard and most
widely used method of checking HRs. The ECG monitor
detects and amplifies the electrical changes on the skin caused
by depolarization of the myocardium during contraction.
Pulse rate is representative of HR in most people. Pulse rates
can be conventionally checked by palpation of peripheral
arterial pulsation, manually or mechanically [11]. Another
method of detecting the pulse rate is the use of photople-
thysmography, such as a pulse oximeter, to analyze the
rhythmic skin color change accompanying the pulse when
measuring arterial hemoglobin oxygen saturation [10]. The
aforementioned methods cannot easily be performed by
caregivers who need to measure the heart/pulse rates of
children outside the hospital setting.
Smartphone apps employ various methods for measur-
ing HRs. One method is the phonocardiogram, which uses
the microphone of the cellphone to ‘listen to’ and measure
heartbeats, but requires online server analysis or it must
learn how to recognize an individual user’s heart sounds
[5]. Another is photoplethysmography, as mentioned
above, and many HR apps have been developed based on
this technique [9]. According to the HR apps’ guidelines,
the apps are to be used for checking the pulses at the finger,
and are for adult self-use [6]. Thus, when the caregivers try
to use the apps for children, they may find children’s fin-
gers are too small to cover the camera and the flashlight
simultaneously, and sometimes even the toes may also be
too small. As a pulse oximeter can be used at the earlobe in
some circumstances [7], we speculated that the earlobe
may be a good alternative site for checking the pulse rate in
children. The smartphone apps showed different abilities to
take pulse rates, and the decreased ability of smartphone
apps to work well in small children and those with high
HRs was noted in this study. The accuracy rates of HR
measurement were better at the earlobe than at the finger/
toe, especially for tachycardia. This may be due to the
relatively thinner layer of skin at the earlobe, which allows
better penetration by the flashlight. In addition, the earlobe
may have a better photoplethysmographic amplitude
compared with those of the finger and toe [1].
Study Limitations
First of all, pathological HRs in children are usually much
higher and may exceed 180 bpm. This is a preliminary
study for the accuracy of HRs measured by smartphone
apps, but not specified for arrhythmia attack. The patient’s
Table 3 The accuracy rates of measured pulse rates in groups divi-
ded according to the baseline heart rate for each app at two different
measuring sites
Apps Sites Accuracy rate p value
HR \ 120 bpm HR C 120 bpm
A Finger (toe) 69.6 % (16/23) 23.5 % (4/17) 0.004
Earlobe 82.6 % (19/23) 58.8 % (10/17) 0.096
p value 0.300 0.037
B Finger (toe) 78.3 % (18/23) 47.1 % (8/17) 0.041
Earlobe 69.6 % (16/23) 70.6 % (12/17) 0.944
p value 0.502 0.163
C Finger (toe) 30.4 % (7/23) 17.6 % (3/17) 0.356
Earlobe 39.1 % (9/23) 17.6 % (3/17) 0.143
p value 0.536 1.000
D Finger (toe) 60.9 % (14/23) 29.4 % (5/17) 0.049
Earlobe 91.3 % (21/23) 76.5 % (13/17) 0.195
p value 0.016 0.006
The accuracy rates between groups were compared by Chi squared
test
app application, bpm beats per min, HR heart rate
Pediatr Cardiol
123
HRs in this study were all below 180 bpm. In addition,
accuracy may have been different for each app and on
different devices. The device we used in this study was the
iPhone 4S, but caregivers may use other smartphones.
Besides, the ranking of the apps is always changed by the
time in the App Store. We searched for the apps in August
2012. Some developers occasionally updated their apps for
better performance, and others did not. The same app used
on different phone models may show a different ability to
accurately measure pulse rate in the same individual.
Another issue is that the apps in this study were tested by
medical professionals, not by ordinary people. In the
beginning, we planned that if the results were reliable,
further studies regarding the apps tested by caregivers in
the outpatient setting would be conducted. Other variables,
such as the patient’s level of cooperation, movement by the
patient during the measurement, and the caregiver’s ability
to accurately measure the patient’s pulse rate were not
quantified in this study.
Conclusions
For caregivers who want to measure the HRs of their
children outside the hospital setting, free smartphone HR
apps appear to be attractive options, and the earlobe would
be the preferable site for detecting pulse rates. Although
these apps provide children with a comfortable and con-
venient method of measuring HR, and obviate the need to
carry around additional medical equipment, we do not
recommend their use in routine medical practice because
the results of their accuracy are not good enough. They
should not be solely depended on for measurement of HR
in a clinical setting. In this study, we tested smartphone HR
apps that use photoplethysmography to detect the pulse.
Future studies should include other types of apps that use
another method, such as phonocardiography.
Acknowledgments The authors would like to thank Mr. Peter
Wilds, who obtained the degree of Combined Studies (English and
Psychology) from the University of Newcastle-upon-Tyne (UK), for
his assistance in the English-language editing. We are also grateful to
all our colleagues in the Department of Pediatrics, Taichung Veterans
General Hospital, for their help.
Funding source This project was conducted with no specific
financial support.
Conflict of interest The authors and the English-language editor
declare no conflicts of interest.
References
1. Awad AA, Ghobashy MA, Ouda W, Stout RG, Silverman DG,
Shelley KH (2001) Different responses of ear and finger pulse
oximeter wave form to cold pressor test. Anesth Analg
92:1483–1486
2. Bakhtiary F, Dzemali O, Bastanier CK, Moritz A, Kleine P
(2007) Medium-term follow-up and modes of failure following
epicardial pacemaker implantation in young children. Europace
9:94–97
3. Buijink AW, Visser BJ, Marshall L (2013) Medical apps for
smartphones: lack of evidence undermines quality and safety.
Evid Based Med 18:90–92
4. Chang LY (2008) Enterovirus 71 in Taiwan. Pediatr Neonatol
49:103–112
5. Chen YH, Chen HH, Chen TC, Chen LG (2011) Robust heart rate
measurement with phonocardiogram by on-line template extrac-
tion and matching. Conf Proc IEEE Eng Med Biol Soc
2011:1957–1960
6. Gregoski MJ, Mueller M, Vertegel A, Shaporev A, Jackson BB,
Frenzel RM, Sprehn SM, Treiber FA (2012) Development and
validation of a smartphone heart rate acquisition application for
health promotion and wellness telehealth applications. Int J
Telemed Appl 2012:696324
7. Haynes JM (2007) The ear as an alternative site for a pulse
oximeter finger clip sensor. Respir Care 52:727–729
8. Jan SL, Lin SJ, Fu YC, Chi CS, Wang CC, Wei HJ, Chang Y,
Hwang B, Chen PY, Huang FL, Lin MC (2010) Extracorporeal life
support for treatment of children with enterovirus 71 infection-
related cardiopulmonary failure. Intensive Care Med 36:520–527
9. Jonathan E, Leahy M (2010) Investigating a smartphone imaging
unit for photoplethysmography. Physiol Meas 31:N79–N83
10. Kim JM, Arakawa K, Benson KT, Fox DK (1986) Pulse oximetry
and circulatory kinetics associated with pulse volume amplitude
measured by photoelectric plethysmography. Anesth Analg
65:1333–1339
11. Meyer-Sabellek W, Schulte KL, Gotzen R (1990) Non-invasive
ambulatory blood pressure monitoring: technical possibilities and
problems. J Hypertens Suppl 8:S3–S10
12. Sacchetti A, Moyer V, Baricella R, Cameron J, Moakes ME
(1999) Primary cardiac arrhythmias in children. Pediatr Emerg
Care 15:95–98
Pediatr Cardiol
123