smart survey final report conducted in the laisamis …
TRANSCRIPT

i
SMART SURVEY FINAL REPORT – 2018
SMART SURVEY FINAL REPORT CONDUCTED IN THE LAISAMIS AND NORTH HORR SURVEY
ZONES: MARSABIT COUNTY
22nd JANUARY – 2nd FEBRUARY, 2018

ii
ACKNOWLEDGEMENT
This survey has been carried out with the support and participation of many partners at different levels who are highly acknowledged. These include; UNICEF for funding the survey, Ministry of Health, National Drought Management Authority (NDMA), Ministry of Agriculture, Department of Health Marsabit County, Food for the Hungry - Kenya, World Vision – Kenya and Concern Worldwide-Kenya for the active participation and the supervision roles they played during the survey. At the community level, special gratitude is due to the households which participated in the survey. The local administrators are also acknowledged for their role in mobilizing the community and acting as guides to the enumerators during the exercise. The survey teams composed of the enumerators and team leaders are highly appreciated for the hard
work of collecting the high quality data to the best of their abilities.

iii
Contents
ACCROYNM AND ABBREVIATIONS --------------------------------------------------------------------------------- i
EXECUTIVE SUMMARY ---------------------------------------------------------------------------------------------------- iii
CHAPTER ONE ------------------------------------------------------------------------------------------------------------------ 1
INTRODUCTION --------------------------------------------------------------------------------------------------------------- 1
1.1 Background ------------------------------------------------------------------------------------------------------------------- 1
1.2 Survey Objectives ----------------------------------------------------------------------------------------------------------- 2
1.2.1 General Objective------------------------------------------------------------------------------------------------------ 2
1.2.2 Specific Objectives ---------------------------------------------------------------------------------------------------- 2
1.3 Timing of the Survey ------------------------------------------------------------------------------------------------------- 2
CHAPTER TWO ----------------------------------------------------------------------------------------------------------------- 4
2.0 Methodology------------------------------------------------------------------------------------------------------------------ 4
2.1 Geographic Target Area and Population Group ---------------------------------------------------------------------- 4
2.2 Survey Design ---------------------------------------------------------------------------------------------------------------- 4
2.3 Study Population------------------------------------------------------------------------------------------------------------- 4
2.4 Anthropometric Sample Size --------------------------------------------------------------------------------------------- 4
2.5 Cluster and Household Selection ---------------------------------------------------------------------------------------- 5
2.6 Variables Collected --------------------------------------------------------------------------------------------------------- 6
2.7 Organization of the Survey ------------------------------------------------------------------------------------------------ 7
2.8 Data Entry, Analysis and Report Writing ------------------------------------------------------------------------------ 7
CHAPTER THREE -------------------------------------------------------------------------------------------------------------- 8
3.0 SURVEY RESULTS AND DISCUSSION --------------------------------------------------------------------------- 8
3.1 Demographic Results ------------------------------------------------------------------------------------------------------- 8
3.2.1 School Enrolment for 3-18 Years Age group -------------------------------------------------------------------- 8
3.2.2. Highest Education Level for people above 18 years of age ------------------------------------------------- 9
3.3 Main Occupation of the Household head ----------------------------------------------------------------------------- 10
3.4 Main Source of income of the Household Head -------------------------------------------------------------------- 10
3.5 Nutritional Status of Under-Five Children --------------------------------------------------------------------------- 11
3.5.1 Prevalence of acute malnutrition (weight-for-height z-score –WHO Standards 2006) -------------- 11
3.5.2 Prevalence of Acute malnutrition by MUAC ------------------------------------------------------------------ 12
3.5.3 Prevalence of Underweight ----------------------------------------------------------------------------------------- 13
3.5.4 Prevalence of Stunting ----------------------------------------------------------------------------------------------- 13

iv
3.6 Maternal Nutrition Status ------------------------------------------------------------------------------------------------- 14
3.6.1 Women physiological status --------------------------------------------------------------------------------------- 15
3.6.2 Acute Malnutrition --------------------------------------------------------------------------------------------------- 15
3.6.3. Iron Supplementation ---------------------------------------------------------------------------------------------- 16
3.7 CHILD HEALTH AND IMMUNIZATION ------------------------------------------------------------------------- 17
3.7.1 Morbidity and Health Seeking Behaviour ---------------------------------------------------------------------- 17
3.7.2 Immunization Coverage --------------------------------------------------------------------------------------------- 18
3.7.3 Zinc & Vitamin A Supplementation and Deworming Coverage ------------------------------------------ 19
3.8 Household Water Access Sanitation and Hygiene------------------------------------------------------------------ 21
3.8.1 Main Sources of Drinking Water --------------------------------------------------------------------------------- 21
3.8.2 Trekking distance to Water point --------------------------------------------------------------------------------- 21
3.8.3 Queuing time at water points -------------------------------------------------------------------------------------- 22
3.8.4 Water treatment and hand washing ------------------------------------------------------------------------------- 23
3.8.5 Payment and water storage ----------------------------------------------------------------------------------------- 24
3.8.6 Sanitation Facilities -------------------------------------------------------------------------------------------------- 25
3.9 Food Security ---------------------------------------------------------------------------------------------------------------- 26
3.9.1 Women dietary Diversity ------------------------------------------------------------------------------------------- 26
3.9.2 Minimum Dietary Diversity for Women ------------------------------------------------------------------------ 27
3.9.3 Household Dietary Diversity --------------------------------------------------------------------------------------- 28
3.9.4 Minimum Household Dietary Diversity ------------------------------------------------------------------------- 29
3.9.5 Household Food Consumption Score ---------------------------------------------------------------------------- 29
3.9.6 Food Consumption Score –Nutrition ---------------------------------------------------------------------------- 30
3.9.7 Micro Nutrient --------------------------------------------------------------------------------------------------------- 31
3.10 Coping strategy Index --------------------------------------------------------------------------------------------------- 33
3.11. Food Fortification -------------------------------------------------------------------------------------------------------- 33
3.11.1 Micronutrient Powder --------------------------------------------------------------------------------------------- 34
Chapter 4 -------------------------------------------------------------------------------------------------------------------------- 35
CONCLUSION AND RECOMMENDATIONS ------------------------------------------------------------------------ 35
ANNEXES ------------------------------------------------------------------------------------------------------------------------ 38
Annex 1: Overall Score of the Survey ----------------------------------------------------------------------------------- 38
Annex 2: MAP of Marsabit County --------------------------------------------------------------------------------------- 38
Annex 3: Summary Findings ----------------------------------------------------------------------------------------------- 39

v
Annex 4: Clusters visited: -------------------------------------------------------------------------------------------------- 49
Annex 5: Calendar Of events ---------------------------------------------------------------------------------------------- 51
ANNEX 6: Questionnaires -------------------------------------------------------------------------------------------------- 55

vi
List of Figures
Figure 1: Map of Marsabit County .............................................................................................................. 2
Figure 2: Respondents Marital Status ......................................................................................................... 8
Figure 3: School Enrolment ......................................................................................................................... 8
Figure 4: Highest Education Level for the people above 18 years of age .................................................. 9
Figure 5: Main Occupation of the HH Head ............................................................................................ 10
Figure 6: main Source of Income of the HH head.................................................................................... 10
Figure 7: Physiological status of Women of reproductive age ................................................................ 15
Figure 8: Maternal Nutrition by MUAC ................................................................................................... 15
Figure 9: Children Morbidity .................................................................................................................... 17
Figure 10: Health seeking Behavior .......................................................................................................... 18
Figure 11:Vitamin A supplementation Coverage ..................................................................................... 19
Figure 12: Deworming for children aged 12- 59 months ........................................................................ 20
Figure 13: main source of drinking water ................................................................................................ 21
Figure 14: Trekking distance to water points ........................................................................................... 22
Figure 15: Queuing time at water points .................................................................................................. 23
Figure 16: Water treatment Methods ....................................................................................................... 23
Figure 17: Water treatment and Handwashing ........................................................................................ 24
Figure 18: Water storage ........................................................................................................................... 25
Figure 19: Food groups consumed by women .......................................................................................... 27
Figure 20: Minimum Women Dietary Diversity Score ........................................................................... 28
Figure 21: 12 Food groups Consumed by the HH .................................................................................... 28
Figure 22: Minimum Household Dietary Diversity ................................................................................. 29
Figure 23: Household Food Consumption Score ...................................................................................... 30
Figure 24: Frequency Consumption of Protein, Vitamin A and Iron rich foods in North Horr Sub
County ........................................................................................................................................................ 31
Figure 25: Frequency Consumption of Protein, Vitamin A and Iron rich Foods in Laisamis Sub
County ........................................................................................................................................................ 31
Figure 26: Household Consumption of Micro nutrients rich foods in North Horr Sub County ........... 32
Figure 27: Household Consumption of Micro nutrient rich foods in Laisamis Sub County ................. 33
Figure 28: Mean Strategy Coping Index ................................................................................................... 33
Figure 29: Where they heard or learn about food fortification .............................................................. 34

vii
List of Tables
Table 1: Anthropometric Sample Size for the North Horr and Laisamis survey .......................................... 4
Table 2: Reason for not being at school (3-18 Years) .................................................................................. 9
Table 3: Prevalence of acute malnutrition by WHZ ................................................................................... 12
Table 4: Prevalence of acute Malnutrition by MUAC ................................................................................ 13
Table 5: Prevalence of Underweight ........................................................................................................... 13
Table 6: Prevalence of Stunting .................................................................................................................. 14
Table 7: IFAS Consumption by Days ......................................................................................................... 17
Table 8: Immunization Coverage .............................................................................................................. 19
Table 9: Zinc Supplementation ................................................................................................................... 20
Table 10: Sanitation Facilities .................................................................................................................... 26

i
ACCROYNM AND ABBREVIATIONS
ANC: Antenatal Care
BCG: Bacillus Calmette–Guérin
BSFP: Blanket Supplementary Feeding Program
CI: Confidence Interval
CHMT: County Health Management Team
CLTs: Community Led Total Sanitation
CSI: Coping Strategy Index
DEFF: Design Effect
DHIS: District Health Information System
ECD: Early Childhood Development
ENA: Emergency Nutrition Assessment
FAO: Food and Agricultural Organization
FCS: Food consumption Score
FHK: Food for the Hungry Kenya
GAM: Global Acute Malnutrition
HAZ: Weight-for-Age Z score
HH: Household
HDDS: Household Dietary Diversity Score
HiNi: High Impact Nutrition Intervention
IFAS: Iron Folic Acid Supplementation
KABP: Knowledge, Attitude, Behavior and Practice
KII: Key Informant Interview
MAM: Moderate Acute Malnutrition
MNP: Micro Nutrient Powder
MIYCN:Maternal Infant Young Child Nutrition
MoH: Ministry of Health
MUAC: Mid Upper Arm Circumference
NDMA:National Draught Management Authority
NGO: Non-Governmental Organization
NIWG: Nutrition Information Working Group
OPV: Oral Poliovirus Vaccines
ORS: Oral Rehydration Salts
P&G: Procter & Gamble
PPS: Probability Proportional to Population Size
SAM: Severe Acute Malnutrition
SCHMT:Sub-County Health Management Team
SMART: Standardized Monitoring and Assessment in Relief and Transition
ii
SPSS: Statistical Packages for social Sciences
UN: United Nations
UNICEF:United Nation Children Fund
WDDS: Women Dietary Diversity Score
WHO: World Health Organization
WAZ: Weight-for-Age Z score
WFA: Weight-for-Age
WHZ: Weight-for-Height Z score
WRA: Women of Reproductive age
VIP: Ventilated Improved Pit

iii
EXECUTIVE SUMMARY
Marsabit County is one of the 47 county of the Republic of Kenya created under the Constitution 2010.
It boarders Ethiopia to the North, Lake Turkana to the West, Samburu County to the South and Wajir
and Isiolo Counties to the East. It covers an area of 70,961.3 Km2. It borders Isiolo County to the South
West, Samburu County to the South, Lake Turkana to the West, Ethiopia to the North and Wajir
County to the North West. The County consists of four sub-counties; Laisamis, North Horr, Saku, and
Moyale. Although ranked as the largest county in the country, it has an estimated population of 352,993
from an estimated 61,850 households1. The county remains amongst the counties with the highest
poverty index in the in Kenya and is ranked position 44 out of 47 counties with a poverty index rate of
83.2%. The county has four major livelihoods; Pastoral with 81%, agro-pastoral with about 16% and
Business population at around Marsabit and Moyale towns and other minor livelihood Zones at 3%
include formal employment and fisher folk along Lake Turkana. The main source of cash income in
the county is livestock production contributing 82 percent in the pastoral livelihood zone and 60
percent in the agro-pastoral livelihood zone. Food crop production comes second in the agro-pastoral
livelihood zone contributing 20 percent of cash income while in the pastoral zone, formal waged labor
and petty trade contribute to 11 percent of cash income.
The County experiences poor health and nutrition outcomes which are mainly related to house hold
food insecurity as a result of recurrent drought. After a period of almost a year when a drought
emergency was declared by the Government of Kenya in February 2017, where in North Horr and
Laisamis Sub Counties were affected. Robust emergency response strategy mounted by partners led by
Ministry of Health through Blanket Supplementary Feeding Programme (BSFP) and integrated health
and nutrition outreaches started almost immediately.
This Integrated SMART survey was conducted to establish the current nutrition status in the North
Horr and Laisamis Sub counties.
Specific objectives of the survey were:
To estimate the current prevalence of acute malnutrition in children aged 6 – 59 months
To compare the overall nutritional changes with the previous GAM and SAM.
To determine the morbidity rates amongst children aged 0-59 months over a two week recall
period.
To estimate the immunization coverage of Measles, BCG and Oral polio vaccines (OPV1 and
3).
To determine the coverage for deworming, zinc supplementation for diarrhea and vitamin A
supplementation among children 6-59 months.
To estimate the nutritional status of women of reproductive age 15-49 years using MUAC
measurements
To collect information on possible underlying causes of malnutrition such as household food
security, water, sanitation, and hygiene practices
1 2017 population estimates-DHIS

iv
The survey was conducted in two Sub-Counties: Laisamis and North Horr. Each Sub county had its
own independent sample. Sampling was done using the SMART methodology and applied two stage
cluster sampling methodology with the clusters being selected using the probability proportional to
population size (PPS). Stage one sampling involved the sampling of the clusters while the second stage
sampling involved the selection of the households from the sampled clusters.
The number of clusters sampled was; 42 in Laisamis and North Horr. The total sample size for children
aged between 6 and 59 month was; 437 in Laisamis and 501 in North Horr. The data collected during
the survey included: anthropometry, morbidity, vaccination and de-worming status, Vitamin A
supplementation, hygiene and sanitation practices, other indicators assessed were household food
security and livelihood. The standard data collection tool recommended by the National Nutrition
Information Working Group was used. All the sampled clusters were visited. In total 1,190 households
were sampled from 84 clusters and 972 children aged 6 to 59 months were assessed for anthropometry.
Anthropometric data was analyzed using the ENA software version (July 9th, 2015) while other
indicators were analyzed using SPSS Version 20.0.
The survey findings indicated a GAM prevalence rate of 21.8% (18.0 – 26.1 95% C.I.) in North Horr
and 21.2% (17.3-25.7 95% C.I.) in Laisamis Sub Counties, while the prevalence for severe malnutrition
was 5.2% (3.4 – 7.9 95% C.I.) and 3.3%(2.1-5.1 95% C.I)in North Horr and Laisamis Sub Counties
respectively. This is generally classified as Critical2 by the WHO classification of malnutrition. The
findings also showed the prevalence of underweight at 26.5 % (22.1-31.3 95% C.I.) which was classified
as High3 according to the WHO classification of underweight where 5.4 % (3.6 – 8.1 95% C.I.) were
severely underweight in North Horr Sub county and in Laisamis Sub county prevalence of underweight
at 34.4%(28.7-40.7% 95% C.I) which was classified as Alarming/critical4 according to the WHO
classification of underweight where severe underweight at 8.5%(5.9-12.1 95% C.I.). In terms of
stunting prevalence, the survey findings indicated that 19.9 % (16.0 – 24.3 95% C.I.) of children in
North Horr Sub County were malnourished which was classified as low5 based on the WHO
classification as where 4.4 % (2.6 – 7.4 95% C.I.) of the children were severely stunted. In Laisamis Sub
County, the prevalence of stunting was 29.8% (24.6 -35.5 95% C.I) which was classified as medium6
based on the WHO classification as where 8.9% (6.1 -12.9 95% C.I) of the children were severely
stunted.
The survey findings indicated that 22.7% (103) and 39.6% (217) of children aged 0-59 months in North
Horr and Laisamis respectively was reported to have been ill two weeks prior to survey. The most
prevalent illness during this period was acute respiratory illnesses/ cough in Laisamis at 70.0% and
Fever with chills in North Horr at 78.6%. In term of supplementation, the survey findings indicate that
the overall proportion of children (12-59 Months) supplemented with Vitamin A for at least 2 times in
the period of one year preceding the survey was 43.5% and 48.0% in North Horr and Laisamis Sub
Counties respectively which is way below the national target of 80%. In terms of zinc supplementation,
2 WHO Cut Off Points using Z-Score ((-2 Z scores in populations: <5% - Acceptable; 5-9% - Poor; 10-14% - Serious; >15% - Critical) 3 WHO Classification of Underweight: Low - <10%, Medium – 10 – 19.9%, High – 20 – 29.9%, Alarming/Critical - >30% 4 WHO Classification of Underweight: Low - <10%, Medium – 10 – 19.9%, High – 20 – 29.9%, Alarming/Critical - >30% 5 WHO Classification: Low - <20%, Medium - 20 – 29.9% , High – 30 – 39.9%, Alarming/Critical - >40.0% 6 WHO Classification: Low - <20%, Medium - 20 – 29.9% , High – 30 – 39.9%, Alarming/Critical - >40.0%

v
41.7% and 75.7% in North Horr and Laisamis Sub Counties respectively had received the
supplementation which is below the HiNi target of 80%. Additionally, the results of the survey showed
that 32.5% and 13.2% in North Horr and Laisamis Sub Counties respectively of the households reported
treating water before drinking. The results of the survey showed that among the caregivers interviewed
10.8% and 13.2% in North Horr and Laisamis Sub Counties respectively reported practicing proper
hand washing at the 4 critical times. For the household dietary diversity, analysis showed that only
59.2% and 49.8% in North Horr and Laisamis Sub Counties respectively of the households consumed
more than 5 food groups. Lastly, the survey results showed that the total weighted coping strategy score
was 16.21 and 14.64 in North Horr and Laisamis Sub Counties respectively.

1 | P a g e
CHAPTER ONE
INTRODUCTION
1.1 Background
Marsabit County is one of the 47 county of the Republic of Kenya created under the Constitution 2010.
It boarders Ethiopia to the North, Lake Turkana to the West, Samburu County to the South and Wajir
and Isiolo Counties to the East. It covers an area of 70,961.3 Km2. It borders Isiolo County to the South
West, Samburu County to the South, Lake Turkana to the West, Ethiopia to the North and Wajir
County to the North West. The County consists of four sub-counties; Laisamis, North Horr, Saku, and
Moyale. Although ranked as the largest county in the country, it has an estimated population of 352,993
from an estimated 61,850 households. The county remains amongst the counties with the highest
poverty index in the in Kenya and is ranked position 44 out of 47 counties with a poverty index rate of
83.2%. The county has four major livelihoods; Pastoral with 81%, agro-pastoral with about 16% and
Business population at around Marsabit and Moyale towns and other minor livelihood Zones at 3%
include formal employment and fisher folk along Lake Turkana. The main source of cash income in
the county is livestock production contributing 82 percent in the pastoral livelihood zone and 60
percent in the agro-pastoral livelihood zone. Food crop production comes second in the agro-pastoral
livelihood zone contributing 20 percent of cash income while in the pastoral zone, formal waged labor
and petty trade contribute to 11 percent of cash income.
The county experiences poor health and Nutrition outcomes especially due to Community Referral
system is poor since community units are there but semi Functional and community Health services
are poor hence most health facilities are not able to reach their catchment population. Thirdly, Vastness
of the county and rough terrain i.e. in North Horr and Laisamis hence SCHMT operations have been
narrowed to a limited scope of health facilities and with limited visits to far health facilities which are
occasionally support by partners. Another major contributing factor of high malnutrition levels are:
poor dietary diversity especially for women and poor child care and feeding practices which are related
to hygiene and sanitation and cultural beliefs. To try to improve the health and nutrition status in the
county, various partners have been working with the Ministry of Health in the implementation and up
scaling the High Impact Nutrition Intervention (HiNi) in the County. For instance Concern Worldwide
has been supporting the County Health Department in the implementation of the HiNi services in
Moyale and North Horr Sub counties. On the other hand Food for the Hungry Kenya (FHK) has been
supporting the MoH in the implementation and scaling up of HiNi in North Horr, Saku and Laisamis
sub counties while World Vision has been supporting the same activities in Laisamis Sub counties.

2 | P a g e
Figure 1: Map of Marsabit County
1.2 Survey Objectives
1.2.1 General Objective
The general objective of the survey was to establish the current health & nutrition status in the North
Horr and Laisamis Sub counties.
1.2.2 Specific Objectives
i. To estimate the current prevalence of acute malnutrition in children aged 6 – 59 months
ii. To compare the overall nutritional changes with the previous GAM and SAM
iii. To determine the morbidity rates amongst children aged 6‐59 months over a two week recall
period
iv. To estimate the coverage of Measles, BCG vaccination and deworming for children 9-59
months, 6-59 months and 12-59 months respectively
v. To determine the coverage for zinc supplementation and vitamin A supplementation among
the children 6-59 months
vi. To estimate the nutritional status of female caregivers aged 15-49 years using MUAC
measurements
vii. To assess household food security and livelihoods
viii. To assess water sanitation and hygiene practices
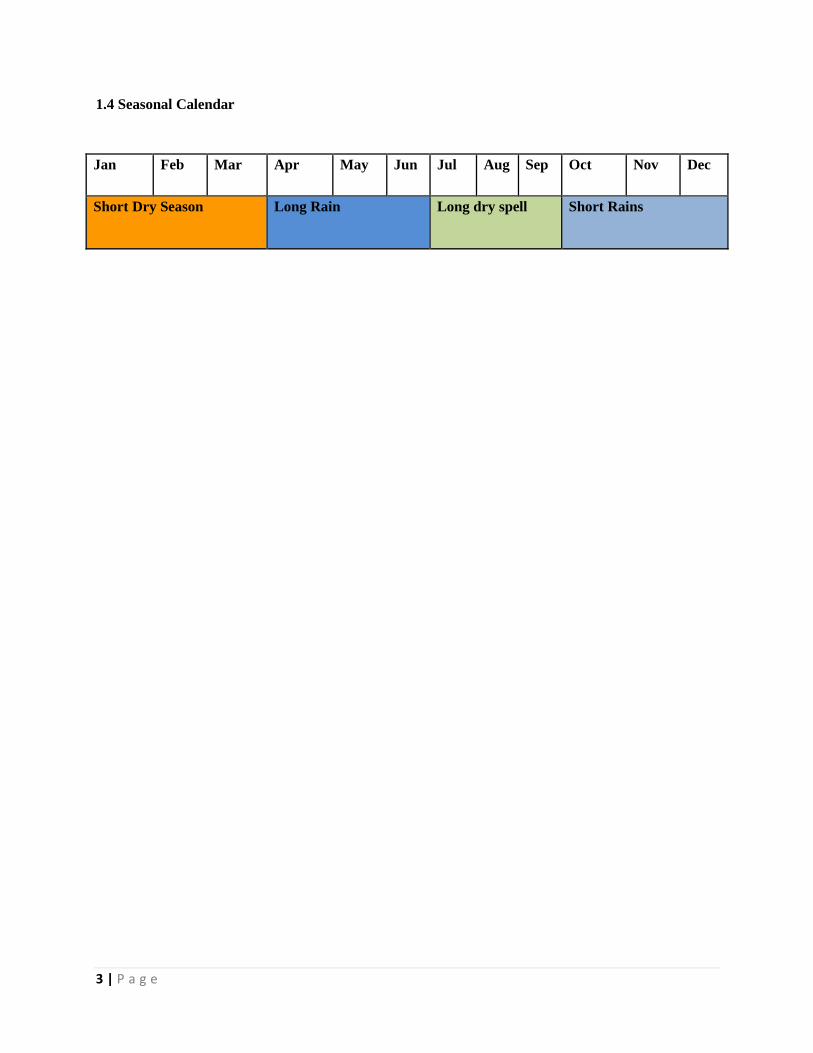
1.3 Timing of the Survey
The survey was undertaken from 22nd January, 2018. Training and piloting of the survey materials and
standardization test was conducted from 22nd to 25th January, 2018 and thereafter data collection from
26th January, 2018. This survey was conducted in the middle of the short dry period as shown in the
section below:
3 | P a g e
1.4 Seasonal Calendar
Jan Feb Mar Apr May Jun Jul Aug Sep Oct Nov Dec
Short Dry Season Long Rain Long dry spell Short Rains

4 | P a g e
CHAPTER TWO
2.0 Methodology
2.1 Geographic Target Area and Population Group
The survey was conducted in the Marsabit County and covered two sub-counties; North Horr and
Laisamis. This was based on an emergency response initiated by UNICEF due to the prevailing hunger
and drought reported in the neighboring counties evidenced by the high prevalence of malnutrition.
Each of the sub-counties had its own independent sample. The primary respondent for the survey was
the mother/care taker of the child for both household and child questionnaire
Data was collected on the following variables; anthropometry, morbidity, vaccination and de-worming
status, Vitamin A supplementation, hygiene and sanitation practices. Other indicators assessed were,
household food security and livelihood. In addition, the nutritional status of child aged 6 – 59 months
mother/care taker aged 15 – 49 years was also determined.
2.2 Survey Design
The survey applied a two stage stratified cluster sampling using the SMART methodology with the
clusters being selected using the probability proportional to population size (PPS). Stage one sampling
involved the sampling of the clusters to be included in the survey while the second stage sampling
involved the selection of the households from the sampled clusters.
2.3 Study Population
The target population for the survey was children aged 6 – 59 months for the anthropometric
component and women of reproductive age between 15 – 49 years for the maternal health component.
2.4 Anthropometric Sample Size
The anthropometric survey sample size was calculated using the SMART survey calculator. The
parameters of interest were captured in the ENA version 9th July software and the respective number
of children and households required for the survey computed. The sampling frame for this survey was
the updated list of villages (with current projected population) from the survey area.
Table 1: Anthropometric Sample Size for the North Horr and Laisamis survey
North
Horr
Laisamis
Total Rationale
Estimate (GAM) 31.0% 24.8% From 2017 SMART survey
Precision 5.0% 5.0% From SMART Global project (Rule of thumb)
Design Effect 1.4 1.4
From 2017 SMART Survey to cater for
heterogeneity
Estimated Number of Children 501 437 938
Average HH Size 5.6 5.6 From the previous 2017 Survey
Non-Response Rate 3.0 3.0 Based on 2017 SMART Survey Experience

5 | P a g e
Proportion of Children Under 5 16.5% 15.7% From DHIS
Estimated Number of
Households 621 569 1190
Number of Households per Day 15 14 Based on 2017 SMART Survey Experience
Number of Cluster 42 42 84 Computed from the Number of HHs per Day
Number of children per Cluster 12 11
Number of Teams 7 7 14
Number of Days 6 6 Based on the Number of Teams to be Recruited
Rationale for Parameters Used for the Survey
GAM – 2017 SMART Survey for the two sub-counties but point estimate since the situation
was expected to be stable.
Precision –5.0 percent as recommended by the Nutrition Survey Guidelines 2012
Design Effect – 1.4 based on the 2017 SMART Survey in the Survey Zones
Non-Response Rate – 3.0 percent based on prior SMART survey experience in the same areas
Average HH Size – Kenya Health Information System Population estimates
Proportion of children under five years obtained from Kenya Health Information System
population estimates
Household to be sampled per day – based on the previous 2017 SMART survey experience and
based on the number of teams to be recruited.
2.5 Cluster and Household Selection
All the villages that were accessible were included in the sampling Frame and sampled with probability
proportional to size. At the second stage, each team listed all the households in a village and used the
simple random sampling method in households to visit. Within the selected households all children 6-
59 months fitting the inclusion criteria were measured.
A household was defined as a group of people who lived together and shared a common cooking pot.
In polygamous families with several structures within the same compound but with different wives
having their own cooking pots, the structures were considered as separate households and assessed
separately.
In cases where there was no eligible child, a household was still considered part of the sample. If a
respondent was absent during the time of household visit, the teams left a message and re-visited later
to collect data for the missing person, with no substitution of households allowed.
6 | P a g e
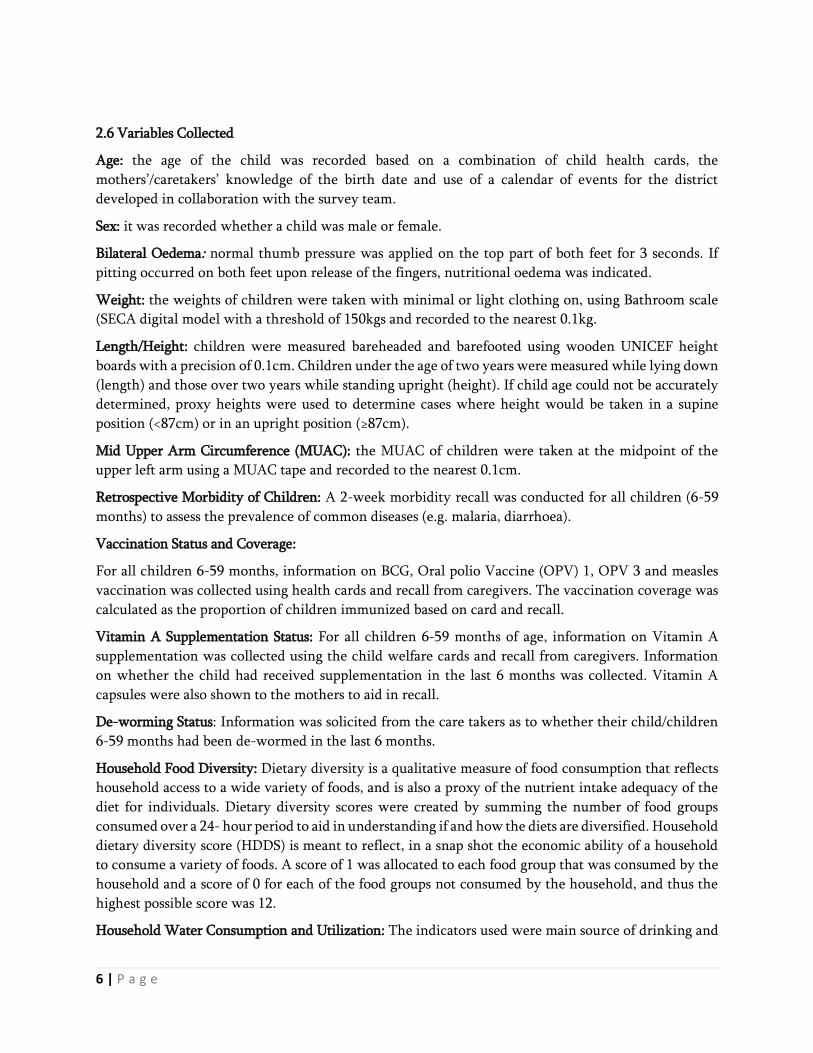
2.6 Variables Collected
Age: the age of the child was recorded based on a combination of child health cards, the
mothers’/caretakers’ knowledge of the birth date and use of a calendar of events for the district
developed in collaboration with the survey team.
Sex: it was recorded whether a child was male or female.
Bilateral Oedema: normal thumb pressure was applied on the top part of both feet for 3 seconds. If
pitting occurred on both feet upon release of the fingers, nutritional oedema was indicated.
Weight: the weights of children were taken with minimal or light clothing on, using Bathroom scale
(SECA digital model with a threshold of 150kgs and recorded to the nearest 0.1kg.
Length/Height: children were measured bareheaded and barefooted using wooden UNICEF height
boards with a precision of 0.1cm. Children under the age of two years were measured while lying down
(length) and those over two years while standing upright (height). If child age could not be accurately
determined, proxy heights were used to determine cases where height would be taken in a supine
position (<87cm) or in an upright position (≥87cm).
Mid Upper Arm Circumference (MUAC): the MUAC of children were taken at the midpoint of the
upper left arm using a MUAC tape and recorded to the nearest 0.1cm.
Retrospective Morbidity of Children: A 2-week morbidity recall was conducted for all children (6-59
months) to assess the prevalence of common diseases (e.g. malaria, diarrhoea).
Vaccination Status and Coverage:
For all children 6-59 months, information on BCG, Oral polio Vaccine (OPV) 1, OPV 3 and measles
vaccination was collected using health cards and recall from caregivers. The vaccination coverage was
calculated as the proportion of children immunized based on card and recall.
Vitamin A Supplementation Status: For all children 6-59 months of age, information on Vitamin A
supplementation was collected using the child welfare cards and recall from caregivers. Information
on whether the child had received supplementation in the last 6 months was collected. Vitamin A
capsules were also shown to the mothers to aid in recall.
De-worming Status: Information was solicited from the care takers as to whether their child/children
6-59 months had been de-wormed in the last 6 months.
Household Food Diversity: Dietary diversity is a qualitative measure of food consumption that reflects
household access to a wide variety of foods, and is also a proxy of the nutrient intake adequacy of the
diet for individuals. Dietary diversity scores were created by summing the number of food groups
consumed over a 24- hour period to aid in understanding if and how the diets are diversified. Household
dietary diversity score (HDDS) is meant to reflect, in a snap shot the economic ability of a household
to consume a variety of foods. A score of 1 was allocated to each food group that was consumed by the
household and a score of 0 for each of the food groups not consumed by the household, and thus the
highest possible score was 12.
Household Water Consumption and Utilization: The indicators used were main source of drinking and

7 | P a g e
household water, time taken to water source and back, cost of water per 20-litre jerry-can and
treatment given to drinking water.
Sanitation: Information on household accessibility to a toilet/latrine, disposal of children’s faeces and
occasions when the respondents wash their hands was obtained.
2.7 Organization of the Survey
Coordination/Collaboration: before the survey was conducted meetings were held with the
respective county authorities and key stakeholders briefed them about the purpose, objectives and
methods for the survey. The survey details were discussed with the County Steering Group, the
National Draught Management Authority, key partners on the ground (NGO and UN) and
conducted in collaboration with the County and Sub-Counties Health Offices. The authorities
were requested to officially inform the communities (villages) that were involved in the assessment.
Recruiting the Survey Team: recruitment was done by the Ministry of Health office at the County
level in order to give ownership and participation in the assessment.
Training of the Survey Team: the teams were given 4-days training prior to field work, including a
standardization test to ensure standardization of measurement and recording practice. All data
collectors were trained on taking anthropometric measurements, completion of questionnaires and
sampling methodology. The data collection forms and questionnaires were pilot tested in clusters
not selected to be part of the larger survey, to ensure that the interviewers and respondents
understand the questions and that interviewers follow correct protocols. One training was
conducted and facilitated by Ministry of Health and Nutrition Information Working Group
supported by Concern Worldwide, World Vision and Food for the Hungry.
Team work in the field: The teams each with four members who have experience in data collection
were organized/ selected from the survey area with each team consisting of 1 team leader,
interviewer and 2 measurers. In addition, supervisors from MoH, NDMA, World Vision, Concern
Worldwide, and Food for the Hungry, closely supervised the team throughout the survey. In
moving from one randomly selected household to another, the teams were guided by a village
leader, or a community volunteer, depending on the village and who was available.
2.8 Data Entry, Analysis and Report Writing
Data Analysis: the data downloading and analysis was done using ENA for SMART, Excel and SPSS
Statistical software version 17. The Concern Worldwide Survey and Surveillance Officer and
Monitoring and Evaluation Officer of World Vision were responsible for the Data downloading,
analysis and report writing. Results are presented using the new WHO reference levels.
Preliminary Results and Final Report: the preliminary findings were submitted by Survey and
Surveillance Officer of Concern Worldwide and Monitoring and Evaluation Officer of World
Vision to the CHMTs, stakeholders and the Nutrition Information Working Group (NIWG)
within two weeks of completion of the survey fieldwork at County and National level and
included the prevalence of global acute malnutrition as well as the prevalence of moderate and
severe acute malnutrition, vaccination and other relevant information.

8 | P a g e
CHAPTER THREE
3.0 SURVEY RESULTS AND DISCUSSION
3.1 Demographic Results
99% the respondents from households in Laisamis and North Horr were residents. Majority of the
respondents were married but it’s worth noting also Widow are increasing especially in North Horr
Sub County with almost 20% as shown in the figure below:
Figure 2: Respondents Marital Status
3.2.1 School Enrolment for 3-18 Years Age group
In both North Horr and Laisamis Sub Counties, around 60% of the children aged 3-18 Years of age
were enrolled to school as shown in the graph below:
Figure 3: School Enrolment
In comparison with the survey conducted in July 2017 where enrollment was at 53.0% and 54.6% in
North Horr and Laisamis respectively, enrolment as increased which could be attributed to the
construction of more ECD centres and hiring of more ECD teachers and government policy of 100
percent transition and Free Day Secondary School Education which came into effect in January 2018.
79.0%
1.3%
17.5%
1.3%
0.8%
85.6%
2.9%
9.5%
1.0%
1.0%
0.0% 10.0% 20.0% 30.0% 40.0% 50.0% 60.0% 70.0% 80.0% 90.0%
Married
Single
Widow
Divorced
Separated
Marital Status
Laisamis North Horr
59.6%
40.4%
59.4%
40.6%
0.0%
50.0%
100.0%
Yes No
School Enrolment of 3-18 Years
North Horr Laisamis

9 | P a g e
The major reason for the 40% not being in school was, family responsibilities such as herding and the
children are very Young to be in School because culturally in both North Horr and Laisamis Sub
Counties children enroll to schools at the age 5 years.
Table 2: Reason for not being at school (3-18 Years)
Reason for not being at school (3-18 Years)
North Horr Laisamis Chronic Sickness 0.4% 1.7% Weather 0.2% 0.2% Family labour Responsibilities i.e. Herding 48.7% 55.1% Working outside home 1.2% 0.2% Too poor to buy school items 2.7% 1.5%
Household doesn't see value of schooling 6.6% 5.0% No food in the school 0.2% 0.2% Migrated /moved from school area 5.8% 0.6% Insecurity 0.6% 0.4% No school near by 11.2% 11.1% Married 3.5% 0.8%
Young 16.8% 21.5%
3.2.2. Highest Education Level for people above 18 years of age
As shown in the figure below, over 80.0% of people above 18 years of age in North Horr and Laisamis
Sub Counties had no formal education while 7.6% and 5.8% had primary Education in North Horr and
Laisamis Sub Counties respectively. It’s also worth noting that 3.8 % and 2.0% in North Horr and
Laisamis sub Counties respectively had tertiary education.
Figure 4: Highest Education Level for the people above 18 years of age
1.5%7.6% 6.3% 3.8%
80.9%
0.5%5.8% 5.3% 2.0%
86.3%
0.0%
20.0%
40.0%
60.0%
80.0%
100.0%
Pre primary Primary Secondary Tertiary None
Highest Education Level (For people above 18 Years)
North Horr Laisamis

10 | P a g e
3.3 Main Occupation of the Household head
The main source of Livelihood of the Household Head in Laisamis and North Horr is livestock herding
at 75.7% and 79.5 % respectively which is a decline compared to survey conducted in July 2017 from
85.9% and 82.3% which is attributed to the intense drought situation that hit both sub counties. It’s
worth noting that also nearly 7% their main livelihood is casual labor followed by petty trade.
Figure 5: Main Occupation of the HH Head
3.4 Main Source of income of the Household Head
In Marsabit County Livestock production contributes to 80 percent of household cash income in the
pastoral livelihood zone and 60 percent to the agro-pastoral livelihood zone. The main source of income
of the Household Head in Laisamis and North Horr is sale of livestock at 70.1% and 72.8 % respectively
followed by petty trade then Casual labor. This is a great improvement from the survey done in July
2017, most households in Laisamis and North Horr had no source of Income at 81.1% and 81.3%
respectively.
Figure 6: main Source of Income of the HH head
79.50%
75.70%
6.60%
7.20%
0.00% 20.00% 40.00% 60.00% 80.00% 100.00% 120.00%
North Horr
Laisamis
Main Occupation Of the HH Head
Livestock Herding
Own Farm labor
Employed
Casual labour
Petty trade
Merchant/Trader
Firewood/Charcoal
Fishing
72.80%
70.10%
10.70%
7.80%
5.90%
8.00%
0.00% 20.00% 40.00% 60.00% 80.00% 100.00% 120.00%
NorthHorr
Laisamis
Source of Income of the HH Head No income
Sale of livestock
Sale of livestockproductsSale of crops
Petty trading
Casual labour
Permanent Job
Sale of Personnel assets
Remittance

11 | P a g e
3.5 Nutritional Status of Under-Five Children
3.5.1 Prevalence of acute malnutrition (weight-for-height z-score –WHO Standards 2006)
The survey managed to reach a total of 527 and 445 children aged between 6 to 59 months in Laisamis
and North Horr Sub Counties respectively whose anthropometric measurements were taken.
In this survey, GAM was defined as the proportion of children with a z-score of less than -2 z-scores
weight-for-height and/or presence of bilateral oedema. Severe Acute Malnutrition (SAM) was defined
as the proportion of children with a z-score of less than -3 z-score and/or presence of oedema.
Further, using the mid-upper arm circumference (MUAC), GAM was defined as the proportion of
children with a MUAC of less than 125 mm and/or presence of oedema while SAM was defined as the
proportion of children with a MUAC of less than 115 mm and/or presence of oedema.
Malnutrition by Z-Score: WHO (2006) Standard
• Severe acute malnutrition is defined by WFH < -3 SD and/or existing bilateral edema on the
lower limbs
• Moderate acute malnutrition is defined by WFH < -2 SD and >-3 SD and no edema
• Global acute malnutrition is defined by WFH < -2 SD and/or existing bilateral edema
Malnutrition by MUAC
• Severe malnutrition is defined by MUAC<115 mm and/or presence of bilateral edema
• Moderate malnutrition is defined by MUAC < 125 mm and ≥115 mm and no edema
• Global acute malnutrition is defined by MUAC <125 mm and/or existing bilateral edema
The Global Acute malnutrition levels in Laisamis, North Horr, Sub Counties were above the emergency
GAM thresholds (15.0%) indicating a critical situation. North Horr Sub County recorded the highest
level of malnutrition of 21.8 percent (95% C.I 18.0-26.1) with Laisamis Sub County at 21.2 percent
(95% CI: 17.3-25.7).
The nutrition situation is interpreted as very critical in North Horr and Laisamis Sub Counties with the
GAM rates being >20%. In relation to the children who were severely malnourished, the nutrition
situation in Laisamis and North Horr is classified as critical. The classification is based on the WHO
growth standards. There were no cases of edema that were reported.
There was a drop in GAM rates for North Horr and Laisamis sub counties from 2017 levels which were
at 31.5% and 24.7% to January 2018 which can be attributed to scaling up of nutrition response
activities such as mass screening, robust emergency response strategy mounted by partners led by
Ministry of Health through Blanket Supplementary Feeding Programme (BSFP) and integrated health
and nutrition outreaches. The situation was also boosted by better performance of the short rains season
late last year which was enhanced rainfall amounting to 125 to 200 percent of normal short rains in
northern parts of the county including North Horr, Maikona, Illeret and Dukana and the lower parts
of the county including Loiyangalani and Laisamis received below normal rains at 50 to 75 percent
thereby resulting to availability of food at household level improving the food consumption.

12 | P a g e
Although the situation improved the malnutrition levels still remain high in North Horr and Laisamis
sub counties can be attributed to increased incidences of diseases amongst under-fives, and low milk
production and consumption and poor infant feeding practices. According to NDMA bulletin January
2018 where Milk production was reported in less than 20 percent of the households which is below
normal, where available, production ranged from 0.5 - 1 liter per household per day compared to
normally 2-3 liters per household per day. Also according to MIYCN KABP conducted in October 2017,
minimum dietary diversity for children 6-23 months was 5.3% and 4.8% in Laisamis and North Horr
Sub Counties respectively, minimum Acceptable diet was 5.4% and 4.8% in Laisamis and North Horr
Sub Counties respectively and Minimum meal frequency was 0.0% in both Sub Counties which were
very low. This was attributed to complementary foods not being adequate due to prolonged drought
that had killed livestock leading to lack of food and also reduces purchasing power of a household.
Table 3: Prevalence of acute malnutrition by WHZ
North Horr
January 2017
North Horr
January 2018
Laisamis
January 2017
Laisamis January
2018
Global Acute
Malnutrition (GAM)
31.5%
(25.3-38.5)
21.8%
(18.0-26.1)
24.7%
(19.3-31.0 )
21.2%
(17.3-25.7)
Severe Acute
Malnutrition (SAM)
9.8%
( 6.6-14.3)
5.2%
( 3.4- 7.9)
5.5%
( 3.5- 8.5)
3.3%
( 2.1- 5.1 )
% of Oedema 0.0% 0.0% 0.0% 0.0%
3.5.2 Prevalence of Acute malnutrition by MUAC
The nutrition situation was also assessed using the MUAC and in comparison with the GAM rates by
the WFH scores. The prevalence of Acute Malnutrition by MUAC for North Horr Sub County was
10.1% and for Laisamis Sub County was 7.1% which is at emergency7 according to WHO classification.
According to NDMA Bulletin January 2018, the Proportion of children ‘at risk’ of malnutrition was
20.8 percent compared to the long term average of 22 percent and 21.7 percent same period last year.
Illeret, Korr and Loiyangalani (Laisamis) reported emergency levels which had surpassed the normal
thresholds according to NDMA Long term Average of 22 Percent.
7 MUAC WHO Cut-Offs: <2 – Low, 2 – <4 – Medium, 4 and above - Emergency

13 | P a g e
Table 4: Prevalence of acute Malnutrition by MUAC
North Horr
January
2017
North Horr
January 2018
Laisamis January
2017
Laisamis January
2018
Global < 125mm 10.1%
( 6.7-14.9 )
3.4%
( 1.9- 5.8)
7.1%
( 3.8-12.9)
6.8%
( 4.5-10.3)
Severe under
nutrition <115mm
0.9%
( 0.3- 3.0 )
0.2%
( 0.0- 1.7)
1.2%
( 0.4- 3.2)
0.6%
( 0.2- 1.7)
3.5.3 Prevalence of Underweight
The prevalence of underweight is determined by low weight-for-age which arises from insufficient
weight gain relative to age is a function of short stature, thinness or both. Underweight prevalence for
Laisamis Sub County was 34.4% and North Horr Sub County was at 26.5%.
Table 5: Prevalence of Underweight
North Horr
January
2017
North Horr January
2018
Laisamis
January 2017
Laisamis January
2018
Global underweight 36.5%
(30.5-43.0)
26.5%
(22.1-31.3)
40.0%
(33.6-46.9)
34.4%
(28.7-40.7)
Severe Underweight 8.7%
( 5.6-13.2)
5.4%
( 3.6- 8.1)
12.0%
( 8.5-16.5).
8.5%
( 5.9-12.1)
The high prevalence of underweight in Laisamis and North Horr Sub counties is consistent with
wasting prevalence an indication of same cause mainly of drought condition being experienced hence
limited access to market to buy food for consumption, which was affected with insecurity especially in
Laisamis and poor access to health service delivery points due to poor community referral system and
also the vastness of the county has limited scope of health facilities and with limited visits to far health
facilities by the County Health Management Team (CHMT) like Illeret Health Centre in North Horr
Sub County.
3.5.4 Prevalence of Stunting
Height-for-age is another anthropometric indices commonly used as an indicator for malnutrition.
Stunting (low height-for-age), results from extended periods of inadequate food intake, poor dietary
quality, increased morbidity, or a combination of the above factors. Stunting in childhood leads to

14 | P a g e
reduced adult size and reduced work capacity. This, in turn, has an impact on economic productivity
at the national level. The prevalence of stunting in North Horr Sub County was 19.9% and in Laisamis
Sub County was 29.8%.
Table 6: Prevalence of Stunting
North Horr January
2017
North Horr January
2018
Laisamis
January 2017
Laisamis
January 2017
Global Stunting 23.5%
(19.5-28.1 )
19.9%
(16.0-24.3)
31.4%
(25.9-37.4 )
29.8%
(24.6-35.5)
Severe Stunting 4.9%
( 2.8- 8.2)
4.4%
( 2.6- 7.4)
9.6%
( 6.4-14.1)
8.9%
( 6.1-12.9)
The stunting levels were within the medium ranges in Laisamis and low in North Horr which could be
attributed to the poor dietary intake both in terms of quantity and quality as evidenced in MIYCN
KABP conducted in October 2017, minimum dietary diversity for children 6-23 months was 5.3% and
4.8% in Laisamis and North Horr Sub Counties respectively, minimum Acceptable diet was 5.4% and
4.8% in Laisamis and North Horr Sub Counties respectively and Minimum meal frequency was 0.0%
in both Sub Counties which were very low. This was attributed to complementary foods not being
adequate due to prolonged drought that had killed livestock leading to lack of food and also reduces
purchasing power of a household. And also the household dietary diversity score which showed that
the survey population relied heavily on 4 major food groups (cereals, legumes, fats & oils and sugars)
which are predominantly high in energy but lack in the essential micronutrients required for proper
growth and development mainly found in vegetables, fruits and protein-rich foods of animal sources
e.g. meat, eggs, fish etc.
3.6 Maternal Nutrition Status
Pregnancy imposes a big nutrient-need load on mothers, which in the absence of adequate extra
nutrients leads to utilization of body nutrient reserves leading to malnutrition. Gestational
malnutrition leads to low birth weights and may ultimately culminate in poor child growth and
development, thus there is an urgent need to address high rates of malnutrition among pregnant
women. Household food insecurity is a key indicator/determinant for poor adult nutritional status. A
high number of malnourished PLWs increase the risk of growth retardation of the fetus and
consequently an increase in low birth weight and malnutrition burden spreads to both U5 children and
caretakers from the same household faced with food insecurity and related vulnerabilities, a common
scenario during nutrition emergency levels .

15 | P a g e
3.6.1 Women physiological status
The figure below indicates that majority of the surveyed women of Reproductive age (15-49 years) in
the North Horr Sub county 56.1% were lactating while in Laisamis it was 53.6%.14.0% and 12.4% of
the women of reproductive age were pregnant in North Horr and Laisamis respectively.
Figure 7: Physiological status of Women of reproductive age
3.6.2 Acute Malnutrition
Maternal malnutrition is usually associated with high risk of low birth weights and it is recommended
that before, during and after birth, the maternal nutrition status should be adequate. The following
graph depicts the maternal nutrition situation of the women of the reproductive age and pregnant and
lactating women in the two Sub counties.
Figure 8: Maternal Nutrition by MUAC
14.0%
56.1%
0.5%
29.4%
12.4%
53.6%
0.3%
33.7%
0.0%
10.0%
20.0%
30.0%
40.0%
50.0%
60.0%
Pregnant Lactacting Pregnant andLactacting
None of the above
Physiological Status of Women of Reproductive age
North Horr Laisamis
12.9%
33.3%
12.1%
20.5%
25.9%
30.9%
0.0% 5.0% 10.0% 15.0% 20.0% 25.0% 30.0% 35.0%
MUAC <210 mm for ALL Women(15-49 Years)
MUAC 210 - <230 mm for ALL Women (15-49 Years
Malnourished PLW(MUAC <210 mm)
Prevalence of Maternal acute malnutrition
Laisamis North Horr

16 | P a g e
The maternal malnutrition was defined as women whose MUAC measurements were < 21.0cm while
women whose MUAC measurements were between 21.0 <23.0cm were classified as at risk of
malnutrition.
The proportion of malnourished pregnant and lactating women in Laisamis and North Horr sub
counties was 30.9% and 12.1% respectively. According to the results pregnant and lactating women in
Laisamis are ore affected with malnutrition which according the NDMA January 2018 there was a drop
in the mean food consumption from December at 39.5 to 37.6 which was mainly attributed to reduced
amounts of food consumed, poor dietary diversity and reduced frequency of meals.
The Proportion of Malnourished women of reproductive age in Laisamis and North Horr sub counties
was 25.9% and 33.3% respectively.
The proportion of women of reproductive age at risk in Laisamis and North Horr sub counties was
20.5% and 12.9% respectively.
3.6.3. Iron Supplementation
During pregnancy, women have increased need for additional iron to ensure they have sufficient iron
stores to prevent iron deficiency. Iron supplementation is recommended in resource limited settings as
strategy to prevent and correct iron deficiency and anaemia among pregnant women WHO
recommends daily consumption of 60mg elemental iron and 0.4mg folic acid throughout the
pregnancy.8 Iron and folic acid supplementation has been the preferred intervention to improve iron
stores and prevent anaemia among pregnant women, and it may also improve other maternal and birth
outcomes. These recommendations have since been adopted by Kenya government in its 2013 policy
guidelines on supplementation of iron folic acid supplementation (IFAS) during pregnancy. During the
survey, iron folic supplementation was assessed by asking mothers of children below 2 years if they
consumed iron folate in their most recent pregnancy. Results show that in both Sub Counties is yet to
achieve the target for IFAS, most of the caretakers took IFAS tablets less 90 Days in both sub counties
which could be attributed to side effects of the supplements. According to the women, IFAS has an
unpleasant smell that makes them feel nauseated, hence they end up not completing the dose given.
The other side effect reported were a feeling of metallic taste in the mouth and increased heartbeat.
Also the possibly of operational shortfalls in the delivery of the product or health seeking behaviour
where mother seek ANC services late in their last trimester.
From the survey results, 79.7% (n=204) and 81.5% (176) of caretakers with children aged 24 months
and below were supplemented with Iron Folic acid in their last pregnancy in Laisamis and North Horr
Sub Counties respectively.
The mean number of days IFAS was consumed by the women varied by sub-county i.e. the mean
number of days IFAS was consumed by women: Laisamis 44.6 and North Horr 36.6 respectively. This
is as summarized in the table below:
8 WHO. Guideline: Daily iron and folic acid supplementation in pregnant women. Geneva, World Health Organization, 2012.
17 | P a g e
Table 7: IFAS Consumption by Days
Zone North Horr Laisamis
Categories of IFAS
Consumption (In Days)
N % N %
< 90 Days 168 95.5% 164 80.4%
90≥180 Days 8 4.5% 39 19.1%
> 180 Days 0 0.0% 1 0.5%
3.7 CHILD HEALTH AND IMMUNIZATION
3.7.1 Morbidity and Health Seeking Behaviour
More than half of under-5 child deaths are due to diseases that are preventable and treatable through
simple, affordable interventions. Strengthening health systems to provide such interventions to all
children will save many young lives.
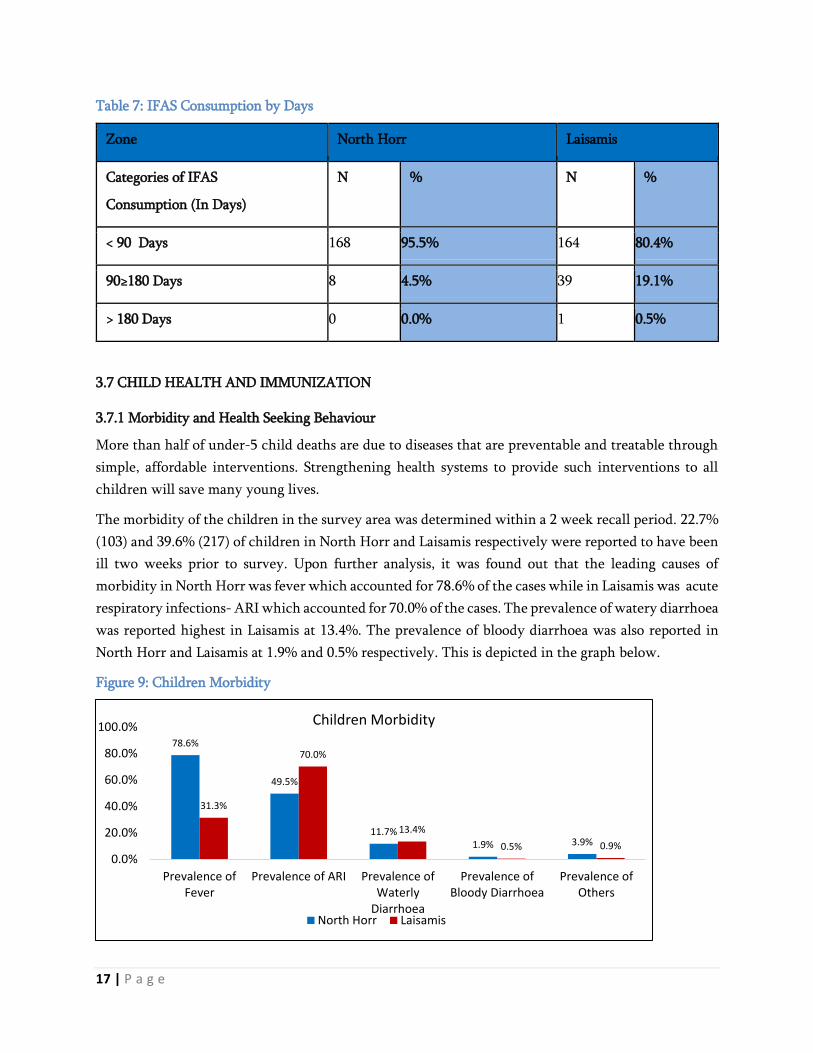
The morbidity of the children in the survey area was determined within a 2 week recall period. 22.7%
(103) and 39.6% (217) of children in North Horr and Laisamis respectively were reported to have been
ill two weeks prior to survey. Upon further analysis, it was found out that the leading causes of
morbidity in North Horr was fever which accounted for 78.6% of the cases while in Laisamis was acute
respiratory infections- ARI which accounted for 70.0% of the cases. The prevalence of watery diarrhoea
was reported highest in Laisamis at 13.4%. The prevalence of bloody diarrhoea was also reported in
North Horr and Laisamis at 1.9% and 0.5% respectively. This is depicted in the graph below.
Figure 9: Children Morbidity
78.6%
49.5%
11.7%1.9% 3.9%
31.3%
70.0%
13.4%
0.5% 0.9%
0.0%
20.0%
40.0%
60.0%
80.0%
100.0%
Prevalence ofFever
Prevalence of ARI Prevalence ofWaterly
Diarrhoea
Prevalence ofBloody Diarrhoea
Prevalence ofOthers
Children Morbidity
North Horr Laisamis

18 | P a g e
In terms of the health seeking behaviour of the caregivers who had sick children with a period of 2
weeks before the survey, 48.5%(50) and 77.0%(167) of caregivers reported to have sought medical
assistance when their children were ill in North Horr and Laisamis respectively. Around 50% in North
Horr sought medical assistance which is less compared to Laisamis which could be associated with
access to health facility.
Figure 10: Health seeking Behavior
Most caregivers sought medical assistance when their children were ill from Public Clinic at 89.2% and
68.0% of the caregivers in Laisamis and North Horr respectively. 36.0% of the caregivers in North Horr
sought assistance from Community Health workers and 14.0% from mobile clinic (Outreaches). In
Laisamis 8.4% of the caregivers sought medical assistance from Private clinic/Pharmacy.
3.7.2 Immunization Coverage
Immunisation is a simple and effective way of protecting children from serious diseases. It not only
helps protect individuals, it also protects the broader community by minimising the spread of disease.
Vaccines work by triggering the immune system to fight against certain diseases. If a vaccinated person
comes in contact with these diseases, their immune system is able to respond more effectively,
preventing the disease from developing or greatly reducing its severity. High immunisation rates in the
community have led to many of diseases becoming rare. However, they still exist and the risks of side-
effects or complications from these diseases are far greater than the very small risks of side effects from
vaccination.
The survey used three antigens as a proxy for immunization coverage. These were; BCG, Oral Polio
vaccination (1 and 3) and measles vaccine (1 and 2).
The immunizations to the children were ascertained either by card (mother-child booklet) or by recall.
The 1st measles immunizations coverage at 9 months by card/recall was 89.9% and 89.0% for Laisamis
and North Horr respectively which was above 80% the National Target. For the 2nd measles
immunizations coverage at 18 months by card/recall was 77.1% and 74.8% for Laisamis and North Horr
Sub counties. For BCG vaccination which was ascertained by scar, the coverage performed quite well
in the two sub-counties with all of them attaining the 80% national coverage targets.
36.0%
1.8%
14.0%
8.4%
68.0%
89.2%
0.0% 20.0% 40.0% 60.0% 80.0% 100.0% 120.0% 140.0%
NorthHorr
Laisamis
Health Seeking Behaviour Traditional Healer
Community Health worker
Mobile Clinic
Private Clinic/Pharmacy
Shops/kiosk
NGO/FBO
Public Clinic
Others

19 | P a g e
For the OPV1 by card/recall was 83.4% and 93.8% for North Horr and Laisamis Sub Counties
respectively. For OPV3 by card/recall was 92.1% and 92.2% for North Horr and Laisamis Sub counties
respectively.In North Horr there was poor coverage of OPV1 which could be attributed to poor
documentation.
Table 8: Immunization Coverage
Survey zone North Horr Laisamis
Indicator n N % n N %
Measles at 9 Months (Yes by Card) 264 437 60.4% 386 518 74.5%
Measles at 9 Months (Yes by Recall) 125 437 28.6% 80 518 15.4%
Measles at 18 Months (Yes by Card) 177 358 49.4% 225 397 56.7%
Measles at 18 Months (Yes by Recall) 91 358 25.4% 81 397 20.4%
BCG by Scar 415 453 91.6% 517 548 94.3%
OPV 1 (Yes by Card) 290 453 64.0% 430 548 78.5%
OPV 1 (Yes by Recall) 133 453 29.4% 84 548 15.3%
OPV 3 (Yes by Card) 292 453 64.5% 423 548 77.2%
OPV 3 (Yes by Recall) 125 453 27.6% 82 548 15.0%
3.7.3 Zinc & Vitamin A Supplementation and Deworming Coverage
Vitamin A supplementation among children below the age of 5 years offers protection against common
childhood infections and substantially reduces mortality hence improving the child’s survival. Vitamin
A supplementation coverage was determined both for over the last six months and one year for all the
surveyed areas. From the findings, Vitamin supplementation for children aged 12-59 months who had
received Vitamin A twice was 43.5% and 48.0% for North Horr and Laisamis respectively.
The findings are summarized the graph below
Figure 11: Vitamin A supplementation Coverage
60.9%
73.2%
43.5%52.5%
85.4%
48.0%
0.0%
20.0%
40.0%
60.0%
80.0%
100.0%
Vitamin A Supplimentation (6-11
Months )- Once
Vitamin A Supplementation (12-59
Months) - Once
Vitamin A Supplementation (12-59
Months) - Twice
Vitamin A Supplementation
North Horr Laisamis

20 | P a g e
In low- and middle-income countries, millions of children suffer from severe diarrhoea every year and
many die from dehydration. Giving fluids by mouth (using an oral rehydration solution (ORS)) has
been shown to save children's lives, but it has no effect on the length of time the children suffer with
diarrhoea. Zinc supplementation could help reduce the duration and the severity of diarrhoea, and
therefore have an additional benefit over ORS in reducing children mortality. With regard to Zinc
supplementation, Laisamis had the coverage at 75.7 %( 22) while North Horr had the coverage of 41.7%
(5).
Table 9: Zinc Supplementation
North Horr Laisamis
n N % n N %
Prevalence of Watery Diarrhea 12 103 11.7% 29 217 13.4%
Prevalence of Bloody Diarrhea 2 103 1.9% 1 217 0.5%
Zinc Supplementation 5 12 41.7% 22 29 75.7%
Deworming supplementation is also an important practice that gets rid of worms that compete for
nutrients in the body and causing iron deficiency anaemia. For deworming of children aged 12-59
months, the coverage was 58.7% (239) and 60.2 %( 293) for North Horr and Laisamis respectively.
Figure 12: Deworming for children aged 12- 59 months
58.7%
60.2%
57.5%
58.0%
58.5%
59.0%
59.5%
60.0%
60.5%
North Horr Laisamis
Deworming for children aged 12-59 Months

21 | P a g e
3.8 Household Water Access Sanitation and Hygiene
3.8.1 Main Sources of Drinking Water
Accessibility to improved water sources is of fundamental significance to lowering the faecal risk and
frequency of associated diseases. Its association with other socioeconomic characteristics, including
education and income, makes it a good universal indicator of human development. Drinking water
coverage is presented as a two-step ladder that includes the proportion of the population using:
Unimproved drinking water sources which include: Unprotected dug well, unprotected spring,
cart with small tank/drum, tanker truck, and surface water (river, dam, lake, pond, stream,
canal, irrigation channels), bottled water
Improved drinking water sources also piped water which include: Public taps or standpipes,
tube wells or boreholes, protected dug wells, protected springs and rainwater collection, Piped
household water connection located inside the user’s dwelling, plot or yard.
According to the table below 22.4% and 64.9% in North Horr and Laisamis Sub counties reported to,
get water from improved drinking water sources while 77.6% and 35.1% in North Horr and Laisamis
reported to get water from unimproved water sources. This is as shown by the table below:
Figure 13: main source of drinking water
Main Source of Drinking Water North Horr Laisamis
Piped into dwelling 0.0% 5.2%
Piped to yard/plot 0.0% 1.8%
Piped to Neighbor 0.0% 4.2%
Public tap/standpipe 1.7% 10.9%
Tube well/Borehole 15.3% 40.2%
Protected well 5.4% 2.6%
Unprotected well 40.3% 19.6%
Unprotected spring 0.5% 0.0%
Rain water 2.3% 2.5%
Tanker truck 2.3% 0.2%
Cart with small tank 0.0% 0.2%
Water Kiosk 12.4% 1.3%
Surface water 17.2% 10.1%
Others i.e. Underground tanks 2.6% 1.3%
3.8.2 Trekking distance to Water point
Currently, more than two-thirds of the population in Africa must leave their home to fetch water for
drinking and domestic use. The time burden of water fetching has been suggested to influence the
volume of water collected by households as well as time spent on income generating activities and child

22 | P a g e
care. However, little is known about the potential health benefits of reducing water fetching distances.9
Time spent walking to a household’s main water source was found to be a significant determinant of
under-five child health. A 15-minutes decrease in one-way walk time to water source is associated with
a 41% average relative reduction in diarrhoea prevalence, improved anthropometric indicators of child
nutritional status, and an 11% relative reduction in under-five child mortality. These results suggest
that reducing the time cost of fetching water should be a priority for water infrastructure investments.10
The distance covered to access water sources is a proxy indicator for water accessibility for a significant
proportion of households in the sub-counties where the survey was administered.
The trekking distances varied in both sub-counties with North Horr and Laisamis almost 50% of the
population trekking >500m to <2km and <500m respectively. This is as shown in the graph below:
Figure 14: Trekking distance to water points
3.8.3 Queuing time at water points
Excessive queueing times are indicators of insufficient water availability due to either an inadequate
number of water points or inadequate yields at water sources. The potential negative results of excessive
queueing times are reduced per capita water consumption, increased consumption from unprotected
surface sources and reduced time for other essential survival tasks for those who collect water. There
are often long queues at water access points because it takes time to fill containers and in order to
reduce the time required for fetching water and to encourage the use of safe water sources, the Sphere
Project recommends that no more than 15 minutes is spent waiting in queues at water access points.
The queuing time at water point in both sub-counties with Majority at 42.2% reporting queuing for
between 30 minutes and one hour while in Laisamis 39.0% reported to be queuing for less than 30
minutes. This is as shown in the graph below:
9 Freshwater Availability and Water Fetching Distance Affect Child Health in Sub-Saharan Africa by Amy J. Pickering†§* and Jennifer
Davis‡§* 10 Freshwater Availability and Water Fetching Distance Affect Child Health in Sub-Saharan Africa by Amy J. Pickering†§* and Jennifer
Davis‡§*
36.0%
43.9%
20.1%
43.8%
30.1%
26.1%
0.0% 10.0% 20.0% 30.0% 40.0% 50.0%
Less tha 500m (<15min)
>500m to <2km(15 to 1 hr)
More than 2 km
Trekking Distance to water points
Liasamis
North Horr

23 | P a g e
Figure 15: Queuing time at water points
3.8.4 Water treatment and hand washing
It is no doubt that water quantity and quality is of vital importance for the ecosystem.11 The lack of
water is further aggravated by insufficient treatment of water, particularly with rapid population
growth.
With regard to treatment of the water before consumption, the situation varied in both sub-counties.
In North Horr Sub County 32.5% while in Laisamis Sub county only 13.2% of the respondent who
treated water before consumption which very low and highly associated with high malnutrition rate
and high prevalence of diarrhoeal disease due to poor water and sanitation hygiene.
Most residence in North Horr who reported treating water were using Chemicals which included aqua
tabs, P&G tabs and in Laisamis most of them were boiling water. Also it’s worth noting a portion of
residence of around 14.8% were using traditional herbs in treating water.
Figure 16: Water treatment Methods
11 UNEP, Green Hills, Blue Cities: An Ecosystems Approach to Water Resources Management for African Cities. A Rapid Response
Assessment, UNEP, Nairobi 2011.
31.2%
42.2%
26.6%
39.0%
27.1%
33.8%
0.0% 5.0% 10.0% 15.0% 20.0% 25.0% 30.0% 35.0% 40.0% 45.0%
Less than 30 minutes
30-1 hr
More than 1 hr
Queuing time at water Points
Laisamis North Horr
13.2%
89.8%
0.0%
0.0%
80.2%
39.5%
14.8%
17.3%
0.0% 20.0% 40.0% 60.0% 80.0% 100.0%
Boiling
Chemicals
Traditional Herbs
Pot filters
Water Treatment Methods
Laisamis North Horr

24 | P a g e
Handwashing with soap is one of the most effective and inexpensive interventions for preventing
diarrheal diseases and pneumonia, which together account for 3.5 million child deaths annually
worldwide.12 Handwashing is important for good health. Effective washing can be practiced with
alternatives to soap and using a variety of different hygienic facilities. Overall, interventions to promote
handwashing might save a million lives a year. Each person should be able to wash hands with water
and soap after toilet use, before food preparation, before eating and after cleaning babies.
With regard to hand washing, over 60% in both sub counties were aware of handwashing practices but
with handwashing at 4 critical times, the practice was poor in both sub-counties with 10.8% in North
Horr and 13.2% in Laisamis reported to have washed their hands at the critical times. 13This is as shown
by the following table:
Figure 17: Water treatment and Handwashing
North Horr Laisamis
Indicator n % n %
Household aware of Hand washing practices 361 59.6% 410 67.0%
After Toilet 238 65.9% 269 65.6%
Before cooking 236 65.4% 309 75.4%
Before Eating 309 85.6% 314 76.6%
After taking children to the toilet 70 19.4% 102 24.9%
Hand washing by Soap and water 264 73.1% 201 49.0%
hand washing 4 critical times 39 10.8% 54 13.2%
3.8.5 Payment and water storage
With regard to water payment, 27.6 %( 167) and 57.8% (354) of the respondent pay for water in North
Horr and Laisamis respectively. With over 60% paying on Monthly basis. Storing water is a good
survival skill to learn as it is our planet’s most precious resource and should never, ever be wasted. Also,
it is important to have for drinking, making food and personal hygiene. With regard to water storage,
over 80% of the residence surveyed reported to store water in closed container and Laisamis around
77% reported to store water in closed containers.
12 Cairncross, S. and Valdmanis V. (2006) Chapter 41: Water Supply, Sanitation, and Hygiene Promotion. In D.T. Jamison, J.G. Breman, A.R.
Measham, et al. (Editors), Disease Control Priorities in Developing Countries, 2nd edition (771-792). Washington (DC): World Bank. 13 People wash their hands with soap at four critical times: after defecation, after changing diapers, before preparing food, and before eating
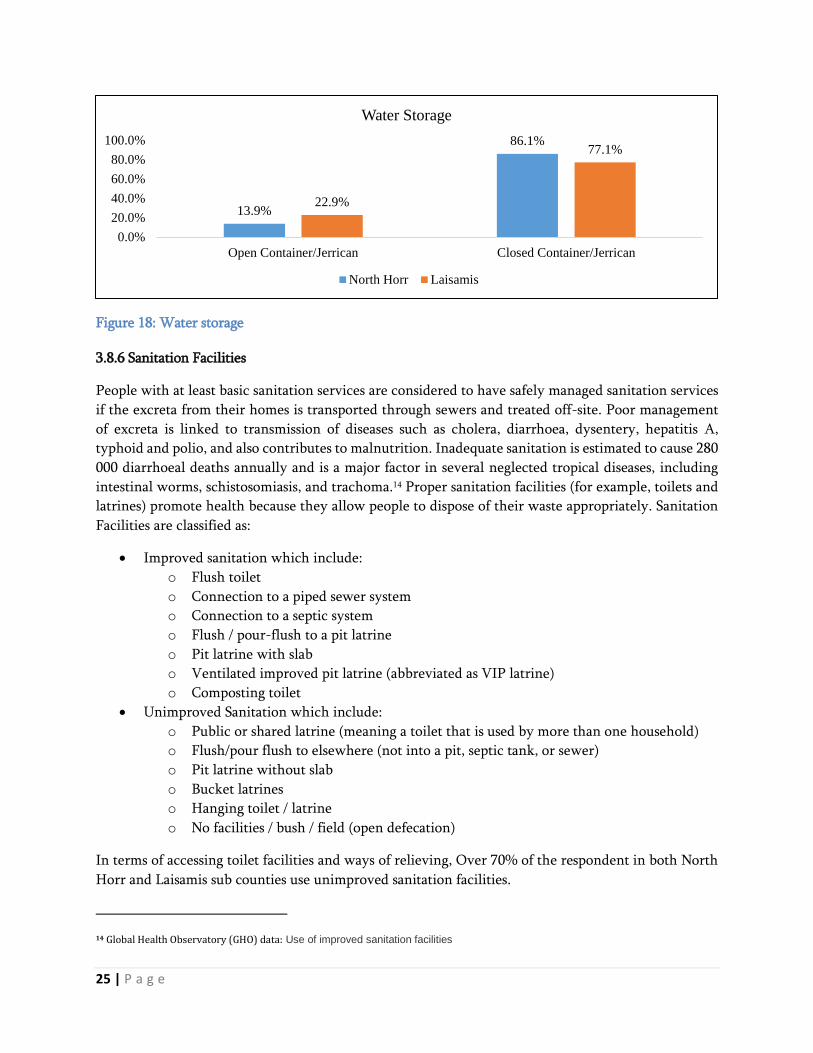
25 | P a g e
Figure 18: Water storage
3.8.6 Sanitation Facilities
People with at least basic sanitation services are considered to have safely managed sanitation services
if the excreta from their homes is transported through sewers and treated off-site. Poor management
of excreta is linked to transmission of diseases such as cholera, diarrhoea, dysentery, hepatitis A,
typhoid and polio, and also contributes to malnutrition. Inadequate sanitation is estimated to cause 280
000 diarrhoeal deaths annually and is a major factor in several neglected tropical diseases, including
intestinal worms, schistosomiasis, and trachoma.14 Proper sanitation facilities (for example, toilets and
latrines) promote health because they allow people to dispose of their waste appropriately. Sanitation
Facilities are classified as:
Improved sanitation which include:
o Flush toilet
o Connection to a piped sewer system
o Connection to a septic system
o Flush / pour-flush to a pit latrine
o Pit latrine with slab
o Ventilated improved pit latrine (abbreviated as VIP latrine)
o Composting toilet
Unimproved Sanitation which include:
o Public or shared latrine (meaning a toilet that is used by more than one household)
o Flush/pour flush to elsewhere (not into a pit, septic tank, or sewer)
o Pit latrine without slab
o Bucket latrines
o Hanging toilet / latrine
o No facilities / bush / field (open defecation)
In terms of accessing toilet facilities and ways of relieving, Over 70% of the respondent in both North
Horr and Laisamis sub counties use unimproved sanitation facilities.
14 Global Health Observatory (GHO) data: Use of improved sanitation facilities
13.9%
86.1%
22.9%
77.1%
0.0%
20.0%
40.0%
60.0%
80.0%
100.0%
Open Container/Jerrican Closed Container/Jerrican
Water Storage
North Horr Laisamis

26 | P a g e
The findings are summarized in the table below:
Table 10: Sanitation Facilities
North Horr Laisamis
Ventilated Improved Pit Latrine 14.4% 6.4%
Pit latrine with slab 5.8% 10.6%
Pit latrine without slab/open pit 1.3% 4.6%
Composting toilet 5.6% 0.0%
No facility /Bush/field 71.9% 73.7%
Other 0.5% 2.9%
Hanging toilet/Latrine 0.5% 1.8%
Improved Sanitation Facility 25.8% 17.0%
Unimproved Sanitation Facility 74.2% 83.0%
3.9 Food Security
3.9.1 Women dietary Diversity
Women of reproductive age (WRA)15 are often nutritionally vulnerable because of the physiological
demands of pregnancy and lactation. Requirements for most nutrients are higher for pregnant and
lactating women than for adult men16. Outside of pregnancy and lactation, other than for iron,
requirements for WRA may be similar to or lower than those of adult men, but because women may
be smaller and eat less (fewer calories), they require a more nutrient-dense diet 17 Insufficient nutrient
intakes before and during pregnancy and lactation can affect both women and their infants. Yet in
many resource poor environments, diet quality for WRA is very poor, and there are gaps between
intakes and requirements for a range of micronutrients18.
In assessing the nutritional quality and quantity of the food consumed by the surveyed women of
reproductive age, a 24 hour recall period household dietary diversity questionnaire was administered
and consumption of 10 food groups in the both Sub Counties is depicted in the graph below. In Laisamis,
starch is the most consumed by women in North Horr and Laisamis sub Counties were legumes and
15 For the purposes of this document and indicator, WRA are defined as those 15–49 years of age. 16 National Research Council, 2006; World Health Organization [WHO]/Food and Agriculture Organization of the United Nations [FAO], 2004 17 “Nutrient density” refers to the ratio of nutrients (such as vitamins and minerals) to the energy content of foods. 18 Arimond et al., 2010; Lee et al. 2013

27 | P a g e
pulses, all starchy foods, flesh foods and dairy Product. The least fed on food were Nuts and seeds, eggs,
other fruits and All Vitamin A vegetable and fruits. This is as shown in the graph below:
Figure 19: Food groups consumed by women
3.9.2 Minimum Dietary Diversity for Women
MDD-W19 is a dichotomous indicator of whether or not women 15-49 years of age have consumed at
least five out of ten defined food groups the previous day or night. The proportion of women 15–49
years of age who reach this minimum in a population can be used as a proxy indicator for higher
micronutrient adequacy, one important dimension of diet quality. The indicator constitutes an
important step towards filling the need for indicators for use in national and subnational assessments.
It is a population-level indicator based on a recall period of a single day and night, so although data are
collected from individual women, the indicator cannot be used to describe diet quality for an individual
woman. This is because of normal day-to-day variability in individual intakes.
With regard to Minimum WDDS, Over 90% of the women surveyed had consumed more than 5 food
groups in both North Horr and Laisamis Sub counties. This is as shown in the graph below:
19 Additional background on the indicator is available at: http://www.fantaproject.org/monitoring-and-evaluation/ minimum-dietary-diversity-
women-indicator-mddw.
68.2%
86.4%
98.1%
90.0%
24.7%
26.4%
30.8%
35.7%
18.6%
18.7%
0.0% 50.0% 100.0% 150.0% 200.0% 250.0% 300.0% 350.0%
North Horr
Laisamis
Food groups consumed by womenAll Starchy Foods
Beans and Peas
Nuts and seeds
Dairy (Milk)
Flesh Foods
Eggs
Vitamin A Rich Dark
Green leafy Vegetables
Other Vitamin A rich
vegetables and fruits
Other Vegetables
Other Fruits

28 | P a g e
Figure 20: Minimum Women Dietary Diversity Score
3.9.3 Household Dietary Diversity
In assessing the nutritional quality and quantity of the food consumed by the survey population, a 1
week retrospective household dietary diversity questionnaire was administered that would also help to
determine the households’ economic capacity to consume various foods in the sub-counties.
Four main food groups were consumed and were consistent in both sub-counties where the survey was
conducted. This were cereals, legumes and pulses, fats and oils and sweets which were consumed by at
least more than 80% of the population that was surveyed within the last 7 days. Fish, eggs, fruits and
vegetables was consumed by at least less than 15% of the surveyed population and was consistent in
both sub-counties. Milk and Milk Products, Iron rich foods and Vegetable were consumed by less than
50% of the surveyed population. This is as shown in the graph below:
Figure 21: 12 Food groups Consumed by the HH
89.1% 84.0%
10.9% 16.0%
0.0%
50.0%
100.0%
North Horr Laisamis
Minimum WDD Score
< 5 Food groups 5 and more food groups
97.0%
5.4%
29.4%
11.2%
49.8%
4.0%
12.2%
91.1%
44.6%
90.3%
88.1%
64.2%
0.0% 20.0% 40.0% 60.0% 80.0% 100.0% 120.0%
Cereals and cereal Products
Roots and tubers
Vegetables
Fruits
Meat, Iron rich and Offals
eggs
Fish
Pulses and Legumes
Milk and milk products
Oils/fats
Sugars
Condiments12 Food Group consumed by a HH
Laisamis North Horr

29 | P a g e
The proportion of households consuming cereals and cereal products and pulses and legumes was high
and could be attributed to general food distribution and the blanket supplementary feeding program
that was ongoing during the survey period.
3.9.4 Minimum Household Dietary Diversity
Household dietary diversity Score (HDDS) is a qualitative measure of food consumption that reflects
household access to a variety of foods. Minimum Household Dietary Diversity is indicator of whether
or not a household has consumed at least three out of twelve defined food groups within the last 7 days.
At least more than 50% of the household surveyed had consumed more than 5 food groups in both Sub
counties. 38.6% and 48.5% of the household surveyed had consumed 3 to 5 food groups in North Horr
and Laisamis sub counties respectively.
Figure 22: Minimum Household Dietary Diversity
3.9.5 Household Food Consumption Score
The food consumption score is an acceptable proxy indicator to measure caloric intake and diet quality
at household level, giving an indication of food security status of the household. It’s a composite score
based on dietary diversity, food frequency and relative nutritional importance of different food groups.
In Laisamis Sub County, 32.7% of the household surveyed had acceptable food consumption Score,
46.4% had Borderline and 20.9% had poor consumption score. In North Horr Sub County, 47.9% of
the household surveyed had acceptable, 35.8% had Borderline and 16.3% had poor food consumption
score. This is as shown in the figure below:
2.1%
38.6%
59.2%
1.6%
48.5%
49.8%
0.0% 10.0% 20.0% 30.0% 40.0% 50.0% 60.0% 70.0%
<3 Food Groups
3 to 5 food groups
<5 food groups
Minimum Household Dietary Diversity Score
Laisamis North Horr

30 | P a g e
Figure 23: Household Food Consumption Score
3.9.6 Food Consumption Score –Nutrition
WFP’s key corporate indicator for measuring food insecurity is the Food Consumption Score (FCS)
used to define categories of household (HH) food insecurity. The information gathered to develop the
FCS additionally provides a wealth of unexploited data that can be used to inform on nutrient rich
groups consumed by the HH and which are essential for nutritional health and well-being: protein,
iron and vitamin A.
All macronutrients (carbohydrates, proteins and lipids) and micronutrients (vitamins and minerals) are
important to ensure a healthy life, and all nutrients should be represented in a sufficient quantity for a
balanced diet.
Macronutrients are good sources of energy. A lack in energy quickly leads to acute undernutrition. An
insufficient intake of protein (essential for growth) is a risk for wasting and stunting. It also has an
impact on micronutrient intake as protein foods are rich sources of vitamins and minerals.
Deficiencies in micronutrients, such as vitamin A and iron, over a long period of time, lead to chronic
undernutrition. Iron deficiency leads to anaemia and Vitamin A deficiency leads to blindness and
interferes with the normal functioning of the immune system, growth and development as well as
reproduction.
This tool chooses to focus on three key nutrients; Protein, Vitamin A and Iron (hem iron) primarily for
their nutritional importance but also those foods rich in these nutrients can be easily grouped from
food consumption data.
With Regard to Food consumption Score Nutrition, among the household surveyed in North Horr Sub
Counties, 54.3% consumed protein Rich foods, 20.6% consumed Vitamin A rich foods and 11.2%
consumed Hem Iron rich foods for 7 days. Over 40.0% of the household surveyed consumed Vitamin
A and Hem Iron Foods for 0 days.
16.3%20.9%
35.8%
46.4%47.9%
32.7%
0.0%
10.0%
20.0%
30.0%
40.0%
50.0%
60.0%
North Horr Laisamis
Food Consumption Score
Poor Food Consumption Border Food Consumption Good Food Consumption

31 | P a g e
Figure 24: Frequency Consumption of Protein, Vitamin A and Iron rich foods in North Horr Sub County
With Regard to Food consumption Score Nutrition, among the household surveyed in Laisamis Sub
Counties, 37.6% consumed protein Rich foods, 16.2% consumed Vitamin A rich foods, and 7.7%
consumed Hem Iron rich foods for 7 days. Over 40.0% of the household surveyed consumed Vitamin
A and Hem Iron rich foods for 0 days.
Figure 25: Frequency Consumption of Protein, Vitamin A and Iron rich Foods in Laisamis Sub County
3.9.7 Micro Nutrient
The poor quality of the habitual diet and the lack of dietary diversity in much of the developing world
contribute to deficiencies of micronutrients. Micronutrient malnutrition is a global problem much
bigger than hunger and imposes enormous costs on societies in terms of ill health, lives lost, reduced
economic productivity and poor quality of life. Addressing the global challenge of micronutrient
malnutrition requires the need for many strategies – both short- and intermediate-term and long-term
41.9%
45.5%
43.2%
37.5%
43.2%
54.3%
20.6%
11.2%
0.0% 20.0% 40.0% 60.0% 80.0% 100.0% 120.0%
Protein Rich foods
Vit A rich Foods
Hem Iron Rich Foods
Frequency Consumption of Protein, Vitamin A and Iron rich Foods
North Horr Sub County
0 Days 1-6 Days 7 Days
44.0%
46.1%
58.3%
39.9%
46.2%
37.6%
16.2%
7.7%
0.0% 20.0% 40.0% 60.0% 80.0% 100.0% 120.0%
Protein Rich foods
Vit A rich Foods
Hem Iron Rich Foods
Consumption of Protein, Vitamin A and Iron rich Foods in Laisamis Sub
County
0 Days 1-6 Days 7 Days
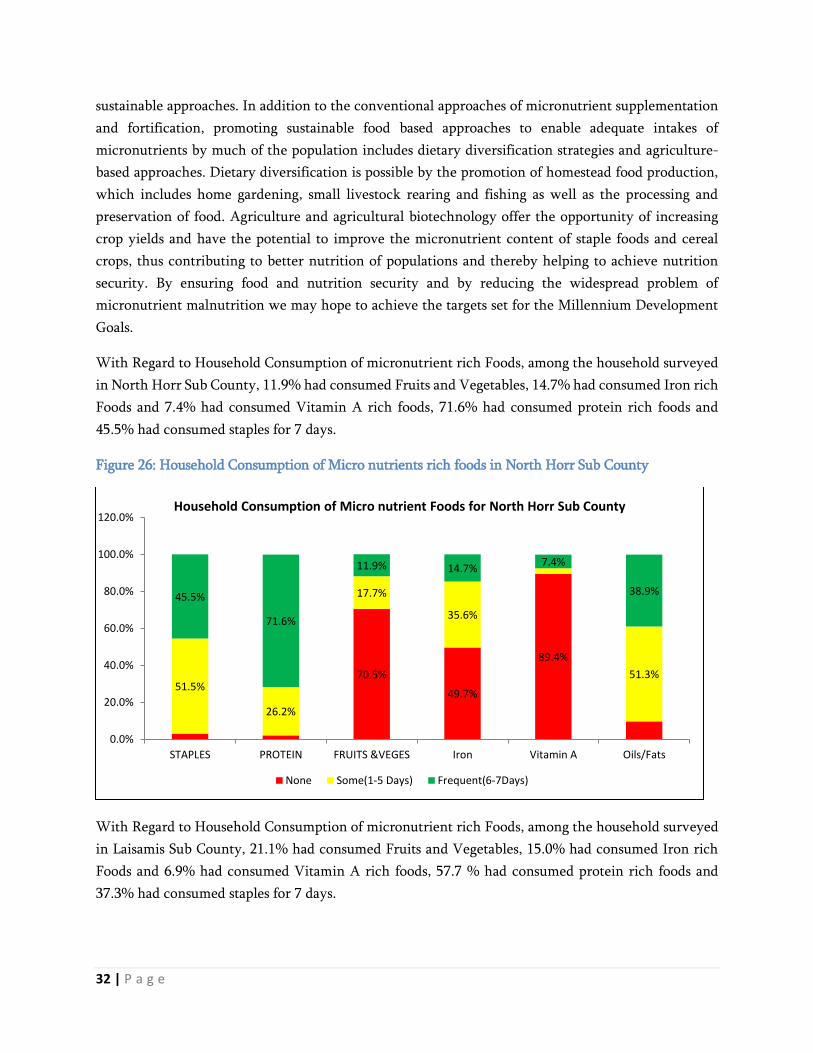
32 | P a g e
sustainable approaches. In addition to the conventional approaches of micronutrient supplementation
and fortification, promoting sustainable food based approaches to enable adequate intakes of
micronutrients by much of the population includes dietary diversification strategies and agriculture-
based approaches. Dietary diversification is possible by the promotion of homestead food production,
which includes home gardening, small livestock rearing and fishing as well as the processing and
preservation of food. Agriculture and agricultural biotechnology offer the opportunity of increasing
crop yields and have the potential to improve the micronutrient content of staple foods and cereal
crops, thus contributing to better nutrition of populations and thereby helping to achieve nutrition
security. By ensuring food and nutrition security and by reducing the widespread problem of
micronutrient malnutrition we may hope to achieve the targets set for the Millennium Development
Goals.
With Regard to Household Consumption of micronutrient rich Foods, among the household surveyed
in North Horr Sub County, 11.9% had consumed Fruits and Vegetables, 14.7% had consumed Iron rich
Foods and 7.4% had consumed Vitamin A rich foods, 71.6% had consumed protein rich foods and
45.5% had consumed staples for 7 days.
Figure 26: Household Consumption of Micro nutrients rich foods in North Horr Sub County
With Regard to Household Consumption of micronutrient rich Foods, among the household surveyed
in Laisamis Sub County, 21.1% had consumed Fruits and Vegetables, 15.0% had consumed Iron rich
Foods and 6.9% had consumed Vitamin A rich foods, 57.7 % had consumed protein rich foods and
37.3% had consumed staples for 7 days.
70.5%
49.7%
89.4%
51.5%
26.2%
17.7%
35.6%
51.3%
45.5%
71.6%
11.9% 14.7%7.4%
38.9%
0.0%
20.0%
40.0%
60.0%
80.0%
100.0%
120.0%
STAPLES PROTEIN FRUITS &VEGES Iron Vitamin A Oils/Fats
Household Consumption of Micro nutrient Foods for North Horr Sub County
None Some(1-5 Days) Frequent(6-7Days)

33 | P a g e
Figure 27: Household Consumption of Micro nutrient rich foods in Laisamis Sub County
3.10 Coping strategy Index
The Coping Strategy Index (CSI), a tool developed by the World Food Programme, is commonly used
as a proxy indicator for access to food.20 It is a weighted score that allows one to measure the frequency
and severity of coping strategies. Data is collected on the number of days in the last seven days a
household used a specific coping strategy due to a shortage of food and/or income. In Laisamis 64.2%
(393) and North Horr 58.7% (356) household applied coping strategy for the last 7 days.
The mean coping strategy Index for Laisamis Sub County was 14.64 and for North Horr Sub county
was 16.21.
Figure 28: Mean Strategy Coping Index
3.11. Food Fortification
Fortification is adding vitamins and minerals to foods to prevent nutritional deficiencies. The nutrients
regularly used in grain fortification prevent diseases, strengthen immune systems, and improve
productivity and cognitive development. Wheat flour, maize flour, and rice are primarily fortified to:
20 ‘Access to food’ is just one of the three pillars of food security. Other pillars include, ‘food availability’ and ‘food utilization’.
53.6%45.1%
88.4%
59.3%38.9%
25.3% 39.9%
62.9%
37.3%57.7%
21.1% 15.0% 6.9%
31.9%
0.0%
20.0%
40.0%
60.0%
80.0%
100.0%
120.0%
STAPLES PROTEIN FRUITS &VEGES Iron Vitamin A Oils/Fats
Household Consumption of Micro nutrient Foods for Laisamis Sub County
None Some(1-5 Days) Frequent(6-7Days)
16.21
14.64
13
14
15
16
17
North Horr Laisamis
CSI
Sco
re
Coping Strategy Index

34 | P a g e
Prevent nutritional anemia
Prevent birth defects of the brain and spine
Increase productivity
Improve economic progress
Food fortification was identified as the second strategy of four by the WHO and FAO to begin
decreasing the incidence of nutrient deficiencies at the global level.21 As outlined by the FAO, the most
common fortified foods are cereals (and cereal based products), milk (and milk products), fats and oils,
accessory food items, tea and other beverages, and infant formulas.22 Undernutrition and nutrient
deficiency is estimated globally to cause between 3 and 5 million deaths per year.
With regard to the survey, only 6.8% (41) and 16.0% (75) of the households in North Horr and Laisamis
Sub counties had heard/learn about food fortification. Most of the households had heard through road
shows followed by radio. Only 5.1 %( 31) and 8.3 %( 51) of the household surveyed reported that knew
if the maize flour they consumed is fortified or not in North Horr and Laisamis respectively.
Figure 29: Where they heard or learn about food fortification
3.11.1 Micronutrient Powder
Multiple micronutrient powders are single-dose packets of vitamins and minerals in powder form that
can be sprinkled onto any ready to eat semi-solid food consumed at home, school or any other point of
use. The benefit of using MNPs are:
Prevent micronutrient deficiencies specially anemia
Improve the body's immune system
Improve a child's appetite
Improve a child's ability to learn and develop
Makes a child clever, strong and active
With regard to the survey, only 12.3% (19) and 10.4% (20) of the children aged 6 to 23 months were
enrolled for MNPs program in North Horr and Laisamis Sub Counties respectively.
21 World Health Organization and Food and Agriculture Organization of the United Nations Guidelines on food fortification with micronutrients.
Archived 26 December 2016 at the Wayback Machine. 2006 [cited on 2011 Oct 30]. 22 Micronutrient Fortification of Food: Technology and Quality Control Archived 2 September 2016 at the Wayback Machine
19.5%
9.8%
34.1%
9.8%8.6%3.4%
43.1%
3.4%
0.0%
10.0%
20.0%
30.0%
40.0%
50.0%
Radio In a training session attended Road show On A TV show
Where they Heard or learn about Food Fortification
North Horr Laisamis

35 | P a g e
Chapter 4
CONCLUSION AND RECOMMENDATIONS
FINDINGS RECOMMENDATION ACTOR (BY WHOM?) TIME LINE
Critical GAM rates in Laisamis and
North Horr of 21.2% and 21.8%
respectively.
Review the county drought response plan, outline
any gap and resource mobilize for scale up where
needed.
CHMT, SCHMT and
Implementing
Partners
Immediately
Review sub county level mapping & prioritization
of integrated outreaches in the hot spots and
highly populated locations that don’t have health
facilities.
SCHMT and
Implementing
Partners
Immediately
and
quarterly
Prioritize screening for malnutrition and
enrolment for treatment in all hot spots from Jan
2018 SMART survey.
SCHMT and
Implementing
Partners.
19th
February to
17th March
2018
Share all referrals to CHVs during the review
meetings for follow up and to form part of
discussion in the meetings
SCHMT and
Implementing
Partners
Immediately
Compose a taskforce at SCHMT with CHA in the
team to monitor admissions referred at facility
level
SCHMT and
Implementing
Partners
February
2018
Conduct IMAM coverage assessment in all the sub
counties to confirm coverage and better inform
programming
SCHMT and
Implementing
Partners
After every 2
years
Integrate the last cycle BSFP distributions with
screening and treatment/supplementation (VAS
and deworming) on site in both Laisamis and
North Horr sub counties.
SCHMT and
Implementing
Partners
Continuous
Promote the consumption of the least consumed
food groups such as eggs, fish, fruits, and
vegetables through SBCC approaches/Plans
developed by the sub counties
SCHMT and
Implementing
Partners
Continuous
Establish a surge team composed of different
health cadres at county level that could timely
respond to outbreak i.e. Malaria outbreak in North
Horr
SCHMT and
Implementing
Partners
Continuous

36 | P a g e
High Malnutrition level for PLW
at 12.1% and 30.9% for North Horr
and Laisamis respectively.
Causal analysis for Laisamis sub county to better
establish the immediate and underlying causes for
high Malnutrition for PLW to inform programing
and roll out of SBCC.
CHMT, SCHMT and
Implementing
Partners.
Immediately
.
Incorporate counselling and education on ideal
diets, food choices and preparation demos
alongside CTP and Protection Ration support
programs.
CHMT, SCHMT and
Implementing
Partners
Underway
and
continuous
Carry out a post monitoring exercise after
protection ration and cash transfer project.
CHMT, SCHMT and
Implementing
Partners
After every
distribution
Poor water, hygiene and sanitation
in both Laisamis and North Horr.
Raising awareness around WASH through
community based forums and schools. Through
utilization of CHAs and CHVs during their
routine HH visits and in community dialogue
meetings.
CHMT, SCHMT and
Implementing
Partners
Underway
and
continuous
Provision of NFIs (water treatment chemicals,
soaps and purifiers) Health facilities and
Community so as to access water.
CHMT, SCHMT and
Implementing
Partners
Underway
and
continuous
Specifically focus on scaling up WASH
services/interventions in Laisamis
CHMT, SCHMT and
Implementing
Partners
Underway
and
continuous
Inadequate monitoring of IMAM
surge at facility and sub county
level (Laisamis & Saku).
Real time monitoring of IMAM surge Approach
and Continuous updating of the dashboards to
show how is the situation without waiting for a
population Survey need to be enhanced in
Laisamis and Saku.
CHMT, SCHMT and
Implementing
Partners
Ongoing for
North Horr
and Moyale.
Enhance
support for
Laisamis
from Feb
2018
Establishment of surge dashboard at County level CHMT, SCHMT and
Implementing
Partners
April 2018
Sensitization of the CHMT and untrained SCHMT
on IMAM surge to enhance sub county level surge
monitoring and support.
CHMT, SCHMT and
Implementing
Partners
From March
2018
Deploy nutritionist to support health facilities
located in the hotspot areas to enhance capacity to
provide quality nutrition services.
CHMT, SCHMT and
Implementing
Partners
Every
Quarter

37 | P a g e
Support quarterly mass screening for malnutrition
by Weight for Height through trained CHVs and
health workers to enhance case finding.
CHMT, SCHMT and
Implementing
Partners
Every
Quarter
Low coverage for Vitamin A
supplementation and Deworming
for children < 5 years.
Routine follow up and monitoring for coverage
during health facilities data review meeting.
CHMT, SCHMT and
Implementing
Partners.
Underway
and
continuous
Poor documentation of Vitamin A
supplementation and deworming
on the Mother child booklets.
Support requisition and distribution of Vitamin A
and De-wormers on semester basis (based on
targets) to prevent stock outs.
CHMT, SCHMT and
Implementing
Partners
Underway
and
continuous
Ensure availability of Mother Child booklets and
promote utilization of the same for service
documentation
CHMT, SCHMT and
Implementing
Partners
Underway
and
continuous
Procurement and distribution of MNP for
children 6- 24months
CHMT, SCHMT and
Implementing
Partners
Underway
and
continuous
Carry out DQAs bi-annually to identified poorly
performing nutrition indicators
CHMT, SCHMT and
Implementing
Partners
Underway
and
continuous
Improve Vitamin A coverage (more especially for
twice yearly supplementation)
CHMT, SCHMT and
Implementing
Partners
Underway
and
continuous
Improve the coverage for Number of the children
Dewormed(12-59M)
CHMT, SCHMT and
Implementing
Partners
Underway
and
continuous
Improve coverage to increase the number of the
children receiving treatment.
CHMT, SCHMT and
Implementing
Partners
Underway
and
continuous Improved investment in WASH i.e.
CLTS
Supportive policies and market
environment
CHMT, SCHMT and
Implementing
Partners
Underway
and
continuous
Improve maternal infant and young child
(MIYCN) practices through implementation of
BFCI activities at the community level.
CHMT, SCHMT and
Implementing
Partners
Underway
and
continuous

ANNEXES
Annex 1: Overall Score of the Survey
Indicator Acceptable
values/range
North Horr Laisamis
Flagged data (% of out of range subjects) <7.5 0 (0.9 %) 0 (2.3%)
Overall sex ratio (significant CHI square) >0.001 0 (p=0.670) 0 (p=0.151)
Age ratio (6-29vs 30-59) Significant CHI
square
>0.001 0 (p=0.539) 0 (p=0.118)
Dig. prevalence score-weight <20 0 (4) 0 (5)
Dig. prevalence score-height <20 0 (6) 0 (5)
Dig. prevalence score-MUAC <20 0 (7) 0 (5)
Standard Dev. Height WHZ >0.80 0 (0.98) 0 (1.00)
Skewness WHZ <±0.6 1(-0.26) 0 (0.19)
Kurtosis WHZ <±0.6 0 (0.00) 0 (-0.06)
Poisson WHZ -2 >0.001 0 (p=0.313) 0 (p=0.084)
OVERALL <25 1% (Excellent) 0% (Excellent)
Annex 2: MAP of Marsabit County

Annex 3: Summary Findings
North Horr January 2018 Laisamis January 2018
Global Acute Malnutrition (GAM) 21.8% (18.0-26.1) 21.2% (17.3-25.7)
Severe Acute Malnutrition (SAM) 5.2% ( 3.4- 7.9) 3.3% ( 2.1- 5.1 )
Global underweight 26.5% (22.1-31.3) 34.4% (28.7-40.7)
Severe Underweight 5.4% ( 3.6- 8.1) 8.5% ( 5.9-12.1)
Global Stunting 19.9% (16.0-24.3) 29.8% (24.6-35.5)
Severe Stunting 4.4% ( 2.6- 7.4) 8.9% ( 6.1-12.9)
Global Malnutrition by MUAC < 125mm 3.4% ( 1.9- 5.8) 6.8% ( 4.5-10.3)
Severe under nutrition <115mm 0.2% ( 0.0- 1.7) 0.6% ( 0.2- 1.7)
North Horr Laisamis
Average Household size Average Household size 4.6 5
% of U5 % of U5 17.60% 19.70%
n N % n N %
school Enrolled 3-18
Years
Yes
714 1197 59.6% 700 1179 59.4%
Reason for not being in
school
Chronic Sickness 2 483 0.4% 8 479 1.7%
Weather 1 483 0.2% 1 479 0.2%
Family labor
Responsibilities i.e.
Herding 235 483 48.7% 264 479 55.1%
Working outside home 6 483 1.2% 1 479 0.2%
Too poor to buy school
items 13 483 2.7% 7 479 1.5%

Household doesn't see
value of schooling 32 483 6.6% 24 479 5.0%
No food in the school 1 483 0.2% 1 479 0.2%
Migrated /moved from
school area 28 483 5.8% 3 479 0.6%
Insecurity 3 483 0.6% 2 479 0.4%
No school near by 54 483 11.2% 53 479 11.1%
Married 17 483 3.5% 4 479 0.8%
Young 81 483 16.8% 103 479 21.5%
Not feeling well 5 483 1.0% 0 479 0.0%
Disabled 1 483 0.2% 3 479 0.6%
Child refused 0 483 0.0% 3 479 0.6%
Teacher Absenteeism 0 483 0.0% 2 479 0.4%
Drop out 3 483 0.6% 0 479 0.0%
Father Refused 1 483 0.2% 0 479 0.0%
Education Level of
Household Head
Pre primary 14 951 1.5% 7 1274 0.5%
Primary 72 951 7.6% 74 1274 5.8%
Secondary 60 951 6.3% 67 1274 5.3%
Tertiary 36 951 3.8% 26 1274 2.0%
None 769 951 80.9% 1100 1274 86.3%
Own a mosquito Net Yes 369 606 60.9% 198 612 32.4%
Who slept
Under five 191 369 51.8% 101 198 51.0%
PLW 98 369 26.6% 58 198 29.3%
None 113 369 30.6% 28 198 14.1%
Other Members 169 369 45.8% 68 198 34.3%
Main Occupation Livestock Herding 482 606 79.5% 463 612 75.7%

Own Farm labor 4 606 0.7% 2 612 0.3%
Employed 14 606 2.3% 29 612 4.7%
Casual labor 40 606 6.6% 44 612 7.2%
Petty trade 19 606 3.1% 38 612 6.2%
Merchant/Trader 2 606 0.3% 8 612 1.3%
Firewood/Charcoal 14 606 2.3% 3 612 0.5%
Fishing 9 606 1.5% 13 612 2.1%
Others 22 606 3.6% 12 612 2.0%
Source of income
No income 15 606 2.5% 13 612 2.1%
Sale of livestock 441 606 72.8% 429 612 70.1%
Sale of livestock products 7 606 1.2% 33 612 5.4%
Sale of crops 1 606 0.2% 0 612 0.0%
Petty trading 65 606 10.7% 48 612 7.8%
Casual labor 36 606 5.9% 49 612 8.0%
Permanent Job 13 606 2.1% 23 612 3.8%
Sale of Personnel assets 6 606 1.0% 3 612 0.5%
Remittance 14 606 2.3% 7 612 1.1%
Income earned by children 2 606 0.3% 2 612 0.3%
Cash Transfers/Vouchers 5 606 0.8% 4 612 0.7%
Others 1 606 0.2% 1 612 0.2%
Marital status
Married 479 606 79.0% 524 612 85.6%
Single 8 606 1.3% 18 612 2.9%
Widow 106 606 17.5% 58 612 9.5%
Divorced 8 606 1.3% 6 612 1.0%
Separated 5 606 0.8% 6 612 1.0%

Residence status
IDP 3 606 0.5% 0 612 0.0%
Refugee 0 606 0.0% 2 612 0.3%
Resident 603 606 99.5% 610 612 99.7%
Children have come to
live with you recently
Yes 45 606 7.4% 44 612 7.2%
No 561 606 92.6% 568 612 92.8%
Reason for coming to live
with you?
Did not have access to Food 3 45 6.7% 7 44 15.9%
Father and mother left
Home 9 45 20.0% 15 44 34.1%
Caregiver died 5 45 11.1% 7 44 15.9%
School 8 45 17.8% 8 44 18.2%
Others i.e. Adopted 20 45 44.4% 7 44 15.9%
Water source
Piped into dwelling 0 606 0.0% 32 612 5.2%
Piped to yard/plot 0 606 0.0% 11 612 1.8%
Piped to Neighbor 0 606 0.0% 26 612 4.2%
Public tap/standpipe 10 606 1.7% 67 612 10.9%
Tube well/Borehole 93 606 15.3% 246 612 40.2%
Protected well 33 606 5.4% 16 612 2.6%
Unprotected well 244 606 40.3% 120 612 19.6%
Unprotected spring 3 606 0.5% 0 612 0.0%
Rain water 14 606 2.3% 15 612 2.5%
Tanker truck 14 606 2.3% 1 612 0.2%
Cart with small tank 0 606 0.0% 1 612 0.2%
Water Kiosk 75 606 12.4% 8 612 1.3%
Surface water 104 606 17.2% 62 612 10.1%
Others i.e. Underground
tanks 16 606 2.6% 8 612 1.3%

Trekking distance
Less than 500m (<15min) 218 606 36.0% 268 612 43.8%
>500m to <2km(15 to 1
hour) 266 606 43.9% 184 612 30.1%
More than 2 km 122 606 20.1% 160 612 26.1%
Queue for Water Yes 154 606 25.4% 328 612 53.6%
Queueing time
Less than 30 minutes 48 154 31.2% 128 328 39.0%
30-1 hour 65 154 42.2% 89 328 27.1%
More than 1 hour 41 154 26.6% 111 328 33.8%
Water treatment
Water Treatment 197 606 32.5% 81 612 13.2%
Boiling 26 197 13.2% 65 81 80.2%
Chemicals 177 197 89.8% 32 81 39.5%
Traditional Herbs 0 197 0.0% 12 81 14.8%
Pot filters 0 197 0.0% 14 81 17.3%
Water Storage Open Container/Jerri can 84 606 13.9% 140 612 22.9%
Closed Container/Jerri can 522 606 86.1% 472 612 77.1%
Pay for Water Yes 167 606 27.6% 354 612 57.8%
Mode of Payment Per 20L Jerri can 66 167 39.5% 125 354 35.3%
Per month 101 167 60.5% 229 354 64.7%
Household Which wash
Hands Yes 361 606 59.6% 410 612 67.0%
Handing Washing
After Toilet 238 361 65.9% 269 410 65.6%
Before cooking 236 361 65.4% 309 410 75.4%
Before Eating 309 361 85.6% 314 410 76.6%
After taking children to
the toilet 70 361 19.4% 102 410 24.9%
Proper hand washing Soap and water 264 361 73.1% 201 410 49.0%

4 critical hand washing
moment All critical moments 39 361 10.8% 54 410 13.2%
Ventilated Improved Pit
Latrine 87 606 14.4% 39 612 6.4%
Pit latrine with slab 35 606 5.8% 65 612 10.6%
Pit latrine without
slab/open pit 8 606 1.3% 28 612 4.6%
Composting toilet 34 606 5.6% 0 612 0.0%
No facility /Bush/field 436 606 71.9% 451 612 73.7%
Other 3 606 0.5% 18 612 2.9%
Hanging toilet/Latrine 3 606 0.5% 11 612 1.8%
Food Consumption Score
Poor Food Consumption 99 606 16.3% 128 612 20.9%
Border Food Consumption 217 606 35.8% 284 612 46.4%
Good Food Consumption 290 606 47.9% 200 612 32.7%
Household Dietary
Diversity
Cereals and cereal
Products 588 606 97.0% 591 612 96.6%
Roots and tubers 33 606 5.4% 63 612 10.3%
Vegetables 178 606 29.4% 281 612 45.9%
Fruits 68 606 11.2% 96 612 15.7%
Meat, Iron rich and Offal’s 302 606 49.8% 308 612 50.3%
eggs 24 606 4.0% 43 612 7.0%
Fish 74 606 12.2% 43 612 7.0%
Pulses and Legumes 552 606 91.1% 573 612 93.6%
Milk and milk products 270 606 44.6% 201 612 32.8%
Oils/fats 547 606 90.3% 580 612 94.8%
Sugars 534 606 88.1% 555 612 90.7%
Condiments 389 606 64.2% 188 612 30.7%

Women Dietary
Diversity
All Starchy Foods 257 377 68.2% 406 470 86.4%
Beans and Peas 370 377 98.1% 423 470 90.0%
Nuts and seeds 36 377 9.5% 17 470 3.6%
Dairy (Milk) 93 377 24.7% 124 470 26.4%
Flesh Foods 116 377 30.8% 168 470 35.7%
Eggs 18 377 4.8% 36 470 7.7%
Vitamin A Rich Dark
Green leafy Vegetables 20 377 5.3% 87 470 18.5%
Other Vitamin A rich
vegetables and fruits 28 377 7.4% 49 470 10.4%
Other Vegetables 70 377 18.6% 88 470 18.7%
Other Fruits 18 377 4.8% 40 470 8.5%
Minimum Women
Dietary Diversity
< 5 Food groups 336 377 89.1% 395 470 84.0%
5 and more food groups 41 377 10.9% 75 470 16.0%
Minimum Household
Dietary Diversity
<3 13 606 2.1% 10 612 1.6%
3 to 5 food groups 234 606 38.6% 297 612 48.5%
<5 food groups 359 606 59.2% 305 612 49.8%
Food Fortification
Heard about Food
Fortification 41 606 6.8% 58 612 9.5%
Radio 8 41 19.5% 5 58 8.6%
In a training session
attended 4 41 9.8% 2 58 3.4%
Road show 14 41 34.1% 25 58 43.1%
On A TV show 4 41 9.8% 2 58 3.4%
Know about the Food
fortification Sign 18 41 43.9% 31 58 53.4%
Main Source of Maize
Flour
Bought from a nearby
Posho mill 83 606 13.7% 63 612 10.3%

Bought from the shops and
supermarket 493 606 81.4% 546 612 89.2%
Maize is taken for milling
at a nearby posho mill 30 606 5.0% 1 612 0.2%
Maize Flour consumed
fortified Yes 31 606 5.1% 51 612 8.3%
Morbidity Yes 103 453 22.7% 217 548 39.6%
Morbidity Prevalence
Prevalence of Fever 81 453 17.9% 68 548 12.4%
Prevalence of ARI 51 453 11.3% 152 548 27.7%
Prevalence of Watery
Diarrhoea 12 453 2.6% 29 548 5.3%
Prevalence of Bloody
Diarrhoea 2 453 0.4% 1 548 0.2%
Prevalence of Others 4 453 0.9% 2 548 0.4%
Zinc supplementation Zinc Supplementation 5 12 41.7% 22 29 75.9%
Health Seeking Behavior Yes 50 103 48.5% 167 217 77.0%
Where sought for health
Assistance
Traditional Healer 0 50 0.0% 1 167 0.6%
Community Health
worker 18 50 36.0% 3 167 1.8%
Mobile Clinic 7 50 14.0% 3 167 1.8%
Relative/Friend 0 50 0.0% 0 167 0.0%
Private Clinic/Pharmacy 1 50 2.0% 14 167 8.4%
Shops/kiosk 1 50 2.0% 1 167 0.6%
Local herbs 0 50 0.0% 0 167 0.0%
NGO/FBO 0 50 0.0% 1 167 0.6%
Public Clinic 34 50 68.0% 149 167 89.2%
Others 0 50 0.0% 1 167 0.6%

Vitamin A
supplementation
Vitamin A
Supplementation (12-59
Months) - Once 298 407 73.2% 416 487 85.4%
Vitamin A
Supplementation (6-11
Months )- Once 28 46 60.9% 32 61 52.5%
Vitamin A Verified by
Card (6-11 Months) 26 46 56.5% 30 61 49.2%
Vitamin A
Supplementation (12-59
Months) - Twice 177 407 43.5% 234 487 48.0%
Vitamin A Verified by
Card (12-59 Months) 296 407 72.7% 395 487 81.1%
Deworming
Deworming (12-59
Months) 239 407 58.7% 293 487 60.2%
Measles Coverage
Measles at 9 Months (Yes
by Card) 264 437 60.4% 386 518 74.5%
Measles at 9 Months (Yes
by Recall) 125 437 28.6% 80 518 15.4%
Measles at 18 Months (Yes
by Card) 177 358 49.4% 225 397 56.7%
Measles at 18 Months (Yes
by Recall) 91 358 25.4% 81 397 20.4%
BCG BCG by Scar 415 453 91.6% 517 548 94.3%
OPV Coverage
OPV 1 (Yes by Card) 290 453 64.0% 430 548 78.5%
OPV 1 (Yes by Recall) 133 453 29.4% 84 548 15.3%
OPV 3 (Yes by Card) 292 453 64.5% 423 548 77.2%
OPV 3 (Yes by Recall) 125 453 27.6% 82 548 15.0%
Maternal Malnutrition
Level
Malnourished (<210 mm) 56 435 12.9% 76 371 20.5%
At Risk (210 - <230 mm) 145 435 33.3% 96 371 25.9%
Malnourished (<210 mm) 37 307 12.1% 76 246 30.9%

Physiological Status of
the WRA
Pregnant 61 435 14.0% 46 371 12.4%
Lactating 244 435 56.1% 199 371 53.6%
Pregnant and Lactating 2 435 0.5% 1 371 0.3%
None of the above 128 435 29.4% 125 371 33.7%
Received IFAS Yes 176 216 81.5% 204 256 79.7%
Days Consumed IFAS
Below 90 Days 168 176 95.5% 164 204 80.4%
90 to >= 180 8 176 4.5% 39 204 19.1%
Above 180 Days 0 176 0.0% 1 204 0.5%
MNP enrolled Enrolled in MNP 19 154 12.3% 20 193 10.4%
Consumption of MNP
Consumed in the last 7
Days 13 19 68.4% 10 20 50.0%
Frequency of taking
MNPs
Every Day 2 13 15.4% 4 10 40.0%
Every Other Day 0 13 0.0% 2 10 20.0%
Every Third Day 4 13 30.8% 2 10 20.0%
2 days per week at any day 6 13 46.2% 2 10 20.0%
At any day when l
remember 1 13 7.7% 0 10 0.0%
Stop taking MNPs
1 week to 2 weeks 0 6 0.0% 2 10 20.0%
2 weeks to 1 month 1 6 16.7% 0 10 0.0%
More than 1 month 5 6 83.3% 8 10 80.0%
Reason for stopping
taking MNPs
Finished all of the sachet 0 6 0.0% 9 10 90.0%
Child did not like it 2 6 33.3% 1 10 10.0%
Husband did not agree to
give to the child 1 6 16.7% 0 10 0.0%
Forgot 3 6 50.0% 1 10 10.0%
Do not know about MNPs 122 135 90.4% 114 173 65.9%

Reason for not being
Enrolled
Discouraged from what l
heard from others 2 135 1.5% 0 173 0.0%
The child has not fallen ill
so have not gone to the
health facility 5 135 3.7% 7 173 4.0%
Health facility or outreach
is far 10 135 7.4% 9 173 5.2%
Child receiving
therapeutic or
supplementary foods 2 135 1.5% 20 173 11.6%
Others 0 135 0.0% 23 173 13.3%
Annex 4: Clusters visited:
Village North Horr Cluster Village Laisamis Cluster
Diba Okotu 1 town 1
Gamura 2 kula mawe 2
Chira 3 nakwamekwi 3
Duke 1/Duke 2 4 Laiyeni 4
Old Yaalgana/gotcha 5 Gatab chini 5
Elgade centre 6 Lgoon 6
Shankera 7 Gatab Kiwanja 7
Balesa/Ali Boru 8 Banachap 8
Qurqur 9 Mirgichan 9
Kiwanga ndege 10 Esimfecha 10
Liso 11 nebei 11
Lag wachu 12 kimogol 12 Segel 13 harebore 13
Ruchi Kushi 14 Naiyoki 14
Tuye kale/galgallo sharama 15 Tuungu 15
Shurr 16 town centre 16
Baulo 19 Manyatta secondary 17
Nangolei 20 Manyatta nairibi 18
Ilgele 21 Ulauli 19
Sieslucho 22 Ndikir 20
Telegaye 23 Merille Center 2 21
Malabot 24 Manyatta Ngamia 22
Gorich 25 Silapani 23 Gallas 26 mero town 24
Barambate 27 Trinity village 25

El-besso 28 uyaam 26
Isacko malla 31 goob thomas 27
Fila 32 dubsahay galimogle 28
Sesa raha 33 rongumo naale 29
Abdub tullu 34 saale kimogol 30 Dadacha kundi 35 tubcha galale 31
Garwole 36 goobore indee 32
Elyibo 37 uroween kahle 33
South C 40 nebey eysimbasete 34
Barambate 41 ongeli 35
Tumticha 42 ntil 36
Illeret town 17,18 Lmongoi 37
Qorqa 29,30 lukumai 38 Bales saru 38,39 lengima 39
manyatta juu 40
forore 41
longai 42
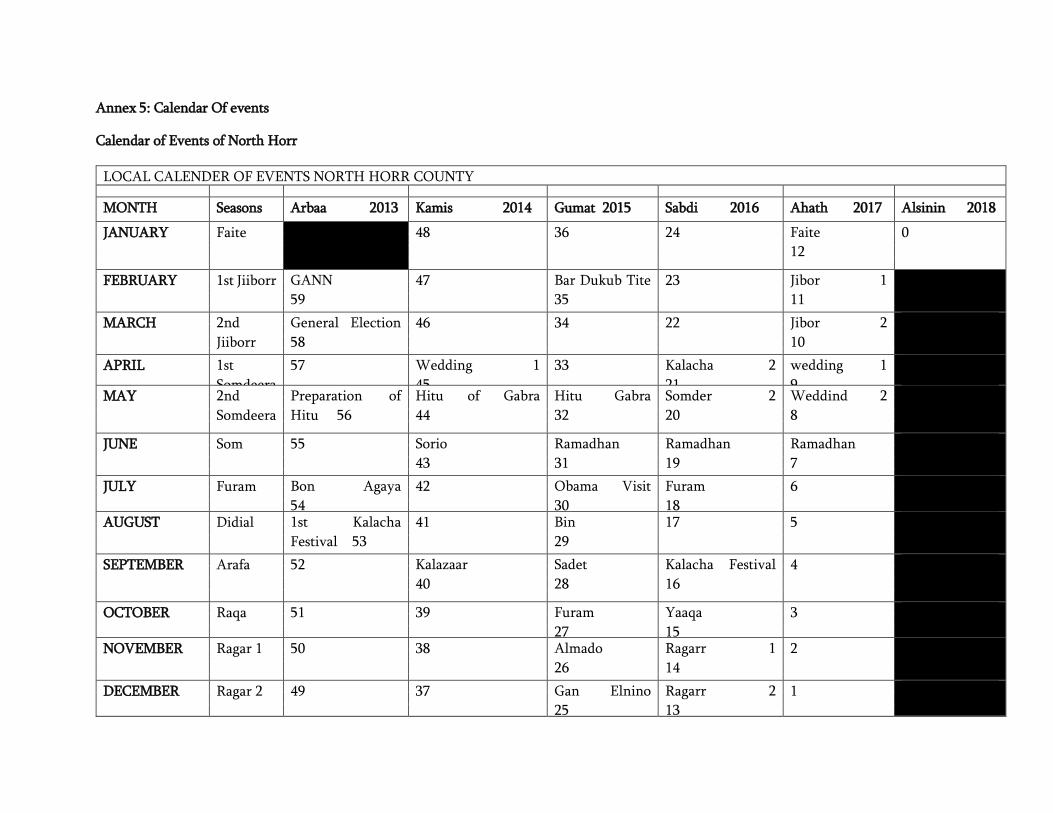
Annex 5: Calendar Of events
Calendar of Events of North Horr
LOCAL CALENDER OF EVENTS NORTH HORR COUNTY MONTH Seasons Arbaa 2013 Kamis 2014 Gumat 2015 Sabdi 2016 Ahath 2017 Alsinin 2018
JANUARY Faite 48 36 24 Faite
12
0
FEBRUARY 1st Jiiborr GANN
59
47 Bar Dukub Tite
35
23 Jibor 1
11
MARCH 2nd
Jiiborr
General Election
58
46 34 22 Jibor 2
10
APRIL 1st
Somdeera
57 Wedding 1
45
33 Kalacha 2
21
wedding 1
9
MAY 2nd
Somdeera
Preparation of
Hitu 56
Hitu of Gabra
44
Hitu Gabra
32
Somder 2
20
Weddind 2
8
JUNE Som 55 Sorio
43
Ramadhan
31
Ramadhan
19
Ramadhan
7
JULY Furam Bon Agaya
54
42 Obama Visit
30
Furam
18
6
AUGUST Didial 1st Kalacha
Festival 53
41 Bin
29
17 5
SEPTEMBER Arafa 52 Kalazaar
40
Sadet
28
Kalacha Festival
16
4
OCTOBER Raqa 51 39 Furam
27
Yaaqa
15
3
NOVEMBER Ragar 1 50 38 Almado
26
Ragarr 1
14
2
DECEMBER Ragar 2 49 37 Gan Elnino
25
Ragarr 2
13
1

Calendar of events of Illeret
LOCAL CALENDER OF EVENTS ILLERET
MONTH Seasons 2013 2014 2015 2016 2017 2018
JANUARY Hele 48 36 Oso nyirara
24
12 0
FEBRUARY War-IL
Lrka
59 Gum chief
47
35 23 11
MARCH War-IL
Kinama
58 46 34 22 Oso El-masich
10
APRIL War-IL
kisethe
57 45 Rabbura
33
21 9
MAY War-IL
Kintura
56 Osonyilerong
44
32 20 8
JUNE Chade 55 43 31 Red cross
19
7
JULY Charr 54 42 Obama Visit
30
Um eldhadai
18
6
AUGUST Sirinyanyu 53 Shalshal
41
Bire Anyieta
29
17 5
SEPTEMBER Garmar 52 Oso
40
28 Oso um hada
16
4
OCTOBER Anich 51 Achie gali dherete
Akimare 39
27 15 3
NOVEMBER Shonoch 50 38 26 Oso nyirara
14
2
DECEMBER Guu 49 37 25 13 1

Calendar of events of Loiyangalani
LOCAL CALENDER OF EVENTS MARSABIT COUNTY -LOYANGALANI WARD/KARGI/S.HORR
MONTH Seasons 2013 2014 2015 2016 2017 2018
JANUARY New year sikukuu
48
New year
sikukuu 36
New year
sikukuu 24
New year sikukuu
12
Roots in mbt
0
FEBRUARY General
elections 59
47 35 23 11
MARCH 58 46 34 22 10
APRIL 57 45 33 Start of long
rains- kargi
21
Livestock
migration to mbt 9
MAY Turkana
cultural
festival 56
Turkana cultural
festival 44
Turkana
cultural festival
32
Turkana
cultural
festival 20
Turkana cultural
festival 8
JUNE V.m.m.c 55 43 Sarima conflicts
31
19 7
JULY 54 42 Lmuget
lolmooli 30
18 6
AUGUST General
elections 53
41 29 17 B.s.f.p./ general
elections 5
SEPTEMBER 52 40 28 16 4
OCTOBER 51 39 27 15 Presidential rerun
3
NOVEMBER 50 38 26 14 Malarial outbreak
rerun 2
DECEMBER Christmas
49
Christmas
37
Christmas
25
Christmas
13
Christmas
1

Calendar of Events of Laisamis
Local calendar of events Marsabit county -Laisamis area
Month Seasons 2013 2014 2015 2016 2017 2018
January New year 48 New year 36 New year
24
New year
12
0
February 59 47 Construction of
civic on road 35
23 11
March general election 58 46 34 start of
short
rains 22
10
April 57 45 33 21 9
May sorio 56 44 32 20 8
June long drought 55 43 Long drought 31 19 7
July 54 42 Iddi
30
18 6
August Lmuget
53
41 29 Iddul fitri
17
General elections
5
September 52 Westgate 40 28 Galsa
outbreak
16
4
October Sorio 51 sorio 39 Sorio 27 sorio
15
Galchiri /run off
presidential
elections
3
November 50 38 26 14 floods in logologo
2
December Christmas 49 Christmas 37 Chrismas 25 Christmas
13
Christmas
1

Page 55 of 81
ANNEX 6: Questionnaires
1.IDENTIFICATION 1.1 Data Collector___________________ 1.2 Team Leader_______________ 1.3 Survey date (dd/mm/yy)--------------------------
1.4 County 1.5 Sub
County
1.6 Ward 1.7 Location 1.8 Sub-Location 1.9 Village 1.10 Cluster No 1.11 HH No 1.12 Team No.
1.13
Household
geographical
coordinates
Latitude
__________
Longitude
______________
2. Household Demographics
2.1 2.2a 2.2b 2.3 2.4 2.5 2.6 2.7a 2.7b 2.8 2.10
Age Group
Please give me
the names of the
persons who
usually live in
your household.
Please
indicate
the
household
head (write
HH on the
member’s
column)
Age (Record
age in
MONTHS for
children <5yrs
and YEARS for
those ≥
5 years’s)
Childs
age
verified
by
1=Health
card
2=Birth
certificate
/
notificatio
n
3=Baptis
m card
4=Recall
5. other
________
specify
Sex 1= Male 2=
Female
If between 3 and 18 years old, Is
the child attending school?
1 = Yes 2 = No
(If yes go to 2.8; If
no go t o 2.7)
Main reason for not attending school (Enter one code from list) 1=Chronic Sickness 2=Weather (rain, floods, storms) 3=Family labour responsibilities 4=Working outside home 5=Teacher absenteeism/lack of teachers 6= Fees or costs 7=Household doesn’t see value of schooling 8 =No food in the schools 9 = Migrated/ moved from school area (including displacements) 10=Insecurity/violence 11-No school Near by 12=Married 13. Pregnant/ taking care of her own child 13=others
(specify)……
……………..
2.7a, What is the child doing when not in school? 1=Working on family farm 2=Herding Livestock 3=Working for payment away from home 4=Left home for elsewhere 5=Child living on the street 6: Other specify __________
What is the highest level of education attained?(level completed) From 5 yrs and above 1 =Pre primary 2= Primary 3=Secondary 4=Tertiary
5= None 6=others(specify) Go to
question to
2.9 ↓
If the
household
owns
mosquito
net/s, who
slept
under the
mosquito
net last
night?
(Probe-
enter all
responses
mentioned
(Use 1 if
“Yes” 2 if
“No and 3 if
not
applicable)
go to
question
2.11
Year
s
Month
s

Page 56 of 81
< 5 YRS 1
2
3
4
>5 TO <18
YRS
5
6
7
8
ADULT (18
years and
above)
13
14)
15
16
2.9 How many mosquito nets does this household have? ____________________ (Indicate no.) go to question 2.10 before proceeding to
question 2.11
2.11 Main Occupation of the Household Head – HH.
(enter code from list) 1=Livestock herding 2=Own farm labour 3=Employed (salaried) 4=Waged labour (Casual) 5=Petty trade 6=Merchant/trader 7=Firewood/charcoal 8=Fishing
9= Income earned by children
10=Others (Specify) |____|
2.12. What is the main current source of income of the household?
1. =No income
2. = Sale of livestock
3. = Sale of livestock products
4. = Sale of crops
5. = Petty trading e.g. sale of firewood
6. =Casual labor
7. =Permanent job
8. = Sale of personal assets
9. = Remittance
10. Other-Specify |____|
2.13 Marital status of the respondent
1. = Married 2. = Single 3. = Widowed 4. = separated
5. = Divorced. |____|
2.14. What is the residency status of the household?
1. IDP
2.Refugee
3. Resident |____|
2.15 Are there children who have come to live with you recently?
1. YES 2. NO
2.15b If yes, why did the child/children come to live with you?
1= Did not have access to food
2=Father and Mother left home
3=Child was living on the street,
4=Care giver died
5= Other specify ________________________________________________

Page 57 of 81
Fever with Malaria: High temperature with shivering
Cough/ARI: Any episode with severe, persistent cough or difficulty breathing
Watery diarrhoea: Any episode of three or more watery stools per day
Bloody diarrhoea: Any episode of three or more stools with blood per day
3. 4. 5. CHILD HEALTH AND NUTRITION (ONLY FOR CHILDREN 6-59 MONTHS OF AGE; IF N/A SKIP TO SECTION 3.6)
Instructions: The caregiver of the child should be the main respondent for this section 3.1 CHILD ANTHROPOMETRY 3.2 and 3.3 CHILD MORBIDITY
(Please fill in ALL REQUIRED details below. Maintain the same child number as part 2)
A
Child
No.
B C D E F G H I J K 3.2 a 3.2 b 3.3 a 3.3 b 3.3 c
what is the
relationship of
the respondent
with the
child/children
1=Mother
2=Father
3=Sibling
4=Grandmother
5=Other
(specify)
SEX
Female…...
F
Male
…..….M
Exact
Birth Date
Age in
months
Weight
(KG)
XX.X
Height
(CM)
XX.X
Oedema
Y= Yes
N= No
MUAC
(cm)
XX.X
Is the child in any nutrition program 1. Yes 2. No If no skip to questions 3.2
If yes to question J. which nutrition program? 1.OTP 2.SFP 3.BSFP Other Specify ______
Has your child (NAME) been ill in the past two weeks? 1.Yes
2. No If No, skip to 3.4
If YES, which illness (multiple responses possible) 1 = Fever with chills like malaria 2 = ARI /Cough 3 = Watery diarrhoea 4 = Bloody diarrhoea 5 = Other (specify) See case definitions above
When the child was
sick did you seek
assistance?
1.Yes 2. No
If the response is yes
to question # 3.2
where did you seek
assistance? (More
than one response
possible-
1. Traditional healer
2.Community health
worker
3. Private clinic/
pharmacy
4. Shop/kiosk 5.Public clinic
6. Mobile clinic
7. Relative or friend
8. Local herbs
9.NGO/FBO
If the child had watery diarrhoea in the last TWO (2) WEEKS, did the child get: 1. ORS 2. Zinc
supplementation? Show sample and probe further for this component check the remaining drugs(confirm from mother child booklet)
01

Page 58 of 81
3.4 Maintain the same child number as part 2 and 3.1 above
A1 A2 B C D E F G H I
Child No.
How many
times has
child
received
Vitamin A
in the past
year?
(show
sample)
Has the child received vitamin A supplement in the past 6 months?
How many times did the child receive vitamin A capsules from the facility or out reach
If Vitamin A
received
how many
times in the
past one
year did the
child
receive
verified by
Card?
FOR
CHILDREN
12-59 MONTHS
How many
times has
child
received
drugs for
worms
in the past
year?
(show Sample)
Has the child received BCG vaccination? Check for BCG scar. 1 = scar 2=No scar
Has child received OPV1 vaccination 1=Yes, Card 2=Yes, Recall 3 = No 4 = Do not know
Has child received OPV3 vaccination? 1=Yes, Card 2=Yes, Recall 3 = No 4 = Do not know
Has child received measles vaccination at 9 months (On the upper right shoulder)? 1=Yes, Card 2=Yes, Recall 3 = No 4 = Do not know
Has child received the second measles vaccination (18 to 59 months ) (On the upper right shoulder)? 1=Yes, Card 2=Yes, Recall 3 = No 4 = Do not know
01
02
03
04
02
03
04

Page 59 of 81
3.5 MNP Programme Coverage. Maintain the same child number as part 2 and 3.1 above. Ask all the relevant questions (3.5.1 to 3.6.4) before moving on to f ill
responses for the next child. THIS SECTION SHOULD ONLY BE ADMINISTERED IF MNP PROGRAM IS BEING IMPLEMENTED OR HAS BEEN IMPLEMENTED
3.5 Enrolment in an MNP program 3.6 Consumption of MNPs
3.5.1.
Is the child enrolled in the MNP
program?(show the example of
the MNP sachet)
(record the code in the
respective child’s number)
Yes =1
No=0
If no go to 3.5.2,
If yes go to section 3.6.1
3.5.2
If the child, 6-23months, is not enrolled for
MNP, give reason. (Multiple answers
possible. Record the code/codes in the
respective child’s number. DO NOT
READ the answers)
Do not know about MNPs ….......………1
Discouraged from what I heard from
others ……..............................................2
The child has not fallen ill, so have not
gone to the health facility …. ….....…..3
Health facility or outreach is far ….....…4
Ch ild receiving therapeutic or
supplementary foods ..............................5
Other reason, specify ...…….....……….6
Skip to 3.7
3.6.1
Has the child
consumed MNPs
in the last 7
days?(shows the
MNP sachet)
(record the
code in the
respective
child’s number)
YES = 1
N0= 0
If no skip to
3.6.3
3.6.2
If yes, how frequent do you give
MNP to your child? (record the
code in the respective child’s
number)
Every day ……..........……….1 Every other day ........….……..2 Every third day ……......……..3 2 days per week at any day ....4 Any day when I remember..…5
3.6.3
If no, since when did you
stop feeding MNPs to your
child? (record the code in
the respective child’s
number)
1 week to 2 weeks ago ....1
2 week to 1 month ago ....2
More than 1 month ..........3
3.6.4
What are the reasons to stop
feeding your child with MNPs?
(Multiple answers possible.
Record the code/codes in the
respective child’s number. DO
NOT READ the answers)
Finished all of the sachets .............1
Child did not like it .......................2
Husband did not agree to give to
the child ..................3
Sachet got damaged ………….4
Child had diarrhea after being given
vitamin and mineral powder ……..5
Child fell sick.......................6
Forgot …………………….…..7
Child enrolled in IMAM program …8
Other (Specify)______________ ..9

Page 60 of 81
Child 1
Child 2
Child 3
Child 4

Page 61 of 81
MATERNAL NUTRITION FOR WOMEN OF REPRODUCTIVE AGE (15-49 YEARS)(Please insert appropriate number in the box) 3.7 3.8 3.9 3.10 3.11
Woman ID. (all women in the HH aged 15-49 years from the household demographics – section 2 )
What is the mother’s /
caretaker’s physiological
status
1. Pregnant 2. Lactating 3. not pregnant and not
lactating 4. Pregnant and
lactating
Mother/ caretaker’s
MUAC reading:
____.__cm
During the pregnancy of the
(name of the youngest
biological child below 24
months) did you take the
following supplements?
indicate
1. Yes 2. No 3. Don’t know 4. N/A
If Yes, for how many days
did you take?
(probe and approximate the number of days)
Iron
tablet
s
syrup
Folic
acid
Combined
iron and
folic acid
supplement
s
Iron
tablets
syrup
Folic
acid
Combined
iron and
folic acid
suppleme
nts
4.0 WATER, SANITATION AND HYGIENE (WASH)/- Please ask the respondent and indicate the appropriate number in the space provided
4.1 What is the MAIN source of drinking water for the
household NOW?
piped water
piped into dwelling ..................................... 11
piped to yard / plot ..................................... 12
piped to neighbour ..................................... 13
public tap / standpipe ................................. 14
tube well / borehole ...................................... 21
dug well
protected well ............................................. 31
unprotected well ......................................... 32
spring
protected spring ......................................... 41
unprotected spring ..................................... 42
rainwater ....................................................... 51
tanker-truck ................................................... 61
cart with small tank ...................................... 71
water kiosk .................................................... 72
surface water (river, dam, lake, pond, stream,
canal, irrigation channel) ............................ 81
4.2 a What is the trekking distance to the current main
water source?
1=less than 500m (Less than 15 minutes) 2=more than 500m to less than 2km (15 to 1 hour) 3=more than 2 km (1 – 2 hrs)
4=Other(specify) |____|
4.2b – Who
MAINLY
goes to fetch
water at your
current main
water
source?
1=Women,
2=Men,
3=Girls,
4=Boys

Page 62 of 81
packaged water
bottled water .............................................. 91
sachet water ............................................... 92
1.
4.2.2a How long do you queue for water?
1. Less than 30 minutes 2. 30-60 minutes 3. More than 1 hour 4. Don’t que for water 1.
.3 Do you do anything to your water before drinking?
(MULTIPLE RESPONSES POSSIBLE) (Use 1 if YES and 2
if NO).
1. Nothing 2. Boiling………… …………………………………….
|____| 3. Chemicals (Chlorine,Pur,Waterguard)……………
|____| 4. Traditional herb……………………………………...
|____| 5. Pot filters……………………………………………..
|____|
5.
|____|
4.3a
|____|
6.
4.4 Where do you store water for drinking?
1. Open container / Jerrican 2. Closed container / Jerrican |____|
4.5 How much water did your household use YESTERDAY
(excluding for animals)?
(Ask the question in the number of 20 liter Jerrican and convert to liters
& write down the total quantity used in liters)
|____|
4.6 Do you pay for water?
1. Yes 2. No (If No skip to Question 4.7.1)
|____|
4.6.1 If yes, how much per 20 liters
jerrican _________ KSh/20ltrs
4.6.2 If paid per month
how much |____|
4.7.1a We would like to learn about where members of this
household wash their hands.
Can you please show me where members of your
household most often wash their hands?
Record result and observation.
OBSERVED
FIXED FACILITY OBSERVED (SINK / TAP)
IN DWELLING ...................................................... 1
IN YARD /PLOT.................................................... 2
MOBILE OBJECT OBSERVED
(BUCKET / JUG / KETTLE) ......................... 3
NOT OBSERVED
NO HANDWASHING PLACE IN DWELLING /
4.7.1b Is soap or detergent or ash/mud/sand present at the
place for handwashing?
YES, PRESENT ......................................................... 1
NO, NOT PRESENT .............................. ……………………2

Page 63 of 81
YARD / PLOT ................................................ 4
NO PERMISSION TO SEE ...................................... 5
4.7.1 Yesterday (within last 24 hours) at what instances did you wash your hands? (MULTIPLE RESPONSE- (Use 1 if “Yes”
and 2 if “No”)
1. After toilet……………………………………………………………………………………………………………… 2. Before cooking………………………………………………………………………………………………………... 3. Before eating…………………………………………………………………………………………………………. 4. After taking children to the toilet……………………………………………………………………………………. 5. Others………………………………………………………………………………………………………………….
|____|
|____|
|____|
|____|
|____|
4.7.2 If the caregiver washes her hands, then probe further; what did you use to wash your hands?
1. Only water 2. Soap and water 3. Soap when I can afford it 4. traditional herb 5. Any other specify |____|
4.8 What kind of toilet facility do members of your
household usually use?
If ‘Flush’ or ‘Pour flush’, probe:
Where does it flush to?
If not possible to determine, ask permission to
observe the facility.
flush / pour flush
flush to piped sewer system 11
flush to septic tank 12
flush to pit latrine 13
flush to open drain 14
flush to DK where 18
|____|

Page 64 of 81
pit latrine
ventilated improved pit
latrine 21
pit latrine with slab 22
pit latrine without slab /
open pit 23
composting toilet 31
bucket 41
hanging toilet /
hanging latrine 51
no facility / bush / field 95
1. OTHER (specify) 96

Page 65 of 81
5.0: Food frequency and Household Dietary Diversity
*Type of food* Did members of
your household
consume any food
from these food
groups in the last 7
days?(food must
have been
cooked/served at the
household)
0-No
1-Yes
If yes, mark days the food was consumed in the last
7 days?
0-No
1-Yes
What was the
main source of the
dominant food
item consumed in
the HHD?
1.Own
production
2.Purchase
3.Gifts from
friends/families
4.Food aid
5.Traded or
Bartered
6.Borrowed
7.Gathering/wild
fruits
8.Other (specify)
WOMEN DIETARY DIVERSITY
ONLY FOR WOMEN AGE 15 TO 49
YEARS. REFER TO THE
HOUSEHOLD DEMOGRAPHICS
SECTION Q2.3 AND Q2.5
Please describe the foods that
you ate or drank yesterday
during day and night at home or
outside the home (start with the
first food or drink of the
morning)
0-No
1-Yes
D1 D2 D 3 D 4 D5 D 6 D7 TOTA
L
Woma
n
ID……
…
Woma
n
ID…
…..
Woma
n ID
…….
Wom
an
ID…
…..
5.1. Cereals and cereal
products (e.g. sorghum,
maize, spaghetti, pasta,
anjera, bread)?
5.2. Vitamin A rich vegetables and tubers: Pumpkins, carrots, orange sweet potatoes

Page 66 of 81
5.3. White tubers and roots: White potatoes, white yams, cassava, or foods made from roots
5.4 Dark green leafy vegetables: Dark green leafy vegetables, including wild ones + locally available vitamin A rich leaves such as cassava leaves etc.
5.5 Other vegetables (e.g., tomatoes, egg plant, onions)?
5.6. Vitamin A rich fruits: + other locally available vitamin A rich fruits
5.7 Other fruits
5.8 Organ meat (iron rich): Liver, kidney, heart or other organ meats or blood based foods
5.9. Flesh meats and offals: Meat, poultry, offal (e.g. goat/camel meat, beef; chicken/poultry)?
5.10 Eggs?
5.11 Fish: Fresh or dries fish or shellfish
5.12 Pulses/legumes, nuts (e.g. beans, lentils, green grams, cowpeas)?
5.13 Milk and milk products (e.g.

Page 67 of 81
goat/camel/ fermented milk, milk powder)?
5.14 Oils/fats (e.g. cooking fat or oil, butter, ghee, margarine)?
5.15 Sweets: Sugar, honey, sweetened soda or sugary foods such as chocolates, sweets or candies
5.16 Condiments, spices and beverages:

Page 68 of 81
4.1 FOOD FORTIFICATION (FF)/- Please ask the respondent and indicate the appropriate number in the space provided
1.1
1.1.
1
Have you heard about food fortification?
1. Yes 2. No 3. Don’t know
If yes, where did you hear or learn about it? (MULTIPLE RESPONSE ARE POSSIBLE-
(Use 1 if “Yes” and 2 if “No”)
6. Radio……………………………………………………………………………………………………………… 7. Road
show………………………………………………………………………………………………………... 8. In a training session
attended……………………………………………………………………………………. 9. On a TV show……………………………………………………………………………………. 10. Others………………………………………………………………………………………………………………
….
|____|
|____|
|____|
|____|
|____|
6. COPING STRATEGIES INDEX
Frequency score:
Number of days out of the
past seven (0 -7).
In the past 7 DAYS, have there been times when you did not have enough food or money to buy food?
If No; END THE INTERVIEW AND THANK THE RESPONDENT
If YES, how often has your household had to: (INDICATE THE SCORE IN THE SPACE PROVIDED)
1 Rely on less preferred and less expensive foods?
2 Borrow food, or rely on help from a friend or relative?
3 Limit portion size at mealtimes?
4 Restrict consumption by adults in order for small children to eat?
5 Reduce number of meals eaten in a day?
TOTAL HOUSEHOLD SCORE:
END THE INTERVIEW AND THANK THE RESPONDENT

Page 69 of 81
1.2 Respondent’s knowledge on the food
fortification logo (Show the food
fortification logo to the respondent and
record the response). Do you know about
this sign?
1. Yes 2. No 3. Don’t know
|____|
1.3 What is the MAIN source of Maize flour for
the household NOW?
2. Bought from the shops, supermarket e.t.c
3. Maize is taken for milling at a nearby Posho Mill
4. Bought from a nearby Posho Mill 5. Other (Please specify)
|______________________________|
1.1b Do you know if the maize flour
you consume is fortified or not?
1. Yes 2. No 3. Don’t know
1.4 What brands of the following foods does
your household consume?
1. Maize flour 2. Wheat flour 3. Margarine 4. Oils 5. Fats 6. Sugar
|______________________________
__|
|______________________________
__|
|______________________________
__|
|______________________________
__|
|______________________________
__|
|______________________________
__|