smart beta included, and how they are weighted in the portfolio, smart beta helps investors to...
TRANSCRIPT

A SMARTER WAY TO
BUY THE MARKET
smart betaFOR PROFESSIONAL CLIENTS ONLY This document is for the exclusive use of investors acting on their own account and categorized either as “eligible counterparties” or “professional clients” within the meaning of Markets in Financial Instruments Directive 2004/39/EC. It is not directed at retail clients. In Switzerland, it is directed exclusively at qualified investors

smart beta
2<<
Active management
Strategic exposure
IntroductIon
The age-old debate of active versus passive has occupied the minds of investors for many years. However, with the rise of Smart Beta, investors can now get the best of both worlds: the low cost, transparent and systematic nature of passive investing, and the strategic stock selection principles of an active fund.
ThE dAwN OF TRACkINg 2.0The growing popularity of passive investing has been driven by the desire to reduce cost, and improve transparency within a portfolio. With access to everything from developed
to emerging markets; from bonds, to higher risk equities or commodities, investors of all types, sizes and risk appetites are using passives as part of a diversified portfolio.
However, for some investors, simply buying the market is not enough. They don’t want to track the market passively, they want to outperform it, or exploit a particular nuance or inefficiency. Traditionally this has been the domain of the active fund manager who seeks to deliver additional performance through their strategic selection skills.
Smart Beta has emerged as a genuine alternative to both. It is founded on
Smart BetaRules-based
strategic exposure
Passive investing
Efficient market exposure
the principles of passive management but adds an additional, more strategic approach to stock selection. By being more selective about the stocks that are included, and how they are weighted in the portfolio, Smart Beta helps investors to target a specific risk profile or objective.

smart beta
>>3
which have historically outperformed companies in more precarious financial positions. Smart Beta approaches can capture these factors without the cost of an active manager.
Historically, Smart Beta products have only been accessible to major institutional investors, such as giant pension funds or exclusive private banks, which can allocate large amounts of money. In recent years, however, Smart Beta exchange traded funds have been developed and launched for investors with much more modest portfolios.
Total assets under management in European Smart Beta ETFs hit €15.1
Per
form
ance
Time
PERFORmANCE ABOvE BETA: ALPhA
Alpha
Beta
whAT dO wE mEAN BY SmART BETA?In investment terms, beta is simply the return generated by the market: broadly, if for example the Euro Stoxx 50 goes up by 10%, then a pure beta tracker would be expected to go up by 10% too. Alpha, in contrast, is used to describe any returns above that market level, generated by an active manager’s skill.
Many academic studies, however, have established that much of this alpha is in fact attributable to specific factors or strategies. A straightforward example would be buying only the stocks with the strongest balance sheets in the market,

smart beta
4<<
billion (£11.5 billion) at the end of 2015, with €4.1 billion (£3.1 billion) of net new assets in 2014 alone, an increase of 49% from their level a year earlier1.
This guide will introduce Smart Beta and explain the role it can play in a portfolio. It will set out the advantages of Smart Beta, and describe how and why it works as an investment approach. It will also address how Smart Beta ETFs can be used to meet a specific objective. These objectives include the reduction of risk, the increase of diversification, the enhancement of returns and the improvement of income generation.
OBjECTIvE
CONTENTS
CHApTER 1: THE KEYS TO SMART BETA 5
CHApTER 2: ENHANCING RETURNS 9
CHApTER 3: REDUCING RISK 14
1Source: Lyxor Asset Management, Smart Beta Barometer December 2015
CHApTER 4: IMpROVING DIVERSIFICATION 18
CHApTER 5:TARGETING INCOME 21
CHApTER 6:WHY USE LYXOR? 25
Reduce Risk
Incr
ease Diversifi cation
Enhance Returns
Total Income

>>5
ThE kEYS TO SmART BETA
smart beta

smart beta
6<<
whY ChOOSE SmART BETA?Buying a simple index tracker has long been an easy way to invest, and over the long term, trackers have tended to perform well. However, there will always be times when the market as a whole is weak.
This is often attributable to specific sectors and industries. Take, for example, the rout of the energy sector, which was driven by plummeting oil prices. Investors who avoided the sector would have outperformed significantly, but those owning only traditional passive trackers could not do so, just as in 2008 when they would have been holding all the banks.
Those who do not wish to buy the entire market have instead tended to opt for actively managed funds. An astute manager may not have predicted the oil crash, but could at least have recognised it early and exited the sector.
The trouble is that, historically, few
80.5% of active funds have underperformed their benchmark over
the past 10 years2.
even the minority of managers who have generated alpha in the past cannot be relied upon to do so again in the future. according to data firm s&P dow Jones Indices, of 678 equity funds that were in their sector’s top quartile for their performance in the year to september 2013, only 4.3% managed to stay in that top quartile by the end of september 2015 (source: s&P Persistence scorecard, January 2016)
active managers have demonstrated an ability to beat the market in making such calls. Over the past five years, an average of 77% of active funds underperformed their benchmark; over the past 10 years – a full market cycle – 80.5% lagged their index2.
2Source: Lyxor, Market & Research – Active Funds vs Benchmark: Performance Comparison, 26 November 2015

smart beta
>>7
Even the minority of managers who have generated alpha in the past cannot be relied upon to do so again in the future. According to data firm S&P Dow Jones Indices, of 678 equity funds that were in their sector’s top quartile for their performance in the year to September 2013, only 4.3% managed to stay in that top quartile by the end of September 20153.
In part, active managers’ underperformance is due to the higher costs of their funds, which drag down returns. Whereas an active fund will charge around 1% a year in fees, passive funds can cost around 0.1-0.5%.
But active funds can also lag their index because it is simply very hard for anyone to predict accurately where the market will go. Many managers, for example, thought oil stocks would recover quickly. After all, fund managers are only human and can misinterpret information or make poor decisions.
Smart Beta tries to replicate strategies like those that have historically worked for active managers and completely new ones, but implement them in a more systematic and cost-efficient manner.
hOw dOES SmART BETA wORk?Smart Beta funds, like other passive products, in essence track an index of underlying securities, whether these are equities, bonds or commodities.
Where these indices are smart,
however, is in the way that they construct their portfolio. Traditional passive funds own their securities in proportion to their size in the index: the bigger the company or the amount of bonds issued, the greater the weight in the portfolio. The FTSE 100 index, for example, consists of the 100 largest businesses listed in the UK. The largest of them is currently HSBC, and it takes up 6.5% of the entire index4.
Smart Beta funds, in contrast, build their indices according to different sets of rules. A very basic one would be that each constituent has an equal weighting. In an equally weighted FTSE 100 fund, HSBC would be just a 1% position. This limits the risk that large individual stocks can skew the performance of the entire fund.
There are many other ways to construct a Smart Beta index, of course.
Weightingstrategies
Rules-based selection
SmART BETA
3Source: S&P Persistence Scorecard, January 2016. 4Source: FTSE International Limited. Data as of February, 2016.

smart beta
8<<
These typically weight the index in line with rules, which can be based upon a proven active strategy, or a completely new strategy that has not been considered before. Examples of such strategies, explored more fully in the next chapter, include investing only in the highest-quality companies, the cheapest companies, or the least volatile ones.
The real difference with Smart Beta is how that strategy is delivered. It is not at the discretion of an asset manager, but in adherence to a set of rules, which are clearly stated and based on verifiable financial metrics. A value strategy, for instance, would only buy stocks trading below a certain price-to-earnings or price-to-book ratio. Equally, it would always sell those stocks once they rose above that ratio, whereas an active manager may cling on to them.
Once these systematic rules are created, they are always followed.
This means investors always know what their Smart Beta fund is doing: they do not drift in style, unlike active managers who can stray from their core competency or mandate. Following these rules also saves money, as funds do not incur the expenses of intensively researching stocks on an ongoing basis.
USINg SmART BETA IN A PORTFOLIOSmart Beta does not guarantee that any strategy under its umbrella will always beat the market. But it does have a lot to offer investors who use it within their portfolios.
Most importantly, it allows investors to express specific views on the market in a direct and efficient manner. If the investor wishes to own less volatile stocks, a Smart Beta fund that follows risk-based rules will do so. A passive fund that tracks the whole of the market
will own the more volatile stocks too, while an active manager could decide against buying certain more stable shares.
Smart Beta ETFs also allow investors to express these views according to time horizons of their own choosing. ETFs are traded throughout the day, not once a day like mutual funds, so investors can use Smart Beta ETFs to implement and close tactical positions very quickly.
An investor expecting a strong but brief general equity rally following an economic data release, for example, could buy an ETF weighted to favour small cap or momentum stocks in the market an hour before the announcement and sell the ETF an hour later.
But using Smart Beta to boost returns only touches the surface of what such products can bring to a portfolio. The next chapter sets out how Smart Beta can meet many other investor objectives.

smart beta
>>9
smart beta
ENhANCINg RETURNS

smart beta
10<<
USINg SmART BETA TO ENhANCE RETURNSAs discussed, Smart Beta can be designed specifically with the aim of enhancing investors’ returns. The advent of factor ETFs means
that investors can replicate the strategies long used by active managers and supported by decades of academic evidence at a much lower cost.
Research across many equity markets and over many time periods
Ou
tper
form
ance
Th
e m
arke
t re
turn
Alpha
Beta
Real alpha
Beta
Stock selection LOw SIzEvALUEQUALITYLOw BETAmOmENTUmFactors
modern investors understand that most alpha is generated by certain factors, which can be systematically reproduced in rules-based strategies. ‘Real’ alpha is much rarer and often comes from identifying stock-specific risks.
ThE REAL SOURCE OF ALPhA
has identified five main ‘factors’ that have demonstrably added genuine alpha. By isolating these specific factors from within an equity universe like the MSCI Europe index, investors can potentially outperform the general
Other drivers

smart beta
>>11
FACTOR ThEORY CALCULATEd BY
vALUE Cheap stocks outperform expensive stocks over time
price-to-earnings ratio, price-to-book ratio, etc
SIzE Small stocks outperform large stocks over time Market capitalisation
QUALITY Stocks with strong balance sheets, growing profits, etc, outperform indebted, unprofitable stocks over time
Return on equity, profit margin, equity-to-debt ratio, etc
LOw BETA Stocks with low leverage to the market outperform over time
Beta relative to the index
mOmENTUm Stocks whose share prices have consistently risen for a given period of time are likely to keep rising
Returns over specified past period
market return (see table below).When building an index based on
these factors, each stock in the original broad market index is ranked according to the extent to which it exhibits the given factor. These rankings are then reviewed
in order to remove any sector bias. Following any removals, the top 10% of highest-ranking stocks are selected and each stock is weighted equally in the portfolio. By selecting only the top ranking stocks, Lyxor can provide higher
STARTINg UNIvERSE• MSCI Europe Index universe
of 440 stocks
STOCk SELECTION• Stocks ranked by factor score• Reviewed for sector bias• 40 stocks selected
RE-BALANCE• Re-balanced monthly• Equal stock weighting
SINgLE FACTOR SELECTION

smart beta
12<<
exposure to that factor. The indices are rebalanced every month according to the latest data.
Does it work? You can see from the chart below the additional performance that can be gained by adding a tactical
position using factors. In this case we look at the momentum factor which implies the selection of stocks according to their 12-month total return. The objective is to capture the trend of the market by investing in stocks,
which are rising fastest. The table on page 13 highlights
two important points for anyone considering adding factors to their portfolio. First, factors have consistently outperformed the
2000 2002 20122004 20102007 2015
0
100
200
300
400
500
MSCI Europe Momentum Net TR MSCI Europe Net TR JP Morgan Europe Momentum
2005 20082001 20062003 2009 2011 20142013
Source: J.P. Morgan. Past performance is no guarantee of future performance. Performance figures relate to the period from January 1st, 2000 to November 30th, 2015. Performance figures are inclusive of rebalancing adjustment factor of 0.04% but gross of any running fee.
INdEx PERFORmANCE OF mOmENTUm INdICES
smart beta
>>13
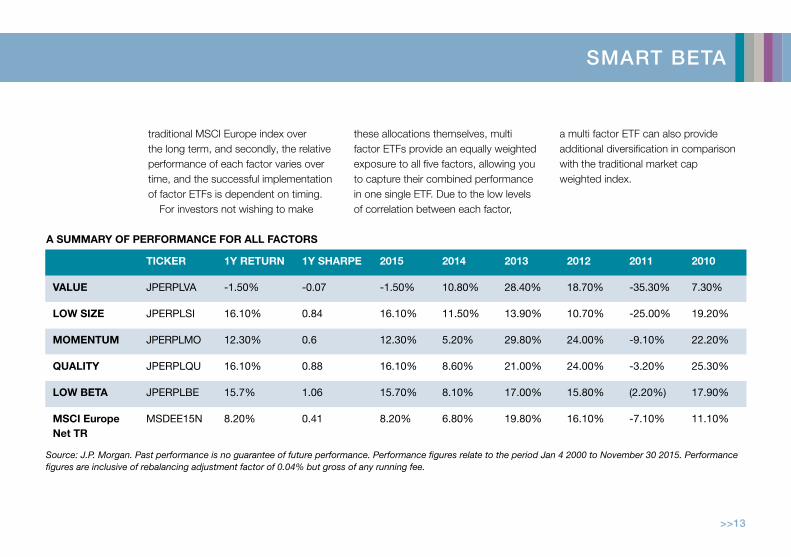
traditional MSCI Europe index over the long term, and secondly, the relative performance of each factor varies over time, and the successful implementation of factor ETFs is dependent on timing.
For investors not wishing to make
these allocations themselves, multi factor ETFs provide an equally weighted exposure to all five factors, allowing you to capture their combined performance in one single ETF. Due to the low levels of correlation between each factor,
Source: J.P. Morgan. Past performance is no guarantee of future performance. Performance figures relate to the period Jan 4 2000 to November 30 2015. Performance figures are inclusive of rebalancing adjustment factor of 0.04% but gross of any running fee.
TICkER 1Y RETURN 1Y ShARPE 2015 2014 2013 2012 2011 2010
vALUE JpERpLVA -1.50% -0.07 -1.50% 10.80% 28.40% 18.70% -35.30% 7.30%
LOw SIzE JpERpLSI 16.10% 0.84 16.10% 11.50% 13.90% 10.70% -25.00% 19.20%
mOmENTUm JpERpLMO 12.30% 0.6 12.30% 5.20% 29.80% 24.00% -9.10% 22.20%
QUALITY JpERpLQU 16.10% 0.88 16.10% 8.60% 21.00% 24.00% -3.20% 25.30%
LOw BETA JpERpLBE 15.7% 1.06 15.70% 8.10% 17.00% 15.80% (2.20%) 17.90%
mSCI Europe Net TR
MSDEE15N 8.20% 0.41 8.20% 6.80% 19.80% 16.10% -7.10% 11.10%
a multi factor ETF can also provide additional diversification in comparison with the traditional market cap weighted index.
A SUmmARY OF PERFORmANCE FOR ALL FACTORS

smart beta
14<<
REdUCINg RISk
smart beta

smart beta
>>15
USINg SmART BETA TO REdUCE RISkBeyond simply enhancing returns, Smart Beta products can also be used to reduce risk in a portfolio. This does not mean that they eliminate the possibility of loss. Rather, they are designed to reduce volatility and so smooth a portfolio’s returns. The important thing is doing this without deviating too much from the wider market, so investors can avoid concentration risk from too few stocks.
There are several ways of creating an index with lower volatility. One is simply to hold only the least volatile stocks in the market. This can work for long periods of time, but it has tended to bias portfolios towards certain sectors, such as utilities. Again, that creates unintended risks.
An alternative methodology is known as ‘minimum variance’. Instead of taking only individual stocks’ volatility
STARTINg UNIvERSE• FTSE All World Index
STOCk SELECTION• Daily volatility of each stock• Correlation between stocks
dIvERSIFICATION• Maximum stock weights• Maximum industry weights• Minimum holdings
STOCk SELECTION PROCESS

smart beta
16<<
into account, it factors in correlations between stocks. This helps to reduce the overall volatility of the portfolio, focusing on total risk management
rather than just individual stock volatility.Lyxor uses the FTSE Minimum
Variance index series to create such funds, with this process having
-10%
0%
10%
20%
30%
40%
2005 20152011
50%
FTSE Developed Europe Minimum Variance excess return over FTSE EuropeMSCI Europe Minimum Volatility excess return over MSCI EuropeStoxx Europe 600 Minimum Variance excess return over Stoxx Europe 600
2007 20132009
ExCESS RETURNS vS mARkET CAP: SmOOThER OUTPERFORmANCE
demonstrably cut portfolio volatility by 20-30%. As well as selecting the historically least volatile stocks in the market and minimising their correlation
Source: Lyxor Research. Data from 30/12/05 to 30/12/15. Past performance is not a reliable indicator of future returns

smart beta
>>17
to each other, the methodology caps any individual sector’s maximum weighting at 20% to reduce biases. The major difference with the FTSE strategy is the diversification target, which seeks to maintain approximately 60% of the original broad market index. This is
Source: Lyxor/Bloomberg. Data from 30/09/05 to 30/09/15. Past performance is not a reliable indicator of future performance.
considerably more than other minimum-variance approaches where as little as 30% of the original index universe can be maintained. The result for Lyxor is that risk is spread more broadly across a wider selection of stocks.
Does it work? The table above shows
how European minimum-variance products have consistently minimised volatility while also enhancing returns.
Diversified minimum variance ETFs are also available on US, all world and emerging market equities.
30/12/2005-31/12/2015 FTSE dEvELOPEd EUROPE mSCI EUROPE STOxx 600 EUROPE
mARkET CAP mIN vAR mARkET CAP mIN vAR* mARkET CAP mIN vAR
ANNUALISEd RETURN 4.99% 7.78% 4.21% 7.12% 5.24% 7.94%
ANNUALISEd vOLATILITY 20.20% 14.93% 20.04% 15.25% 20.23% 14.48%
vOLATILITY REdUCTION - 26.13% - 23.90% - 28.44%
ShARPE RATIO 0.20 0.46 0.17 0.41 0.21 0.49
wORST mONTh -12.81% -11.03% -12.76% -9.14% -13.18% -12.07%
NUmBER OF STOCkS AS AT dECEmBER 2015
523 346 448 151 600 140
% OF ORIgINAL UNIvERSE - 66.16% - 33.71% - 23.33%

smart beta
18<<
ImPROvINg dIvERSIFICATION
smart beta

smart beta
>>19
USINg SmART BETA TO ImPROvE dIvERSIFICATIONActive managers naturally create portfolios to reflect their sector and stock biases – that is what they are paid to do. But passive funds also contain biases to certain sectors and stocks – namely, the largest ones.
Traditional ’market cap’ indices weight each component according to the size of the underlying constituents, meaning investors in them are most exposed to the largest sectors and companies. For the MSCI Europe index, that means financials (22.6% of the index) and Nestlé (3% of the index). It also means less exposure to smaller companies5. In fact, approximately 20% of the stocks of a traditional index can make up 60 - 70% of the risk.
A Smart Beta methodology known as ‘equal risk contribution’ creates a more diversified portfolio. It owns all the same stocks as the broader index, but in proportions that spread risk more evenly between them rather than concentrating risk in the largest stocks.
The process achieves this by weighting stocks according to their volatility and correlation, instead of their size, but with every stock still represented. The least volatile stocks are the largest in the portfolio, although exposure to them is still small by market-cap standards. The largest position in the MSCI Europe Equal Risk
Contribution (ERC) index, for example, has a 1.5% weight5.
This creates a portfolio with a neutral risk balance: it is exposed equally not to each stock, but to each stock’s risk. Historically, this approach has increased exposure to smaller companies and boosted total returns by 2-3.5% whilst remaining consistent with the original benchmark index6. It has also been seen to reduce portfolio volatility by 8-10% compared with market-cap weighted indices.
Does it work? The table below shows how the MSCI Europe ERC index has outperformed the MSCI Europe index in recent years.
NET RETURNS 1 YEAR 5 YEAR 10 YEAR
mSCI EUROPE ERC INdEx -9.96% 7.21% 3.75%
mSCI EUROPE INdEx -13.43% 5.61% 2.77%
Sources: MSCI Inc. Data as of 29/02/16. Past performance is not a reliable indicator of future returns.
5Source: MSCI, as of 31 December 20156Source: Lyxor International Asset Management.

smart beta
20<<
INdEx PERFORmANCE OF mSCI EUROPE ERC vS mSCI EUROPE mARkET CAP
ERC Market Cap
2012 201520142013
80
160
140
100
120
Source: Lyxor International Asset Management. Past performance is not a reliable indicator of future performance.
STOCk wEIghTINg PROCESS
STARTINg UNIvERSE• All stocks of the original market
cap weighted index
OBSERvATIONS• Daily price volatility• Stock correlations
wEIghTINg• According to volatility and correlation• Re-weighted semi-annually

smart beta
>>21
TARgETINg INCOmE
smart beta

smart beta
22<<
USINg SmART BETA TO TARgET INCOmEWith interest rates and bond yields remaining exceptionally low by historic standards around the world, many investors who need to generate income
have turned to equities.However, equities are more volatile
than bonds and there are fewer guarantees with dividends than with bond coupon payments. Furthermore, investors chasing equity yields can be
forced into undesirable sectors and companies with unsustainable dividends. Income stalwarts, like banks before the 2008 crash, or the energy majors before the price of oil plummeted, can suddenly become imperilled.
50
100
150
200
250
300
350
MSCI Europe Minimum Volatility (in EUR) MSCI Europe High Yield (in EUR)MSCI Europe (in EUR) SG European Quality Income Index
2002 2004 2006 2008 2010 2012 2014 2016
Source: Lyxor International Asset Management. Data as of 09/04/02 to 29/01/16. Past performance is not a reliable indicator of future performance.
INdEx PERFORmANCE OF SgQE

smart beta
>>23
Smart Beta can provide a better way of capturing equity income, which can be an essential part of long term performance. The Société Générale Global Quality Income index series, for example, has been designed to focus
on high but sustainable yields.Developed over 10 years, the
selection process begins with 3,000 highly liquid non-financial stocks. The methodology then filters out those companies with low profitability, with
low operating efficiency, and with high leverage. It then excludes the 60% of the remaining stocks with the weakest balance sheets, and finally incorporates only those with a dividend yield of at least 4%. This creates a portfolio
STOCk SELECTION PROCESS
STARTINg UNIvERSE• Developed world equities
excluding financials (global or European)
STOCk SELECTION• 9-point quality assesment• Balance sheet strength test• Dividend yield above 4%
RE-BALANCE• Re-balanced quarterly• Equal stock weighting

24<<
of between 25 and 75 high-quality companies paying a high but sustainable dividend.
Does it work? As the table above shows, the Société Générale European Quality Income index has achieved a higher dividend yield than the MSCI
TOTAL RETURN (%) YIELd (%) ANNUALISEd vOLATILITY (%)
mAxImUm LOSS (%)
1 YEAR 10 YEAR 1 YEAR 10 YEAR 1 YEAR 10 YEAR 1 YEAR 10 YEAR
SgQE 16.18 120.15 3.73 72.35 17.1 15.75 13.77 46.86
mSCI EUROPE 12.64 65.11 2.85 42.08 19.72 19.96 17.0 58.54
mSCI EUROPE
hIgh YIELd 12.11 52.89 4.65 54.91 20.21 22.12 17.26 65.21
mSCI EUROPE mIN vOL
19.5 111.23 3.6 60.13 17.49 16.68 13.71 50.53
Europe High Dividend Yield index over the past 10-year period, while also minimising risk by holding higher-quality stocks. For example, the maximum drawdown of the Société Générale European Quality Income index has been lower than that of the MSCI
Source: SG Cross Asset Research\Equity Quant, Bloomberg * Performance shown prior to May 15, 2012 is a back-test. Performance does not include transaction costs. Past performance is not indicative of future performance
Europe Minimum Volatility index over both the past 10 years and is practically the same over 1 year.
Quality Income strategies are available on European or global equities, and can distribute or accumulate income.
smart beta

smart beta
>>25
whY USE LYxOR?
smart beta

smart beta
26<<
Lyxor has been a pioneer in the ETF market since 2001, when we launched our first ETF. Today, the group ranks amongst the top ETF providers in the world: we are number three in Europe and number seven in the world by assets under management. We are number two for liquidity in Europe with 20% of ETF trading and we are supported by a network of 45 authorised participants and 19 market makers.
Lyxor has also pioneered the development of Smart Beta, and now ranks number three in Europe for Smart Beta ETF assets. Since launching our first portfolios tracking Smart Beta indices in 2007, Lyxor has continuously invested in Smart Beta research, with a focus on risk-based portfolio construction, equal risk contribution, factor investing and other quantitative investment areas.
Lyxor employs portfolio managers
who specialise in dealing with the specific trading constraints of Smart Beta ETFs, and provides direct access to the authors of the original models underpinning our index-construction methodologies.
Lyxor also embraces open architecture, with the creation of our own proprietary Smart Beta strategies
– anchored on findings and publications from Lyxor Research since 2009 – as well as the third-party strategies we have carefully selected.
Lyxor maintained its commitment to the utmost quality in 2011 by formalising this commitment with the Lyxor ETF quality charter, which set new quality standards across four main areas.
2001: ThE YEAR wE LAUNChEd OUR FIRST ETF
ASSETS UNdER mANAgEmENT
3Rd LARgESTETF PROvIdER IN EUROPE BY AUm
ETFS LISTEd ON 13 ExChANgES gLOBALLY
€49bn
236
Source: Lyxor International Asset Management. Data as of March

smart beta
>>27
TO FINd OUT mORE vISITwww.LYxORETF.COm
Risk warning
It is important for potential investors to evaluate the risks described below and in the fund prospectus which can be found on www.lyxoretf.com
CApITAL AT RISK: ETFs are tracking instruments: Their risk profile is similar to a direct investment in the Underlying Index. Investors’ capital is fully at risk and investors may not get back the amount originally invested.
REpLICATION RISK: The fund objectives might not be reached due to unexpected events on the underlying markets which will impact the index calculation and the efficient fund replication.
COUNTERpARTY RISK: Investors are exposed to risks resulting from the use of an OTC Swap with Societe Generale. In-line with UCITS guidelines, the exposure to Societe Generale cannot exceed 10% of the total fund assets. physically replicated ETFs may have counterparty risk resulting from the use of a Securities Lending programme.
UNDERLYING RISK: The Underlying Index of a Lyxor ETF may be complex and volatile. When investing in commodities, the Underlying Index is calculated with reference to commodity futures contracts exposing the investor to a liquidity risk linked to costs such as cost of carry and transportation. ETFs exposed to Emerging Markets carry a greater risk of potential loss than investment in Developed Markets as they are exposed to a wide range of unpredictable Emerging Market risks.
CURRENCY RISK: ETFs may be exposed to currency risk if the ETF is denominated in a currency different to that of the Underlying Index they are tracking. This means that exchange rate fluctuations could have a negative or positive effect on returns.
LIQUIDITY RISK: Liquidity is provided by registered market-makers on the respective stock exchange where the ETF is listed, including Societe Generale. On exchange liquidity may be limited as a result of a suspension in the underlying market represented by the Underlying Index tracked by the ETF; a failure in the systems of one of the relevant stock exchanges, Societe Generale or other market-maker systems; or an abnormal trading situation or event.
Photographs by © iStock, © Shutterstock, Image: Alamy

smart beta
In accordance with miFId as implemented in France and applicable to Lyxor International Asset management, this publication should be treated as a marketing communication providing general investment recommendations. This document has not been prepared in accordance with regulatory provisions designed to promote the independence of investment research.This document is for the exclusive use of investors acting on their own account and categorized either as “eligible counterparties” or “professional clients” within the meaning of markets in Financial Instruments directive 2004/39/EC. It is not directed at retail clients. In Switzerland, it is directed exclusively at qualified investors.
This document is of a commercial nature. It is each investor’s responsibility to ascertain that they are authorised to subscribe, or invest into this product. prior to investing in the product, investors should seek independent financial, tax, accounting and legal advice. Lyxor UCITS ETFs are French or Luxembourg open ended mutual investment funds respectively approved by the French Autorité des Marchés Financiers or by the Luxembourg Commission de Surveillance du Secteur Financier, and authorized for marketing of their units or shares in various European countries (the Marketing Countries) pursuant to the article 93 of the 2009/65/EC Directive. Société Générale and Lyxor International Asset Management (LIAM) recommend that investors read carefully the “risk factors” section of the product’s prospectus and the “Risk and reward” section of the Key Investor Information Document (KIID). The prospectus in French for French Lyxor UCITS ETFs and in English for Luxembourg Lyxor UCITS ETFs and the KIID in the local languages of the Marketing Countries are available free of charge on www.lyxoretf.com or upon request to [email protected]. Updated composition of the product’s investment portfolio is available on www.lyxoretf.com. Indicative net asset value is published on the Reuters and Bloomberg pages of the products, and might also be mentioned on the websites of the stock exchanges where the product is listed. The products are the object of market-making contracts, the purpose of which is to ensure the liquidity of the products on the exchange, assuming normal market conditions and normally functioning computer systems. Units of a specific UCITS ETF managed by an asset manager and purchased on the secondary market cannot usually be sold directly back to the asset manager itself. Investors must buy and sell units on a secondary market with the assistance of an intermediary (e.g. a stockbroker) and may incur fees for doing so. In addition, investors may pay more than the current net asset value when buying units and may receive less than the current net asset value when selling them.These products include a risk of capital loss. The redemption value of these products may be less than the amount initially invested. In a worst case scenario, investors could sustain the loss of their entire investment. The indexes and the trademarks used in this document are the intellectual property of index sponsors and/or its licensors. The indexes are used under license from index sponsors. The Funds based on the indexes are in no way sponsored, endorsed, sold or promoted by index sponsors and/or its licensors and neither index sponsors nor its licensors shall have any liability with respect thereto. The indices referred to herein (the “Index”) are not sponsored, approved or sold by Société Générale or LIAM. Société Générale and LIAM shall not assume any responsibility in this respect. The accuracy, completeness or relevance of the information which has been drawn from external sources is not guaranteed although it is drawn from sources reasonably believed to be reliable. Subject to any applicable law, Société Générale and LIAM shall not assume any liability in this respect. This document does not constitute an offer for sale of securities in the United States of America. Units or shares of the UCITS ETF have not been and will not be registered under the United States Securities Act of 1933 (as amended) or the securities laws of any of the States of the United States. Units or shares may not be offered, sold or delivered directly or indirectly in the United States, or to or for the account or benefit of any “US person”. Any re-offer or resale of any units or shares in the United States or to US persons may constitute a violation of US law. The UCITS ETFs will not be registered under the United States Investment Company Act of 1940, as amended. Applicants for units or shares will be required to certify that they are not US persons.This document does not constitute an offer, or an invitation to make an offer, from Société Générale, LIAM or any of their respective subsidiaries to purchase or sell the product referred to herein.Société Générale is a French credit institution (bank) authorised by the Autorité de contrôle prudentiel et de résolution (the French prudential Control Authority). Lyxor International Asset Management (LIAM) is a French investment management company authorized by the Autorité des marchés financiers and placed under the regulations of the UCITS Directive (2009/65/CE).
Notice to investors in the United kingdom: This material is issued in the United kingdom by Lyxor Asset management Uk LLP, which is authorized and regulated by the Financial Conduct Authority in the Uk under Registration Number 435658Notice to investors in Switzerland: This document is directed exclusively at qualified investors in Switzerland. Some of the UCITS ETFs presented herein are not authorized for the offer and distribution to non qualified investors in Switzerland or from Switzerland. To verify the authorisation status of the UCITS ETFs presented herein, please contact [email protected]
Regarding UCITS ETFs authorized for the offer and distribution in Switzerland or from Switzerland: This document and the information contained therein do not constitute an issue prospectus according to articles 652a and 1156 of the Swiss Code of Obligations (“CO”) or a listing prospectus according the Listing Rules of the SIX Swiss Exchange. The products are authorized for the offer and distribution in Switzerland or from Switzerland pursuant to the Swiss Federal Act on Collective Investment Schemes (CISA). The Swiss Financial Market Supervisory Authority FINMA has authorized Société Générale, Zurich Branch (Talacker 50, Case postale 1928, 8021 Zürich), to act as Swiss Representative and paying Agent of the Funds in Switzerland. The product’s documentation (prospectus, KIID, articles of association, annual and semi-annual reports) can be obtained free of charge at the Swiss representative’s office.
Regarding UCITS ETFs NOT authorized for the offer and distribution in Switzerland or from Switzerland: The products presented herein have not been and will not be registered with, or approved by, the Swiss Financial Market Supervisory Authority FINMA (FINMA) for the distribution to non-qualified investors under the Swiss Federal Act on Collective Investment Schemes (CISA). Therefore, the information presented herein or in the fund’s legal documentation does not necessarily comply with the information standards required by FINMA in the case of distribution of collective investment schemes to non-qualified investors. The products must not be distributed to non-qualified investors in or from Switzerland, and may be distributed exclusively to Qualified Investors as defined in article 10 of the CISA and related provisions in the Swiss Federal Ordinance on Collective Investment Schemes (CISO) in strict compliance with applicable Swiss law and related regulations. This document is personal and does not constitute an offer to any person. This document must be distributed or otherwise made available in Switzerland only and exclusively to Qualified Investors, without distribution or marketing to non-qualified investors in or from Switzerland. This document may be used only by those Qualified Investors to whom it has been handed out in connection with the offering described therein, and it may neither be distributed nor made available to other persons without the express consent of LIAM or Société Générale. It may not be used in connection with any other distribution and shall in particular not be copied and/or distributed to non-qualified investors in Switzerland or in any other country. This document, or the information contained therein, does not constitute a prospectus as such term is understood pursuant to article 652a or article 1156 of the Swiss Code of Obligations or a listing prospectus pursuant to the listing rules of the SIX Swiss Exchange or any other exchange or regulated trading facility in Switzerland or a simplified prospectus, a key information for investors document, or a prospectus, as such terms are defined in the CISA. The product’s documentation (prospectus, KIID, articles of association, annual and semi-annual reports) can be obtained free of charge at the office of Société Générale, Zurich Branch (Talacker 50, Case postale 1928, 8021 Zürich), Swiss Representative and paying Agent of the product in Switzerland.