smart grid regional business case for the pacific … 1 smart grid regional business case for the...
TRANSCRIPT
Page 1
Smart Grid
Regional Business Case
for the
Pacific Northwest
Results & Analysis
Prepared for:
Bonneville Power Administration
September 30, 2015
Approved for Public Release
Navigant Authorship & Analysis Team
Erik Gilbert
Robin Maslowski
Tim Stanton
Thomas Wells
Kevin Cooney
Navigant Consulting, Inc.
1375 Walnut Street
Suite 200
Boulder, CO 80302
303.728.2536
navigant.com

Page 2
Acknowledgements
Development of the Regional Business Case (RBC) analysis has benefited by input and review from numerous
stakeholders and interested parties in a range of organizations in the Pacific Northwest. Discussions about smart
grid functions and their analysis inputs are too numerous to list individually; however, various people have
contributed in a number of ways, including providing input data and assumptions, commenting on draft analyses,
providing reactions to initial results, and asking key clarifying questions about the analysis. Throughout this
process, a wide range of perspectives and, in some cases, strong opinions have been provided. It is important to
recognize these reviewers, contributors, and collaborators.
We have synthesized the input in a manner consistent with the purpose and scope of the RBC project. Views,
assumptions, and results presented in this white paper are not necessarily agreed upon or endorsed by the
contributors and reviewers noted below. Nonetheless, Navigant would like to thank the following people for input,
assistance, and participation throughout the RBC process—starting as early as 2009 and continuing through the
update presented here.
Bonneville Power Administration (BPA) Smart Grid and DR Project Team—The following members of this team
provided leadership, guidance, and direction throughout the RBC development process:
Stephanie Vasquez, BPA; Melanie Smith, BPA; Lee Hall, BPA; Frank Brown, BPA; Thomas Brim, ACME
Business Consulting, LLC; Cara Ford, First Tek; Thor Hinckley, formerly Aerotek; Jason Gates, formerly
ACME Business Consulting
Contributors—The following people made contributions to the input data, assumptions, methodologies, and other
aspects of the analysis:
Ehud Adabi, BPA; Stephanie Adams, BPA; Kyna Alders, BPA; Brent Barclay, BPA; Juergen Bermejo, BPA;
Mark Bielecki, Navigant Consulting, Inc. (Navigant); Paul Boyd, Battelle Memorial Institute (Battelle); Steve
Brooks, BPA; Lawrence Carter, BPA; Ken Corum, formerly Northwest Power and Conservation Council
(NPCC); Ryan Ederdahl, BPA; Stephen Elbert, Battelle; Trishan Esram, Battelle; Ryan Fedie, BPA; Lauren
Gage, BPA; Christopher Gilbert, BPA Don Hammerstrom, Battelle; Allegra Hodges, BPA; Phillip Kelsven,
David Evans Associates; Tony Koch, BPA; Dmitry Kosterev, BPA; Ben Kujala, NPCC; Colette LaMontagne,
Navigant; Nick Leitschuh, BPA; Alexander Lennox, BPA; Scott Lissit, BPA; Ron Melton, Battelle; Robert
Petty, BPA; Jon Poor, formerly Navigant; Rob Pratt, Battelle; Cherilyn Randall, BPA; Brad Rogers, formerly
Navigant; Katherine Pruder Scruggs, BPA; Ruchi Singh, formerly Battelle; Forrest Small, formerly
Navigant; Peter Stiffler, BPA; Todd Taylor, Battelle; Dan Violette, Navigant; Danielle Walker, BPA: David
Walls, Navigant; Chris Wassmer, formerly Navigant; Robert Weber, BPA; Cory Welch, Navigant; Jennifer
Williamson, VanderHouwen and Associates; Scott Winner, BPA
Reviewers—The following people provided guidance and critique:
Charlie Black, formerly NPCC; Diane Broad, formerly Ecofys; Mike Charlo, Milton-Freewater; Joey Currie,
City of Port Angeles; Greg Delwiche, BPA; Mike DeWolf, BPA; Bill Drummond, BPA; Lauren Gage, BPA;
Richard Genece, BPA; Massoud Jourabchi, NPCC; Robert Kajfasz, City of Port Angeles; Phil Lusk, City of
Port Angeles; Elliot Mainzer, BPA; Karen Meadows, formerly BPA; Mark Miller, BPA; Terry Oliver, BPA;
Pete Pengilly, Idaho Power; Mike Weedall, formerly BPA; John Wellschlager, BPA: Steve Wright, formerly
BPA
The work presented in this white paper represents our best efforts and judgments based on the information available at the time
this report was prepared. Navigant Consulting, Inc. is not responsible for the reader’s use of, or reliance upon, the report, nor
any decisions based on the report. NAVIGANT CONSULTING, INC. MAKES NO REPRESENTATIONS OR
WARRANTIES, EXPRESSED OR IMPLIED. Readers of the report are advised that they assume all liabilities incurred by
them or third parties as a result of their reliance on the report or the data, information, findings, and opinions contained in the
report.
Page 3
Table of Contents
Executive Summary ................................................................................................................... 4
1 Introduction ..................................................................................................................... 18
1.1 Purpose of the RBC ........................................................................................................................... 18 1.2 Development Process ....................................................................................................................... 19 1.3 Scope of Analysis .............................................................................................................................. 20 1.4 Relationship to the PNW Demonstration Project ......................................................................... 21 1.5 Methodological Considerations ...................................................................................................... 21 1.6 Relationship to the Interim RBC ..................................................................................................... 22 1.7 Organization of this White Paper ................................................................................................... 23
2 Overall Value of Smart Grid to the Pacific Northwest ............................................ 24
2.1 Smart Grid Investment Looks Promising Overall ........................................................................ 24 2.2 Investment Outlook Varies by Category, but Is Generally Positive .......................................... 27
3 Promising Findings and Insights from Investment Category Analysis ............... 34
3.1 T&D Optimization and Grid Reliability Deliver the Majority of the Value .............................. 34 3.2 Smart DR Can Provide Flexible Response to Changing Grid Conditions................................. 49 3.3 Smart Grid Can Boost Energy Efficiency Results in Selected Areas .......................................... 58 3.4 Energy Storage Net Benefits Rely on Steep Cost Declines .......................................................... 61 3.5 Estimated Changes to Revenue Requirements Are Mixed ......................................................... 63
4 Regional “What If” Scenarios ....................................................................................... 67
4.1 Storage Cost Breakthrough Is Key to Unlocking Storage Value ................................................. 67 4.2 Acceleration of Home and Building Automation Enhance DR and EE .................................... 68 4.3 Smart Grid Value Differs for In-Region Versus Imported Renewable Energy......................... 69
5 Takeaways and Looking Forward................................................................................ 72
5.1 Summary of RBC Findings .............................................................................................................. 72 5.2 Planning for Smart Grid Investments ............................................................................................ 73 5.3 The RBC Looking Forward .............................................................................................................. 74
Project History ............................................................................................ 76
Methodology Summary ............................................................................ 79
List of Analysis Input Sources ................................................................ 91
Analysis Update: Selected Details .......................................................... 97

Page 4
Executive Summary
This white paper presents results and findings from the Pacific Northwest Smart Grid Regional Business
Case (RBC). The RBC effort was sponsored and managed by the Bonneville Power Administration
(BPA), and was developed with input from a number of regional entities, including the Northwest
Power and Conservation Council (NPCC) and the Pacific Northwest Smart Grid Demonstration Project
(PNW-SGDP), which was managed by the Battelle Memorial Institute (Battelle). The RBC incorporates
input from regional utilities and other regional stakeholders as well as findings from smart grid studies
nationwide. The RBC analysis presented here is an update to the prior analysis, the Smart Grid RBC for
the Pacific Northwest, Interim Results and Analysis, which was released in 2013.
The smart grid, which uses two-way communications and automated intelligence to enhance the traditional
electricity delivery system, promises many benefits for the Pacific Northwest, including:
better reliability
more efficient and flexible operation of the grid
lower rates
reduced carbon emissions
Although many new technologies have been successfully demonstrated and shown promising results,
many benefits are still unproven. Furthermore, stakeholders still have limited experience with the
emerging technologies and capabilities enabled by smart grid investments. Utilities and regulators will
rightly approach these grid modernization investments with caution until the technologies, investment
risks, and business case are more clearly understood.
The RBC assesses the benefits, costs, and risks of a comprehensive regional smart grid deployment in the
Pacific Northwest, shown in Figure ES.1. The analysis results presented in this white paper are intended
to provide better information to regional decision makers seeking to make policy and grid investment
decisions.
Figure ES.1. Map of the Pacific Northwest Region1 Considered in the RBC
1 http://www.bpa.gov/news/pubs/maps/Tlines_Dams_SAB.pdf.

Page 5
BPA chose to develop the RBC in pursuit of its stated values: trustworthy stewardship of the region’s
resources, a collaborative approach to relationships, and operational excellence. The promised benefits of
the smart grid align with BPA’s strategic objectives, which include system reliability, low rates,
environmental stewardship, and regional accountability.
The RBC is intended to help regional stakeholders understand and minimize risks while facilitating
appropriate investment decisions for specific smart grid technologies. BPA specifically called for an
approach that is grounded in real-world data and demonstration results and avoids hyperbole. BPA
chose to pursue a bottom-up methodology to better explore specific technologies and grid impacts. The
bottom-up approach developed for this project allows inputs and data to be updated as they become
available. The analysis presented here has been updated with new inputs and data from the region and
in particular with a number of inputs from the Pacific Northwest Smart Grid Demonstration Project.
The detailed smart grid benefit-cost framework that was developed for this effort is implemented within
a computational model that calculates the relevant benefits and costs (see Appendix B for more detail).
The RBC analysis assumes a comprehensive deployment of smart grid capabilities across the region over
a 30 year period. This white paper provides a selection of notable findings and insights gained from the
analysis process and outputs. It first presents the overall results for the smart grid, and then breaks the
results into six investment categories (described below) and examines the results of each. The white
paper also takes a deeper dive into several specific technology areas that were initially selected for more
detailed analysis and presents several scenarios that were suggested by BPA and are considered
important to future decision-making in the region.
More detail on the project history, approach, investment categories, and methodology2 are provided in
the appendices.
2 See Appendix B.5 for additional methodological discussion.
Page 6
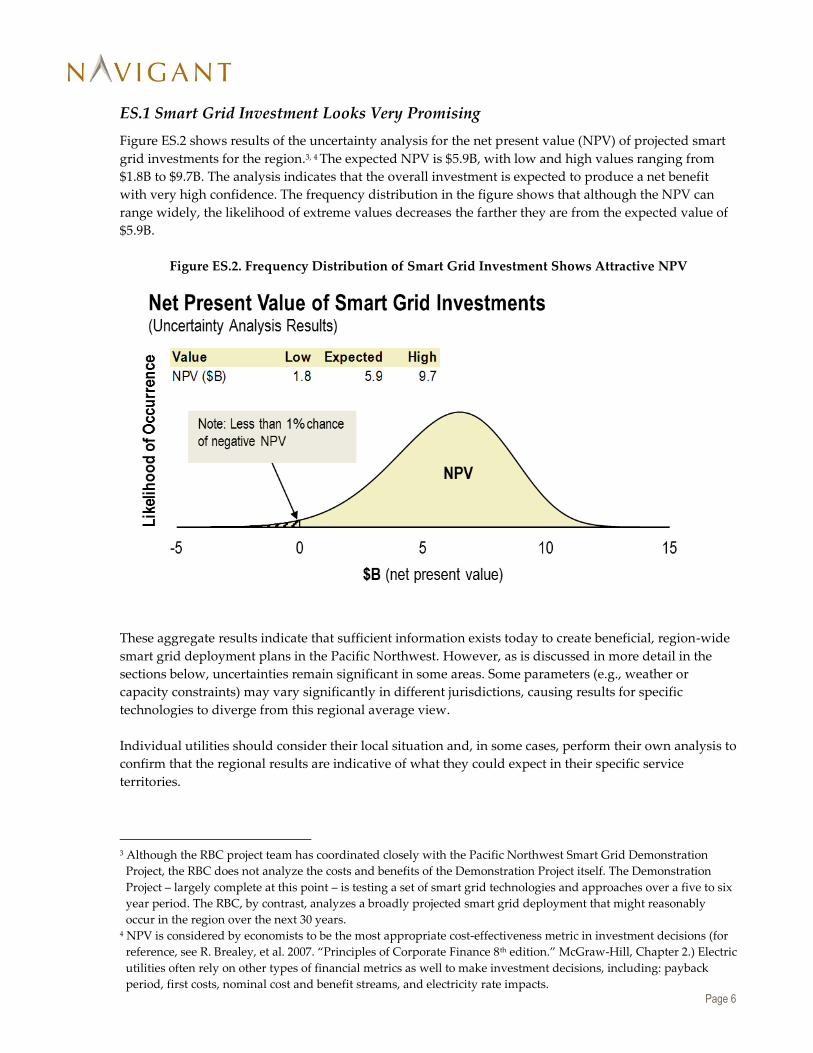
ES.1 Smart Grid Investment Looks Very Promising
Figure ES.2 shows results of the uncertainty analysis for the net present value (NPV) of projected smart
grid investments for the region.3, 4 The expected NPV is $5.9B, with low and high values ranging from
$1.8B to $9.7B. The analysis indicates that the overall investment is expected to produce a net benefit
with very high confidence. The frequency distribution in the figure shows that although the NPV can
range widely, the likelihood of extreme values decreases the farther they are from the expected value of
$5.9B.
Figure ES.2. Frequency Distribution of Smart Grid Investment Shows Attractive NPV
These aggregate results indicate that sufficient information exists today to create beneficial, region-wide
smart grid deployment plans in the Pacific Northwest. However, as is discussed in more detail in the
sections below, uncertainties remain significant in some areas. Some parameters (e.g., weather or
capacity constraints) may vary significantly in different jurisdictions, causing results for specific
technologies to diverge from this regional average view.
Individual utilities should consider their local situation and, in some cases, perform their own analysis to
confirm that the regional results are indicative of what they could expect in their specific service
territories.
3 Although the RBC project team has coordinated closely with the Pacific Northwest Smart Grid Demonstration
Project, the RBC does not analyze the costs and benefits of the Demonstration Project itself. The Demonstration
Project – largely complete at this point – is testing a set of smart grid technologies and approaches over a five to six
year period. The RBC, by contrast, analyzes a broadly projected smart grid deployment that might reasonably
occur in the region over the next 30 years. 4 NPV is considered by economists to be the most appropriate cost-effectiveness metric in investment decisions (for
reference, see R. Brealey, et al. 2007. “Principles of Corporate Finance 8th edition.” McGraw-Hill, Chapter 2.) Electric
utilities often rely on other types of financial metrics as well to make investment decisions, including: payback
period, first costs, nominal cost and benefit streams, and electricity rate impacts.
Page 7
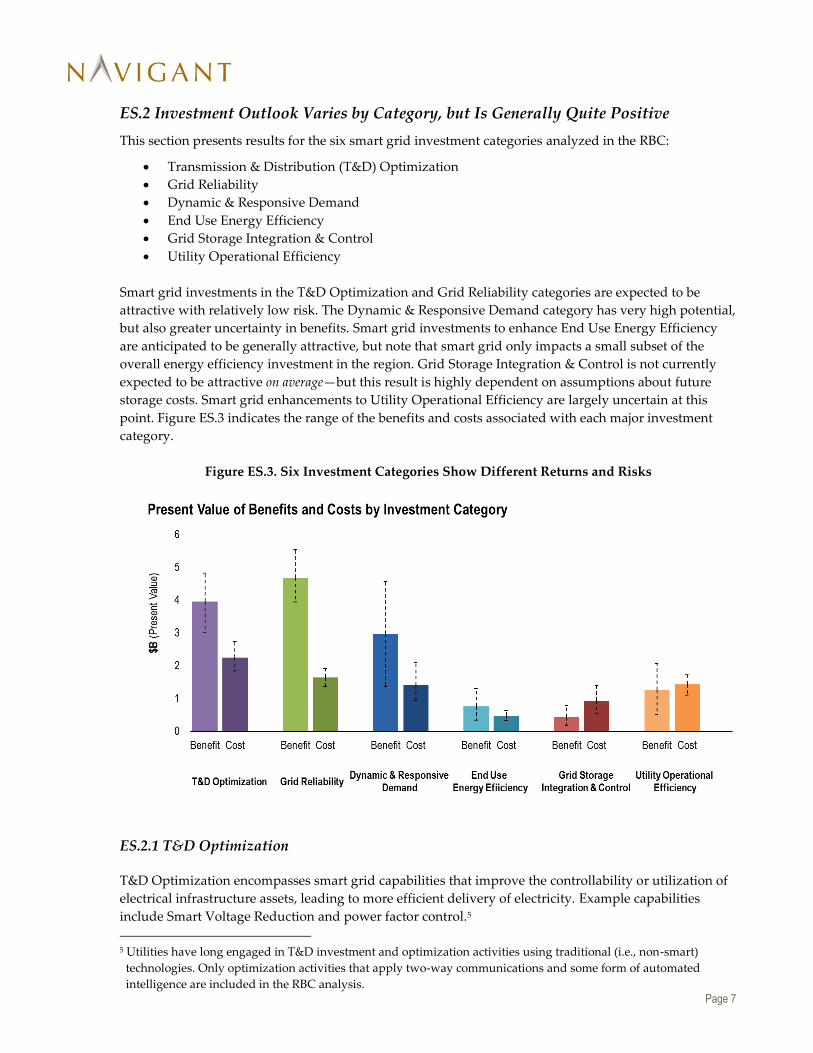
ES.2 Investment Outlook Varies by Category, but Is Generally Quite Positive
This section presents results for the six smart grid investment categories analyzed in the RBC:
Transmission & Distribution (T&D) Optimization
Grid Reliability
Dynamic & Responsive Demand
End Use Energy Efficiency
Grid Storage Integration & Control
Utility Operational Efficiency
Smart grid investments in the T&D Optimization and Grid Reliability categories are expected to be
attractive with relatively low risk. The Dynamic & Responsive Demand category has very high potential,
but also greater uncertainty in benefits. Smart grid investments to enhance End Use Energy Efficiency
are anticipated to be generally attractive, but note that smart grid only impacts a small subset of the
overall energy efficiency investment in the region. Grid Storage Integration & Control is not currently
expected to be attractive on average—but this result is highly dependent on assumptions about future
storage costs. Smart grid enhancements to Utility Operational Efficiency are largely uncertain at this
point. Figure ES.3 indicates the range of the benefits and costs associated with each major investment
category.
Figure ES.3. Six Investment Categories Show Different Returns and Risks
ES.2.1 T&D Optimization
T&D Optimization encompasses smart grid capabilities that improve the controllability or utilization of
electrical infrastructure assets, leading to more efficient delivery of electricity. Example capabilities
include Smart Voltage Reduction and power factor control.5
5 Utilities have long engaged in T&D investment and optimization activities using traditional (i.e., non-smart)
technologies. Only optimization activities that apply two-way communications and some form of automated
intelligence are included in the RBC analysis.

Page 8
T&D Optimization benefits tend to be fairly well understood compared to other investment categories.
Some of the largest uncertainties occur in the areas of system and operational integration costs.
ES.2.2 Grid Reliability
Grid Reliability encompasses smart grid capabilities that reduce the likelihood, duration, or geographic
extent of electricity service interruption and maintain or improve the quality of delivered power.
Example capabilities include fault location, isolation, and service restoration (FLISR); enhanced fault
prevention; and wide-area monitoring (WAM).
Many technologies that improve reliability are already proven, but results can still vary widely. Benefit-
cost analysis indicates that these investments are likely to produce a highly positive net benefit.
ES.2.3 Dynamic & Responsive Demand (Smart DR)
Smart DR encompasses smart grid capabilities that allow short-term influence of end use consumption
by signals provided through the electricity supply chain. Smart DR was analyzed for seven end use
categories (i.e., lighting, space heating, space cooling, appliances/plug loads, water heating,
refrigeration/industrial processes, and agricultural pumping), four sectors (i.e., residential, commercial,
industrial, and agricultural), and three program approaches (i.e., pre-enrolled participant events, price
signals, and fast-acting/ancillary services).
Cost and benefit results for Smart DR are incremental to those generated by traditional DR programs that do
not require smart grid technology.6 As discussed in Section ES.3.3, results indicate there is potential for
significant benefits from Smart DR investments; however, potential varies greatly by customer segment.
ES.2.4 Smart End Use Energy Efficiency (Smart EE)
Smart End Use Energy Efficiency (Smart EE) encompasses smart grid capabilities that reduce energy
consumed by customers through:
enhanced information feedback
identification of poorly performing equipment as candidates for replacement or maintenance
enhancements to EE that require smart grid functionality
The smart grid capabilities that enable these reductions include consumer behavior change, automated
energy management, efficiency equipment upgrades, and improved maintenance.
Cost and benefit results for Smart EE are incremental to those generated by traditional EE programs that do
not require smart grid technology. The results on Smart EE in this white paper have no bearing on the
cost-effectiveness of traditional EE measures. Investment in Smart EE appears to be attractive, but there
is relatively high uncertainty in achievable benefits.
ES.2.5 Grid Storage Integration & Control
Grid Storage Integration & Control encompasses smart grid capabilities that provide the ability to store
electrical energy in battery systems. This includes battery systems located at end use facilities (i.e.,
6 See Appendix B.1 for more discussion on the distinction between Smart DR and traditional DR.

Page 9
residential, mid- to large-sized commercial & industrial [C&I], and institutional facilities), on the
distribution system, and within electric vehicle (EV) batteries when those vehicles are connected to
charging stations.7
Results indicate that even limited Grid Storage Integration & Control investments are not likely to be
cost beneficial given current technology costs. With the exception of certain niche applications, there is
only a small chance that grid storage investments would lead to a net positive benefit. However, results
are highly dependent on future electric storage costs, and it is possible that a technology breakthrough or
new approach could change the expected benefit-cost results.
ES.2.6 Utility Operational Efficiency
Utility Operational Efficiency encompasses smart grid capabilities that improve a utility’s ability to
deliver energy with the same reliability and efficiency, but with lower operations and maintenance
(O&M) costs and lower overall capital expenditures. Primary example capabilities include automated
meter reading and billing and improved planning and forecasting. Through improved planning and
forecasting, it may be possible in the future to reduce utility and regional planning and operating
reserves, thus reducing the overall cost of delivering energy.
The expected outcome of Utility Operational Efficiency investments are uncertain, with similar chances
of producing either a net benefit or a net loss. However, much of the costs in this category are in
advanced metering infrastructure (AMI), which can also serve as a platform to enable or enhance other
more beneficial investment categories. Considering the enabling role of AMI in some smart grid
capabilities, this investment category is sometimes considered a prerequisite for other smart grid
capabilities.
ES.3 Insights from Selected Smart Grid Capabilities
The RBC analysis characterizes 34 smart grid capabilities (see Appendix B.2 for a complete list). The
individual capabilities underwent extensive research—including review of related secondary
publications, analysis of available BPA and regional data, and interviews with regional stakeholders—to
develop appropriate methodologies and model inputs.
Several individual capabilities were selected for more detailed presentation here due to attractive early
indications from testing and pilots. These areas include Smart Voltage Reduction, three phasor
measurement unit (PMU) applications, and Smart DR. The discussion below examines the benefits and
costs by individual capability and highlights some interesting and useful results.
ES.3.1 Smart Voltage Reduction Delivers Value, but Direct Benefits to Utilities May Vary
Smart Voltage Reduction lowers energy consumption or demand by reducing voltage on the distribution
feeder. Smart Voltage Reduction can be used in a variety of ways to achieve both energy savings
(conservation voltage reduction; CVR) and peak load reduction (demand voltage reduction; DVR).
Smart Voltage Reduction is a key area of interest in the Pacific Northwest, with a number of regional
utilities exploring opportunities for Smart Voltage Reduction through pilots and full-scale program
rollouts. This analysis examined the potential costs and benefits of a broader scale rollout of voltage
7 Grid storage in the RBC analysis does not include pumped hydro storage.

Page 10
control strategies through smart grid technology deployment. The analysis shows that the regional
benefits of Smart Voltage Reduction are expected to greatly surpass the costs—by at least a factor two.
Figure ES.4 presents the expected benefit and cost occurring over time during regional deployment of
Smart Voltage Reduction.
Figure ES.4. Smart Voltage Reduction Is Attractive Overall
As the upfront investment cost for Smart Voltage Reduction falls on the distribution portion of the
infrastructure, the primary investment and execution risks typically fall to the distribution utility. This
might be one reason that Smart Voltage Reduction has seen slower deployment than would be expected
based on its attractive cost-effectiveness characteristics.8 BPA has offered its utility customers significant
incentives for Smart Voltage Reduction projects, which has offset this investment risk in many cases.9
Overcoming these barriers is important to more widespread Smart Voltage Reduction adoption in the
region.
ES.3.2 PMU Applications Provide Reliability Insurance and Other Benefits
PMUs are highly precise sensors that communicate grid measurements (i.e., synchrophasors) from
across a transmission system. The measurements are taken at high speed and synchronized to give a
more precise and comprehensive view of a broad transmission geography as compared with
8 Northwest Energy Efficiency Alliance (NEEA) recently conducted an update to their Long Term Monitoring &
Tracking Report on CVR. The information from this information may accelerate adoption of Smart CVR. 9 BPA has offered incentives to its public power customer distribution utilities to plan or implement CVR from 1986
to 1994, and then again from 2002 to the present day. Historically, incentives of $0.04/kWh to $0.18/kWh of
estimated first year annual energy savings were offered for CVR. Those incentives typically covered between 50
and 90 percent of the distribution utility implementation costs. BPA still offers incentives up to $0.25/kWh of first
year annual savings from CVR.
Page 11
conventional technology. Synchrophasors enable a better indication of grid stress, and can be used to
trigger corrective actions to maintain reliability.
Over 500 PMUs have been installed in the Western Electricity Coordinating Council region as part of the
Western Interconnection Synchrophasor Program (WISP).10 A significant portion of these PMUs have
been installed in BPA’s service territory and throughout the Pacific Northwest.
The RBC examined the following PMU-based capabilities:
1. Dynamic Capacity Rating – Transmission capacity assessments will be based on precise, real-
time measurements, rather than on slower, coarser measurements or simulation methods. This
will increase the effective capacity of selected congested lines, increase transmission asset
utilization, and lower energy costs.
2. Renewable Monitoring and Integration – PMUs are being deployed at major renewable sites to
improve the use of those generation assets. As the penetration of these resources increases, the
system must be augmented by firm capacity resources to maintain grid reliability. PMUs located
at major renewable sites increase real-time awareness of these resources, improving their use
and reducing the need for operational reserves to support their integration.
3. Wide-Area Monitoring – PMU data makes it possible for the condition of the bulk power
system to be observed and understood in real time. This high-precision WAM and control can
reduce the frequency of high-duration, widespread outages originating from instabilities in the
bulk power grid.
Figure ES.5 shows that PMU investments may yield a wide range of NPV and benefit-cost ratios. PMU
costs are fairly well understood based on actual project data. The benefits, however, are highly
uncertain, yielding a wide range of possible NPV values. Even though the benefits are uncertain, they
are still expected to surpass costs. Thus, PMU applications overall are not considered a risky investment.
10 Western Electricity Coordinating Council, “The Western Interconnection Synchrophasor Program (WISP),”
https://www.wecc.biz/_layouts/15/WopiFrame.aspx?sourcedoc=/Reliability/JSIS_PEAKRC_Update_Sept2014_v2.p
df&action=default&DefaultItemOpen=1 (Accessed September 28, 2013.)

Page 12
Figure ES.5. PMU Applications Have Large, Uncertain Benefits, But Very Low Relative Costs
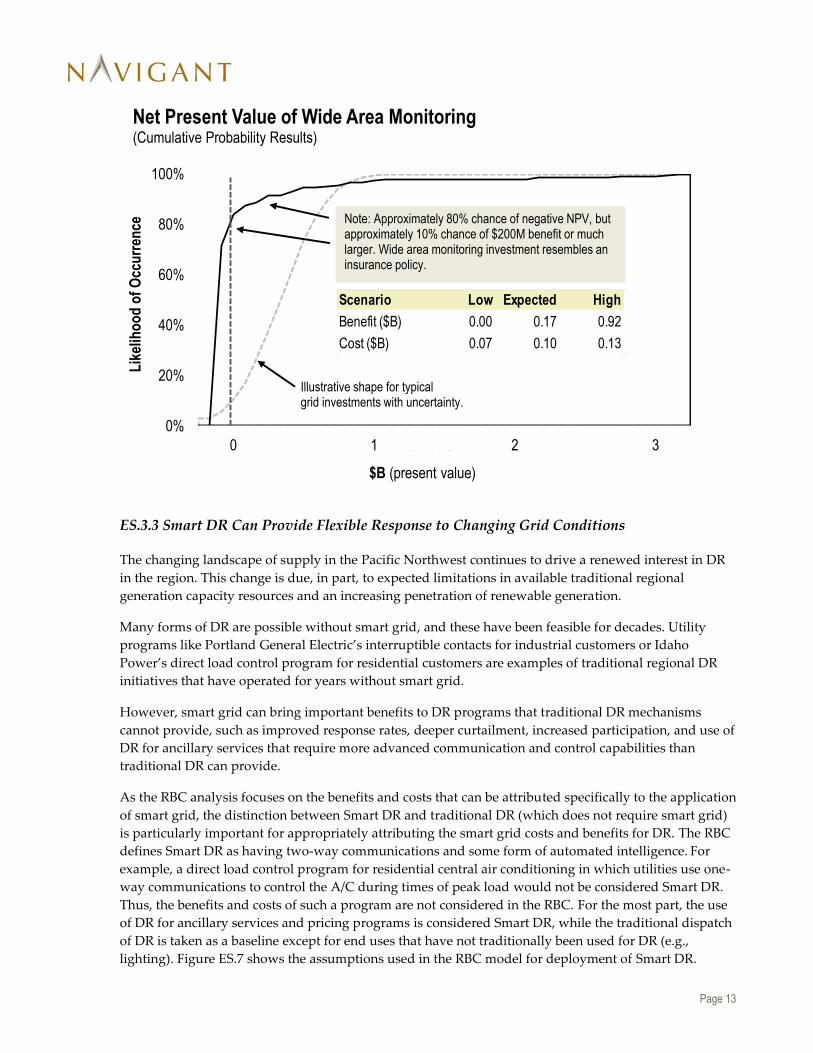
WAM is the primary reason the benefits for PMUs are so uncertain. The expected value of the benefits
for WAM is near zero, based on the low likelihood of the occurrence of a wide-area outage,11 even in the
absence of the PMU system. However, in the rare event that a wide-area outage did occur and the PMU
system did prevent or mitigate its occurrence, there can be substantial benefit.
11 There is an estimated 40 percent chance of a Cascadia Subduction Zone earthquake within the region in the next
50 years; however, it is not expected that the PMU-based WAM application analyzed in the RBC could help avoid a
wide-area outage in the event of an earthquake. http://oregonstate.edu/ua/ncs/archives/2012/jul/13-year-cascadia-
study-complete-%E2%80%93-and-earthquake-risk-looms-large
Page 13
ES.3.3 Smart DR Can Provide Flexible Response to Changing Grid Conditions
The changing landscape of supply in the Pacific Northwest continues to drive a renewed interest in DR
in the region. This change is due, in part, to expected limitations in available traditional regional
generation capacity resources and an increasing penetration of renewable generation.
Many forms of DR are possible without smart grid, and these have been feasible for decades. Utility
programs like Portland General Electric’s interruptible contacts for industrial customers or Idaho
Power’s direct load control program for residential customers are examples of traditional regional DR
initiatives that have operated for years without smart grid.
However, smart grid can bring important benefits to DR programs that traditional DR mechanisms
cannot provide, such as improved response rates, deeper curtailment, increased participation, and use of
DR for ancillary services that require more advanced communication and control capabilities than
traditional DR can provide.
As the RBC analysis focuses on the benefits and costs that can be attributed specifically to the application
of smart grid, the distinction between Smart DR and traditional DR (which does not require smart grid)
is particularly important for appropriately attributing the smart grid costs and benefits for DR. The RBC
defines Smart DR as having two-way communications and some form of automated intelligence. For
example, a direct load control program for residential central air conditioning in which utilities use one-
way communications to control the A/C during times of peak load would not be considered Smart DR.
Thus, the benefits and costs of such a program are not considered in the RBC. For the most part, the use
of DR for ancillary services and pricing programs is considered Smart DR, while the traditional dispatch
of DR is taken as a baseline except for end uses that have not traditionally been used for DR (e.g.,
lighting). Figure ES.7 shows the assumptions used in the RBC model for deployment of Smart DR.
0%
20%
40%
60%
80%
100%
-0.2 0 0.3 0.5 0.8 1 1.3 1.5 1.7 2 2.2 2.5 2.7 3
Lik
elih
oo
d o
f O
ccu
rren
ce
$B (present value)
Net Present Value of Wide Area Monitoring(Cumulative Probability Results)
Note: Approximately 80% chance of negative NPV, but approximately 10% chance of $200M benefit or much larger. Wide area monitoring investment resembles an insurance policy.
Illustrative shape for typical grid investments with uncertainty.
Scenario Low Expected High
Benefit ($B) 0.00 0.17 0.92
Cost ($B) 0.07 0.10 0.13

Page 14
Figure ES.6. Regional Smart DR Deployment Assumptions in RBC12,13
Although the timeframe for a regional deployment may take longer than a decade, individual utilities
may deploy DR very quickly. For example, large traditional DR programs have been deployed at Ohop
Mutual, Milton-Freewater, Snohomish County PUD, Seattle City Light, Orcas Power & Light, PacifiCorp,
and Idaho Power each within the timeframe of a year or two.
Figure ES.7 presents the range of benefits and costs for Smart DR in seven end use categories. The
majority of benefits from Smart DR are capacity benefits rather than ancillary service benefits.14 There are
two important caveats to this finding. The Smart DR benefits are based on the value of avoided capacity.
However there is some disagreement among regional stakeholders on the link between peak load
reductions and actual deferment of planned generation, transmission, and distribution infrastructure
12 The Final Market Penetration assumption values for Smart DR by end use and the number of years it takes to
reach this penetration level are for the entire region. This penetration level comprises the rollout of many utility
Smart DR programs throughout the region. Note that a single utility, once it decides to implement a Smart DR
program, could roll-out a program to its own service territory in one to two years, and in doing so, might reach a
saturation level higher than what is shown in the table. Depending on developing circumstances that drive the
need for capacity resources, the market penetration could be driven faster—or slower—than what is assumed
here. But this timeframe was considered to be a reasonable compromise. 13 Although the total benefits and costs are largely driven by these deployment assumptions, the B/C ratios are
largely independent of these assumptions. 14 The renewable integration benefits of Smart DR occur primarily through avoided ancillary services.
Smart DR End Use
Final Market Penetration
(% of end use load)
Saturation Timeframe
(yrs)
Space Heating 20% 30
Space Cooling 20% 30
Lighting 3% 12
Appliances & Plug Loads 8% 25
Water Heating 20% 30
Industrial Process & Refrigeration 20% 30
Agricultural Irrigation 40% 30

Page 15
investments. The RBC applies avoided capacity cost values provided by BPA and treats them
deterministically.
Figure ES.7. Smart DR Investment Returns Vary Widely by Target End Use
Second, there is currently no consensus value of ancillary services (i.e., for INC and DEC balancing
reserves) in the region. The costs of such services are absorbed by the system, and are not exposed
externally as they are in organized wholesale markets. There is, however, an emerging consensus by
regional stakeholders that there is value and that this value will be more evident as installed renewable
capacity increases and the need for balancing services grows. The RBC effort applied best estimates for
future ancillary service values (i.e., beyond 2015)15 based on BPA research. There is a possibility that
growing renewable generation installations beyond 2020 could reach a point to where the value of
ancillary services rises dramatically, increasing the benefit of Smart DR; however, there are a number of
factors that could mitigate this rise as well.
ES.4 Relationship to the Interim White Paper
An interim version of this analysis with preliminary results was released in late 2013. The analysis
presented here updates that analysis with a number of important inputs and adjustments. Two years
have passed since the interim, and even a bit longer since some of the data inputs that contributed to that
analysis. During that time, the deployment curves for the various technologies have moved two years
further down their deployment paths, which affects both the costs and benefits. However, the analysis
period still looks 30 years into the future, thus the deployment dynamic is slightly different than in the
previous version.
A number of additional, notable updates were made to the Interim RBC inputs for the analysis. Among
these were:
15 The rate case for Variable Energy Resources Balancing Services, settled in 2013, concluded with mutually accepted
values for all ancillary services through September 20, 2015. There is no formal agreement on ancillary service
values for the time period beyond that date.

Page 16
» Updated inputs from a number of PNW-SGDP Test Case results
o PNW-SGDP “Design and Data” workbooks were used to map the impacts and asset
system costs that were applicable to the RBC16
» Updated regional energy related data
o Energy and demand forecast from “2013 Pacific Northwest Loads and Resources Study”
or “2013 White Book”
o Extensive review of regional marginal capacity pricing
» Updated selected impact and cost data
o Numerous updates for DR, EE, and Storage costs and impacts
» Updated selected algorithms
o Equipment Life Extension
o Renewables Integration
o Addition of Revenue Requirements impact estimates
The combined result of these changing inputs had a relatively small, but noticeable effect on the analysis
and business case results.
ES.5 Looking Forward
A primary objective of the RBC effort was to characterize the uncertainty and risk of smart grid
investments in the Pacific Northwest. Most graphics in this white paper present results with explicit
uncertainty bounds.
The analysis method and framework used to develop the RBC provides a number of useful insights that
can help inform policy and regulatory decision makers, utilities, planners, and investors. These regional
stakeholders can leverage the results and information provided to put the various smart grid capabilities
into a context and to guide the decision-making processes.
Figure ES.8 presents an investment approach framework that accounts for the NPV expectations and
uncertainties of smart grid investments. The approach divides smart grid investments into four zones
based on their expected NPV and their range of uncertainty. Smart grid capabilities that have a low
range of uncertainty have sufficient information to confidently make deployment decisions based on
their expected NPV (i.e., “identify niche opportunities” versus “pilot and deploy”). For smart grid
capabilities that have a high range of uncertainty,17 there may not be sufficient information to deploy at
scale, so investment should focus instead on investigating the capabilities and reducing their respective
uncertainties (i.e., “wait and monitor” versus “test and familiarize”).
The right-hand side of the figure indicates the zones into which the smart grid capabilities analyzed in
the RBC fall. This graphic shows that there is sufficient information available today for some capabilities
to begin or continue investing in smart grid deployment. For other capabilities, it is important that
utilities continue testing and become more familiar with them, so that appropriate investment decisions
might ultimately be made.
16 Update details are included in the Navigant Q2 and Q3, 2015 deliverables, and will be included in the Appendix D
here in the final RBC version. 17 Much of the uncertainty for investments in the lower quadrants arises from the uncertainty in the incremental
impact of smart capabilities (i.e., those beyond investment in traditional or baseline capabilities). It can be difficult
to determine what fraction of the benefit from smart grid investments might have been achievable with
investments in traditional technologies. This is especially true for certain Smart DR investments.

Page 17
Figure ES.8. Some Smart Capabilities Warrant Investment, Others Need More Investigation18
Note: Placement in this graphic is based on the assessment of the incremental costs and incremental benefits due to smart grid
enabled capabilities. The analysis does not address the costs and benefits for traditional capabilities (e.g., traditional direct load
control, or replacement of CFLs as an EE measure, etc.)
This effort has achieved the goals of leveraging the best available information to advance the
characterization of smart grid investments and to build a stronger smart grid business case. For
example, the incorporation of test results from the PNW Smart Grid Demonstration Project provided
information from a range of smart grid technology tests conducted by participating regional utilities. The
effort also relied on publicly available reports and information to provide insights into future cost
projections (e.g., battery and energy storage technologies), as well as updated grid and energy data (e.g.,
distributed solar photovoltaic and wind installed capacity forecasts, peak load forecasts).
The computational model used in the RBC analysis captures many of the regional characteristics of the
Northwest, which are unique in the U.S. in a number of dimensions (e.g., the complexities and annual
fluctuations in hydro generation). The model can be used, if desired, to update the regional smart grid
benefit-cost outlook in future years, and it may make sense as an ongoing resource to BPA and other
regional stakeholders. It has many capabilities and detailed outputs that were not possible to explore in
this white paper, but nonetheless could be useful to regional planners and analysts going forward.
Continued outreach and communication to these stakeholders will be critical to achieving the goals of
the RBC.
18 The assessment of smart grid technologies presented here is based on typical costs and impacts expected in the
region. The assessment does not attempt to account for project specific opportunities that deviate from the typical
case (e.g., exceptional reliability requirements driving a campus microgrid business case). Certainly there will be
niche opportunities that should be pursued even if broad deployment is not appropriate.

Page 18
1 Introduction
This white paper presents results and findings from the Pacific Northwest Smart Grid Regional Business
Case (RBC). The RBC effort was sponsored and managed by the Bonneville Power Administration
(BPA), and has been developed with input from a number of regional entities including the Northwest
Power and Conservation Council, and the Pacific Northwest Smart Grid Demonstration Project (PNW
Demonstration Project), which is being managed by the Battelle Memorial Institute (Battelle). The RBC
incorporates input from regional utilities and other regional stakeholders as well as findings from smart
grid studies nationwide.
1.1 Purpose of the RBC
The smart grid, which uses two-way communications and automated intelligence to enhance the
traditional electricity delivery system, promises many benefits for the Pacific Northwest, including better
reliability, more efficient and flexible operation of the grid, lower rates, and reduced carbon emissions.19
But many promised benefits are unproven, and stakeholders have limited experience with many
emerging technologies and capabilities that smart grid investments enable. Although many new
technologies have been successfully demonstrated and shown promising results, utilities and regulators
will rightly approach these grid modernization investments with caution until the technologies,
investment risks, and business case are more precisely understood.
The RBC assesses the benefits, costs, and risks of a comprehensive regional smart grid deployment in the
Pacific Northwest. The analysis results presented in this white paper are intended to provide better
information to regional decision makers for policy making and grid investment decisions.
BPA chose to develop the RBC in pursuit of its stated values: trustworthy stewardship of the region’s
resources, a collaborative approach to relationships, and operational excellence.20 The promised benefits
of the smart grid align with BPA’s strategic objectives:
» System Reliability – Responsive demand, self-healing transmission and distribution (T&D)
infrastructure, and prevented outages will contribute to the improved reliability of supply to
customers.
» Low Rates – Reduced peak loads, better utilization of existing assets and infrastructure, deferred
capacity growth, and improved efficiency in operations and maintenance (O&M) will lower
electricity prices and minimize ratepayer costs.
» Environmental Stewardship – Increased ability to integrate renewable generation sources, end
use energy efficiency (EE) and conservation, and reduced greenhouse gas emissions will reduce
the environmental impact of electricity delivery.
» Regional Accountability – Better capacity to integrate distributed generation, increased
consumer choice, and improved safety will advance the economic vitality of the region.
The RBC is intended to help regional stakeholders understand and minimize risks, while facilitating
appropriate investment decisions for specific smart grid technologies. BPA specifically called for an
approach that is grounded in real-world data and demonstration results and that avoids hyperbole.
19 See Appendix B.1 for additional definition of smart grid. 20 Bonneville Power Administration. “BPA’s Strategic Direction and Targets: 2013-2017.”

Page 19
1.2 Development Process
The results and findings presented in this white paper represent the culmination of the RBC effort,
which was initiated in 2009. The process of developing the RBC has encompassed a broad set of tasks,
including the following:
» Develop a Benefit-Cost Framework – Develop a general framework for assessing smart grid
technology benefits and costs, leveraging existing research and methodologies where
possible.21,22,23,24,25
» Build a Computational Model – Build an RBC model to estimate regional smart grid benefits,
costs, and uncertainties using this framework.
» Interpret and Accommodate Diverse Sources – Provide the ability to incorporate findings from
real-world experience—as results from smart grid technology project pilots, studies, and
programs become available—and use new information and results to improve model estimates
over time.
» Collaborate with the PNW Demonstration Project26 – In particular, there has been a concerted
effort to leverage information from the PNW Demonstration Project, in which the region has
significantly invested to better understand the value of various smart grid technologies.
» Survey Regional Experts – Use subject matter expert review in specific technology areas to
inform assumptions and methodologies, provide input, and vet the reasonableness of model
results.
» Inform Regional Stakeholders – Inform regional decision makers—including investor-owned
utilities (IOUs), publicly owned utilities (POUs), planners, national laboratory scientists, and
leaders inside BPA—of the key takeaways from intermediate results, including promising
technology areas, risks, and associated issues.
» Identify Research Priorities – Identify factors that drive outcomes, sensitivities, and
uncertainties to help focus future research and testing on the most important unknowns.
The analysis process has leveraged the best available information to advance the characterization of
smart grid investments. It has also provided the capability to examine different regional scenarios, such
as the effect of high penetration of home automation, storage costs breakthrough, and updates to
installed renewable capacity projections.
21 Walter S. Baer and Sergej Mahnovski. May 2004.“Estimating the Benefits of the GridWise Initiative: Phase I
Report.” RAND Corporation. Prepared for the Pacific Northwest National Laboratory: TR-160-PNNL. 22 Moises Chavez and Mike Messenger. 2004. “Recommended Framework for the Business Case Analysis of
Advanced Metering Infrastructure (R.02-06-001).” CPUC and CEC (April 14, 2004). 23 U.S. Department of Energy (DOE). June 2010.“Guidebook for ARRA Smart Grid Program Metrics and Benefits.” 24 M. Wakefield. January 2010. “Methodological Approach for Estimating the Benefits and Costs of Smart Grid
Demonstration Projects.” Electric Power Research Institute (EPRI). 25 Electric Power Research Institute. 2012. Guidebook for Cost/Benefit Analysis of Smart Grid Demonstration Projects:
Revision 1, Measuring Impacts and Monetizing Benefits. Palo Alto, CA: 1025734. 26 The Pacific Northwest Smart Grid Demonstration Project is a unique demonstration of unprecedented geographic
breadth across five Pacific Northwest states: Idaho, Montana, Oregon, Washington, and Wyoming. It involves
about 60,000 metered customers and contains many key functions of the envisioned smart grid. The project is
managed by Battelle and received funding from the DOE under the Smart Grid Demonstration Program (SGDP)
authorized by the Energy Independence and Security Act of 2007 (EISA). See: http://www.pnwsmartgrid.org/ for
further information.

Page 20
1.3 Scope of Analysis
Several dimensions were important to bounding the scope of the RBC analysis, including the definition
of smart grid, geographic scope, and time horizon.
1.3.1 Smart Grid Definition
The RBC analysis focuses on the benefits and costs that can be attributed to smart grid investments, and
so attempts to draw a clear line between smart grid capabilities and traditional capabilities.27 A simple
definition of smart grid was generally applied—smart grid capabilities use two-way communications
and some level of automation.28 See Appendix B.1 for more discussion on the smart grid definition.
1.3.2 Geographic Scope
The regional scope used for the RBC analysis is shown in Figure 1, which includes Idaho, Oregon,
Washington, western Montana, and small parts of eastern Montana, California, Nevada, Utah, and
Wyoming. This represents the Pacific Northwest region, an area responsible for roughly five percent of
the U.S. national energy consumption each year.29 BPA operates approximately three-quarters of the
high-voltage transmission and coordinates one-third of the generating capacity in the Pacific Northwest.
Figure 1. Map of the Pacific Northwest Region30 Considered in the RBC
The Pacific Northwest has several geographic features that make its power system unique, including
extensive hydropower resources and a growing penetration of wind power concentrated along the
Columbia River Gorge. These factors, combined with the temperate climate west of the Cascade Range
27 This white paper uses the term “traditional” to indicate investments or capabilities that are not within the scope of
smart grid. 28 For example, some traditional demand response programs provide peak load reduction benefits using one-way
wireless communication signals. The benefits and costs of such traditional programs are not included as smart
grid benefits and costs in the RBC but are rather applied as a baseline for the analysis. Benefits achieved using
two-way communications would be attributed to smart grid. 29 https://www.bpa.gov/news/pubs/GeneralPublications/gi-BPA-Facts.pdf. 30 http://www.bpa.gov/news/pubs/maps/Tlines_Dams_SAB.pdf.
Page 21
where the majority of the population resides, create fluctuating seasonal peaking dynamics and power
system stability constraints that are unique in the United States.
1.3.3 Time Horizon
The RBC analysis characterizes investments on a time frame that extends to the year 2044. The analysis
aims to use the best information and data currently available. Projections are applied where appropriate
to account for changes to certain variables over this extended time horizon.
1.4 Relationship to the PNW Demonstration Project
The PNW Demonstration Project31 developed a regional collaboration between Battelle, BPA, regional
distribution utilities, universities, and equipment vendors to test a range of smart grid technologies. This
project developed pilots and tests to help inform investment decisions by these stakeholders in
distributed generation, transmission, distribution, and customer-sited technologies.
Characterizing smart grid investments is unlike analysis of well-understood, traditional capital
decisions. There are greater uncertainties stemming from both understood and unfamiliar unknowns.
Smart grid investments must leverage uncertain projections of the future state of the power grid in the
Pacific Northwest.32 Input from the PNW Demonstration Project was used in the RBC to help establish
actual project and equipment costs, measured benefits, and to validate assumptions used in the analysis.
The RBC effort closely coordinated with Demonstration Project to understand differences in
assumptions and approaches and to obtain appropriate data for the RBC. Whereas the Demonstration
Project33 focused on analysis of the many regional test cases, which are backwards looking to cover the
period of the Project, the scope of the RBC is forward looking over many years, and is focused on a more
comprehensive regional smart grid deployment over the coming decades.34
1.5 Methodological Considerations
In 2009 BPA commissioned an Introductory Smart Grid Regional Business Case (iRBC) for the Pacific
Northwest.35 The iRBC applied a top-down methodology to estimate regional costs and benefits using
data sources that were available at the time. The iRBC was well received, but it provided limited
capability to characterize specific investments, apply demonstration data, and understand uncertainty
and risk. It could not support a detailed discussion pertaining to actual grid infrastructure and evolving
grid conditions in the Pacific Northwest. More information on the RBC project history is provided in
Appendix A.
31 http://www.pnwsmartgrid.org/. 32 Based on “The Sixth Northwest Electric Power and Conservation Plan (DRAFT).” The Northwest Power and
Conservation Council (NPCC), September 2009, and the U.S. Energy Information Administration (EIA).
www.eia.doe.gov. 33 DOE SGDP grant agreement required reporting metrics and benefits data that occurred during the project. The
results of the demonstration projects were not extrapolated to greater populations or interpreted to assess broader
deployment. “Guidebook for ARRA Smart Grid Program Metrics and Benefits.” June 2010. U.S. Department of
Energy. 34 Note that the RBC effort was closely coordinated with the PNW-SGDP effort, and the project results are
complementary. Results of the Demonstration Project can be found in the Project Technology Performance
Report at: https://www.smartgrid.gov/document/Pacific_Northwest_Smart_Grid_Technology_Performance.html 35 Summit Blue Consulting, LLC. October 2009. “Introductory Business Case for Smart Grid Deployment in the
Pacific Northwest.”

Page 22
Following the iRBC analysis, BPA decided to pursue a bottom-up methodology to better explore specific
technologies and grid impacts. A bottom-up approach can be updated with new inputs and data as
smart grid lessons are learned—in particular, those from the PNW Demonstration Project.36 This effort
led to the development of a new smart grid benefit-cost framework (see Appendix B for more detail) and
a computational model. The model includes the following attributes:
» A bottom-up approach that incorporates smart grid demonstration, experiment, and
implementation results, rather than making broad assumptions about costs and benefits
» 151 actual grid characteristics specific to the Pacific Northwest
» 80 technologies and equipment types
» 30 beneficial impacts that may occur in the electric delivery system
» Cost sharing relationships where certain platform systems help enable future capabilities
» Integrated uncertainty analysis to characterize parameter uncertainty and forecast uncertainty,
as well as scenarios for uncertain directional outcomes (See Appendix B)
The broad scope of a regional smart grid assessment raises numerous methodological considerations
that have been addressed as part of the RBC development process. These include avoiding double
counting of benefits; sharing asset costs among various smart grid investments; capturing the relevant
grid characteristics of the electric grid in the Pacific Northwest; allowing examination of regional
scenarios to see how these might affect the benefit-cost economics; and integrating uncertainty modeling
into the analysis. The RBC meets the goal of taking a grounded approach based on real-world data, and
the data input processes allow tracking of inputs based on a defined maturity scale with the goal of
using more mature inputs as data and experimental learning becomes available. Appendix B provides
more detail on these methodological considerations and the framework that was developed for the RBC.
1.6 Relationship to the Interim RBC
An interim version of this analysis with preliminary results was released in late 2013. The analysis
presented here updates that analysis with a number of important inputs and adjustments. Two years
have passed since the interim, and even a bit longer since some of the data inputs that contributed to that
analysis. During that time, the deployment curves for the various technologies have moved two years
further down their deployment paths, which affects both the costs and benefits. However, the analysis
period still looks 30 years into the future, thus the deployment dynamic is slightly different than in the
previous version.
A number of additional, notable updates were made to the Interim RBC inputs for the analysis. Among
these were:
» Updated inputs from a number of PNW-SGDP Test Case results
o PNW-SGDP “Design and Data” workbooks were used to map the impacts and asset
system costs that were applicable to the RBC
» Updated regional energy related data
o Energy and demand forecast from “2013 Pacific Northwest Loads and Resources Study”
or “2013 White Book”
o Extensive review of regional marginal capacity pricing
» Updated selected impact and cost data
o Numerous updates for DR, EE, and Storage costs and impacts
» Updated selected algorithms
36 See Regional Deployment Framework in Appendix B, which illustrates the high-level conceptual model of lessons
learned from the various pilots and tests and uses these in the technology selection and sorting process.

Page 23
o Equipment Life Extension
o Renewables Integration
o Addition of Revenue Requirements impact estimates
The combined impact of updating these inputs was a relatively small, but noticeable, effect on the
business case results. For example, decline in generation capacity costs reduced the benefits of avoided
capacity, and increased reliability estimates increased the value of reliability to end users.
1.7 Organization of this White Paper
This white paper provides a selection of notable findings and insights gained from the analysis process.
It first presents the overall results for the smart grid, breaks the results into six investment categories,
and examines the results of each. The white paper also delves into several specific smart grid capability
areas that were selected for more detailed analysis due to their initial promising results.
Section 2 discusses the overall value of smart grid to the Pacific Northwest. This discussion includes
benefits, costs, and risk profiles across smart grid investments, as well as a breakout of six smart grid
investment categories.
Section 3 presents findings from investment areas, including the following:
» The primary T&D investment areas, including T&D Optimization and Grid Reliability, as well as
a detailed look at several individual smart grid capabilities in these areas
o Smart Voltage Reduction, which has great potential to save energy and reduce peak
demand but is not generally being deployed aggressively across the region at this point
o Phasor Measurement Unit (PMU) applications, which have a r of potential benefits
o The value of Equipment Life Extension
» Smart DR, including applications for peak curtailment and grid balancing
» Smart enhancements to EE
» Smart management and control of a range of electricity storage devices, and
» The estimated regional effect of smart grid investment on revenue requirements
Section 4 provides insights on several regional “what if” scenarios, including
» Effects of a storage cost breakthrough
» Accelerated adoption of home and building automation, and
» Updated analytical approach for integrating large-scale renewables
Section 5 describes the planned next steps in the RBC process and summarizes the takeaways of this
white paper. More detail on the project history, approach, and methodology are provided in the
appendices.
Page 24
2 Overall Value of Smart Grid to the Pacific Northwest
This section presents overall benefit, cost, and uncertainty results for a portfolio of smart grid
capabilities. Data already available on a number of smart grid technologies and approaches indicates
that—under reasonable deployment assumptions (see RBC Deployment Assumptions insert below)—these
capabilities can be expected to produce substantial regional benefits. Section 2.1 presents aggregated
results for all smart grid capabilities combined. Section 2.2 arranges the results into six smart grid
investment categories.
This analysis is intended to indicate which smart grid investments are generally attractive and which are
not, as well as in which cases more information or investigation is still needed.
Each major investment category presents an aggregate view of multiple smart grid capabilities that
comprise the category, with 34 capabilities in total.37 While there can be great differences in the benefit-
to-cost (B/C) ratios for these individual capabilities, this aggregate view presents an average of the
benefits and costs. A selection of capabilities is explored in Section 3, which details these differences.38
These results show a range of cost-effectiveness across smart grid investments and indicate which
investments are likely to be the most promising.39
2.1 Smart Grid Investment Looks Promising Overall
This section presents overall aggregate results for all smart grid capabilities, with discussions of the
uncertainty in those results. Figure 2 indicates the range and likelihood of the benefits and costs
37 See Appendix B for details on the individual smart grid capabilities (or “functions”) that comprise each major
investment category. 38 For example, Section 3.3 shows that the attractiveness of smart demand response investments is considerably
different for lighting applications than for water heating applications. 39 See Appendix B, Figure 40, for conceptual deployment model.
RBC Deployment Assumptions
Benefit-cost results for a regional smart grid investment portfolio will depend on the deployment assumptions
for the constituent smart grid capabilities. The Deployment Assumptions described in this white paper are not
based on the timeframe that it would take a utility to deploy smart technologies. Rather they are an estimate
of the timeframe under which market conditions might lead utilities to make deployment decisions over the
geography of the Pacific Northwest region.
The approach used for the analysis assumes a deployment scenario based on early indications of successful
technology approaches as well as trends in utility smart grid investments. The purpose of this approach is to
understand the range of benefits, costs, and uncertainties associated with a reasonable deployment.
For example, advanced metering infrastructure (AMI) is already being broadly deployed across the United
States, including in the Pacific Northwest. The analysis uses actual AMI penetration statistics as a starting
condition and assumes that deployment reaches an 80 percent penetration level within the next 20 years.
As another example, the RBC model results suggest that the benefit of battery technologies will be highly
dependent on the cost reduction curve for various battery technologies. Therefore, battery deployment is
simulated as having a limited deployment initially, but growing over the time horizon of the analysis.
If utilities or other stakeholders wish to consider a range of deployment strategies, the RBC model is capable of
doing so.

Page 25
associated with a deployment spanning to 2045 in the Pacific Northwest. Benefits are expected to surpass
costs, with $14.0B in total benefits and $8.1B in costs over the analysis time frame. Benefits range from
$10.8 to $17.1B, and costs are expected to range from $6.8B to $9.5B, based on the uncertainty and risk
treatment described in the Uncertainty and Risk Treatment sidebar below. These ranges indicate that the
benefits are nearly twice as uncertain as the costs, creating a possibility that the costs might outweigh the
benefits, even though the expected benefits are much higher than the costs.
Two other findings from these results are significant. First, costs bear a significant degree of uncertainty,
although smaller than that of benefits. In many smart grid pilots and project rollouts, costs were initially
thought to be well understood. However, interviews with utility personnel have indicated that many
unanticipated and “hidden” costs frequently arise, especially integration and startup costs that were not
included in original budgets. In some cases, the level of capability achieved from initial investments did
not meet utility expectations and additional unplanned investment has been needed. Second, even
though benefits and costs are both uncertain, the benefits are still expected to surpass costs with a high
degree of confidence.
Uncertainty and Risk Treatment
A primary goal of the RBC effort is to understand the uncertainties and risks associated with smart grid
deployment. The RBC results presented include: 1) an expected value that represents a best estimate based on
currently available data, and 2) an indication of the uncertainty.
Uncertainty results are presented in three consistent ways throughout this white paper:
Scenario results – High, expected, and low case results are indicated numerically in a table. The high and
low results are interpreted as corresponding, respectively, to the 95th and 5th percentiles of likelihood. The
expected result is interpreted as the mean.
Whisker diagrams – A dashed line appearing on bar charts indicates the results corresponding to the high
and low scenario results. This is graphically equivalent to the scenario results.
Frequency distributions – A curve showing the combined Monte Carlo simulation results that indicates the
relative likelihood of the occurrence of certain values. The 95th and 5th percentiles in the frequency
distribution curve equate, respectively, to the high and low case results. The expected case is taken as the
geometric mean of the frequency distribution. Frequency distributions are identifiable as relatively smooth
curves.
It is important to distinguish between uncertainty and risk in interpreting these results and smart grid
investments in general. Uncertainty represents the range and likelihood of possible outcomes. Risk, on the
other hand, represents the likelihood and consequences of negative outcomes. To help distinguish risk in these
figures, dotted lines represent the threshold of negative outcomes (i.e., a B/C ratio of less than 1.0 and net
present value of less than zero).
Page 26
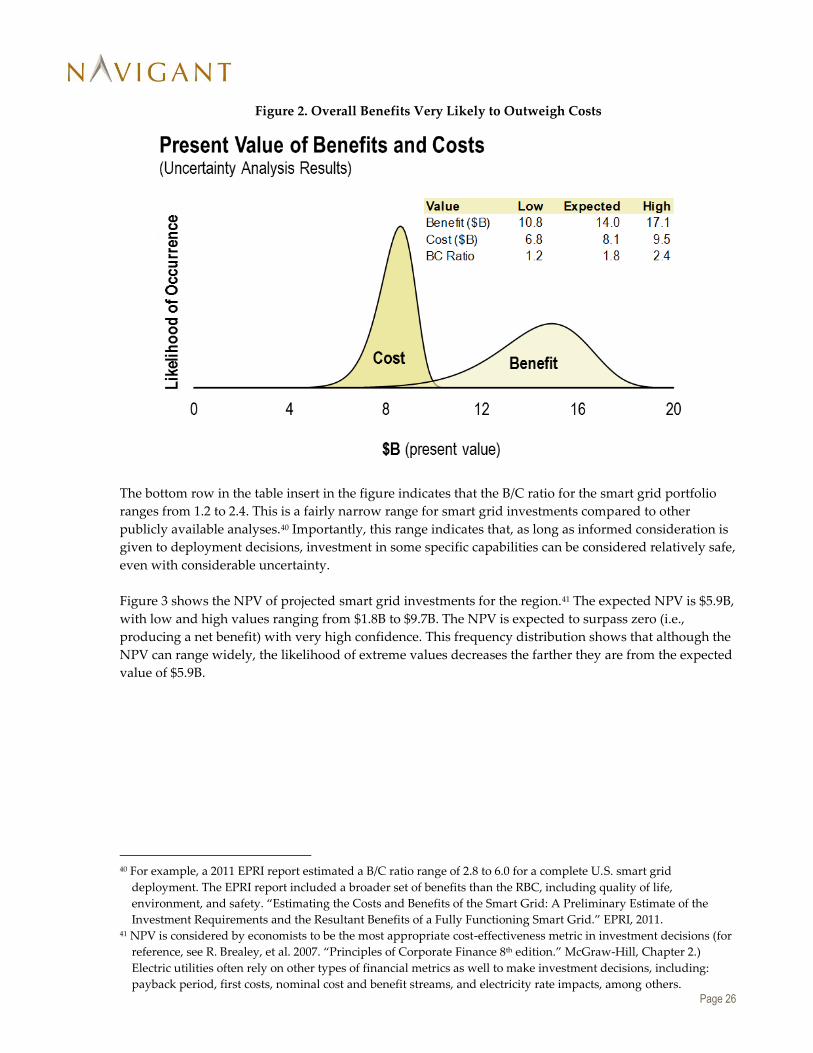
Figure 2. Overall Benefits Very Likely to Outweigh Costs
The bottom row in the table insert in the figure indicates that the B/C ratio for the smart grid portfolio
ranges from 1.2 to 2.4. This is a fairly narrow range for smart grid investments compared to other
publicly available analyses.40 Importantly, this range indicates that, as long as informed consideration is
given to deployment decisions, investment in some specific capabilities can be considered relatively safe,
even with considerable uncertainty.
Figure 3 shows the NPV of projected smart grid investments for the region.41 The expected NPV is $5.9B,
with low and high values ranging from $1.8B to $9.7B. The NPV is expected to surpass zero (i.e.,
producing a net benefit) with very high confidence. This frequency distribution shows that although the
NPV can range widely, the likelihood of extreme values decreases the farther they are from the expected
value of $5.9B.
40 For example, a 2011 EPRI report estimated a B/C ratio range of 2.8 to 6.0 for a complete U.S. smart grid
deployment. The EPRI report included a broader set of benefits than the RBC, including quality of life,
environment, and safety. “Estimating the Costs and Benefits of the Smart Grid: A Preliminary Estimate of the
Investment Requirements and the Resultant Benefits of a Fully Functioning Smart Grid.” EPRI, 2011. 41 NPV is considered by economists to be the most appropriate cost-effectiveness metric in investment decisions (for
reference, see R. Brealey, et al. 2007. “Principles of Corporate Finance 8th edition.” McGraw-Hill, Chapter 2.)
Electric utilities often rely on other types of financial metrics as well to make investment decisions, including:
payback period, first costs, nominal cost and benefit streams, and electricity rate impacts, among others.

Page 27
Figure 3. Smart Grid Investment Looks Attractive Overall42
These aggregate results indicate that sufficient information exists today to create beneficial, region-wide,
smart grid deployment plans in the Pacific Northwest. Uncertainties remain high in some areas,
however, as discussed in the sections below. Results in different jurisdictions vary for a number of
parameters (e.g., weather, capacity constraints, etc.) that may cause results for specific technologies to
diverge from this regional average view.
The results presented below show successively more granular views into the capabilities that comprise
this aggregate view. Individual utilities should consider their local situation and, in some cases, perform
specific analysis to confirm that the results shown in the various areas are indicative of what they might
expect in their specific service territories.
2.2 Investment Outlook Varies by Category, but Is Generally Positive
This section presents results at an intermediate level of aggregation for the six smart grid investment
categories, which are described below. The results indicate that smart grid investments in the T&D
Optimization and Grid Reliability categories are expected to be attractive at relatively low risk. The
Dynamic & Responsive Demand category has very high potential, but also greater uncertainty in
benefits. Smart grid investments to enhance End Use EE are anticipated to be generally attractive, but
note that smart grid only affects a small percent of the overall energy efficiency picture. Grid Storage
Integration & Control is, on average, not currently attractive—but this result is highly dependent on
future storage costs. Smart grid enhancements to Utility Operational Efficiency are expected to produce
a small net benefit, but are highly speculative at this point. Figure 4 indicates the range of the benefits
and costs associated with each major investment category. Figure 5 indicates the range of B/C ratios for
42 Note that the low case NPV cannot be obtained by subtracting the low case costs from the low case benefits. The
likelihood of both the low cost and low benefit cases occurring simultaneously is very small, and the same is true for
the high case NPV. Instead, results were obtained for the low and high cases directly from Monte Carlo simulation
to maintain a constant probability for low case values and high case values. This is done consistently for results
throughout the white paper.

Page 28
each investment category, and Figure 6 indicates the frequency distribution for the NPV of each
investment category.
Figure 4. Six Investment Categories Show Different Returns and Risks
Figure 5. Three Investment Categories Show B/C Ratios Significantly Greater Than 1.0
The horizontal dotted line represents the threshold of an attractive investment, with negative outcomes expected below the line.

Page 29
Figure 6. Variance of NPV Results Differs Across the Six Investment Categories
The vertical dotted line represents the threshold of an attractive investment, with negative outcomes expected left of the line.
Note that the area under the curves for each investment category has no relationship with the value or size of the investment, or
the costs or benefits in that area, but it rather each curve is a frequency distribution with an area of 1.
Each of the six investment categories shown in Figure 4 through Figure 6 are described in more detail
below, accompanied by a discussion of their results.
2.2.1 T&D Optimization
T&D Optimization encompasses smart grid capabilities that improve the controllability or utilization of
electrical infrastructure assets, leading to more efficient delivery of electricity. Example capabilities
include Smart Voltage Reduction and power factor control.43
T&D Optimization benefits are fairly well understood compared to other investment categories. These
investments are typically viewed as utility engineering and operations functions, since the equipment is
on the grid and does not require interaction with or response by end use customers. Investments should
account for the specific characteristics of each T&D system, and investment can be based mostly on
engineering analysis. Some of the largest uncertainties occur in the areas of system and operational
integration costs.
Costs are estimated at about $2.2B, ranging from approximately $1.8B to $2.7B. Benefits are estimated at
$4.0B, ranging from approximately $3.0B to 4.8B. The likelihood that costs would surpass the benefits is
very small.
43 Utilities have long engaged in T&D investment and optimization activities using traditional (i.e., non-smart)
technologies. Only optimization activities that apply two-way communications and some form of automated
intelligence are included in the RBC analysis.

Page 30
2.2.2 Grid Reliability
Electric service reliability encompasses smart grid capabilities that reduce the likelihood, duration or
geographic extent of electricity service interruption and maintain or improve the quality of delivered
power. Example capabilities include fault location, isolation, and service restoration (FLISR), enhanced
fault prevention, and wide-area monitoring (WAM).
Many technologies that improve reliability are already proven, but impacts can still vary widely based
on several factors. First, if reliability is already high in a given service territory, then there may be little
room for improvement. Second, if there is a low occurrence of future outage events, then the value of
reliability investments would be reduced. This is especially true for widespread area outages, where a
large outage may or may not occur in the next 30 years in the region. Finally, the value of reliable service
differs widely from customer to customer. Some industrial or institutional customers may value reliable
service so highly that they already own backup generation, diminishing the value of improved
reliability.
Costs are estimated at $1.6B, ranging from $1.4B to $1.9B. Benefits are estimated at $4.7B, ranging from
$3.9B to $5.5B. These reliability benefits are valued based on the updated 2015 Lawrence Berkeley
National Laboratory (LBNL) report.44 These results indicate that these investments are highly likely to
produce a net benefit. However, utility-specific views of this investment area may vary widely, since the
economic damage of an outage is difficult to quantify for a given utility, and since the benefits accrue to
end users while the costs accrue to the utilities. For these reasons, reliability investments tend to be
influenced more by regulatory drivers than business case drivers.45
2.2.3 Dynamic & Responsive Demand (Smart DR)
Dynamic & Responsive Demand encompasses smart grid capabilities that allow short-term influence of
end use consumption by third-party actors or participants in the electricity supply chain. Demand
response (DR) was analyzed for seven end use categories (lighting, space heating, space cooling,
appliances/plug loads, water heating, refrigeration/industrial processes, and agricultural pumping), four
sectors (residential, commercial, industrial, and agricultural), and three program approaches (pre-
enrolled participant events, price signals, and fast-acting ancillary services).
Cost and benefit results for Dynamic & Responsive Demand are incremental to those generated by
traditional DR programs that do not require smart grid technology.46 Smart DR refers to these incremental
costs and incremental benefits throughout this white paper. See Appendix B.5 for more discussion on the
distinction between Smart DR and traditional DR.
44 Michael J. Sullivan, et.al., 2015. Updated Value of Service Reliability Estimates for Electric Utility Customers in the United
States. LBNL-6941E. Berkeley, CA: Ernest Orlando Lawrence Berkeley National Laboratory. The RBC applied the
LBNL values but added uncertainty bounds. 45 As stated in a white paper entitled “Building a business case, Capital investments in grid reliability” by ABB
Power Products & Power Systems. “Improving reliability of distribution networks can be a difficult puzzle for
investor-owned utilities. Regulation and common sense combine to assure that distribution systems get their basic
maintenance, such as tree trimming and regular replacement of network assets. But when it comes to planning
larger projects – intensive capital investments that may produce multi-layered, long-term benefits – the
complexities of building a compelling business case often get in the way.” 46 See Appendix B for a discussion on Smart DR versus traditional DR.
Page 31
Costs and benefits for Smart DR are sensitive to the nature of the end use application. For example,
Smart DR in lighting appears to be cost-prohibitive, while Smart DR for agricultural pumping appears to
be very attractive.47 This is largely driven by a larger demand reduction relative to the necessary
equipment costs that can be captured for an individual load control point in agricultural pumping, as
opposed to lighting. The results for Smart DR also vary greatly by customer segment, where residential
customers represent a fairly homogenous segment for most end uses, while many C&I DR applications
require custom engineering and integration. Other issues also elevate the uncertainty, such as the
persistence of customer participation. Many of these issues also exist with traditional DR; however, the
introduction of smart grid technologies can amplify their uncertainty.
Costs are estimated at $1.4B, ranging from $0.9B to about $2.1B. Benefits are estimated at $3.0B, ranging
from $1.4B to $4.6B. These results indicate the potential for significant benefits from Smart DR
investments. Consensus is growing in the region that DR—both traditional and smart—can provide a
cost-effective approach to avoiding the need for capacity investments. However, shifting from a
dependence on supply-side resources to demand-side resources to balance energy supply represents a
substantial operational change by utilities and often by end use customers as well. As a result, regulatory
barriers and incentives may need to be addressed for utilities to realize this potential, even though the
investment in DR may be cost-effective. Results for Dynamic & Responsive Demand are further
discussed in Section 3.2. Note: Traditional DR programs have consistently proven cost-effective in the
region and across the country.
2.2.4 Smart End Use Energy Efficiency
Smart End Use EE encompasses smart grid capabilities that reduce energy consumption through
enhanced information feedback, identification of poorly performing equipment as candidates for
replacement or maintenance, and other enhancements to EE that require smart grid functionality.
Capabilities encompass consumer behavior change, automated energy management, efficiency
equipment upgrades, and improved maintenance.
Cost and benefit results for Smart EE are considered incremental to traditional EE investment, which do
not require smart grid functionality. The results on Smart EE in this white paper have no bearing on the
cost-effectiveness of traditional EE measures. Smart EE costs are estimated at $0.5B, ranging from $0.3B
to $0.6B. Benefits are estimated at $0.8B, ranging from $0.3B to $1.3B. Investment in Smart EE appears
attractive, but realizing the benefits has a high degree of uncertainty.
Although EE is a common theme in smart grid discussions, it will not likely be a key driver for smart
grid investments. Rather, once significant smart grid infrastructure is in place, Smart EE can leverage
this investment to provide additional benefit at little incremental cost. Note that this analysis has nothing
to say about the cost-effectiveness of traditional end use EE measures, and only addresses end use
efficiency to the degree it is impacted by smart grid functionality. Traditional EE programs have
consistently proven cost-effective in the region and across the country.
47 It will certainly be true that some very large lighting loads on single point control systems will be strong
candidates for Smart DR. Conversely, there will be very small agricultural pump loads that will not be attractive
candidates for Smart DR. These conclusions are meant to represent typical smart grid investment cases that could
serve a reasonable basis of extrapolation for a regional deployment.

Page 32
2.2.5 Grid Storage Integration & Control
Grid Storage Integration & Control encompasses all smart grid capabilities that provide the ability to
store electrical energy in battery systems. This includes battery systems sited at end use facilities (i.e.,
residential, mid- to large-sized C&I, and institutional facilities), and on the distribution system, as well
as within EV batteries when connected to charging stations.48
Grid storage benefits are based on the technical specifications of battery systems (e.g., capacity,
discharge rates, and conversion efficiency) as well as specific ways in which the storage device is then
used. Assumptions about the costs of these systems is a critical factor in achieving a beneficial B/C ratio.
In the past few years, it has become more possible to obtain information on the current cost of these
systems. Currently available data indicate that even the lower-cost battery systems do not generally
obtain a beneficial B/C ratio except in special cases. In addition, future costs still have a number of broad
uncertainties. Replacement schedules are not well demonstrated and vendor claims are generally
thought to be optimistic. There is no consensus on how much and how quickly battery system costs will
improve, although there is a lot of marketing hype from battery manufacturers.
Results indicate that even limited Grid Storage Integration & Control investments could cost about $0.9B
and would only be expected to create $0.4B in benefits. There is only a small chance that grid storage
investments would create a net benefit outside of certain niche applications.49 However, results are
highly dependent on future electric storage costs, and it is possible that a breakthrough or new approach
could change the expected benefit-cost results. Such a cost breakthrough is explored in Section 4.
2.2.6 Utility Operational Efficiency
Utility Operational Efficiency encompasses smart grid capabilities that improve a utility’s ability to
deliver energy with the same reliability and efficiency, but with lower O&M costs and lower overall
capital expenditures. Primary example capabilities include automated meter reading and billing and
improved planning and forecasting. Through improved planning and forecasting, it may be possible in
the future to reduce utility and regional planning and operating reserves, thus reducing the overall cost
of delivering energy.
Utility Operational Efficiency produces a wide range of possible results that fall on both sides of the cost-
effectiveness threshold. For example, avoided meter reading expenses often create a substantial benefit
from AMI deployment. However, most AMI business case literature indicates that avoided meter
reading benefits do not fully cover advanced meter infrastructure costs.50 Much of the risk in recovering
AMI costs lies in the extent to which utilities can improve operationally in areas such as billing,
planning, and forecasting, or in the extent that AMI is successfully leveraged in other capabilities such as
DR. In addition, if the analytics from the more granular meter data improve forecasting and load control
to ultimately allow for even a small decrease in reserve margin, then those investments could produce a
substantial net benefit.
48 Grid storage in the RBC analysis does not include pumped hydro storage. 49 For example, in situations where energy arbitrage is highly attractive, ancillary service values are high and the
storage can be housed at a centralized location such as a campus. This represents a situation where energy storage
may improve cost-effectiveness. 50 Typically in published materials, avoided meter reads and remote connect/disconnect result in benefits that meet
55 percent–85 percent of total AMI costs. In some cases where meter reading costs are excessively high (e.g., a
rural co-op with a large geographic service territory) operational benefits can surpass total AMI costs without
including other benefits.

Page 33
Costs are estimated at $1.4B, ranging from $1.1B to $1.7B. Benefits are estimated at $1.3B, ranging from
$0.5B to $2.1B. Utility Operational Efficiency investments are viewed as very uncertain, with similar
chances of producing either a net benefit or a net loss. However, much of the costs in this category are in
AMI, which can also serve as a platform to enable or enhance other more beneficial investment
categories. Considering the enabling role of AMI in some smart grid capabilities and considering the
favorable results of the combined investments shown in Section 2.1, this investment category is
sometimes considered a prerequisite for other smart grid capabilities. This interpretation is consistent
with the evidence of broader AMI deployment that has already occurred in the region and the country.
The following section provides more detail and insight on the smart grid investment categories. Section
3.1 focuses on the two key T&D investment categories of Optimization and Grid Reliability. Subsections
dive into two interesting, individual capability areas. Smart Voltage Reduction can deliver value, but
faces misaligned incentives in the value chain. Applications that leverage PMU systems create
substantial value for the investment; one application, WAM, will provide benefit as insurance against the
possibility of a widespread outage in the region. Section 3.2 takes a more detailed look into Smart DR
and how a careful deployment approach could create substantial benefits. Section 3.3 looks at smart grid
effects on energy efficiency, and Section 3.4 examines smart control of electric storage systems. Finally,
Section 3.5 estimates that overall revenue impacts to regional utilities from the projected smart grid
investments.

Page 34
3 Promising Findings and Insights from Investment Category Analysis
The RBC analysis characterizes 34 smart grid capabilities (see Appendix B.2 for a complete list). The
individual capabilities underwent extensive research—including review of related secondary
publications, analysis of available BPA and regional data, and interviews with regional stakeholders—to
develop an appropriate methodology and model inputs. These individual smart grid capabilities are
grouped into the six investment categories presented in Section 2.
Section 3 provides a closer examination of benefits and costs by investment category, with several
detailed “drill-downs” into specific, individual capability areas that have interesting and useful results.
3.1 T&D Optimization and Grid Reliability Deliver the Majority of the Value
The Investment Categories T&D Optimization and Grid Reliability leverage smart grid investments on
the transmission and distribution grids, and in that respect are similar to traditional grid investment.
These categories represent the largest investments among the six categories, and also provide the largest
share of benefits. The uncertainty of outcomes is lower than for other categories, which is perhaps not
surprising given that there is more experience with many of the smart grid capabilities in this area. As
shown in Figure 7 and Figure 8, the Benefit-Cost (B/C) ratios for both the T&D Optimization and Grid
Reliability categories are quite attractive.
Figure 7. T&D Focused Investments Looks Highly Beneficial
Scenario Total Low Exp High
Benefit ($B) 3.0 4.0 4.8
Cost ($B) 1.8 2.2 2.7
B/C Ratio 1.2 1.8 2.4
0
0.01
0.02
0.03
0.04
0.05
0.06
0 1 2 3 4 5
Lik
elih
oo
d o
f O
ccu
rren
ce
$B (present value)
Present Value of Benefits and Costs of T&D Optimization(Uncertainty Analysis Results)
Cost Benefit
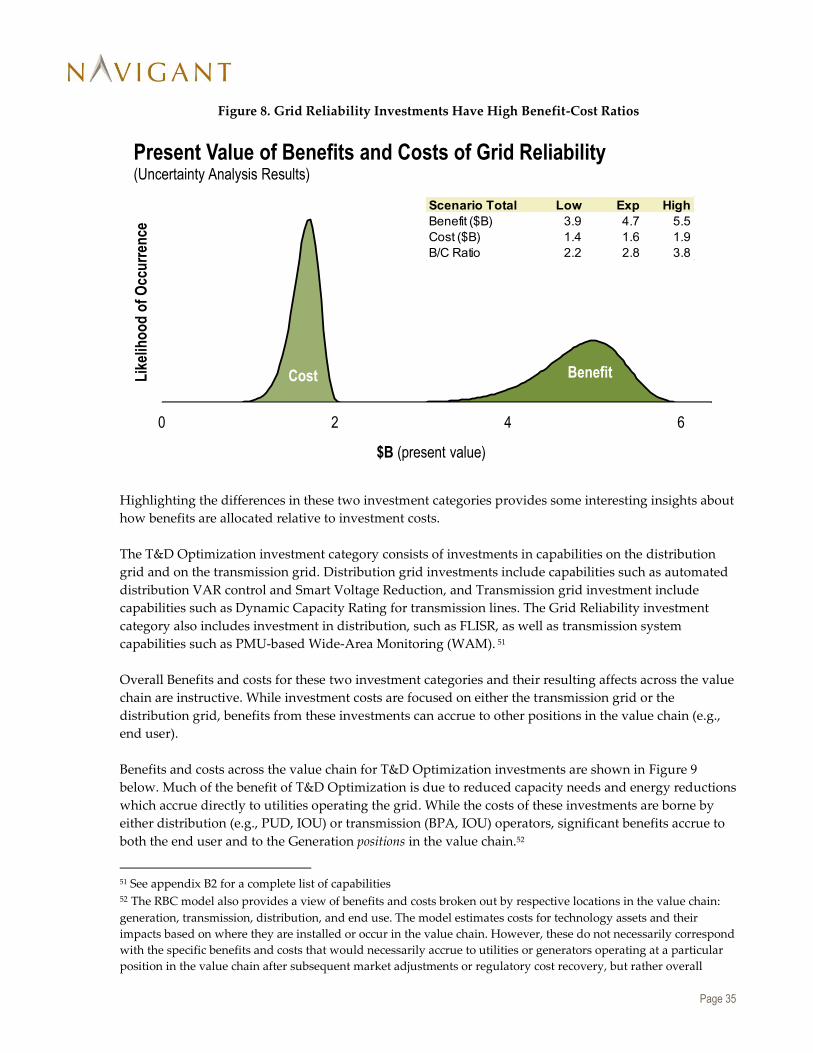
Page 35
Figure 8. Grid Reliability Investments Have High Benefit-Cost Ratios
Highlighting the differences in these two investment categories provides some interesting insights about
how benefits are allocated relative to investment costs.
The T&D Optimization investment category consists of investments in capabilities on the distribution
grid and on the transmission grid. Distribution grid investments include capabilities such as automated
distribution VAR control and Smart Voltage Reduction, and Transmission grid investment include
capabilities such as Dynamic Capacity Rating for transmission lines. The Grid Reliability investment
category also includes investment in distribution, such as FLISR, as well as transmission system
capabilities such as PMU-based Wide-Area Monitoring (WAM). 51
Overall Benefits and costs for these two investment categories and their resulting affects across the value
chain are instructive. While investment costs are focused on either the transmission grid or the
distribution grid, benefits from these investments can accrue to other positions in the value chain (e.g.,
end user).
Benefits and costs across the value chain for T&D Optimization investments are shown in Figure 9
below. Much of the benefit of T&D Optimization is due to reduced capacity needs and energy reductions
which accrue directly to utilities operating the grid. While the costs of these investments are borne by
either distribution (e.g., PUD, IOU) or transmission (BPA, IOU) operators, significant benefits accrue to
both the end user and to the Generation positions in the value chain.52
51 See appendix B2 for a complete list of capabilities 52 The RBC model also provides a view of benefits and costs broken out by respective locations in the value chain:
generation, transmission, distribution, and end use. The model estimates costs for technology assets and their
impacts based on where they are installed or occur in the value chain. However, these do not necessarily correspond
with the specific benefits and costs that would necessarily accrue to utilities or generators operating at a particular
position in the value chain after subsequent market adjustments or regulatory cost recovery, but rather overall
0 2 4 6
Lik
elih
oo
d o
f O
ccu
rren
ce
$B (present value)
Present Value of Benefits and Costs of Grid Reliability(Uncertainty Analysis Results)
Cost Benefit
Scenario Total Low Exp High
Benefit ($B) 3.9 4.7 5.5
Cost ($B) 1.4 1.6 1.9
B/C Ratio 2.2 2.8 3.8
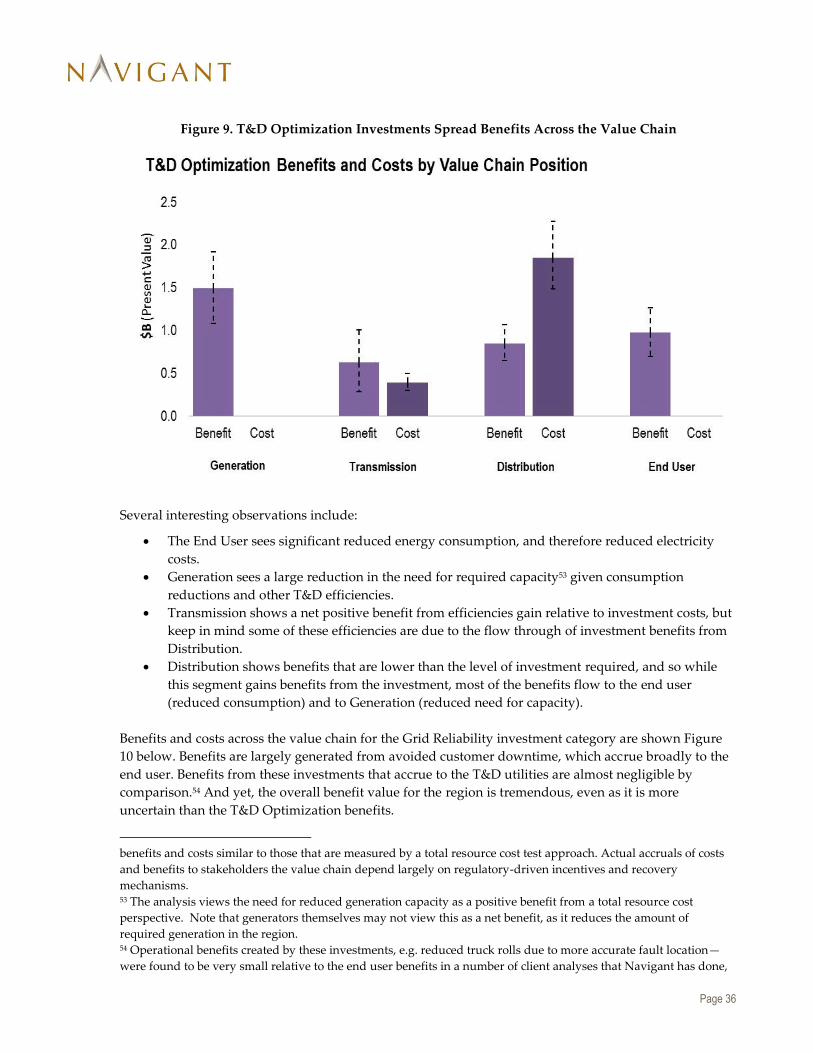
Page 36
Figure 9. T&D Optimization Investments Spread Benefits Across the Value Chain
Several interesting observations include:
The End User sees significant reduced energy consumption, and therefore reduced electricity
costs.
Generation sees a large reduction in the need for required capacity53 given consumption
reductions and other T&D efficiencies.
Transmission shows a net positive benefit from efficiencies gain relative to investment costs, but
keep in mind some of these efficiencies are due to the flow through of investment benefits from
Distribution.
Distribution shows benefits that are lower than the level of investment required, and so while
this segment gains benefits from the investment, most of the benefits flow to the end user
(reduced consumption) and to Generation (reduced need for capacity).
Benefits and costs across the value chain for the Grid Reliability investment category are shown Figure
10 below. Benefits are largely generated from avoided customer downtime, which accrue broadly to the
end user. Benefits from these investments that accrue to the T&D utilities are almost negligible by
comparison.54 And yet, the overall benefit value for the region is tremendous, even as it is more
uncertain than the T&D Optimization benefits.
benefits and costs similar to those that are measured by a total resource cost test approach. Actual accruals of costs
and benefits to stakeholders the value chain depend largely on regulatory-driven incentives and recovery
mechanisms. 53 The analysis views the need for reduced generation capacity as a positive benefit from a total resource cost
perspective. Note that generators themselves may not view this as a net benefit, as it reduces the amount of
required generation in the region. 54 Operational benefits created by these investments, e.g. reduced truck rolls due to more accurate fault location—
were found to be very small relative to the end user benefits in a number of client analyses that Navigant has done,
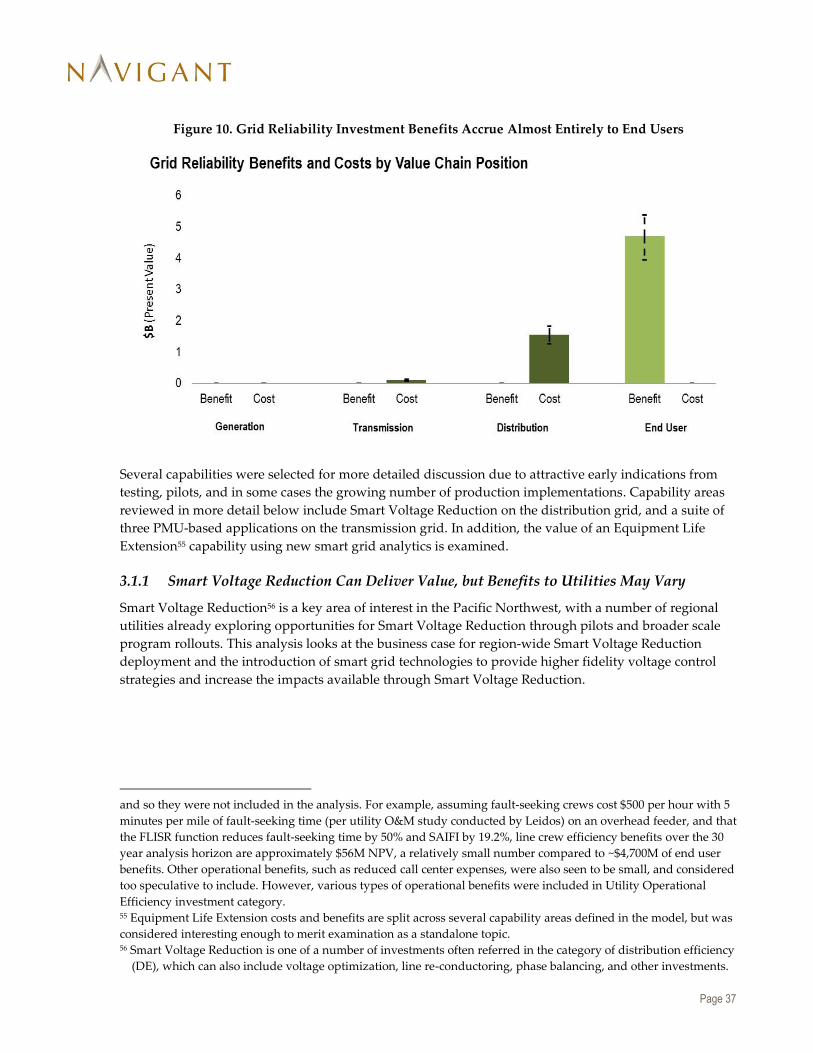
Page 37
Figure 10. Grid Reliability Investment Benefits Accrue Almost Entirely to End Users
Several capabilities were selected for more detailed discussion due to attractive early indications from
testing, pilots, and in some cases the growing number of production implementations. Capability areas
reviewed in more detail below include Smart Voltage Reduction on the distribution grid, and a suite of
three PMU-based applications on the transmission grid. In addition, the value of an Equipment Life
Extension55 capability using new smart grid analytics is examined.
3.1.1 Smart Voltage Reduction Can Deliver Value, but Benefits to Utilities May Vary
Smart Voltage Reduction56 is a key area of interest in the Pacific Northwest, with a number of regional
utilities already exploring opportunities for Smart Voltage Reduction through pilots and broader scale
program rollouts. This analysis looks at the business case for region-wide Smart Voltage Reduction
deployment and the introduction of smart grid technologies to provide higher fidelity voltage control
strategies and increase the impacts available through Smart Voltage Reduction.
and so they were not included in the analysis. For example, assuming fault-seeking crews cost $500 per hour with 5
minutes per mile of fault-seeking time (per utility O&M study conducted by Leidos) on an overhead feeder, and that
the FLISR function reduces fault-seeking time by 50% and SAIFI by 19.2%, line crew efficiency benefits over the 30
year analysis horizon are approximately $56M NPV, a relatively small number compared to ~$4,700M of end user
benefits. Other operational benefits, such as reduced call center expenses, were also seen to be small, and considered
too speculative to include. However, various types of operational benefits were included in Utility Operational
Efficiency investment category. 55 Equipment Life Extension costs and benefits are split across several capability areas defined in the model, but was
considered interesting enough to merit examination as a standalone topic. 56 Smart Voltage Reduction is one of a number of investments often referred in the category of distribution efficiency
(DE), which can also include voltage optimization, line re-conductoring, phase balancing, and other investments.
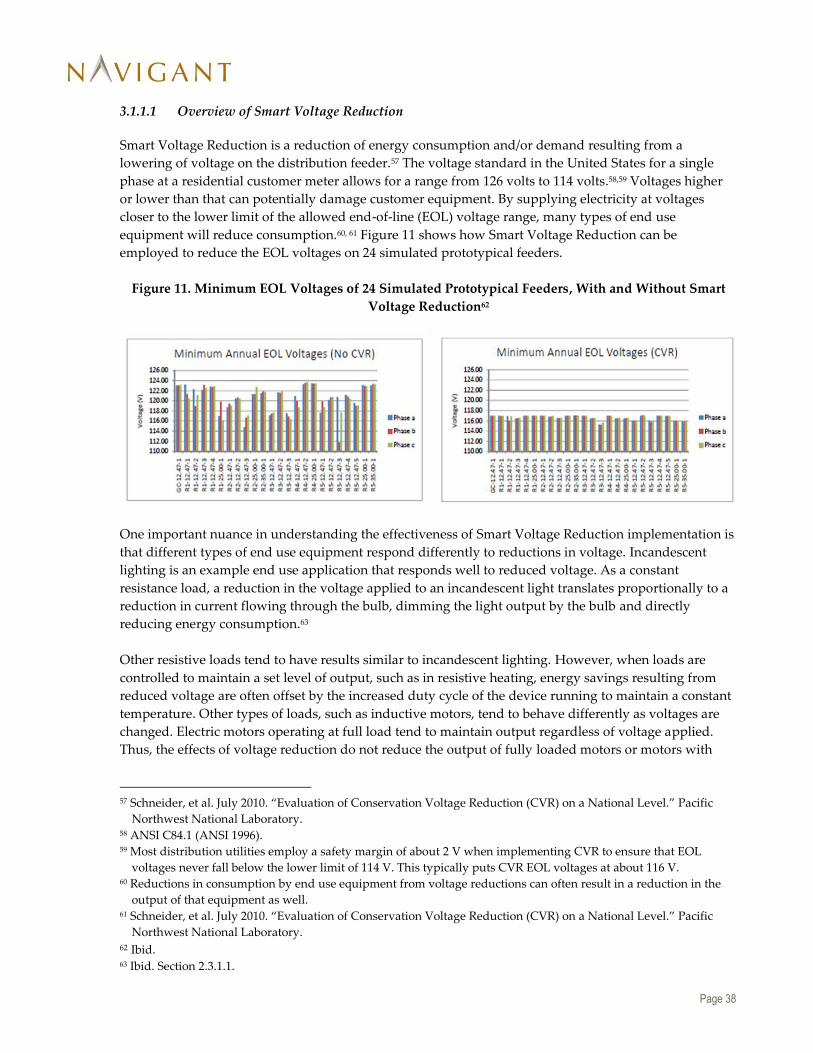
Page 38
3.1.1.1 Overview of Smart Voltage Reduction
Smart Voltage Reduction is a reduction of energy consumption and/or demand resulting from a
lowering of voltage on the distribution feeder.57 The voltage standard in the United States for a single
phase at a residential customer meter allows for a range from 126 volts to 114 volts.58,59 Voltages higher
or lower than that can potentially damage customer equipment. By supplying electricity at voltages
closer to the lower limit of the allowed end-of-line (EOL) voltage range, many types of end use
equipment will reduce consumption.60, 61 Figure 11 shows how Smart Voltage Reduction can be
employed to reduce the EOL voltages on 24 simulated prototypical feeders.
Figure 11. Minimum EOL Voltages of 24 Simulated Prototypical Feeders, With and Without Smart
Voltage Reduction62
One important nuance in understanding the effectiveness of Smart Voltage Reduction implementation is
that different types of end use equipment respond differently to reductions in voltage. Incandescent
lighting is an example end use application that responds well to reduced voltage. As a constant
resistance load, a reduction in the voltage applied to an incandescent light translates proportionally to a
reduction in current flowing through the bulb, dimming the light output by the bulb and directly
reducing energy consumption.63
Other resistive loads tend to have results similar to incandescent lighting. However, when loads are
controlled to maintain a set level of output, such as in resistive heating, energy savings resulting from
reduced voltage are often offset by the increased duty cycle of the device running to maintain a constant
temperature. Other types of loads, such as inductive motors, tend to behave differently as voltages are
changed. Electric motors operating at full load tend to maintain output regardless of voltage applied.
Thus, the effects of voltage reduction do not reduce the output of fully loaded motors or motors with
57 Schneider, et al. July 2010. “Evaluation of Conservation Voltage Reduction (CVR) on a National Level.” Pacific
Northwest National Laboratory. 58 ANSI C84.1 (ANSI 1996). 59 Most distribution utilities employ a safety margin of about 2 V when implementing CVR to ensure that EOL
voltages never fall below the lower limit of 114 V. This typically puts CVR EOL voltages at about 116 V. 60 Reductions in consumption by end use equipment from voltage reductions can often result in a reduction in the
output of that equipment as well. 61 Schneider, et al. July 2010. “Evaluation of Conservation Voltage Reduction (CVR) on a National Level.” Pacific
Northwest National Laboratory. 62 Ibid. 63 Ibid. Section 2.3.1.1.

Page 39
controlled output. Also, the internal efficiency of inductive motors may change non-linearly as voltage
changes. These changes in efficiency are not easy to predict and can vary according to several factors.64
Poor feeder health is one barrier to deployment of Smart Voltage Reduction in the Pacific Northwest.
Under-built distribution infrastructure or poor feeder power factor can lower EOL voltages, limiting the
extent to which voltage reduction can be implemented. These feeders often require additional
preparation to make feeders “healthy” before Smart Voltage Reduction can be implemented, such as
adding distribution capacity, re-conductoring, adding capacitor banks for power factor correction, or
other investments. 65 Although these measures must take place before implementing Smart Voltage
Reduction, it is debatable whether these costs should be attributed as Smart Voltage Reduction costs or
simply as traditional distribution capacity costs necessary to ensure a healthy distribution system.
To address this issue, a deployment approach was applied such that only two-thirds of feeders are
candidates for Smart Voltage Reduction by 2030. Feeders receiving Smart Voltage Reduction are
assumed to need equipment for power factor correction but not re-conductoring or other upgrades,
which are assumed to occur independently over the long term. This is a key assumption since past BPA
assessments of Smart Voltage Reduction have shown unattractive B/C results when feeder phase
investments and re-conductoring are required.66
3.1.1.2 Smart Voltage Reduction Applications
Smart Voltage Reduction can be employed in a variety of ways to achieve both energy savings and peak
load reduction. Four implementation types of voltage reduction are described below. The first type is
considered traditional voltage reduction, while the remaining types are considered Smart Voltage
Reduction since they rely on digital communications to enhance and increase the impacts of traditional
voltage reduction measures (see Appendix B.1).
1. Manual Static CVR (considered traditional, non-smart grid)
Many voltage reduction implementations to date are considered “manual static CVR.” These
implementations rely on data-gathering efforts to establish a statistical sample of EOL voltages
and sometimes do not use primary EOL voltage data, substituting voltages at the distribution
substations and using load flow calculations to estimate EOL voltages. Because of the
uncertainty associated with these data, an additional voltage safety margin is sometimes
employed, reducing the potential impacts of CVR. The reduction is achieved by deploying field
crews to distribution transformers to manually “dial down” transformer voltages.67
Manual static CVR does not use two-way communications or rely on any form of automated
intelligence. Thus, it is not considered “smart grid” in the RBC68.
64 Westinghouse Electric Corporation. Data is for a Westinghouse standard Design B, 40-hp, 460-V, 60-Hz, 4-pole,
squirrel cage induction motor. 65 Feeder “health” refers to a variety of requirements that govern the minimum allowed power factor and the
maximum allowed voltage drop over the length of the feeder. 66 For example, B/C ratios of as low as 0.2 were found for traditional CVR on feeders that required phase
investments, when those upgrades costs are treated as CVR costs. 67 Crew dispatch to substations, if needed, is not a large cost. Typically transformers would be adjusted several (or at
most around fifteen) times per year. Manual tap changes require a two-man crew and usually take an hour to
perform. 68 Some utilities have been using a smart form of voltage reduction based on SCADA feedback for decades.
Although this technology may be older, it is considered Smart Voltage Reduction in this analysis. Manual Static
CVR does not include this form of voltage reduction as defined in this paper.

Page 40
The primary costs associated with manual static CVR are in gathering data including necessary
metering and monitoring equipment and dispatching crews to manually adjust transformer
voltages. On “healthy” distribution systems with sufficient EOL voltage safety margins, CVR
can be an inexpensive measure compared to the energy and/or demand savings that can be
achieved. Even so, many utilities are not comfortable reducing voltages substantially, given the
uncertainty associated with EOL voltages.
2. AMI/Data-Enhanced Static CVR (considered smart grid)
AMI is used to measure voltages at the customers’ meters. This data can give utilities more
confidence to reduce voltage safety margins, resulting in broader uptake of CVR in the region.
AMI/data-enhanced static CVR can require investment in or utilization of existing advanced
metering infrastructure. In many areas, AMI deployment is already underway and can already
provide a platform for CVR at little additional cost. For utilities that do not already have it, AMI
can be a substantial investment and is typically not an investment warranted for CVR
implementation alone. However, CVR would not require a full AMI deployment and could
instead rely on a statistical sample to acquire confidence in EOL voltages.
3. Advanced Voltage Control69 (considered smart grid)
Advanced voltage control is a more dynamic and actively controlled form of Smart Voltage
Reduction that can allow further reduction of voltage to maximize energy savings without
risking excessively low EOL voltages. Continuous data available from an AMI deployment
combined with dispatchable load-tap transformers can allow operators to remotely adjust
transformer voltages to increase energy savings when possible, while ensuring that customers
receive appropriate EOL voltages. The AMI and dispatchable load-tap transformers can be
incorporated into an automated closed-loop system that continually optimizes trade-offs in EOL
voltage and energy consumption to maximize energy savings by precisely controlling voltage
within acceptable limits.70
Dispatchable load-tap transformers represent the primary capital investment required for
advanced voltage control. It would be most cost efficient to replace traditional transformers as
they reach the end of their useful lives, although Smart Voltage Reduction may create a case for
early transformer retirement in some instances. Advanced voltage control also requires
additional investment to integrate an automated voltage control system at utilities.
4. DVR71 (considered smart grid)
If needed, utilities can also employ the technology used in advanced voltage control as a DR
resource to reduce peak demand and mitigate overload events.72 This would entail lowering
69 Pacific Northwest National Laboratory. January 2010. “The Smart Grid: An Estimation of the Energy and CO2
Benefits.” page 3.27. 70 For example, Dominion Voltage Inc. developed such a system “in house” in collaboration with Lockheed. They are
have offered this solution as a product to other utilities under the EDGESM platform. 71 Demand benefits are estimated for all Smart Voltage Reduction applications. DVR, conversely is not activated
under normal conditions to achieve energy savings, but is used to reduce peak loads, avoid demand charges, etc. 72 In fact, historically, many early voltage reduction deployments were focused predominately on the demand
benefits. In recent years, voltage reduction has increasingly been classified as an energy efficiency measure, and
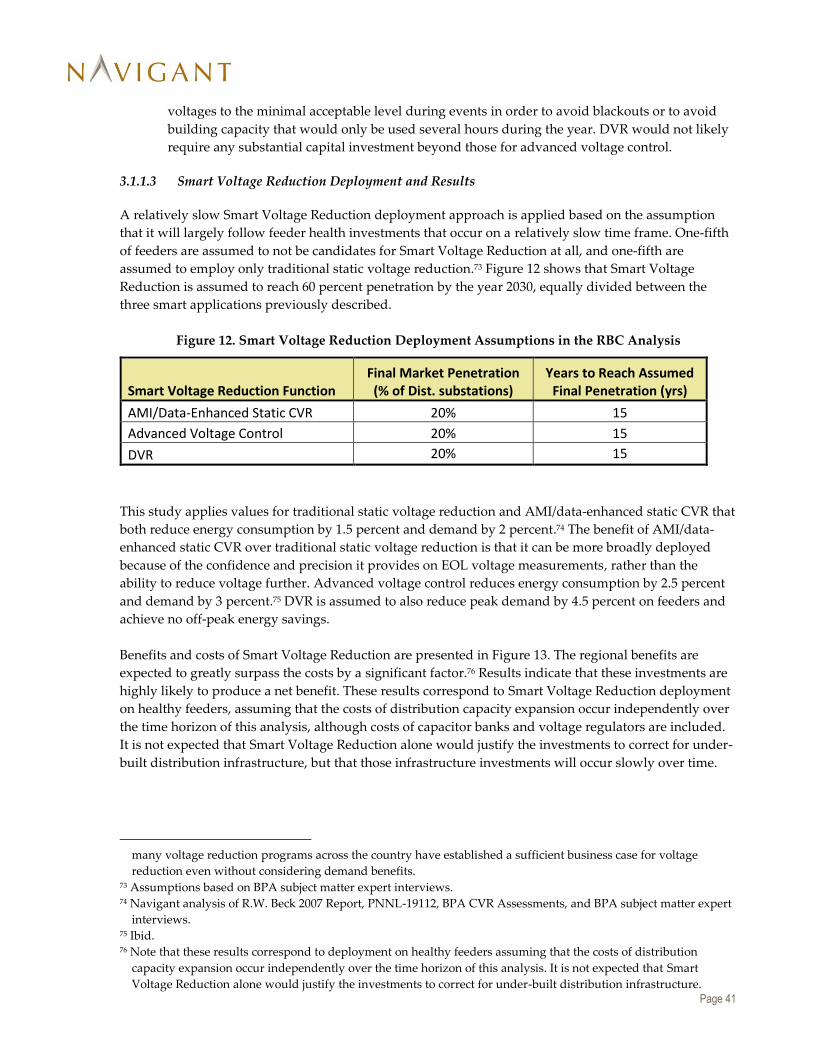
Page 41
voltages to the minimal acceptable level during events in order to avoid blackouts or to avoid
building capacity that would only be used several hours during the year. DVR would not likely
require any substantial capital investment beyond those for advanced voltage control.
3.1.1.3 Smart Voltage Reduction Deployment and Results
A relatively slow Smart Voltage Reduction deployment approach is applied based on the assumption
that it will largely follow feeder health investments that occur on a relatively slow time frame. One-fifth
of feeders are assumed to not be candidates for Smart Voltage Reduction at all, and one-fifth are
assumed to employ only traditional static voltage reduction.73 Figure 12 shows that Smart Voltage
Reduction is assumed to reach 60 percent penetration by the year 2030, equally divided between the
three smart applications previously described.
Figure 12. Smart Voltage Reduction Deployment Assumptions in the RBC Analysis
Smart Voltage Reduction Function Final Market Penetration (% of Dist. substations)
Years to Reach Assumed Final Penetration (yrs)
AMI/Data-Enhanced Static CVR 20% 15
Advanced Voltage Control 20% 15
DVR 20% 15
This study applies values for traditional static voltage reduction and AMI/data-enhanced static CVR that
both reduce energy consumption by 1.5 percent and demand by 2 percent.74 The benefit of AMI/data-
enhanced static CVR over traditional static voltage reduction is that it can be more broadly deployed
because of the confidence and precision it provides on EOL voltage measurements, rather than the
ability to reduce voltage further. Advanced voltage control reduces energy consumption by 2.5 percent
and demand by 3 percent.75 DVR is assumed to also reduce peak demand by 4.5 percent on feeders and
achieve no off-peak energy savings.
Benefits and costs of Smart Voltage Reduction are presented in Figure 13. The regional benefits are
expected to greatly surpass the costs by a significant factor.76 Results indicate that these investments are
highly likely to produce a net benefit. These results correspond to Smart Voltage Reduction deployment
on healthy feeders, assuming that the costs of distribution capacity expansion occur independently over
the time horizon of this analysis, although costs of capacitor banks and voltage regulators are included.
It is not expected that Smart Voltage Reduction alone would justify the investments to correct for under-
built distribution infrastructure, but that those infrastructure investments will occur slowly over time.
many voltage reduction programs across the country have established a sufficient business case for voltage
reduction even without considering demand benefits. 73 Assumptions based on BPA subject matter expert interviews. 74 Navigant analysis of R.W. Beck 2007 Report, PNNL-19112, BPA CVR Assessments, and BPA subject matter expert
interviews. 75 Ibid. 76 Note that these results correspond to deployment on healthy feeders assuming that the costs of distribution
capacity expansion occur independently over the time horizon of this analysis. It is not expected that Smart
Voltage Reduction alone would justify the investments to correct for under-built distribution infrastructure.

Page 42
Figure 13. Smart Voltage Reduction Benefits Expected to Greatly Surpass Costs
Figure 14 shows a time series of costs and benefits for Smart Voltage Reduction. The shaded area below
the x-axis represents annual costs, and the shaded area above the x-axis represents annual benefits. The
dashed line represents the cumulative NPV of Smart Voltage Reduction costs and benefits.
The cumulative NPV for Smart Voltage Reduction does not drop below zero in the figure because the
initial implementation on healthy feeders comes at little cost relative to the benefit. About half of the
benefits come from avoided capacity benefits rather than energy. This occurs for three reasons: 1) a third
of Smart Voltage Reduction deployment is assumed to only be used during system peak hours (i.e.,
through DVR), 2) Smart Voltage Reduction factors can improve by about 50 percent during peak hours,
and 3) energy costs are relatively low in the Pacific Northwest. This finding is interesting since Smart
Voltage Reduction is typically valued (and incented) for its energy savings rather than its capacity
savings. Additionally, Smart Voltage Reduction as a DR resource does not have the lost revenue problem
(described below) that the other Smart Voltage Reduction applications have. The results indicate that
Smart Voltage Reduction can prove cost-effective even if only activated during peak periods, an
approach that might allow greater uptake since it does not have the rate pressure problems associated
with lost revenue.
The results also indicate an increase in costs beginning after 2020. The RBC assumes that Smart Voltage
Reduction will be implemented on the healthiest feeders first. Once saturation occurs on the healthiest
feeders, the RBC begins to include capacitor bank and voltage regulator investments that would be
required to correct excessive voltage drop.

Page 43
Figure 14. Smart Voltage Reduction Can Create Large Benefits in the Region
Figure 15 presents the expected cost benefit results occurring through the value chain. Even though
Smart Voltage Reduction is a very attractive investment overall, the impacts to stakeholders in the value
chain (i.e., generation, transmission, distribution, and end use) are complex.
The upfront investment cost for Smart Voltage Reduction falls on the distribution portion of the
infrastructure, thus the primary investment and execution risk typically falls to the distribution utility.
But only a portion of the benefits accrue to distribution utilities. In particular, the benefit of lower energy
consumption seen by end users is a direct loss of energy sales revenues to the distribution utility.
This is likely one reason that Smart Voltage Reduction has seen slower deployment than would be
expected based on its attractive cost-effectiveness characteristics.77 BPA has offered its utility customers
significant incentives for Smart Voltage Reduction projects, which has offset this investment risk in
many cases.78 Overcoming these barriers is important to more widespread Smart Voltage Reduction
adoption in the region.
Figure 15 shows that the benefits for the generation, transmission, and distribution categories represent
Avoided Capacity Costs (i.e., shown as “ACC” in the figure) and reduced energy consumed by line
losses. The benefits at the end user category represent avoided energy consumption that result in
reduced bills. Net costs and benefits are indicated in Figure 15 with a purple color. End use energy
savings result in reduced end user bills, but are seen as lost revenue (indicated with a grey color) to the
distribution utility. These lost revenues ripple through the value chain back to the Generation value
77 Northwest Energy Efficiency Alliance (NEEA) has updated their Long Term Monitoring & Tracking Report on
CVR. The information from this report may impact adoption of smart voltage reduction. 78 BPA has offered incentives to its public power customer distribution utilities to plan and/or implement CVR from
1986 to 1994, and then again from 2002 to the present day. Historically, incentives of $0.04/kWh to $0.18/kWh of
estimated first year annual energy savings were offered for CVR. That typically covered between 50 percent and
90 percent of the distribution utility implementation costs. BPA has offered incentives up to $0.25/kWh of first
year annual savings for CVR.

Page 44
chain position. For cost-effectiveness purposes, the cost of lost revenues is offset by the benefit of
reduced energy purchases. However, lost revenue presents an important obstacle to the adoption of
Smart Voltage Reduction.
Figure 15. Smart Voltage Reduction Is Attractive Overall, but Costs Fall on Distribution
Lost revenues pose a problem because the investments made by utilities must be recovered over lower
kWh energy sales, resulting in pressure to increase kWh energy rates. In the case of IOUs, these reduced
revenues may be recoverable through increased future rates as part of an overall rate-case process,
although this process is infrequent and sometimes considered undesirable. POUs, however, may be
more constrained in raising rates, and the rate pressure associated with lost revenues may prevent them
from pursuing Smart Voltage Reduction investments. More utilities around the country are allowing
Smart Voltage Reduction and voltage optimization energy savings to be counted towards state energy
efficiency targets, often set through legislation. For example, in Washington, Initiative-937 sets
renewable energy targets as well as conservation targets, some of which could be met by CVR.79
3.1.2 PMU Applications Provide Reliability Insurance and Other Benefits
PMUs are highly precise sensors that communicate grid measurements (i.e., synchrophasors) from
across a transmission system. The measurements are taken at high speed and synchronized to give a
more precise and comprehensive view of a broad transmission geography as compared with
conventional technology. Synchrophasors enable a better indication of grid stress, and can be used to
trigger corrective actions to maintain reliability.80
BPA is a major partner in a large PMU initiative for the western United States called the Western
Interconnection Synchrophasor Program (WISP).81,82 Led by the Western Electricity Coordinating
79 http://www.secstate.wa.gov/elections/initiatives/text/i937.pdf 80 See http://www.NASPI.org. 81 See http://www.wecc.biz/awareness/pages/wisp.aspx. 82 Note that the RBC model assumes deeper long-term deployment of synchrophasors than currently planned by
WISP including at least one PMU per transmission substation and 1 per major wind farm interconnection, leading
to about 400 total PMUs deployed in the PNW region.
0200400600800
1,0001,2001,4001,6001,8002,000
Benefit Cost Benefit Cost Benefit Cost Benefit Cost
$M (
Pre
sent
Val
ue)
Present Value of Benefits and Costs of Smart Voltage Reduction(Expected Case)
Generation Transmission Distribution End Use
Avoided Capacity Cost (ACC)
Fue
l P
urch
ase
Lost
Rev
enue
Lost
Rev
enue
Lost
Rev
enue
Red
uced
Bill
s
Ene
rgy
Pur
chas
e
Ene
rgy
Pur
chas
e
Ince
ntiv
eP
aym
ent
ACC ACC
Sm
art V
olta
geR
educ
tion
Cos
t
Lost ProfitLost Profit
Lost Profit

Page 45
Council, WISP participants have installed more than 500 new or upgraded PMUs. Together, these PMU
measurements can identify and analyze system vulnerabilities in real time, and can detect evolving
disturbances in the western bulk electric system.
3.1.2.1 Smart PMU Applications
The PMU capabilities included in the RBC analysis include the following applications:
1. Dynamic Capacity Rating
Some transmission facilities are not used to optimal capacity. Transmission capacity assessments
will be based on precise, real-time measurements, rather than on slower, coarser measurements
or simulation methods. This will increase the effective capacity of selected congested lines,
increase transmission asset utilization, and lower energy costs.
2. Renewable Monitoring and Integration
PMUs are being deployed at major renewable sites to improve the use of those generation assets.
As the penetration of these resources increases, firm capacity resources must augment the
system to maintain grid reliability. PMUs located at major renewable sites increase real-time
awareness of these resources, improving their use and reducing the need for operational
reserves to support their integration.
3. WAM
WAM and situational awareness require precisely synchronized sensors, communications, and
information processing. This data makes it possible for the condition of the bulk power system
to be observed and understood in real time. This high-precision WAM and control can reduce
the frequency of high-duration, widespread outages originating from instabilities in the bulk
power grid. Avoiding widespread outages represents substantial economic value to customers.
For example, the economic damages that major outages cause in large cities are typically valued
in the hundreds of millions of dollars or more.83
3.1.2.2 PMU Deployment and Results
Actual deployment in the Pacific Northwest has already reached over 150 PMUs under the WISP
initiative, with roughly 125 PMUs in BPA territory. Figure 16 below shows that the RBC analysis applies
a deployment of 70 percent–roughly three times the current WISP deployment over a 30-year time
frame. This would ultimately lead to the installation of about 350 PMUs in the region.84
83 For example, ICF Consulting estimated the economic damage of the 2003 Northeastern Blackout at $7B-$10B. “The
Economic Cost of the Blackout: An Issue Paper on the Northeaster Blackout, August 14, 2003.” ICF Consulting. 84 Based on discussions with BPA. Includes both the redundant secure PMUs and data PMUs installed by partners.
The RBC applies diminishing benefits for each additional PMU since the initial WISP investment will enable much
of the intended functionality, and additional PMUs are only expected to refine the functions.

Page 46
Figure 16. PMU Deployment Assumptions in the RBC Analysis85
Figure 17 below shows that PMU investments for all applications combined are expected to yield a
highly positive NPV. PMU costs are fairly well understood, based on actual project data. Costs are
attributed in roughly equal proportions across the three PMU applications. The benefits, however, are
highly uncertain, yielding a wide range of possible NPV values. Even though the benefits are uncertain,
they are still expected to surpass their relatively low costs. Thus, PMU deployment overall is not
considered a risky investment.
Figure 17. PMU Applications Have Large, Uncertain Benefits, But Very Low Relative Costs
One interesting finding pertains to WAM: The median value of the benefits is near zero. This is based on
the low likelihood of the occurrence of a wide-area outage, 86 even in the absence of the PMU system.
However, in the rare event that a wide-area outage did occur, and that the PMU system prevents or
85 The saturation timeframe values shown in the table are meant to indicate an adoption timeframe for all utility
adoption decisions in the region. 86 86 There is an estimated 40 percent chance of a Cascadia Subduction Zone earthquake within the region in the next
50 years; however, it is not expected that the PMU-based WAM application analyzed in the RBC could help avoid a
wide-area outage in the event of an earthquake. http://oregonstate.edu/ua/ncs/archives/2012/jul/13-year-cascadia-
study-complete-%E2%80%93-and-earthquake-risk-looms-large
PMU Function
Final Market Penetration
(% of Tx substations)
Saturation Timeframe
(yrs)
Dynamic Capacity Rating 70% 30
Renewable Monitoring & Integration 70% 30
Wide Area Monitoring 70% 30
Note: This deployment results in approximately 350 PMUs deployed in the Northwest.

Page 47
mitigates its occurrence, there can be substantial benefit. Figure 18 below shows the cumulative
probability distribution of the NPV of WAM. Effectively WAM acts as an insurance policy against wide-
area outages.
Figure 18. Wide-Area Monitoring Provides Insurance against Costly Regional Outages87
The likelihood of wide-area outages of various sizes was estimated by interpolating national level,
widespread outage data88 (shown in Figure 19) and applying LBNL value of service reliability
estimates.89
87 This chart represents the cumulative frequency of NPV which states the probability of not exceeding a certain
NPV value. The low, expected, and high case values are not easily derived from this graphic. The purpose of
using the cumulative frequency format is to illustrate the “long tail” possibility that the wide area monitoring
system might prevent a major widespread outage. Insurance functions typically share this long tail shape. 88 U.S.-Canada Power System Outage Task Force. June 2006. “Final Report on the Implementation of Task Force
Recommendations.” http://energy.gov/oe/downloads/us-canada-power-system-outage-task-force-final-report-
implementation-task-force. 89 Michael J. Sullivan. 2009. Estimated Value of Service Reliability for Electric Utility Customers in the United States. LBNL-
2132E. Berkeley, CA: Ernest Orlando Lawrence Berkeley National Laboratory.
0%
20%
40%
60%
80%
100%
-0.2 0 0.3 0.5 0.8 1 1.3 1.5 1.7 2 2.2 2.5 2.7 3
Lik
elih
oo
d o
f O
ccu
rren
ce
$B (present value)
Net Present Value of Wide Area Monitoring(Cumulative Probability Results)
Note: Approximately 80% chance of negative NPV, but approximately 10% chance of $200M benefit or much larger. Wide area monitoring investment resembles an insurance policy.
Illustrative shape for typical grid investments with uncertainty.
Scenario Low Expected High
Benefit ($B) 0.00 0.17 0.92
Cost ($B) 0.07 0.10 0.13
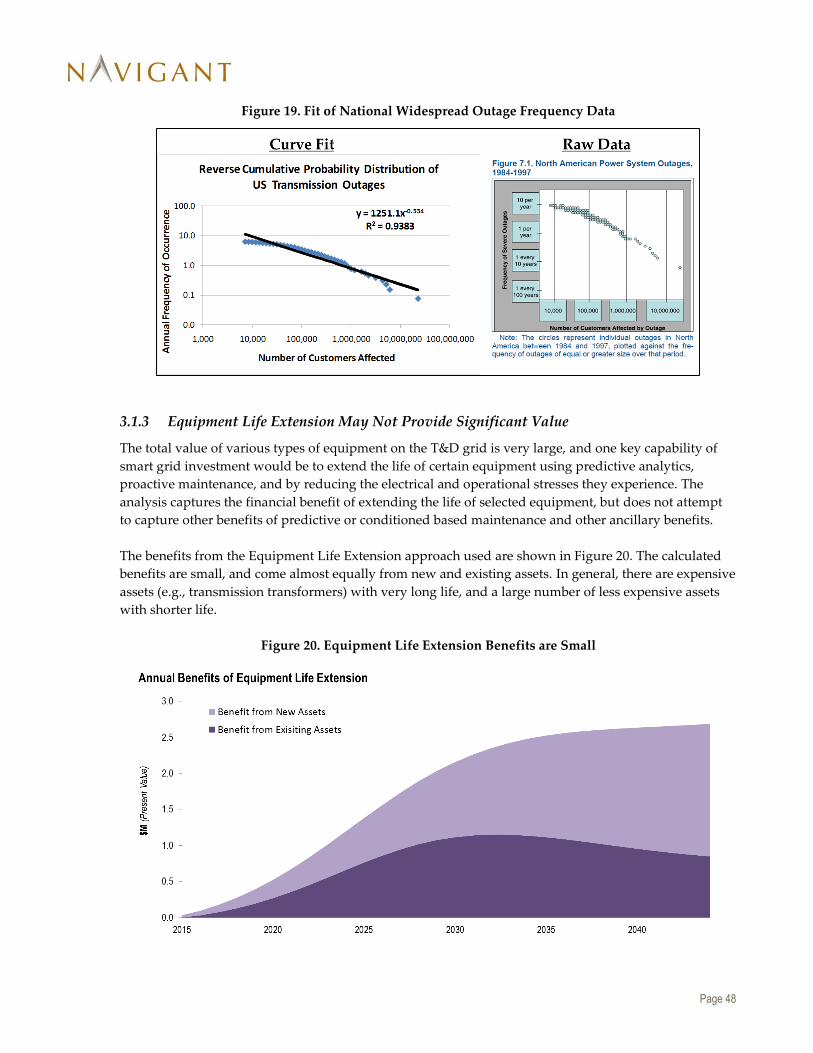
Page 48
Figure 19. Fit of National Widespread Outage Frequency Data
3.1.3 Equipment Life Extension May Not Provide Significant Value
The total value of various types of equipment on the T&D grid is very large, and one key capability of
smart grid investment would be to extend the life of certain equipment using predictive analytics,
proactive maintenance, and by reducing the electrical and operational stresses they experience. The
analysis captures the financial benefit of extending the life of selected equipment, but does not attempt
to capture other benefits of predictive or conditioned based maintenance and other ancillary benefits.
The benefits from the Equipment Life Extension approach used are shown in Figure 20. The calculated
benefits are small, and come almost equally from new and existing assets. In general, there are expensive
assets (e.g., transmission transformers) with very long life, and a large number of less expensive assets
with shorter life.
Figure 20. Equipment Life Extension Benefits are Small

Page 49
The value of Equipment Life Extension cuts across several capability areas, including Fault Current
Limiting and Notification of T&D Equipment Condition. The algorithm calculating this value was
modified since the 2013 Whitepaper to account for benefits to the existing base of assets. Updated
information from BPA (example shown in Figure 21) was incorporated to more accurately account for
the age of the existing equipment stock.
Figure 21. Example of Existing Transmission Equipment Stock Age90
In addition to the benefits arising from deferred replacement of new and existing grid assets, Equipment
Life Extension also provides for reduced O&M requirements – especially in the form of costly emergency
equipment replacement operations. Reductions in number or frequency of emergency equipment
replacement operations would also improve overall system reliability. The impacts of these secondary
benefits were not quantified in this study.
3.2 Smart DR Can Provide Flexible Response to Changing Grid Conditions
The changing landscape of supply in the Pacific Northwest is driving a renewed interest in DR in the
region. This change is due, in part, to expected limitations in available traditional regional generation
capacity resources and an increasing penetration of renewable generation. There may also be
opportunities to defer or reduce costly new transmission line and substation investments using DR.
Utilities in the region are starting to explore capacity alternatives as the region’s electricity demand
begins to shift and outgrow the capacity provided by the region’s hydro system and traditional
generation facilities are retired. Although regional peak load is expected to remain low in the near term
as a result of the economic downturn, forecasts still show annual load growth of 0.75-1.5 percent over the
next ten years,91 with coal retirements causing a capacity shortfall by about 2021.92
90 BPA Transmission Asset Management Strategy FY2014-2023 (December 2013) 91 Pacific Northwest Utilities Conference Committee. April 2013. Northwest Regional Forecast of Power Loads and
Resources: 2014 through 2023, available at: http://www.pnucc.org/sites/default/files/file-
uploads/2013%20Northwest%20Regional%20Forecast_0.pdf. 92 Based on discussions with BPA in Q3 2014.

Page 50
One of the options being considered to meet these capacity constraints is DR,93 which can offer a lower-
cost, more environmentally friendly alternative to building new generation. DR can help smooth the
demand curve and reduce supply needs during times of peak demand through programs targeted at
peak shifting, using customers’ end use loads. Such programs are already used widely around the
country with proven success, and the initial DR pilots and full-scale programs within the region suggest
that these programs could be successfully deployed on a broader scale across the Pacific Northwest to
achieve both winter and summer peak load savings.
In addition to changes in capacity needs, the Pacific Northwest is seeing persistent growth in renewable
generation, with the greatest contributions coming from highly variable generation types such as wind
power. These renewables change the shape, timing, and stability of the electricity supply available on the
grid, with a greater regional need for ancillary services known as INC and DEC to balance supply.94 In
recent years, due to constraints on the hydro system and a surplus of wind energy during certain parts
of the year, BPA has mitigated oversupply situations when more power is generated from wind and
hydro than is consumed on the grid. While BPA does not anticipate the need for oversupply mitigation
or additional DEC resources in the near-term, the flexibility that DR offers can help serve both of these
needs if the need arises again in the future.95 Fast-acting DR resources capable of providing peak shifting
(discussed above) are capable of providing INC services, while a subset of these loads are also suitable
for providing DEC services and oversupply mitigation.
These changing regional supply-side needs are accompanied by evolving demand-side capabilities,
which make DR more attractive than ever as a solution. Some of these capabilities are a result of
technological advancements (e.g., the increasing prevalence of smart meters, in-home technology, and
communications protocols like OpenADR96), while others are a result of DR’s increasing maturity within
the industry (e.g., through broader stakeholder acceptance, improved economies of scale, etc.). The result
is a landscape in which utilities should be able to more easily access and use DR as a fast-acting resource,
in response to changing market drivers and pricing signals and with greater operator confidence and
transparency. (See Section 4.2 for more discussion on the potential impacts of technological
advancements on Smart DR investments.)
3.2.1 Smart DR Applications
Many forms of DR are possible without smart grid and have been feasible for decades. Utility programs
like Portland General Electric’s interruptible contracts for industrial customers or Idaho Power’s direct
load control program for residential customers are examples of regional DR initiatives that have
operated for years without smart grid.
93 The U.S. Department of Energy defines demand response as “Changes in electric usage by end use customers from
their normal consumption patterns in response to changes in the price of electricity over time, or to incentive
payments designed to induce lower electricity use at times of high wholesale market prices or when system
reliability is jeopardized.” Department of Energy Report to Congress on the Benefits of Demand Response, 2006. 94 INC represents a within-hour load decrease for non-spinning balancing purposes and DEC represents a within-
hour load increase for non-spinning balancing reserves. 95 Near-term benefits from avoided oversupply mitigation and avoided DEC purchases as a result of DR deployment
were included in the Interim RBC, but are not included in this updated version, partially as a result of recent
changes to the installed wind capacity within BPA’s balancing authority. However, the analysis assumes that there
may still be a role for DR in the longer-term to help avoid future DEC purchases. 96 http://www.openadr.org/.

Page 51
However, smart grid can bring important benefits to DR programs that traditional DR mechanisms
cannot provide, such as improved response rates, deeper curtailment, increased participation, and use of
DR for resources like ancillary services and oversupply mitigation that require more advanced
communication and control capabilities than traditional DR can provide.
Since the RBC analysis focuses on the benefits and costs that can be attributed specifically to the
application of smart grid, the distinction between Smart DR and traditional DR that does not require
smart grid is particularly important for appropriately attributing the smart grid costs and benefits for
DR.
The RBC defines smart grid as having two-way communications and some form of automated
intelligence.97 For example, a direct load control program for residential space heating, in which utilities
use one-way communications to control the heating system during times of peak load, would not be
considered a smart grid application. Thus, the benefits and costs of such a program are not considered in
the RBC. In contrast, a space heating direct load control program with two-way communications and the
ability to convey and respond to dynamic pricing signals would be considered a smart grid application.
Figure 22 provides more information on these examples.
Figure 22. Examples of DR Applications and Their Classification as Smart Versus Traditional DR98
For the most part, the use of DR for ancillary services and pricing programs is considered Smart DR,
while the traditional dispatch of DR is taken as a baseline except for end uses that have not traditionally
been used for DR (i.e., appliances and lighting). Figure 23 provides further illustration of the distinction
between smart and traditional DR.
97 A capability must be at least partially automated, though not necessarily fully automated, to qualify as smart grid. 98 Often traditional systems employ SCADA data as a feedback mechanism for DR events. However, the definition
of “Smart DR” used by the RBC requires the feedback to come directly from the point of control.
End Use Communications Device(s) Capability Smart Grid?
Space HeaterOne-way
(e.g., DLC)Load control switch Peak load reduction through utility control No
Space HeaterTwo-way
(e.g., Broadband)Smart thermostat Peak load reduction in response to pricing signals Yes
Water HeaterTwo-way
(e.g., Broadband)Smart controller
Peak load reduction in response to pricing signals and
provision of INC/DEC servicesYes
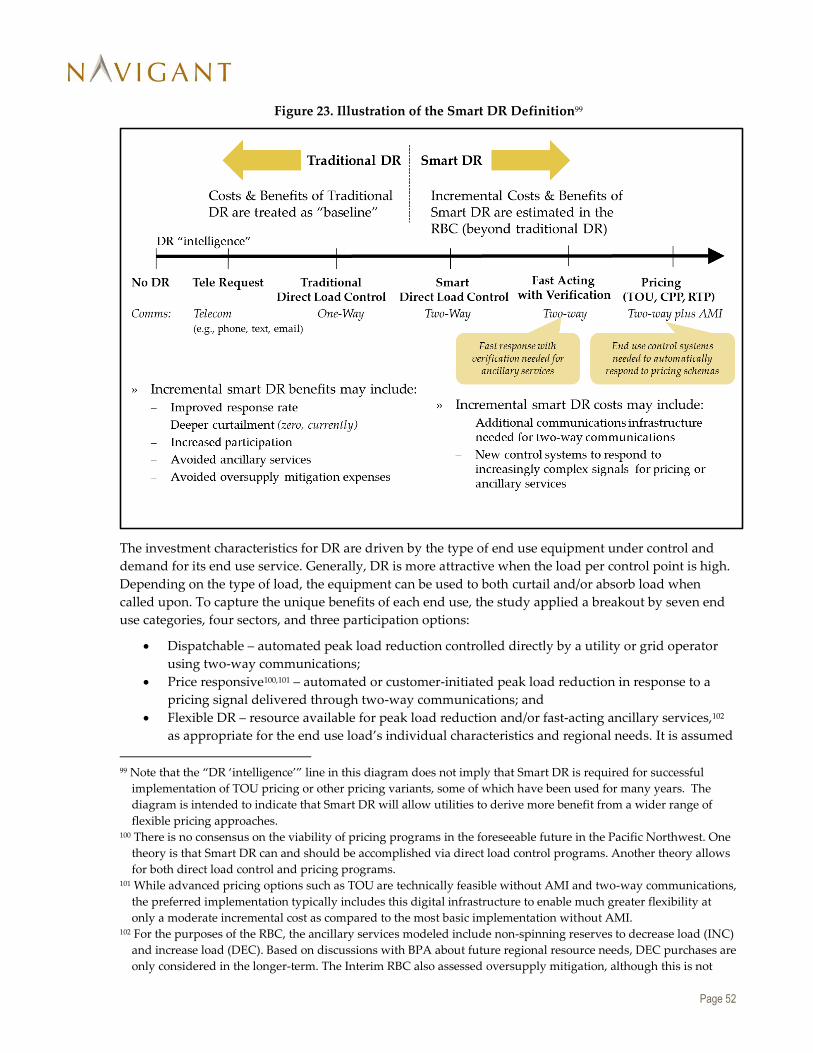
Page 52
Figure 23. Illustration of the Smart DR Definition99
The investment characteristics for DR are driven by the type of end use equipment under control and
demand for its end use service. Generally, DR is more attractive when the load per control point is high.
Depending on the type of load, the equipment can be used to both curtail and/or absorb load when
called upon. To capture the unique benefits of each end use, the study applied a breakout by seven end
use categories, four sectors, and three participation options:
Dispatchable – automated peak load reduction controlled directly by a utility or grid operator
using two-way communications;
Price responsive100,101 – automated or customer-initiated peak load reduction in response to a
pricing signal delivered through two-way communications; and
Flexible DR – resource available for peak load reduction and/or fast-acting ancillary services,102
as appropriate for the end use load’s individual characteristics and regional needs. It is assumed
99 Note that the “DR ‘intelligence’” line in this diagram does not imply that Smart DR is required for successful
implementation of TOU pricing or other pricing variants, some of which have been used for many years. The
diagram is intended to indicate that Smart DR will allow utilities to derive more benefit from a wider range of
flexible pricing approaches. 100 There is no consensus on the viability of pricing programs in the foreseeable future in the Pacific Northwest. One
theory is that Smart DR can and should be accomplished via direct load control programs. Another theory allows
for both direct load control and pricing programs. 101 While advanced pricing options such as TOU are technically feasible without AMI and two-way communications,
the preferred implementation typically includes this digital infrastructure to enable much greater flexibility at
only a moderate incremental cost as compared to the most basic implementation without AMI. 102 For the purposes of the RBC, the ancillary services modeled include non-spinning reserves to decrease load (INC)
and increase load (DEC). Based on discussions with BPA about future regional resource needs, DEC purchases are
only considered in the longer-term. The Interim RBC also assessed oversupply mitigation, although this is not
Page 53
that resources used for fast-acting ancillary services can also be used for peak load reduction
because the benefits from ancillary services alone are not sufficient to justify the costs of DR
implementation, but they enhance the business case for Smart DR when bundled together with
peak load reduction.
Many of the costs associated with implementing a Smart DR infrastructure in the region are common to
the different end use categories. The RBC considered the administrative overhead, operations,
engineering, contracting, and other labor costs associated with establishing and maintaining the different
types of DR asset systems. All of the end use categories also have a set of common system costs
associated with them. The RBC model shares equipment costs across all of the asset systems that utilize
those pieces of equipment. For the seven different end use categories, equipment costs associated with
establishing and maintaining the two-way communications infrastructure are common. These include
the broadband bandwidth, web portals or smart phone apps, meter data management systems, DR
management systems, and, for some applications, AMI meters and gateway devices.103 There are also
unique costs associated with the different Smart DR end use categories that are discussed below:
1. Space Heating
Electric resistance space heating accounts for about 31 percent of residential and about 7 percent of
commercial end use regional energy consumption.104 The load per control point for electric space
heating is higher than space cooling in the Pacific Northwest due to higher heating loads than
cooling loads as well as the relative efficiency of each equipment type. There are less impact data
available nationally (and fewer programs) for space heating DR programs than space cooling
because most regions are summer-peaking when space heating load is not available to curtail.
There are few traditional space heating DR programs in the region currently.
In addition to the two-way communication system costs outlined above, the RBC assumes the
installation and programming of a smart thermostat to realize the benefits of a space heating Smart
DR program. Space heating can be used to either decrease load for balancing purposes or peak
shifting.
2. Space Cooling
Electric cooling accounts for just over 1 percent of residential and about 30 percent of commercial
end use regional energy consumption. Space cooling accounts for less end use in this region than
in other parts of the country, but there is still some potential for DR with air conditioners. Air
conditioning DR programs are common; they typically equip A/C units with a switch that can
receive a signal to turn off the unit during a DR event.
The RBC assumes the installation of a smart thermostat or a building energy management system
to achieve Smart DR space cooling, as well as two-way communications to respond to either price
included in this updated whitepaper. Fast-acting services could also be used for other services such as spinning
reserves and regulation, but those services were not included in the RBC. 103 In recent years, the landscape for these communications technologies has evolved. Previously, Smart DR
deployments relied on AMI-based communications to a gateway device, which communicated over a home area
network to in-home devices. More recently, however, utilities are communicating directly with the in-home
device via the customer’s broadband internet, avoiding the need for AMI-based communications or a gateway
device. To capture these changes, this analysis assumes that only price responsive DR requires AMI meters (e.g.,
for billing purposes) and only irrigation DR is assumed to require gateway devices. This is a significant change
from the Interim RBC, which assumed that both AMI meters and gateway devices were universally required for
Smart DR. 104 Based on the Northwest Power and Conservation Council’s Sixth Northwest Conservation and Electric Power
Plan.

Page 54
signals or a peak event. As building control systems evolve, strategies are also being developed to
utilize the thermal mass of larger buildings through precooling. Using these strategies, smart
thermostats may be used to cool the thermal mass of buildings during low demand periods, thus
shifting some cooling load away from peak periods. The additional assets deployed are nearly
identical to what would be required for a space heating program, so there is additional
opportunity to share asset costs while achieving benefits for both programs. Space cooling can be
used either for decreasing load for balancing purposes or during peak DR events.
3. Lighting
Lighting accounts for about 22 percent of commercial end use regional energy consumption. Smart
DR can be achieved by curtailing lighting use, but opportunities tend to be limited due to the
relatively small amount of load controlled at a single point. Smart lighting DR becomes more
attractive in facilities with a building management system, where lighting is controlled by a single
system. For a variety of reasons, opportunities are also limited by areas where lighting can either
be turned off completely or dimmed. A smart lighting DR system requires two-way enabled
lighting control systems at the customer site. Lighting can potentially be used for decreasing load
for balancing purposes as well as during peak DR events.
4. Appliances and Plug Loads
Appliances and plug loads account for about 24 percent of residential and about 13 percent of
commercial end use regional energy consumption. Relative to other end use point loads,
appliances and plug loads per control point are small. In the absence of an existing smart
infrastructure (i.e., where costs can be shared across many asset systems), DR using appliance and
plug loads may not be financially viable. If there is an existing Smart DR infrastructure, smart
appliance and plug loads could prove useful and supply some capacity for peak shifting. The
ultimate role of appliances and plug loads as DR resources is uncertain.
5. Water Heating
Electric water heating accounts for about 26 percent of residential and about 2 percent of
commercial end use regional energy consumption. Water heating is generally a versatile end use
for Smart DR purposes because it can both absorb significant amounts of load, as well as provide
load curtailment, but it does have limitations. In all cases, Smart DR using water heaters requires
the same Smart DR infrastructure as the other end use categories, as well as a switch on the water
heater controller enabled with two-way communications. Water heating can be used both for
decreasing and increasing load for balancing purposes, and for peak shifting and absorbing extra
load during oversupply situations. One issue that arises from using water heating for DEC
purposes is that the water can become too hot for safe use. This challenge can be overcome with a
mixing valve that combines the hot water with cold water to produce an appropriate water
temperature for consumption.
6. Industrial Process and Refrigeration
Industrial processes and refrigeration accounts for about 13 percent of commercial and about 49
percent of industrial end use regional energy consumption. Relative to other end use point loads,
these processes are usually large, single point end uses that represent an attractive opportunity for
Smart DR. For large-scale refrigeration (e.g., cold storage) the compressor motor and evaporator
fans represent large end use loads, similar to other industrial processes so these end uses were
grouped together in the analysis. For this Smart DR end use, there will either have to be custom,
process-specific control grid interfaces or energy management system grid interfaces, depending
on how the process is controlled at each individual site. The per-site costs for this Smart DR end
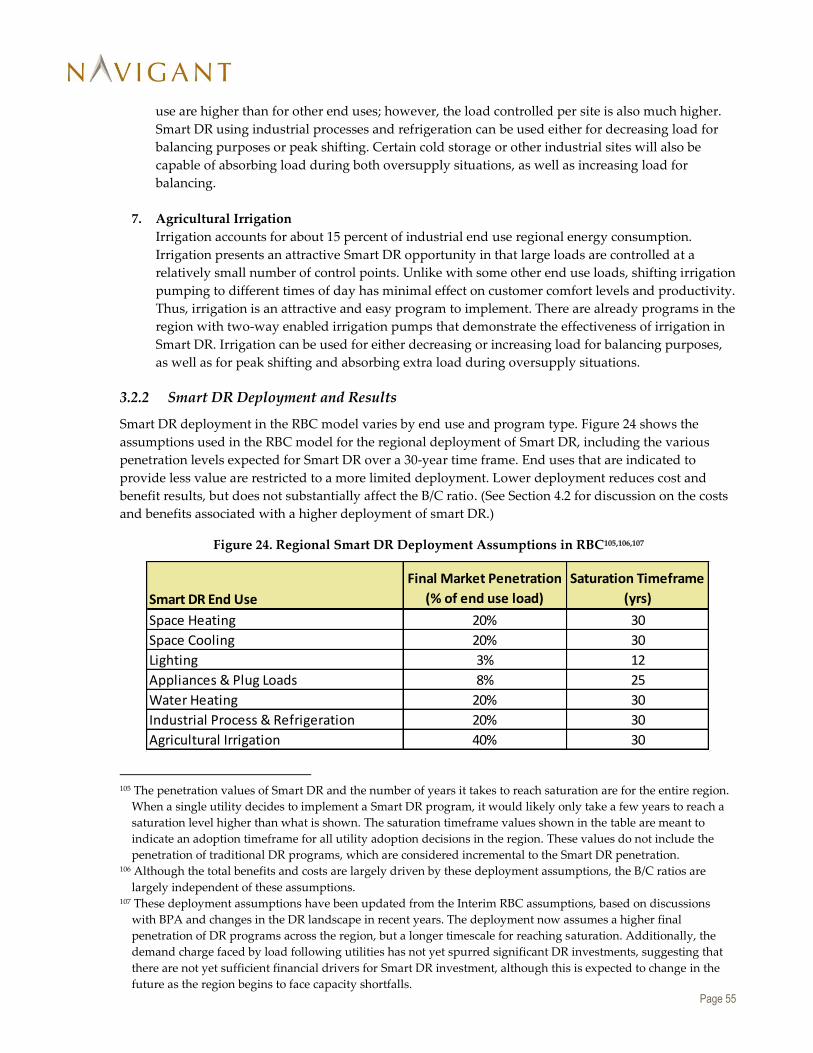
Page 55
use are higher than for other end uses; however, the load controlled per site is also much higher.
Smart DR using industrial processes and refrigeration can be used either for decreasing load for
balancing purposes or peak shifting. Certain cold storage or other industrial sites will also be
capable of absorbing load during both oversupply situations, as well as increasing load for
balancing.
7. Agricultural Irrigation
Irrigation accounts for about 15 percent of industrial end use regional energy consumption.
Irrigation presents an attractive Smart DR opportunity in that large loads are controlled at a
relatively small number of control points. Unlike with some other end use loads, shifting irrigation
pumping to different times of day has minimal effect on customer comfort levels and productivity.
Thus, irrigation is an attractive and easy program to implement. There are already programs in the
region with two-way enabled irrigation pumps that demonstrate the effectiveness of irrigation in
Smart DR. Irrigation can be used for either decreasing or increasing load for balancing purposes,
as well as for peak shifting and absorbing extra load during oversupply situations.
3.2.2 Smart DR Deployment and Results
Smart DR deployment in the RBC model varies by end use and program type. Figure 24 shows the
assumptions used in the RBC model for the regional deployment of Smart DR, including the various
penetration levels expected for Smart DR over a 30-year time frame. End uses that are indicated to
provide less value are restricted to a more limited deployment. Lower deployment reduces cost and
benefit results, but does not substantially affect the B/C ratio. (See Section 4.2 for discussion on the costs
and benefits associated with a higher deployment of smart DR.)
Figure 24. Regional Smart DR Deployment Assumptions in RBC105,106,107
105 The penetration values of Smart DR and the number of years it takes to reach saturation are for the entire region.
When a single utility decides to implement a Smart DR program, it would likely only take a few years to reach a
saturation level higher than what is shown. The saturation timeframe values shown in the table are meant to
indicate an adoption timeframe for all utility adoption decisions in the region. These values do not include the
penetration of traditional DR programs, which are considered incremental to the Smart DR penetration. 106 Although the total benefits and costs are largely driven by these deployment assumptions, the B/C ratios are
largely independent of these assumptions. 107 These deployment assumptions have been updated from the Interim RBC assumptions, based on discussions
with BPA and changes in the DR landscape in recent years. The deployment now assumes a higher final
penetration of DR programs across the region, but a longer timescale for reaching saturation. Additionally, the
demand charge faced by load following utilities has not yet spurred significant DR investments, suggesting that
there are not yet sufficient financial drivers for Smart DR investment, although this is expected to change in the
future as the region begins to face capacity shortfalls.
Smart DR End Use
Final Market Penetration
(% of end use load)
Saturation Timeframe
(yrs)
Space Heating 20% 30
Space Cooling 20% 30
Lighting 3% 12
Appliances & Plug Loads 8% 25
Water Heating 20% 30
Industrial Process & Refrigeration 20% 30
Agricultural Irrigation 40% 30

Page 56
Although the timeframe for a full regional deployment will likely take many years, individual utilities
may deploy DR very quickly. For example, large traditional DR programs have been deployed at Ohop
Mutual, Milton-Freewater, Snohomish County PUD, Seattle City Light, Orcas Power & Light, PacifiCorp,
and Idaho Power each within the timeframe of a year or two.
Figure 25 presents the range of benefits and costs for Smart DR in each end use category.
Figure 25. Smart DR Investment Returns Vary Widely by Target End Use
Uncertainty in the benefits causes a wide range of NPV estimates, but there is still sufficient certainty
that the benefits would surpass the costs to warrant some investment in some areas. Despite the overall
attractiveness of Smart DR, results are not consistent across end use categories. Smart DR programs for
space heating, water heating, agricultural irrigation, and industrial process and refrigeration appear
attractive. Smart DR programs for space cooling and appliances and plug loads appear somewhat
attractive, although the results for Smart DR programs with these end uses are difficult to characterize in
the Pacific Northwest with currently available data.108 Smart DR programs for lighting do not appear
attractive. The primary driver of the B/C ratios is the average load allocated per control point and the
cost of control and communication equipment.
Figure 26 presents the range of B/C ratios in each end use category. The total NPV of Smart DR ranges
from $0.3B to $3.8B with an expected value of $2.0B. The B/C ratio ranges from 1.2 to 4.9 with an
expected value of 2.8.
108 These results correspond to the deployment of Smart DR and do not represent the financial characteristics of
traditional DR. For example, poor results for space cooling do not imply that traditional DR programs in space
cooling are also unattractive.

Page 57
Figure 26. Some End Use Applications of Smart DR Are Clearly Attractive and Some Unattractive109
The vast majority of benefits from Smart DR are capacity benefits, rather than ancillary service benefits.
There are two important caveats to this finding. The Smart DR benefits are based on the value of avoided
capacity. However there is some disagreement among regional stakeholders on the link between peak
load reductions and actual deferment of planned generation, transmission, and distribution
infrastructure investments. The RBC applies avoided capacity cost values provided by BPA and treats
them deterministically. Several issues further complicate valuing Smart DR, including the following
items:
» Uncertainty in installed wind capacity projections beyond 2015
» Mitigation of load growth in the region due to EE programs
» Mitigation of load growth in the region from traditional DR programs
» Interaction between changing regional load and the variable output of regional hydropower
» Uncertainty in the amount of DEC and oversupply mitigation resources needed in the future
Second, there is currently no broad consensus value of ancillary services (i.e., for INC and DEC
balancing reserves) in the region, which are typically purchased bilaterally if not supplied internally. The
costs of such services are absorbed within the system, and are not measured explicitly as they might be
in organized wholesale imbalance markets. However, there is an emerging consensus among regional
stakeholders that ancillary services have economic value and that this value will be more evident if
installed renewable capacity increases and the need for ancillary services grows. The RBC effort applied
best estimates for future ancillary service values (i.e., beyond 2015)110 based on BPA research. There is a
strong possibility that growing renewable generation installations beyond 2020 could reach a point
where the value of ancillary services rises dramatically, increasing the benefit of smart grid;111,112 however
there are a number of factors that could mitigate this rise as well.
109 General RBC results for Smart DR are based on regional averages and there will certainly be exceptions to the
results for specific service territories or for specific end use customers. 110 The rate case for Variable Energy Resources Balancing Services, settled in 2013, concluded with mutually
accepted values for all ancillary services through September 20, 2015. There is no formal agreement on ancillary
service values for the time period beyond that date. 111 Substantial new renewable capacity is not currently planned beyond 2016. However, in the possible case that
renewables do substantially increase in the future, ancillary services provided by Smart DR might be increasingly
valued. 112 The future need for additional ancillary services and their future values are speculative. The RBC applied a fairly
conservative approach to assessing the benefits from Smart DR providing ancillary services. Accordingly the
Page 58
3.3 Smart Grid Can Boost Energy Efficiency Results in Selected Areas
The RBC considers smart end use EE capabilities that reduce energy consumption through enhanced
information feedback, optimized end use equipment operation, and identification of poorly performing
equipment as candidates for replacement or maintenance. Capabilities encompass consumer behavior
change, automated energy management, efficiency equipment upgrades, and improved maintenance.
Cost and benefit results for Smart EE are incremental to those generated by traditional EE investment that do
not require smart grid functionality. The results on Smart EE in this white paper have no bearing on the
cost-effectiveness of traditional EE measures. Smart EE costs are estimated at $0.5B, ranging from $0.3B
to $0.6B. Benefits are estimated at $0.8B, ranging from $0.3B to $1.3B. Investment in Smart EE appears
attractive, but realizing the benefits has a high degree of uncertainty.
Although EE is a common theme in smart grid discussions, it will not likely be a key driver for smart
grid investments. Rather, once significant smart grid infrastructure is in place, Smart EE can leverage
this investment to provide additional benefit at little incremental cost. Note that this analysis has nothing
to say about the cost-effectiveness of traditional end use EE measures, and only addresses end use
efficiency to the degree it is impacted by smart grid functionality. Traditional EE programs have
consistently proven cost-effective in the region and across the country.
3.3.1 Smart EE Applications
Like DR, EE applications are not dependent on smart grid and traditional EE programs have existed in
the region for decades. That said, smart grid can bring important benefits to EE programs that traditional
EE mechanisms cannot provide, such as increased participation, optimized operation of end use loads,
and use of EE for diagnosis of end use equipment efficiencies that has not typically been possible on a
large scale through traditional EE mechanisms.
Since the RBC analysis focuses on the benefits and costs that can be attributed specifically to the
application of smart grid, the distinction between Smart EE and traditional EE that does not require
smart grid is particularly important for appropriately attributing the smart grid costs and benefits for EE.
The RBC defines smart grid as having two-way communications and some form of automated
intelligence.113 For example, a behavior change program that mails paper reports to customers detailing
their monthly energy consumption would not be considered a smart grid application. Thus, the benefits
and costs of such a program are not considered in the RBC. In contrast, a behavior change program that
offers customers real-time feedback on their energy consumption through two-way communications and
in-home devices would be considered a smart grid application. The analysis captures this difference by
using the estimated incremental impacts for a smart behavior change program over a traditional
behavior change program.
The RBC considers smart end use EE capabilities that reduce energy consumption through enhanced
information feedback, optimized end use equipment operation, and identification of poorly performing
equipment as candidates for replacement or maintenance. The reduced energy consumption from these
capabilities also contributes to lowering peak demand, avoiding line losses, and reducing emissions.
estimated benefits from ancillary services are about an order of magnitude less than the capacity benefits from
Smart DR. 113 A capability must be at least partially automated, though not necessarily fully automated, to qualify as smart
grid.
Page 59
Smart EE relies on two-way communications infrastructure and a mechanism for delivering energy
consumption feedback to the customer. In recent years, the landscape for these communications
technologies has evolved. Previously, Smart EE deployments relied on AMI-based communications to a
gateway device, which communicated over a home area network to in-home devices like an in-home
display. More recently, however, utilities are communicating directly with the in-home device via the
customer’s broadband internet, avoiding the need for AMI-based communications or a gateway device.
Similarly, utilities are moving towards web-based feedback on energy consumption via a web portal or
smart phone application, rather than deploying expensive and often high-maintenance in-home
displays. This analysis assumes that these trends will continue and be the commonplace implementation
in the future.114
The costs considered for each of the different Smart EE capabilities includes the common shared costs of
the web portals, smart phone apps, and customer’s broadband internet, as well as unique costs
associated with the different Smart EE capabilities that are discussed below. The RBC also considered the
administrative overhead, operations, engineering, contracting, and other labor costs associated with
establishing and maintaining the different types of EE asset systems. The RBC model shares equipment
costs across all of the asset systems that utilize common pieces of equipment. For example, the common
equipment costs associated with establishing and maintaining the two-way communications
infrastructure are shared across all of the Smart EE capabilities.
The different Smart EE capabilities include:
1. End Use Conservation
This mechanism looks at operating end use equipment more efficiently through consumption data
feedback to the customer. The feedback may be delivered to automated control systems that
optimize end use consumption or to customers that subsequently change their consumption
behavior. While a range of technologies may be appropriate for doing so, the RBC analysis
considers smart thermostats, smart water heaters, building energy management systems (EMS),
and process-specific controls as the archetypical technologies for enacting smart end use
conservation, in addition to the common system costs outlined above.
This capability includes behavior change programs that provide customers with real-time
information about their energy consumption patterns. It also includes the automated optimization
of heating, ventilating, and air conditioning (HVAC), water heating, EMS, and process-related
energy consumption115 through machine learning and other control mechanisms.
2. End Use Equipment Efficiency Upgrade
Consumption data feedback may also drive a customer to replace inefficient end use equipment
with more efficient equipment. While equipment manufacturers are interested in implementing
this capability, very few utilities currently offer a “smart” program of this type. As a result, the
impacts and customer uptake for such behaviors are relatively uncertain and may span a range of
activities—from replacing lightbulbs to upgrading HVAC equipment. In addition to the common
114 The Interim RBC included AMI meters and related assets, as well as gateway devices, as costs associated with
Smart EE. This updated RBC assumes that Smart EE will largely be deployed through less capital-intensive means,
without reliance on these technologies. Thus, the equipment costs associated with Smart EE have decreased. 115 The RBC includes two asset systems for automated consumption optimization—one for HVAC and one that looks
at a combination of building loads, including HVAC and water heating for residential, EMS-controlled loads for
commercial, and process-specific loads for industrial.

Page 60
system costs outlined above, the enabling technologies assumed for this capability include end use
equipment sensors, EMS, and process controls.
3. Notification of End Use Equipment Condition
Real-time sensing and communication assets enable automated profiling of end use systems to
detect malfunctions and maintenance needs, and alert the consumer immediately. Additionally,
improvements in operation can be identified and routine maintenance can be scheduled to
improve degradations efficiency of equipment (e.g., coolant recharging or changing a filter). The
RBC model assesses the efficiency savings and lifetime extension benefits from these types of
equipment performance diagnostics for HVAC and refrigeration equipment. Like with the
equipment efficiency upgrades, the enabling technologies for this capability include end use
equipment sensors, EMS, and process controls.
3.3.2 Smart EE Deployment and Results
Figure 27 shows the assumptions used in the RBC model for the regional deployment of Smart EE,
including the various penetration levels expected over a 30-year time frame. EE capabilities that are
indicated to provide less value are restricted to a more limited deployment. Lower deployment reduces
cost and benefit results, but does not substantially affect the B/C ratio. The deployment of Smart EE is
incremental to the traditional EE deployed within the region and a maximum saturation of 30 percent is
conservatively assumed for end use conservation. (See Section 4.2 for discussion on the costs and
benefits associated with a higher deployment of Smart EE.)
Figure 27. Regional Smart EE Deployment Assumptions in RBC116,117,118
Figure 28 presents the range of benefits and costs for Smart EE in each end use category. The total NPV
of Smart EE ranges from -$0.3B to $0.6B with an expected value of $0.1B. The B/C ratio ranges from 0.5 to
2.6 with an expected value of 1.3.
116 The penetration values of Smart EE and the number of years it takes to reach saturation are for the entire region.
When a single utility decides to implement a Smart EE program, it would likely only take a few years to reach a
saturation level higher than what is shown. The saturation timeframe values shown in the table are meant to
indicate an adoption timeframe for all utility adoption decisions in the region. These values do not include the
penetration of traditional EE programs, which are considered incremental to the Smart EE penetration. 117 Although the total benefits and costs are largely driven by these deployment assumptions, the B/C ratios are
largely independent of these assumptions.
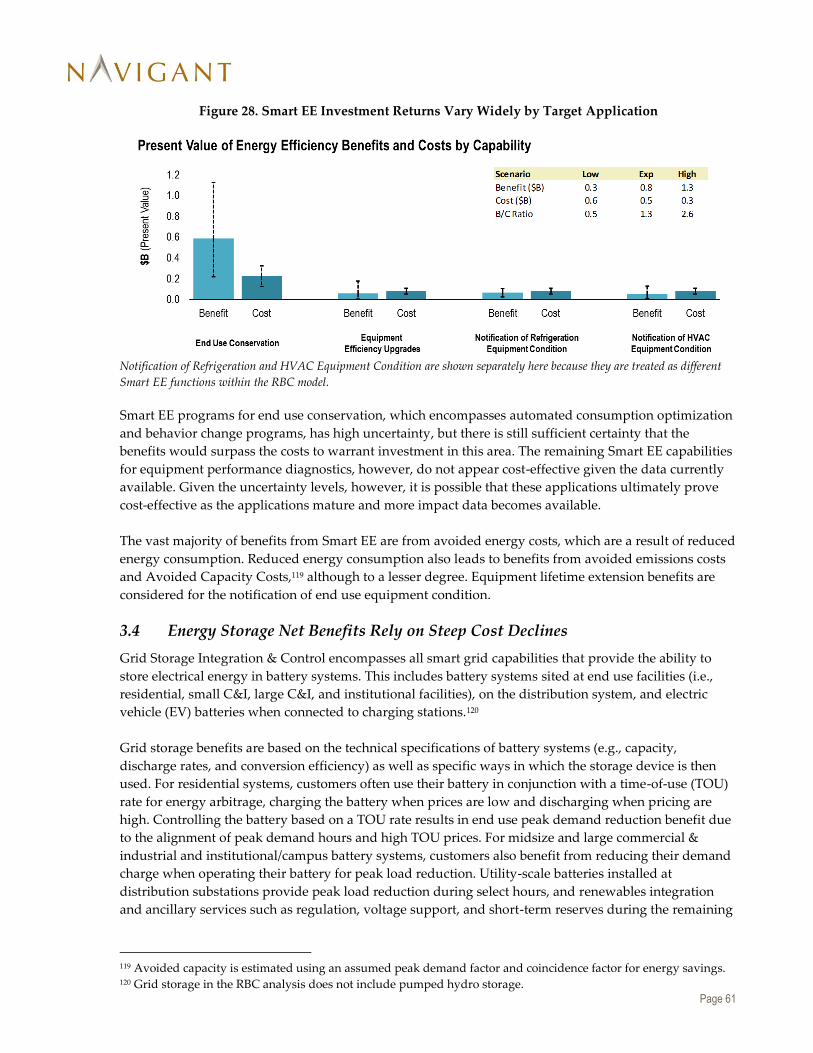
Page 61
Figure 28. Smart EE Investment Returns Vary Widely by Target Application
Notification of Refrigeration and HVAC Equipment Condition are shown separately here because they are treated as different
Smart EE functions within the RBC model.
Smart EE programs for end use conservation, which encompasses automated consumption optimization
and behavior change programs, has high uncertainty, but there is still sufficient certainty that the
benefits would surpass the costs to warrant investment in this area. The remaining Smart EE capabilities
for equipment performance diagnostics, however, do not appear cost-effective given the data currently
available. Given the uncertainty levels, however, it is possible that these applications ultimately prove
cost-effective as the applications mature and more impact data becomes available.
The vast majority of benefits from Smart EE are from avoided energy costs, which are a result of reduced
energy consumption. Reduced energy consumption also leads to benefits from avoided emissions costs
and Avoided Capacity Costs,119 although to a lesser degree. Equipment lifetime extension benefits are
considered for the notification of end use equipment condition.
3.4 Energy Storage Net Benefits Rely on Steep Cost Declines
Grid Storage Integration & Control encompasses all smart grid capabilities that provide the ability to
store electrical energy in battery systems. This includes battery systems sited at end use facilities (i.e.,
residential, small C&I, large C&I, and institutional facilities), on the distribution system, and electric
vehicle (EV) batteries when connected to charging stations.120
Grid storage benefits are based on the technical specifications of battery systems (e.g., capacity,
discharge rates, and conversion efficiency) as well as specific ways in which the storage device is then
used. For residential systems, customers often use their battery in conjunction with a time-of-use (TOU)
rate for energy arbitrage, charging the battery when prices are low and discharging when pricing are
high. Controlling the battery based on a TOU rate results in end use peak demand reduction benefit due
to the alignment of peak demand hours and high TOU prices. For midsize and large commercial &
industrial and institutional/campus battery systems, customers also benefit from reducing their demand
charge when operating their battery for peak load reduction. Utility-scale batteries installed at
distribution substations provide peak load reduction during select hours, and renewables integration
and ancillary services such as regulation, voltage support, and short-term reserves during the remaining
119 Avoided capacity is estimated using an assumed peak demand factor and coincidence factor for energy savings. 120 Grid storage in the RBC analysis does not include pumped hydro storage.

Page 62
hours. The operation of all batteries also results in an energy use “penalty” based on battery round-trip
efficiency.
Battery costs assumptions in the updated RBC were developed using market reports from Navigant
Research121. These costs remain uncertain going into the future, and adding to the complexity is the
expectation that battery prices drop precipitously while all other associated costs (e.g., inverters,
installation, integration, software, etc.) change at different rates. Battery costs are analogous to solar PV
panels – panels dropped in cost very quickly, but inverters, racks, and additional balance of plant did
not follow the same cost curve. Typically, as batteries get larger, installation and integration costs are a
larger percentage of total installed system costs due to the increased complexity of the integration
process. Details on the assumed technical specifications by battery scale can be found in the Appendix.
High-level benefit-cost analysis results are shown in Figure 29, with results by battery scale in Figure 30
below.
Figure 29. Benefits and Costs of Storage
121 Referenced Navigant Research reports include: Energy Storage for the Grid and Ancillary Services (3Q 2014);
Community, Residential, and Commercial Energy Storage (Q4 2014)
0
0.01
0.02
0.03
0.04
-500 0 500 1,000 1,500 2,000
Lik
elih
oo
d o
f O
ccu
rren
ce
$M (present value)
Present Value of Benefits and Costs of Storage(Uncertainty Analysis Results)
Cost
Benefit
Scenario Total Low Exp High
Benefit ($M) 47 433 964
Cost ($M) 334 916 1,614
B/C Ratio 0.2 0.4 1.2

Page 63
Figure 30. Benefits and Costs of Storage by Battery Scale
These results indicate that even minimal Grid Storage Integration & Control investments would cost
$0.9B and would only be expected to create $0.4B in benefits across all storage capabilities. In general,
the benefit-cost ratio increases with battery size due to a downward trend in installed cost per kW as
battery size increases. Due to an overlap in the uncertainty bounds for all battery types except EV
storage, there is a small likelihood that grid storage investments would create a net benefit outside of
certain niche applications.122 However, with advances in battery technologies and new approaches being
funded each year, it is possible that a breakthrough or new approach could change the expected benefit-
cost results. Therefore, Navigant conducted a “Storage Cost Breakthrough” analysis based on a scenario
where battery costs drop faster than expected, resulting in higher market uptake, as discussed in Section
4.1.
3.5 Estimated Changes to Revenue Requirements Are Mixed
The effect of smart grid investments on utility revenue requirements is an important question for
regional planning and should also be useful to individual utilities considering smart grid investments.
The benefit-cost framework was used to estimate revenue requirements in three different regional
categories of utility investment, each of which has slightly different considerations for revenue
requirements:
» Transmission investments—which are made by various entities in the Northwest including BPA
with the majority of investment in the region, but also including IOUs and other transmission
operators
» Distribution investments by IOUs—which are generally allowed a rate of return on capital
investment in addition to cost recovery
» Distribution investments by Public Utilities Districts (PUDs)—which generally recover
operations costs as well as financing costs for required capital investment
Figure 31 shows the estimated change in revenue requirements summed over all three of these
categories on a per year basis.
122 For example, in situations where energy arbitrage is highly attractive, ancillary service values are high and the
storage can be housed at a centralized location such as a campus. This represents a situation where energy storage
may improve cost-effectiveness.
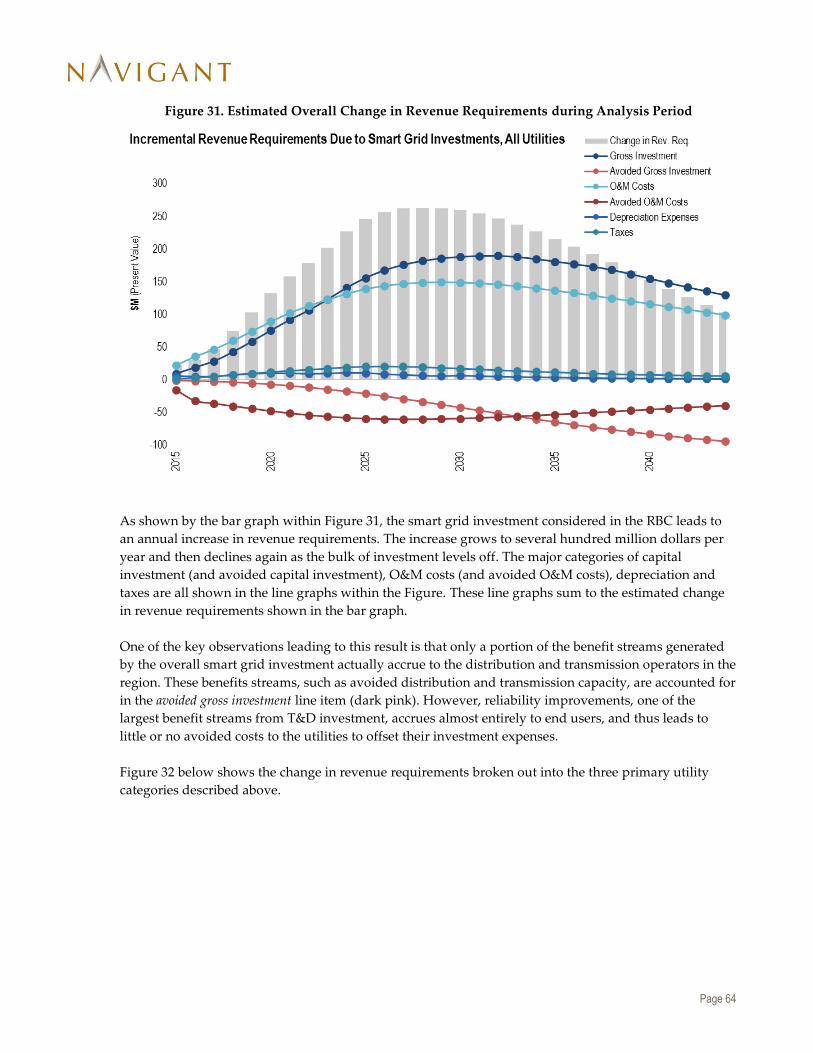
Page 64
Figure 31. Estimated Overall Change in Revenue Requirements during Analysis Period
As shown by the bar graph within Figure 31, the smart grid investment considered in the RBC leads to
an annual increase in revenue requirements. The increase grows to several hundred million dollars per
year and then declines again as the bulk of investment levels off. The major categories of capital
investment (and avoided capital investment), O&M costs (and avoided O&M costs), depreciation and
taxes are all shown in the line graphs within the Figure. These line graphs sum to the estimated change
in revenue requirements shown in the bar graph.
One of the key observations leading to this result is that only a portion of the benefit streams generated
by the overall smart grid investment actually accrue to the distribution and transmission operators in the
region. These benefits streams, such as avoided distribution and transmission capacity, are accounted for
in the avoided gross investment line item (dark pink). However, reliability improvements, one of the
largest benefit streams from T&D investment, accrues almost entirely to end users, and thus leads to
little or no avoided costs to the utilities to offset their investment expenses.
Figure 32 below shows the change in revenue requirements broken out into the three primary utility
categories described above.
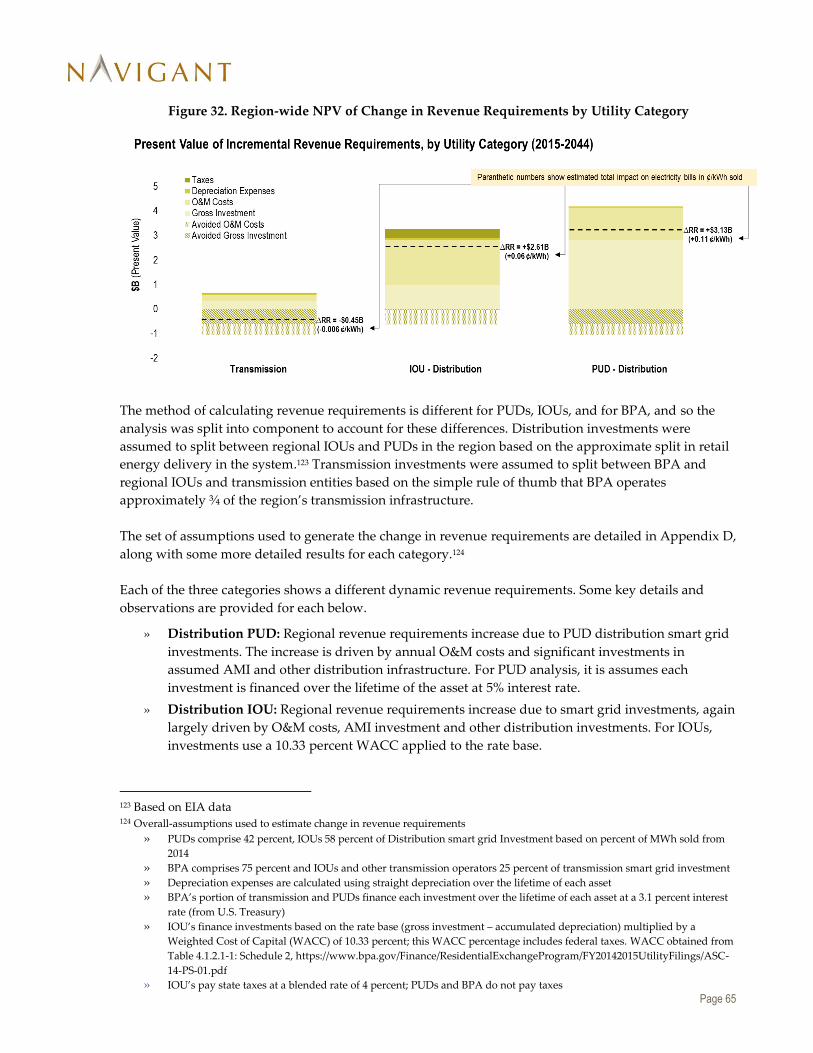
Page 65
Figure 32. Region-wide NPV of Change in Revenue Requirements by Utility Category
The method of calculating revenue requirements is different for PUDs, IOUs, and for BPA, and so the
analysis was split into component to account for these differences. Distribution investments were
assumed to split between regional IOUs and PUDs in the region based on the approximate split in retail
energy delivery in the system.123 Transmission investments were assumed to split between BPA and
regional IOUs and transmission entities based on the simple rule of thumb that BPA operates
approximately ¾ of the region’s transmission infrastructure.
The set of assumptions used to generate the change in revenue requirements are detailed in Appendix D,
along with some more detailed results for each category.124
Each of the three categories shows a different dynamic revenue requirements. Some key details and
observations are provided for each below.
» Distribution PUD: Regional revenue requirements increase due to PUD distribution smart grid
investments. The increase is driven by annual O&M costs and significant investments in
assumed AMI and other distribution infrastructure. For PUD analysis, it is assumes each
investment is financed over the lifetime of the asset at 5% interest rate.
» Distribution IOU: Regional revenue requirements increase due to smart grid investments, again
largely driven by O&M costs, AMI investment and other distribution investments. For IOUs,
investments use a 10.33 percent WACC applied to the rate base.
123 Based on EIA data 124 Overall-assumptions used to estimate change in revenue requirements
» PUDs comprise 42 percent, IOUs 58 percent of Distribution smart grid Investment based on percent of MWh sold from
2014
» BPA comprises 75 percent and IOUs and other transmission operators 25 percent of transmission smart grid investment
» Depreciation expenses are calculated using straight depreciation over the lifetime of each asset
» BPA’s portion of transmission and PUDs finance each investment over the lifetime of each asset at a 3.1 percent interest
rate (from U.S. Treasury)
» IOU’s finance investments based on the rate base (gross investment – accumulated depreciation) multiplied by a
Weighted Cost of Capital (WACC) of 10.33 percent; this WACC percentage includes federal taxes. WACC obtained from
Table 4.1.2.1-1: Schedule 2, https://www.bpa.gov/Finance/ResidentialExchangeProgram/FY20142015UtilityFilings/ASC-
14-PS-01.pdf
» IOU’s pay state taxes at a blended rate of 4 percent; PUDs and BPA do not pay taxes

Page 66
» Transmission: Regional revenue requirements decrease from smart grid investments. This is
driven by avoided O&M costs and avoided gross investments, which outweigh the incremental
O&M costs and capital investments in smart grid. The transmission smart grid investments lead
to enough transmission related benefits (e.g., deferred capacity investment) that on net, revenue
requirements are reduced over time.
The overall analysis of revenue requirements indicates that, although smart grid investment can have
significant beneficial results for the region, the effect of this investment is likely to be relatively small
from the perspective of electricity cost to the regional end users.

Page 67
4 Regional “What If” Scenarios
Stakeholders in the Northwest can imagine a number of interesting and potentially significant “what if”
scenarios that would impact development of energy systems and resource for years to come. BPA
selected three of these scenarios for examination using the RBC framework and computational model.
The scenarios are:
» A storage cost breakthrough—drastically and rapidly declining costs for electricity storage
» Accelerated adoption of home and building automation technologies—this would include rapid
cost declines in sensing and automation technology and accelerated adoption of this technology
» Increased renewables penetration—both inside and outside the Northwest
The parameters of these scenarios deviate enough from current regional planning and forecasting
assumptions, that they fall outside the analysis assumptions used in the RBC, even including the broad
parametric uncertainty estimates that have been used throughout the analysis. However, the RBC
analysis technique allows these to be modeled to better quantify their benefits and costs.
4.1 Storage Cost Breakthrough Is Key to Unlocking Storage Value
The “Storage Cost Breakthrough” scenario considers the effects on the RBC of a future scenario where
the costs of battery storage drop considerably from current levels and the level of deployment increases
as a result of lower costs. New industry players such as Tesla and Mercedes-Benz, as well as an
increasing number of storage pilots and initiatives around the United States are key drivers for this
scenario analysis.
The analysis defines this scenario using the following key assumptions:
Tripled storage function deployment
Installed-cost reduction curves approximately 1/3 of base scenario curves
Figure 33 displays the results from the scenario analysis, with the base scenario benefits and costs on the
left, and the Storage Cost Breakthrough benefits and costs on the right. The values shown in the figure
represent the NPV over the 30-year modeling period (2015-2044).
Figure 33. “Storage Cost Breakthrough” Scenario Results
The total benefits increased from $0.4B in the base scenario to $2.4B in the Storage Cost Breakthrough
scenario due to increased market uptake of batteries. The overall costs increased from $0.9B to $1.1B,
which is due to increased deployment of batteries counteracted by a significant drop in battery costs. In
Page 68
the base scenario, storage functions have a very small chance of being cost-effective. However, in a
scenario where storage prices plummet and market uptake increases, battery storage becomes a
favorable investment, and the grid enjoys increased balancing services, increased renewables
integration, and reduced peak load.
4.2 Acceleration of Home and Building Automation Enhance DR and EE
Customer adoption of certain automated technologies has increased dramatically over the past few
years. Most notably, sales of smart thermostats, such as the Nest thermostat, now comprise over 40
percent of current thermostat sales and are expected to be more than 50 percent of sales by 2017.125 While
utility programs are still driving some of these sales, customers are increasingly purchasing home
energy management technologies independently through retail channels. This trend seems likely to
continue as retailers continue to promote products and services which increase home connectivity and
automation. Additionally, the proliferation of inexpensive controls and sensors for building automation
has spurred more investment in these automation technologies on the C&I side.
This natural adoption of home and building automation technologies comes at no cost to the utilities and
could result in a more attractive benefit-cost ratio for smart grid functions requiring assets related to
home or building automation. The “High Automation” scenario considers the effects on the RBC of a
scenario in which the adoption of home and building automation technologies occurs at a rate more
rapid than assumed in the baseline model. Additionally, this scenario reduces the cost burden of the
assets required for such functionality under the assumption that a certain number of customers will
purchase these assets regardless of their usefulness to the smart grid.
To capture these drivers, Navigant increased the deployment of the Smart EE and DR functions that rely
on home and building automation technologies. Whereas Navigant previously assumed a portion of the
market would continue to participate in traditional EE and DR technologies, in this scenario, Navigant
assumes that virtually all EE and DR participants would participate using smart technologies.
The impacts of the high automation scenario on the RBC for Smart DR can be seen in Figure 34. With 50
percent deployment of most DR functions by 2044,126 approximately 8 percent (3.9GW) of the regional
system load is under control by the end of the analysis period. This penetration of DR technologies is on
par with the penetration of traditional DR in other regions where DR is a more mature resource, such as
PJM, and the maximum average potential for DR measures assumed in a recent PacifiCorp potential
study. These assumptions drive the benefits to nearly $6.5B NPV, up from approximately $3B in the base
scenario.
125 Parks Associates, Winning Smart Home Strategies for Energy Management, July 2015. 126 The deployment for irrigation is assumed to be constant at 40 percent, given that the drivers for this scenario are
not expected to have a significant impact on irrigation.

Page 69
Figure 34. Increased Adoption of Automated Technologies Significantly Increases the Benefits for
Smart DR
The Smart EE high automation scenario uses 85 percent customer participation as an upper bound for
deployment, based on the maximum saturation typically assumed in the Pacific Northwest for
conservation functions. The high automation scenario also increased benefits for Smart EE relative to the
base scenario (see Figure 35), although the total benefits are still less than the benefits for Smart DR. In
part, this is because conservation measures tend to rely less heavily on automation and real-time
feedback than DR for achieving deeper savings.
Figure 35. Increased Adoption of Automated Technologies Contributes to Increased Benefits for
Smart EE
Total benefits from Smart EE functions increase from approximately $0.8B in the base scenario to $3.7B
in the high automation scenario, while costs increase from $0.5B in the base scenario to $1.0B in the high
automation scenario.
4.3 Smart Grid Value Differs for In-Region Versus Imported Renewable Energy
Smart grid benefits and costs depend on assumptions about renewables deployment—both within the
region and outside the region. The “High Renewables” scenario considered the impacts of Large-Scale

Page 70
and Distributed renewables within the region, as well as the regional impacts from the expected increase
in California-based renewables.127
Growth and penetration forecasts for distributed renewables—primarily solar—were examined to
understand if they would reach a level of regional penetration that would require or leverage smart grid
capabilities to help integrate those resources. Figure 36 below shows the projected growth of distributed
solar in the region. As seen in the figure, penetration is not expected to reach above 2 percent of load
within the next 20 years. This is a level well below that at which smart grid capabilities are generally
considered to be useful—or needed—for integration purposes.128 Thus, smart grid capabilities aimed at
distributed energy resource integration, monitoring and control are not expected to provide any
meaningful value for the foreseeable future in the Northwest region under business as usual conditions.
Figure 36. Rooftop Solar Growth Projection for Northwest
Regional plans and information about utility-scale renewables were reviewed to understand if new,
significant large-scale renewables installations, or shifts in deployment trends for wind and/or solar
generating resources, required any updates to the analysis approach or assumptions.
In 2015, there is approximately 9,200 MW of installed wind capacity in the Pacific Northwest region.129
In addition, there are some other large-scale projects planned in the region—for example, as of 2015,
Idaho Power has 461 MW new solar capacity under contract.130 The value streams generated by smart
127 Discussions with BPA staff in April 2015 provided guidance in the direction of this analysis. In addition, the
overall benefit-cost methodology for renewables integration was re-examined including value streams and benefit
calculations by capability area. 128 There was general consensus among the BPA subject matter experts interviewed that integration of distributed
renewable resources will be not an issue in the region for a very long time. 129 http://www.nwcouncil.org/energy/powersupply/ 130 https://www.idahopower.com/AboutUs/CompanyInformation/ourFuture/responsibleDevelopment.cfm.
Integration cost assumptions for large scale renewables capacity were updated in the model based on recent
projects.
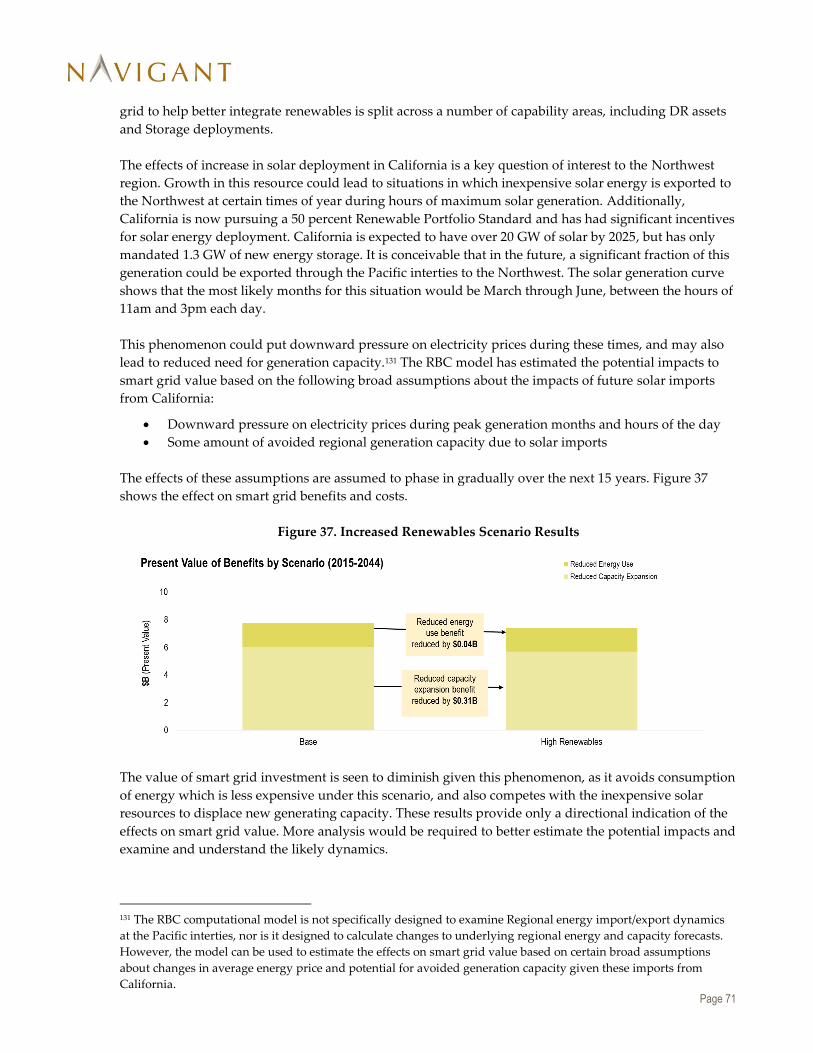
Page 71
grid to help better integrate renewables is split across a number of capability areas, including DR assets
and Storage deployments.
The effects of increase in solar deployment in California is a key question of interest to the Northwest
region. Growth in this resource could lead to situations in which inexpensive solar energy is exported to
the Northwest at certain times of year during hours of maximum solar generation. Additionally,
California is now pursuing a 50 percent Renewable Portfolio Standard and has had significant incentives
for solar energy deployment. California is expected to have over 20 GW of solar by 2025, but has only
mandated 1.3 GW of new energy storage. It is conceivable that in the future, a significant fraction of this
generation could be exported through the Pacific interties to the Northwest. The solar generation curve
shows that the most likely months for this situation would be March through June, between the hours of
11am and 3pm each day.
This phenomenon could put downward pressure on electricity prices during these times, and may also
lead to reduced need for generation capacity.131 The RBC model has estimated the potential impacts to
smart grid value based on the following broad assumptions about the impacts of future solar imports
from California:
Downward pressure on electricity prices during peak generation months and hours of the day
Some amount of avoided regional generation capacity due to solar imports
The effects of these assumptions are assumed to phase in gradually over the next 15 years. Figure 37
shows the effect on smart grid benefits and costs.
Figure 37. Increased Renewables Scenario Results
The value of smart grid investment is seen to diminish given this phenomenon, as it avoids consumption
of energy which is less expensive under this scenario, and also competes with the inexpensive solar
resources to displace new generating capacity. These results provide only a directional indication of the
effects on smart grid value. More analysis would be required to better estimate the potential impacts and
examine and understand the likely dynamics.
131 The RBC computational model is not specifically designed to examine Regional energy import/export dynamics
at the Pacific interties, nor is it designed to calculate changes to underlying regional energy and capacity forecasts.
However, the model can be used to estimate the effects on smart grid value based on certain broad assumptions
about changes in average energy price and potential for avoided generation capacity given these imports from
California.
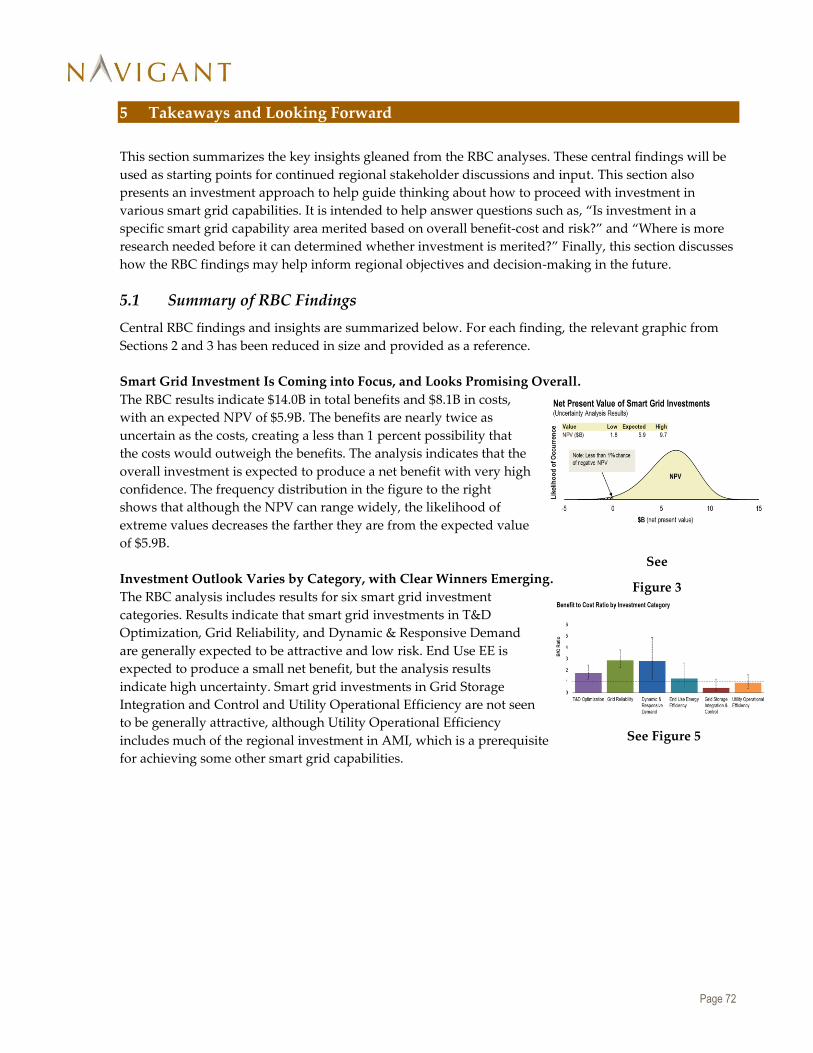
Page 72
5 Takeaways and Looking Forward
This section summarizes the key insights gleaned from the RBC analyses. These central findings will be
used as starting points for continued regional stakeholder discussions and input. This section also
presents an investment approach to help guide thinking about how to proceed with investment in
various smart grid capabilities. It is intended to help answer questions such as, “Is investment in a
specific smart grid capability area merited based on overall benefit-cost and risk?” and “Where is more
research needed before it can determined whether investment is merited?” Finally, this section discusses
how the RBC findings may help inform regional objectives and decision-making in the future.
5.1 Summary of RBC Findings
Central RBC findings and insights are summarized below. For each finding, the relevant graphic from
Sections 2 and 3 has been reduced in size and provided as a reference.
Smart Grid Investment Is Coming into Focus, and Looks Promising Overall.
The RBC results indicate $14.0B in total benefits and $8.1B in costs,
with an expected NPV of $5.9B. The benefits are nearly twice as
uncertain as the costs, creating a less than 1 percent possibility that
the costs would outweigh the benefits. The analysis indicates that the
overall investment is expected to produce a net benefit with very high
confidence. The frequency distribution in the figure to the right
shows that although the NPV can range widely, the likelihood of
extreme values decreases the farther they are from the expected value
of $5.9B.
Investment Outlook Varies by Category, with Clear Winners Emerging.
The RBC analysis includes results for six smart grid investment
categories. Results indicate that smart grid investments in T&D
Optimization, Grid Reliability, and Dynamic & Responsive Demand
are generally expected to be attractive and low risk. End Use EE is
expected to produce a small net benefit, but the analysis results
indicate high uncertainty. Smart grid investments in Grid Storage
Integration and Control and Utility Operational Efficiency are not seen
to be generally attractive, although Utility Operational Efficiency
includes much of the regional investment in AMI, which is a prerequisite
for achieving some other smart grid capabilities.
See
Figure 3
See Figure 5

Page 73
Smart Voltage Reduction Can Deliver Value, but Benefits to Utilities May Vary.
Smart Voltage Reduction results indicate an attractive overall
investment opportunity. However, there are barriers to adoption
that include lost revenue dis-incentives. In addition, feeder health
in some areas requires basic maintenance investment before Smart
Voltage Reduction can be useful, and utility priorities remain on
traditional infrastructure investments. In the case of IOUs, this cost
might fall in the rate base and allow a return on investment in some
cases. However, for POUs and co-ops there are many competing
projects for investment dollars, and investment recovery on Smart
Voltage Reduction projects may be much less clear.
PMU Applications Provide Reliability Insurance and Other
Benefits.
PMUs can be leveraged in different applications to enable several
new capabilities. The benefits are still relatively uncertain for these
applications, but the relative costs are so low that these are almost
certainly prudent investments. The WISP initiative has achieved a
substantial deployment and expansion of these benefits is expected
to continue within the time horizon of this analysis.
Smart DR Can Provide Flexible Response to Changing Grid
Conditions.
Uncertainty in the benefits causes a wide range of NPV estimates for
Smart DR across different end use categories. Nonetheless, there is
sufficient certainty of benefits surpassing costs in a number of these
categories to warrant investment. Smart DR for agricultural irrigation
and space heating appears quite attractive Smart DR in water heating
and industrial process and refrigeration appears somewhat attractive.
Results for Smart DR in space cooling are too uncertain to
characterize with currently available data. Smart DR for appliances
and plug loads and lighting does not appear attractive. The primary
drivers of the B/C ratios are the average load allocated per control
point and the cost of control and communication equipment.
5.2 Planning for Smart Grid Investments
Regional stakeholders can leverage the results and information provided by the RBC on smart grid
benefits, costs, and uncertainties to inform their decision-making processes and to help put the various
smart grid capabilities into a context for decision-making.
A primary objective of the RBC effort is to characterize the uncertainty and risk of smart grid
investments in the Pacific Northwest. Most graphics in this white paper present results with explicit
uncertainty bounds. Even with an understanding of the uncertainties, questions remain about how
utilities should act on smart grid investments.
Figure 38 presents an investment approach that accounts for the expectations and uncertainties of smart
grid investments. This approach divides smart grid investments into four zones based on their expected
NPV and their range of uncertainty. Smart grid capabilities that have a low range of uncertainty have
sufficient information to confidently make deployment decisions based on their expected NPV (i.e.,
See Figure 18
See Figure 25
See Figure 15
0200400600800
1,0001,2001,4001,6001,8002,000
Benefit Cost Benefit Cost Benefit Cost Benefit Cost
$M
(P
resent
Valu
e)
Present Value of Benefits and Costs of Smart Voltage Reduction(Expected Case)
Generation Transmission Distribution End Use
Avoided Capacity Cost (ACC)
Fue
l P
urc
ha
se
Lo
st
Reven
ue
Lo
st
Reven
ue
Lo
st
Reven
ue
Redu
ced
Bill
s
Ene
rgy
Purc
ha
se
Ene
rgy
Purc
ha
se
Ince
ntive
Paym
en
t
ACC ACC
Sm
art
Vo
lta
ge
Re
du
ctio
nC
ost
Lost ProfitLost Profit
Lost Profit
0%
20%
40%
60%
80%
100%
-0.2 0 0.3 0.5 0.8 1 1.3 1.5 1.7 2 2.2 2.5 2.7 3
Lik
elih
oo
d o
f O
ccu
rren
ce
$B (present value)
Net Present Value of Wide Area Monitoring(Cumulative Probability Results)
Note: Approximately 80% chance of negative NPV, but approximately 10% chance of $200M benefit or much larger. Wide area monitoring investment resembles an insurance policy.
Illustrative shape for typical grid investments with uncertainty.
Scenario Low Expected High
Benefit ($B) 0.00 0.17 0.92
Cost ($B) 0.07 0.10 0.13

Page 74
“identify niche opportunities” versus “pilot and deploy”). For smart grid capabilities that have a high
range of uncertainty,132 there may not be sufficient information to deploy at scale; therefore, investment
should focus instead on investigating the capabilities and reducing their respective uncertainties (i.e.,
“wait and monitor” versus “test and familiarize”).
The right-hand side of the figure indicates generally into which zones the smart grid capabilities
discussed in this white paper fall.133 This graphic shows that there is sufficient information available
today for some capabilities to begin or continue investing in smart grid pilots and deployment. It is
important that utilities test those capabilities and become more familiar with them so that they might
ultimately make appropriate investment decisions.
Figure 38. Some Capabilities Warrant Investment, While Others Need More Investigation 134
Note: Placement in this graphic is based on the assessment of the incremental costs and incremental benefits due to smart grid
enabled capabilities. The analysis does not address the costs and benefits for traditional capabilities (e.g., traditional direct load
control, or replacement of CFLs as an EE measure, etc.).
5.3 The RBC Looking Forward
The analysis method and framework used to develop the RBC has provided a number of useful insights
that can help inform policy and regulatory decision makers, utilities, planners and investors. These
regional stakeholders can leverage the results and information provided to put the various smart grid
capabilities into a context and to guide the decision-making processes. Continued outreach and
communication to these stakeholders will be critical to achieving the goals of the RBC.
132 Much of the uncertainties for investments in the lower quadrants arises from the uncertainty in the incremental
impact beyond traditional or baseline investments. In other words, it can be difficult to determine what fraction of
the benefit from smart grid investments might have been achievable with investments in traditional technologies.
This is especially true for certain Smart DR investments. 133 The specific capabilities discussed in detail in Section 3 are shown, along with the general categories discussed in
Section 2. 134 The assessment of smart grid technologies presented here is based on typical smart grid applications in the region
and may not account for opportunities that would be considered exceptional. Certainly there will be niche
opportunities that should be pursued even if broad deployment is not appropriate.

Page 75
The computational model used in the RBC analysis captures many of the regional characteristics of the
Northwest, which are unique in the U.S. in a number of dimensions (e.g., the complexities and annual
fluctuations in hydro generation). The model can be used, if desired, to update the regional smart grid
benefit-cost outlook in future years, and it may make sense as an ongoing resource to BPA and other
regional stakeholders. It has many capabilities and detailed outputs that were not possible to explore in
this white paper, but nonetheless can be useful to regional planners and analysts going forward.
Individual utilities have unique customer demographics and preferences, installed assets, and
management preferences. Individual utilities should consider their local situation and, in some cases,
perform their own analysis to confirm that the regional results are indicative of what they could expect
in their specific service territories.

Page 76
Project History
In early 2009, BPA asked Summit Blue Consulting (now Navigant Consulting, Inc. [Navigant]) to
develop a smart grid benefit-cost assessment for the Pacific Northwest. BPA was interested to better
understand whether some of the claims being made about the high value of a smart grid could be
justified and which potential investment areas were the most promising. The resulting study, referred to
as the Introductory Regional Business Case (iRBC), was completed in the fall of 2009 (see Figure 39).
The iRBC used a top-down analysis methodology and leveraged the best data available at the time to
examine eight broad smart grid investment categories. A generally conservative approach was taken in
an attempt to avoid double counting issues and to ensure that the analysis was not swayed by some of
the smart grid hyperbole at the time.
Figure 39. Selection of Introductory RBC Pages
Navigant developed a conceptual model for regional smart grid deployment as a foundational piece for
the analysis (see Figure 40). This model separated deployment into phases, starting with an initiating
and exploring phase during which various new technologies were evaluated for efficacy, cost-
effectiveness, and potential for future deployment. A key goal of this initial phase was to learn what
worked and what did not, and in what areas more research was needed. Subsequent phases called for
investment in specific capability areas that showed cost-effective performance, and then functional
scaling and broader integration among these smart grid functions.

Page 77
Figure 40. Regional Deployment Conceptual Model
As part of expanding interest in smart grid, BPA sought to provide stakeholders with a better
understanding of which specific technologies and investments were the most promising for the region.
As part of this effort, BPA invested as a partner in the PNW Demonstration Project, which had been
recently initiated. BPA also decided to pursue a more detailed smart grid business-cost assessment
framework and RBC. The challenge for the RBC effort was to develop an approach that could help
decision makers understand the value of specific smart grid technologies and project types and to better
characterize the risks and uncertainties—something that the iRBC analysis could not do at a granular
level. A bottom-up analysis approach was required to do this.
Work on the RBC has progressed for over four years, through the RBC phases shown in Figure 41. The
effort has moved from the top-down, conceptual analysis in the iRBC, to a robust, bottom-up model.

Page 78
Figure 41. Illustration of the Phases for the RBC Effort
Starting at the left on this figure, and progressing through the five time periods shown, the RBC
development process has included the following phases:
» iRBC—The Introductory RBC as described briefly above. The regional deployment conceptual
model was developed as part of this effort and is used as a conceptual underpinning to the
analysis and modeling of the RBC today. Early phases of the deployment model align well with
the process and results expected of the PNW Demonstration Project, including the smart grid
technology assessment and learning that is taking place and will be an output of this project.
» RBC Framework—The underlying structure of the RBC analysis (referred to as the relational
model) was developed during this phase. The iRBC analysis was also refined and updated, with
refined results published and presented at the American Council for an Energy-Efficient
Economy Summer Conference in 2010.135
» RBC Phase I.a—The underlying structure of the RBC model that implements the benefit-cost
framework was developed in this phase, and a limited number of smart grid capability areas,
including Smart Voltage Reduction- and PMU-based capability areas, were modeled.
» RBC Phases I.b, II.a—Modeling of the remaining smart grid capability areas was completed,
and the interim RBC analysis (described herein) was developed.
» RBC Phases II.b, III—Future phases will concentrate on incorporating information acquired
from the PNW Demonstration Project and examining in greater depth some key regional
characteristics, such as renewables integration, carbon pricing futures, and updated capacity and
ancillary services assumptions.
The RBC effort is intended to help guide regional stakeholders to make appropriate smart grid
investment decisions by helping them understand the potential for benefits, as well as the commensurate
investment risks.
135 K. Cooney, D. Violette, E. Gilbert, B. Rogers, and M. Weedall. 2010. The Role of the Smart Grid in Enhancing Energy
Efficiency and Demand Response: An Economic Assessment of a Regional Smart Grid Deployment in the Pacific Northwest.
Presented at the 2010 ACEEE Summer Study on Energy Efficiency in Buildings.
Page 79
Methodology Summary
The broad overview of the methodology used for the RBC is provided below. This methodology was
developed to perform a bottom-up assessment of benefits, costs, and uncertainties associated with a
range of smart grid investments. The overall benefit-cost framework is described first, followed by a
description of the RBC model and then a discussion of the inputs used in the analysis.
B.1 Smart Grid Definition
A wide variety of smart grid definitions have been put forth over the past decade. For purposes
of this white paper, the following, simple definition has been used:
Smart grid capabilities must use two-way communications and must leverage some form of
automated intelligence (i.e., a capability must be at least partially automated, though not
necessarily fully automated, to qualify as smart grid).
The smart grid is envisioned as the electrical grid of the future that uses digital technology and
information to enhance the delivery and use of electricity. It will use new technologies and
innovative methods to make the existing traditional power infrastructure more efficient and to
deliver new capabilities that are not currently possible. The application of these technologies
could improve system efficiency and resilience, facilitate interconnection of intermittent
resources, and engage customers much more actively in the process of deciding where, when,
and how energy is used. These benefits could make investment in smart grid technologies more
cost-effective than simply continuing to invest in traditional electricity delivery infrastructure.
The U.S. Department of Energy (DOE) offers the following definition:
“Smart grid” generally refers to a class of technology people are using to bring utility electricity delivery
systems into the 21st century, using computer-based remote control and automation. These systems are
made possible by two-way communication technology and computer processing that has been used for
decades in other industries. They are beginning to be used on electricity networks, from the power plants
and wind farms all the way to the consumers of electricity in homes and businesses. They offer many
benefits to utilities and consumers -- mostly seen in big improvements in energy efficiency on the
electricity grid and in the energy users’ homes and offices. 136
B.2 Benefit-Cost Framework
The framework includes a model of the smart grid composed of 34 individual capability areas that are
grouped into six major investment categories, an overall model of the relationship between smart grid
assets, impacts, benefits and costs, and a relational model that specifically looks at which smart grid
capability areas produce which impacts.
Comprehensive Model of Smart Grid Spans 35 Capability Areas
The list of capability areas (previously referred to as functions) that comprise the smart grid is provided
in Figure 42, along with the major investment category to which each belongs.
136 http://energy.gov/oe/technology-development/smart-grid
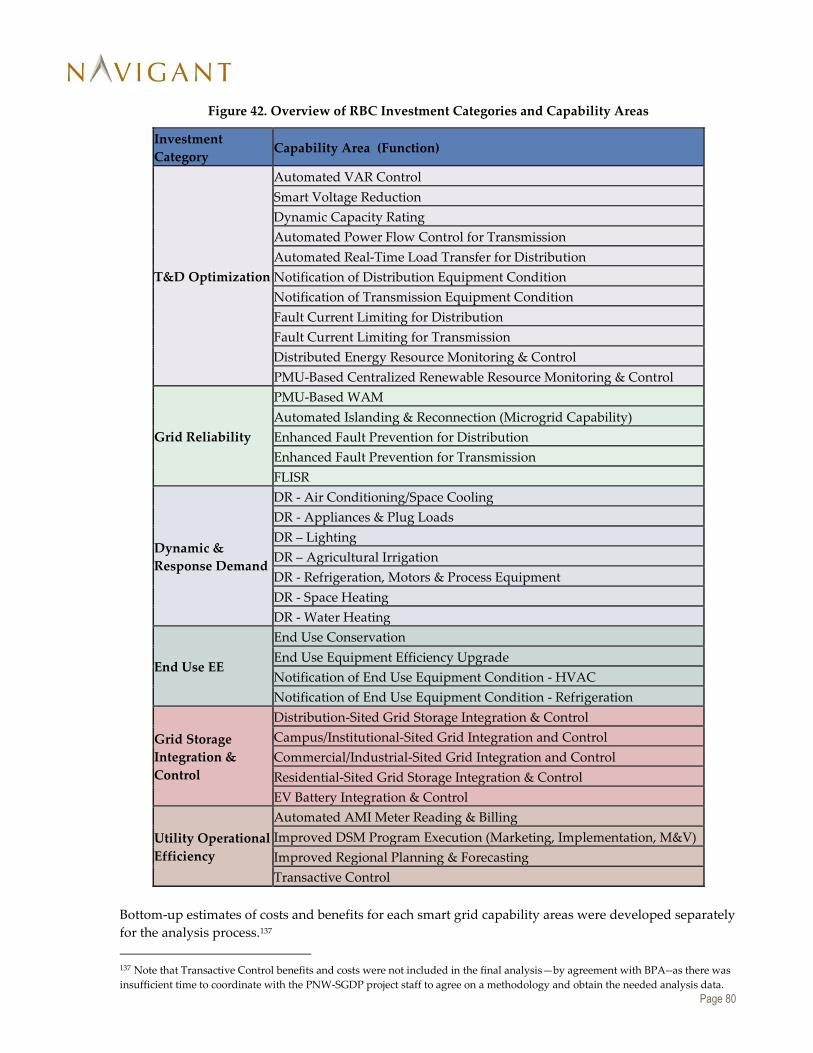
Page 80
Figure 42. Overview of RBC Investment Categories and Capability Areas
Investment
Category Capability Area (Function)
T&D Optimization
Automated VAR Control
Smart Voltage Reduction
Dynamic Capacity Rating
Automated Power Flow Control for Transmission
Automated Real-Time Load Transfer for Distribution
Notification of Distribution Equipment Condition
Notification of Transmission Equipment Condition
Fault Current Limiting for Distribution
Fault Current Limiting for Transmission
Distributed Energy Resource Monitoring & Control
PMU-Based Centralized Renewable Resource Monitoring & Control
Grid Reliability
PMU-Based WAM
Automated Islanding & Reconnection (Microgrid Capability)
Enhanced Fault Prevention for Distribution
Enhanced Fault Prevention for Transmission
FLISR
Dynamic &
Response Demand
DR - Air Conditioning/Space Cooling
DR - Appliances & Plug Loads
DR – Lighting
DR – Agricultural Irrigation
DR - Refrigeration, Motors & Process Equipment
DR - Space Heating
DR - Water Heating
End Use EE
End Use Conservation
End Use Equipment Efficiency Upgrade
Notification of End Use Equipment Condition - HVAC
Notification of End Use Equipment Condition - Refrigeration
Grid Storage
Integration &
Control
Distribution-Sited Grid Storage Integration & Control
Campus/Institutional-Sited Grid Integration and Control
Commercial/Industrial-Sited Grid Integration and Control
Residential-Sited Grid Storage Integration & Control
EV Battery Integration & Control
Utility Operational
Efficiency
Automated AMI Meter Reading & Billing
Improved DSM Program Execution (Marketing, Implementation, M&V)
Improved Regional Planning & Forecasting
Transactive Control
Bottom-up estimates of costs and benefits for each smart grid capability areas were developed separately
for the analysis process.137
137 Note that Transactive Control benefits and costs were not included in the final analysis—by agreement with BPA--as there was
insufficient time to coordinate with the PNW-SGDP project staff to agree on a methodology and obtain the needed analysis data.

Page 81
Smart Grid Functions Use Technology Assets and Create Grid Impacts
The fundamental relationships used in the framework to calculate costs and benefits are shown in Figure
40. Smart grid functions (listed Figure 42) are defined to be implemented with a set of smart grid
technology assets. These, in turn, result in grid impacts that can be measured or estimated. The costs of
the assets (including installation and integration) are calculated, and the values of the impacts are
calculated. These results provide the benefits and cost outputs.
Figure 43. Relationship of Smart Grid Functions to Benefits and Costs
Relational Model Relates Functions to Assets and Impacts
The overall smart grid relational model relates each smart grid function to the assets (technology
components) required to implement the function and the impacts to the grid that are created by the
function. A graphic of the overall relational model is shown in Figure 44, with enlarged call-outs to
illustrate some of the functions and some of the impacts.

Page 82
Figure 44. Relational Model
A more detailed version of this relational model is built into the RBC model described below.
B.3 Computational Model
The framework above has been built into a computational model that requires various types of inputs,
and calculates the model outputs for each smart grid function. The model is built using the Analytica™
modeling platform, which is readily extensible and offers flexible facilities to create a user interface.
Architecture Overview
A high-level structural diagram of the computational model is shown in Figure 45. This diagram
provides overall perspective on how benefit-cost relationships are made, starting with the input
development process on the left, which leverages available research that must be put into a form suitable
for the model. The computational model shown in the middle uses a deployment model along with grid
characteristics from the Pacific Northwest, and maps defined asset systems and their impacts and
interactions together. It then converts these to costs and benefits. Finally, these are projected onto
structures for scenario and risk options and various analyses outputs on the right.
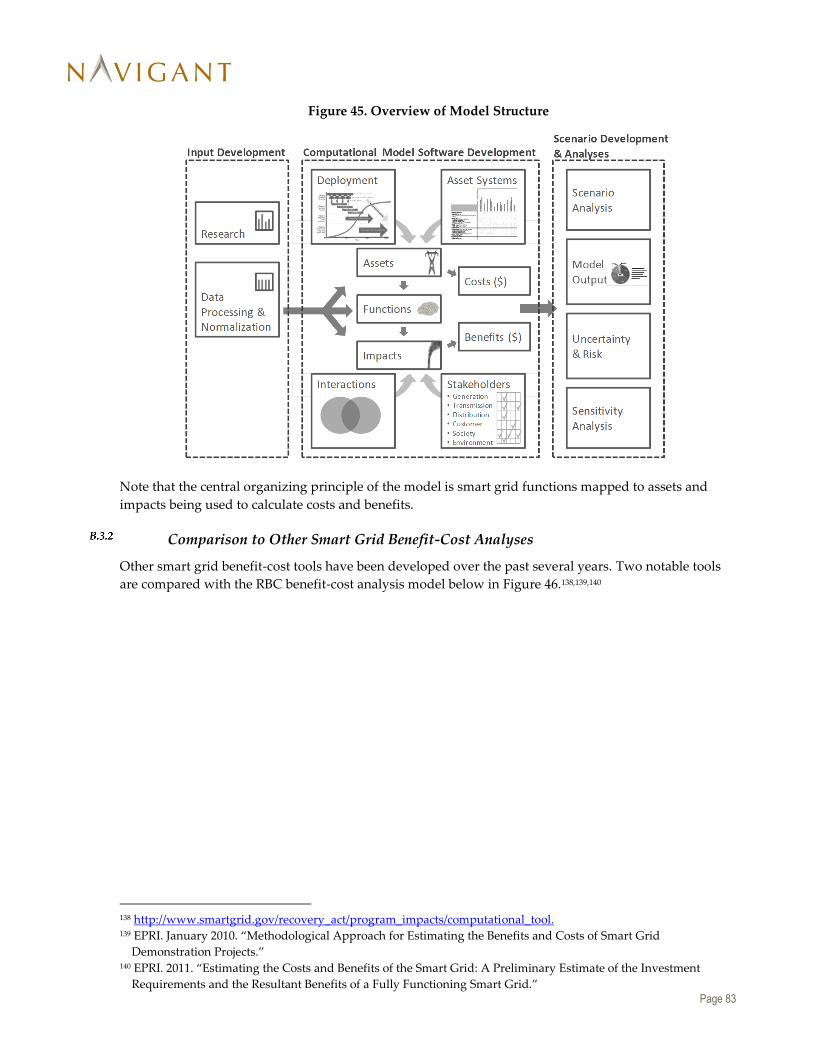
Page 83
Figure 45. Overview of Model Structure
Note that the central organizing principle of the model is smart grid functions mapped to assets and
impacts being used to calculate costs and benefits.
Comparison to Other Smart Grid Benefit-Cost Analyses
Other smart grid benefit-cost tools have been developed over the past several years. Two notable tools
are compared with the RBC benefit-cost analysis model below in Figure 46.138,139,140
138 http://www.smartgrid.gov/recovery_act/program_impacts/computational_tool. 139 EPRI. January 2010. “Methodological Approach for Estimating the Benefits and Costs of Smart Grid
Demonstration Projects.” 140 EPRI. 2011. “Estimating the Costs and Benefits of the Smart Grid: A Preliminary Estimate of the Investment
Requirements and the Resultant Benefits of a Fully Functioning Smart Grid.”

Page 84
Figure 46. Comparison to Other Widely Recognized Benefit-Cost Analyses
B.4 RBC Analysis Inputs
The process of input development for the RBC effort is as significant as the process of developing the
computational model itself. One goal of the RBC effort was to be able to accept data inputs from
basically any relevant source, including research reports, publicly available studies, outputs of various
pilots and demonstration processes, and other sources where useful data may be available.
One critical source of input data for the RBC is the PNW Demonstration Project, which has the highest
concentration of smart grid technology test cases and pilots in the Pacific Northwest. Special efforts have
been made to coordinate with and prepare for leveraging the many experimental results that are
expected from this project.
In addition, many of the initial inputs are based on limited but publicly available data and there is the
expectation that this input data will improve over time, as more experimental results are received and
more analyses are done around the country and in the region. Thus, the RBC effort uses a data maturity
model to describe and characterize the maturity level of the input data.
Leverages a Broad Set of Inputs
Many types of input data sources are shown in Figure 47, and the RBC process has been designed to
accept data from this wide range of sources. The PNW Demonstration Project is shaded in this diagram
to indicate its importance to the RBC process.
*http://www.smartgrid.gov/recovery_act/program_impacts/computational_tool
**Methodological Approach for Estimating the Benefits and Costs of Smart Grid Demonstration Projects. EPRI, January, 2010.
***Estimating the Costs and Benefits of the Smart Grid: A Preliminary Estimate of the Investment Requirements and the Resultant Benefits
of a Fully Functioning Smart Grid; EPRI; 2011.

Page 85
The computational model will accommodate (and depend on) input from a variety of sources. For the
computational model to leverage data from these disparate sources, extensive preparation and
normalization is often necessary. Data must be aggregated to the appropriate level, analyzed, and linked
to functions to estimate benefits. This process was considered necessary to allow the RBC to use the best
available data as it almost continuously becomes available.
Data sources will improve and become refined as the understanding of inputs evolves. As new studies
become available, analysis uncertainty bands will narrow.
Figure 47. RBC Input Sources
A more complete list of data sources and reports used as inputs is provided in Appendix C.
Key Inputs Expected from the PNW-SGDP
Coordination efforts with the PNW-SGDP began in the early stages of the RBC development. Initially,
the RBC efforts primarily drew upon the cost data available from the PNW-SGDP as inputs to the RBC.
More recently, the RBC also incorporated impacts from some of the various PNW-SGDP technology test
cases.
Figure 48 shows a mapping of the PNW-SGDP test data to the relevant functions in the RBC. While not
all test cases provided direct data inputs for the RBC, this mapping shows the significant overlap in
assumed smart grid capabilities.

Page 86
Figure 48. PNW-SGDP Test Case Data Used as Inputs to RBC Model
Inputs Are Updated and Tracked
Figure 49 shows the criteria by which the maturity of an input is ranked. An input does not need to meet
all criteria to receive a ranking number, but should meet the majority of the applicable criteria.
Figure 49. The Input Maturity Tracking System

Page 87
Level two is considered to be fairly good data in most cases for new types of smart grid technologies and
projects. As the technology and projects become better understood and are deployed on a wider basis,
the measured results from these projects will move up the maturity scale.
B.5 Methodological Issues
A number of methodological considerations are important when developing an economic analysis with
the broad scope required for the RBC. The framework that was developed handles a number of these
considerations, as described more in the sections below.
In general, for the broad range of assumptions and estimates that are used as inputs to the model, a
conservative approach or bias has been used throughout the analysis. Thus, the model will tend to
undervalue the benefits and overvalue the costs of smart grid in areas affected by these assumptions.
Smart Grid Definition and Baseline
To attribute costs and benefits specifically to smart grid investment, it is necessary to have a clear
delineation between functions that are smart grid and those that are not. The basic definition of smart
grid used here is that the function requires two-way communication and it uses some form of automated
intelligence. (Note: This does not necessarily mean that a person is not involved in the management or
control of the function, only that a person is not the sole driver of the function.)
This dividing line is difficult at times, especially where existing capabilities have been implemented—
prior to the smart grid—and smart grid is simply enhancing the functionality (such as is the case with
many DR types of functionality). (See the DR example in Figure 50.) In other cases, capabilities simply
were not available prior to smart grid functionality (e.g., PMU-based applications).
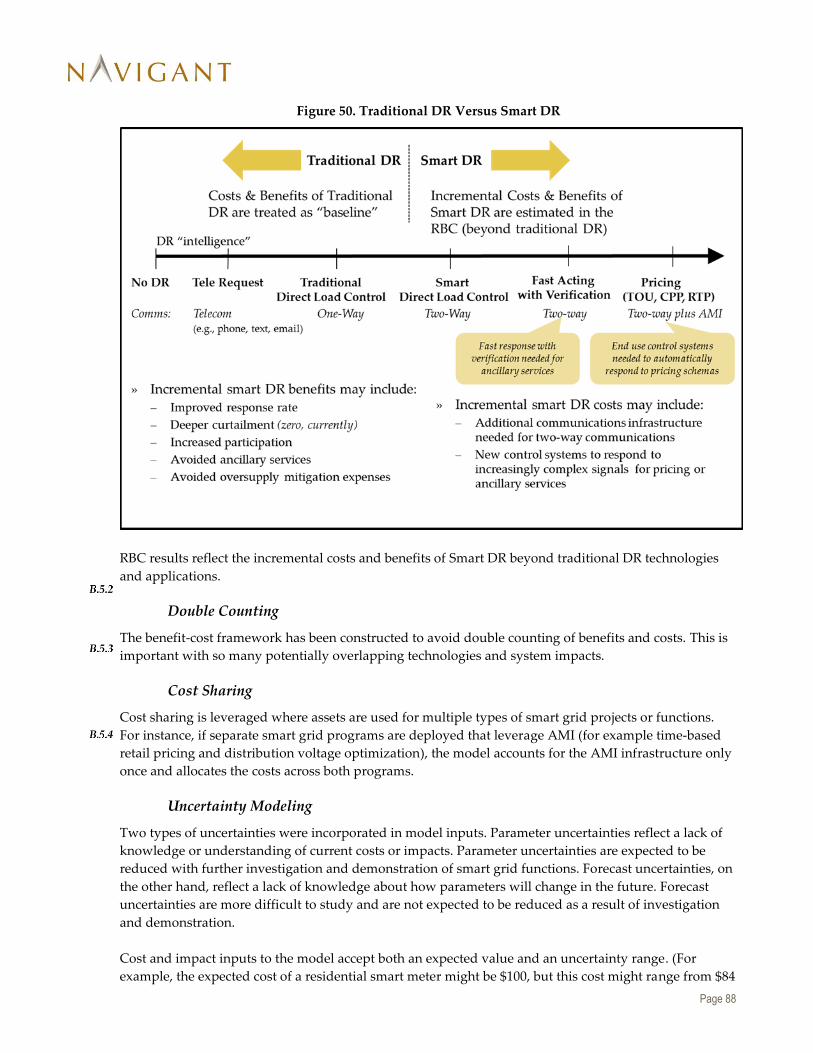
Page 88
Figure 50. Traditional DR Versus Smart DR
RBC results reflect the incremental costs and benefits of Smart DR beyond traditional DR technologies
and applications.
Double Counting
The benefit-cost framework has been constructed to avoid double counting of benefits and costs. This is
important with so many potentially overlapping technologies and system impacts.
Cost Sharing
Cost sharing is leveraged where assets are used for multiple types of smart grid projects or functions.
For instance, if separate smart grid programs are deployed that leverage AMI (for example time-based
retail pricing and distribution voltage optimization), the model accounts for the AMI infrastructure only
once and allocates the costs across both programs.
Uncertainty Modeling
Two types of uncertainties were incorporated in model inputs. Parameter uncertainties reflect a lack of
knowledge or understanding of current costs or impacts. Parameter uncertainties are expected to be
reduced with further investigation and demonstration of smart grid functions. Forecast uncertainties, on
the other hand, reflect a lack of knowledge about how parameters will change in the future. Forecast
uncertainties are more difficult to study and are not expected to be reduced as a result of investigation
and demonstration.
Cost and impact inputs to the model accept both an expected value and an uncertainty range. (For
example, the expected cost of a residential smart meter might be $100, but this cost might range from $84

Page 89
to $115 for some reasonable uncertainty band.) The input uncertainties are used in Monte Carlo analysis
to examine the uncertainties of the output metrics, such as overall benefits, costs, B/C ratios, and NPV.
For column charts with uncertainty ranges indicated by a whisker-line or “Low”, “Expected,” and
“High” specified in a table, the Low and High categories represent the fifth- and ninety-fifth percentiles
of Monte Carlo outcomes, respectively. To properly account for both parameter and forecast
uncertainties, these are the settings used for the outcome categories:
Low Expected High
Uncertainty Percentile 5th 50th 95th
Energy and Demand Forecasts Low Mid High
Integration Costs High Mid Low
Consumer Energy Awareness Low Mid High
Scenario Analysis
Scenarios are used to explore major forecast assumptions and questions about the future that cannot be
answered today (see Figure 51). Uncertain parameters that can be estimated today are treated
statistically as illustrated by the uncertainty bands in the figure.
Figure 51. Scenarios for Forecast Assumptions
Grid Characteristics
Significant characteristics and dynamics of the electric grid in the Pacific Northwest are captured in the
model and used in the economic analysis. These characteristics range from the number of substations
and feeders, to expected peak demand in winter and summer, to the number of transmission miles and
number of customers by segment.

Page 90
Input Maturity
The RBC is an ongoing development, and a large number of inputs are required. Given that there is
more and better data being generated all the time, it was important to allow existing, available inputs to
be used to obtain initial modeling results, while providing a way to update these inputs when more
relevant, regional inputs become available (e.g., from the PNW Demonstration Project). An input
maturity model was developed to track the relative maturity of various inputs, with the goal of
improving the maturity over time, and thus reducing the uncertainties in model outputs.

Page 91
List of Analysis Input Sources
In addition to the Pacific Northwest Smart Grid Demonstration Program (PNW-SGDP) data, there are a
wide range of other data sources that have been used in the model. The following bibliography contains
a list of these sources.
Aivaliotis. June 2010. Dynamic Line Ratings for Optimal and Reliable Power Flow. FERC Technical
Conference. Lake Elmo, MN: The Valley Group.
Aloha Systems, Inc. 2006. Evaluation, Measurement, and Verification Final Report: RCA Verification Program
for New and Existing Residential and Commercial Air Conditioners. CPUC Reference Numbers 1385-
04, 1395-01 and 1437-04. Riverside, CA: Aloha Systems, Inc.
American Wind Energy Association. September 2010. U.S. Wind Energy Projects Database. Washington,
DC: American Wind Energy Association.
Battelle. 2012 & 2015. Avista Workbook. Columbus, OH: Pacific Northwest Smart Grid Demonstration.
Benton PUD Workbook. Columbus, OH: Pacific Northwest Smart Grid Demonstration, 2012 &
2015.
City of Ellensburg Workbook. Columbus, OH: Pacific Northwest Smart Grid Demonstration, 2012
& 2015.
Flathead Workbook. Columbus, OH: Pacific Northwest Smart Grid Demonstration, 2012 & 2015.
Idaho Falls Workbook. Columbus, OH: Pacific Northwest Smart Grid Demonstration, 2012 & 2015.
Lower Valley Workbook. Columbus, OH: Pacific Northwest Smart Grid Demonstration, 2012 &
2015.
Milton-Freewater Workbook. Columbus, OH: Pacific Northwest Smart Grid Demonstration, 2012 &
2015.
Peninsula Light Workbook. Columbus, OH: Pacific Northwest Smart Grid Demonstration, 2012 &
2015.
UW Workbook. Columbus, OH: Pacific Northwest Smart Grid Demonstration, 2012 & 2015.
Black & Veatch. July 2011. Advanced Metering Infrastructure (AMI) Evaluation, Final Report. Chicago, IL:
Black & Veatch.
Bonneville Power Administration. 2010. 2010 BPA Facts. Portland, OR: Bonneville Power Administration.
2010 Resource Program. Portland, OR: Bonneville Power Administration, September 2010.

Page 92
2013 Pacific Northwest Loads and Resources Study. Portland, OR: Bonneville Power Administration,
October 2013.
BPA Demand Response Product Discovery – Consolidated Responses. Portland, OR: Bonneville Power
Administration, February 2012.
Capital Project Proposal: Synchrophasor Program. Portland, OR: Bonneville Power Administration,
2011.
Phone and Email Communications with Lawrence Carter. Portland, OR: Bonneville Power
Administration, fall 2011.
Phone and Email Communications with Lawrence Carter, Dimitry Kosterev, and Nick Leitschuh.
Portland, OR: Bonneville Power Administration. August 2015.
Phone and Email Communications with Steve Brooks. Portland, OR: Bonneville Power
Administration, fall/winter 2011.
Boulos, Hany. March 2012. Do Capacitor Systems Really Save Energy? 5800DB1201. Palatine, IL: Schneider
Electric.
Broad, Diane. September 2011. Smart End Use Energy Storage and Integration of Renewable Energy BPA TI
Project #220. Northwest Power & Conservation Council Meeting. Corvallis, OR: Ecofys.
California Commissioning Collaborative. 2011. Building Optimization Analysis Tool. Portland Energy
Conservation, Inc.
California Public Utilities Commission. October 2008. DEER Database for Energy-Efficient Resources.
Version 2011 4.01. San Francisco, CA: California Public Utilities Commission.
Capers, Peter, et al. October 2011. Mass Market Demand Response and Variable Generation Integration Issues:
A Scoping Study. LBNL-5063E. Berkeley, CA: Ernesto Orlando Lawrence Berkeley National
Laboratory.
Corum, Ken (NPCC) and Navigant Consulting, Inc. September 2011. Smart Grid RBC Data Request to
Northwest Power and Conservation Council. Portland, OR: Northwest Power and Conservation
Council.
Department of Energy. 2011. Recovery Act Smart Grid Programs: Deployment Status. Washington, DC:
Department of Energy.
Open PV Project. Golden, CO: National Renewable Energy Laboratory, 2015.
States with Renewable Portfolio Standards. Washington, DC: Energy Efficiency and Renewable
Energy, June 2009.
Ecofys. Business Case BPA: Smart Energy Storage and Integration of RE. Corvallis, OR: Ecofys.

Page 93
Ecotope Inc. 2011 Residential Building Stock Assessment: Single-Family Characteristics and Energy Use.
Seattle, WA. Northwest Energy Efficiency Alliance. September 2012.
Residential building Stock Assessment: Multifamily Characteristics and Energy Use. Seattle, WA.
Northwest Energy Efficiency Alliance. September 2013.
Electric Power Research Institute (EPRI). December 2010. Electricity Energy Storage Technology Options: A
White Paper Primer on Applications, Costs, and Benefits. 1020676. Palo Alto, CA: EPRI.
Estimating the Costs and Benefits of the Smart Grid. 1022519. Palo Alto, CA: EPRI, March 2011.
Electric Reliability Council of Texas (ERCOT). December 2010. 2010 Day-Ahead AS MCPC. Austin, TX:
ERCOT.
Electric Storage Association. April 2012. Technology Comparison: Life Efficiency. Morgan Hill, CA: Electric
Storage Association.
Energy and Environmental Analysis, Inc. July 2005. Light Commercial HVAC. E05-143. Portland, OR:
Northwest Energy Efficiency Alliance.
Energy Information Administration. January 2012. State Energy Profiles: Data for 2010. Washington, DC:
Energy Information Administration.
Energy Northwest. 2010. Growing Powerful Solutions: 2009 Annual Report. Richland, WA: Energy
Northwest.
Eto, J.H. and K.H. LaCommare. October 2008. Tracking the Reliability of the U.S. Electric Power System: An
Assessment of Publicly Available Information Reported to State Public Utility Commissions. LBNL-
1092E. Berkeley, CA: Ernest Orlando Lawrence Berkeley National Laboratory.
Federal Energy Regulatory Commission. February 2011. Assessment of Demand Response and Advanced
Metering, Staff Report. Washington, DC: Federal Energy Regulatory Commission.
Foster, B. and S. Mazur-Stommen. 2012. Results from Recent Real-Time Feedback Studies. B122. Washington,
DC: American Council for an Energy-Efficient Economy.
Gilbert, E., et al. 2009. Case Study: Developing a Smart Grid Roadmap for a Regional Utility Company.
Chicago, IL: Navigant Consulting, Inc.
Hornby, R., et al. July 2008. Advanced Metering Infrastructure – Implications for Residential Customers in New
Jersey. Cambridge, MA: Synapse Energy Economics, Inc.
Ibanez, E. and M. Milligan. February 2012. Impact of Transmission on Resource Adequacy in Systems with
Wind and Solar Power. NREL/CP-5500-53482. Golden, CO: National Renewable Energy
Laboratory.
Lazar, J. and X. Baldwin. August 2011. Valuing the Contribution of Energy Efficiency to Avoided Marginal
Line Losses and Reserve Requirements. Montpelier, VT: Regulatory Assistance Project.

Page 94
Mason County Public Utility District No. 3. 2010. Comprehensive Annual Financial Report for the Fiscal Year
Ended December 31, 2009. Shelton, WA: Mason County Public Utility District No. 3.
MetaResource Group. May 2011. Emerging Technologies and Behaviors for Energy Efficient Industrial
Refrigeration. Report #40353. Portland, OR: Northwest Energy Efficiency Alliance.
Navigant Consulting, Inc. 2014 Commercial Building Stock Assessment: Final Report. Portland, OR:
Northwest Energy Efficiency Alliance. December 2014.
Advanced Metering Infrastructure (AMI) Future Program Study. St. John’s, Newfoundland:
FortisBC. March 2011.
Analysis to Update Energy Efficiency Potential, Goals, and Targets for 2013 and Beyond. San Francisco,
CA: California Public Utilities Commission, May 2012.
Benchmarking of Vermont’s 2008 Electric Energy Efficiency Programs: A Comparative Review of
Efficiency Vermont and Burlington Electric Department. Montpelier, VT: Vermont Department of
Public Service, May 2010.
Electric Vehicle Geographic Forecasts. Boulder, CO: Navigant Research. 2014.
Long Term Monitoring and Tracking Report on 2009 Activities. E10-218. Portland, OR: Northwest
Energy Efficiency Alliance, October 2010.
A Preliminary Assessment of Demand Response Programs and Potential. Portland, OR: Northwest
Power and Conservation Council, January 2015.
NSTAR Grid Self-Healing and Efficiency Expansion: Metric and Benefits Reporting Plan. Westwood,
MA: NSTAR Electric & Gas Corporation, December 2010.
NSTAR Urban Grid Monitoring and Renewables Integration: Metric and Benefits Reporting Plan.
Westwood, MA: NSTAR Electric & Gas Corporation, September 2011.
Phone and Email Communications with Bruce Hamilton. Chicago, IL: Navigant Consulting, Inc.,
2011.
Smart Grid RBC Data Request to Bonneville Power Administration. Portland, OR: Bonneville Power
Administration, August 2011.
U.S. Department of Energy Energy Storage Computational Tool (ESCT). Draft Version. Washington,
DC: U.S. Department of Energy, June 2012.
U.S. Department of Energy Smart Grid Computational Tool (SGCT). Draft Version. Washington, DC:
U.S. Department of Energy, August 2010.
North American Electric Reliability Corporation. October 2010. 2010 Long-Term Reliability Assessment.
Washington, DC: North American Electric Reliability Corporation.

Page 95
Northwest Power and Conservation Council. 2009. Conservation Supply Curve Files: Distribution System:
Supporting Data. Portland, OR: Northwest Power and Conservation Council.
Direct Use of Natural Gas: Economic Fuel Choices from the Regional Power System and Consumer’s
Perspective. Council document 2012-01. Portland, OR: Northwest Power and Conservation
Council, 2012.
Economic, Demand, and Partial Generation Assumptions. Portland, OR: Northwest Power and
Conservation Council, 2010.
Marginal Cost and Load Shape Data File. Portland, OR: Northwest Power and Conservation
Council, 2009.
Power Supply Adequacy Assessment for 2020-2021. Portland, OR: Northwest Power and
Conservation Council, May 2015.
Seventh Plan: Technical Information and Data: Wifi Thermostats Data File. Portland, OR: Northwest
Power and Conservation Council, 2015.
Sixth Northwest Conservation and Electric Power Plan. Council Document 2010-09. Portland, OR:
Northwest Power and Conservation Council, 2010.
NorthWestern Energy. 2009. Smart Grid Demonstration Project Summary. Sioux Falls, SD: NorthWestern
Energy.
Pacific Gas and Electric Company. September 2011. Advanced Metering Infrastructure Semi-Annual
Assessment Report SmartMeterTM Program Quarterly Report. CPUC Decisions 06-07-027 and 09-03-
026. San Francisco, CA: Pacific Gas and Electric Company.
Pratt, R.G., et al. 2010. The Smart Grid: An Estimation of the Energy and CO2 Benefits. PNNL-19112.
Richland, WA: Pacific Northwest National Laboratory.
Research and Innovative Technology Administration, U.S. Department of Transportation. June 2012.
Table 4-23: Average Fuel Efficiency of U.S. Light Duty Vehicles. Washington, DC: Research and
Innovative Technology Administration, U.S. Department of Transportation.
Sastry, C., et.al. Use of Residential Smart Appliances for Peak-Load Shifting and Spinning Reserves. PNNL-
190833. Richland, WA: Pacific Northwest National Laboratory, December 2010.
St. John, Jeff. 2011. PG&E’s Smart Grid Plans for Shorter Power Outages. Boston, MA: Greentech Media.
Sullivan, Michael J. 2009. Estimated Value of Service Reliability for Electric Utility Customers in the United
States. LBNL-2132E. Berkeley, CA: Ernest Orlando Lawrence Berkeley National Laboratory.
Sullivan, Michael J., et.al., 2015. Updated Value of Service Reliability Estimates for Electric Utility Customers in
the United States. LBNL-6941E. Berkeley, CA: Ernest Orlando Lawrence Berkeley National
Laboratory.
Page 96
System Planning Committee. 2010. Reserves in Capacity Planning: A Northwest Approach. Portland, OR:
Pacific Northwest Utilities Conference Committee.
FERC National DR Potential Assessment: Results Viewer. Washington, DC: Federal Energy
Regulatory Commission, June 2009.
The Brattle Group, et al. June 2009. A National Assessment of Demand Response Potential.
Washington, DC: Federal Energy Regulatory Commission.
The Cadmus Group, Inc. December 2011. Kootenai DR Pilot Evaluation: Full Pilot Report. Waltham,
MA: Bonneville Power Administration.
Tweed, Katherine. March 2011. Demand Response and Renewables: Too Good to be True?. Boston, MA:
Greentech Media.
U.S. Department of Energy, National Renewable Energy Laboratory. February 2012. U.S. Installed Wind
Capacity. Washington, DC: U.S. Department of Energy, National Renewable Energy Laboratory.
U.S. Department of Energy, Office of Energy Efficiency and Renewable Energy. January 2011. Alternative
& Advanced Vehicles: Electricity Emissions. Washington, DC: U.S. Department of Energy, Office of
Energy Efficiency and Renewable Energy.
U.S. Energy Information Administration. EIA 861 2014 – Early Release: Annual Electric Power Industry
Repor, Advanced Meterst. Washington, DC: U.S. Department of Energy.
Western Electricity Coordinating Council. 2014. Carbon Price Forecast Discussion. Salt Lake City, UT:
Western Electricity Coordinating Council. August 2014.
The Western Interconnection Synchrophasor Project Fact Sheet. Salt Lake City, UT: Western
Electricity Coordinating Council, March 31, 2013.
Wiser, R. and M. Bolinger. June 2011. 2010 Wind Technologies Market Report. Washington, DC: U.S.
Department of Energy.
Page 97
Analysis Update: Selected Details
D.1 Changes Since the Interim RBC Was Released
An interim version of this analysis with preliminary results was released in late 2013. The analysis
presented here updates that analysis with a number of important inputs and adjustments. Two years
have passed since the interim, and even a bit longer since some of the data inputs that contributed to that
analysis. During that time, the deployment curves for the various technologies have moved two years
further down their deployment paths, which affects both the costs and benefits. However, the analysis
period still looks 30 years into the future, thus the deployment dynamic is slightly different than in the
previous version.
A number of updates were made to the RBC inputs subsequent to the release of the Interim RBC.
Among these are included:
» Updated inputs from a number of PNW-SGDP Test Case results
o PNW-SGDP “Design and Data” workbooks were used to map the impacts and asset
system costs that were applicable to the RBC
» Updated regional energy related data
o Energy and demand forecast from “2013 Pacific Northwest Loads and Resources Study”
or “2013 White Book”
o Extensive review of regional marginal capacity pricing
o Updated the currently installed wind capacity in the region based on the Northwest
Power and Conservation Council’s estimates. Power Supply Adequacy Assessment for
2020-2021 (May 2015)
» Updated selected impact and cost data
o Numerous updates for DR, EE, and Storage costs and impacts
» Updated selected algorithms
o Equipment Life Extension
o Renewables Integration
o Added Revenue Requirements impact estimates
Some of the specific changes for each Investment Category are detailed below.
» T&D Optimization
o B&C↓: PMU deployment ↓
o B↓: avoided capacity costs ↓
o C↑: PMU costs ↑
o C↑: final # of PMUs deployed ↑
» Grid Reliability
o B↑: Updated LBNL numbers – customer valuations increased
o B↓: Reduced certain key inputs (i.e., CAIFI and SAIDI benefits) due to newer
information.
» DR
o B&C↑: DR deployment ↑
o B↓: avoided capacity costs ↓
o B↓: removed oversupply mitigation needs and near-term DEC purchases

Page 98
o C↓: removed AMI (except for price responsive DR) and Gateway devices; changed
communications
o C↓: ↑ initial asset penetration of smart thermostats
» EE
o B&C↑: End Use Conservation deployment ↑ 2030%
o C↓: removed AMI, in-home devices, and Gateway devices
o C↓: ↑ initial asset penetration of smart thermostats
» Storage
o B&C↑: Storage deployment ↑ (except campus-sited storage)
o B↓: avoided capacity costs ↓
o B↓: removed oversupply mitigation needs and near-term DEC purchases
o C↓: updated battery costs and sizes, based on Navigant Research, and increased cost
reduction fraction
» Utility Operational Efficiency
o C↓: Added more shared AMI costs here, but also more than doubled the initial asset
penetration of AMI, which reduced the near-term AMI deployment costs
The combined impact of updating these inputs was a relatively small, but noticeable, effect on the
business case results. For example, decline in generation capacity costs reduced the benefits of avoided
capacity, and increased reliability estimates increased the value of reliability to end users.
D.2 Energy Storage Analysis Details
This section includes additional details of the electricity storage analysis. Figure 52 summarizes the
assumptions for each battery scale.
Figure 52. Storage Assumptions
For residential systems, the analysis assumes that customers use their battery in conjunction with a time-
of-use (TOU) rate for energy arbitrage, charging the battery when prices are low and discharging when
pricing are high. Controlling the battery based on a TOU rate results in end use peak demand reduction
benefit due to the alignment of peak demand hours and high TOU prices.
For medium- and large-scale battery systems, customers also benefit from reducing their demand charge
when operating their battery for peak load reduction.
Utility-scale batteries installed at distribution substations provide peak load reduction during select
hours, and renewables integration and ancillary services such as regulation, voltage support, and short-
term reserves during the remaining hours.
Battery Scale Small-scale Medium-scale Large-scale Utility-scale
Installed Cost ($/kW) 6,300 3,800 3,400 1,100
Battery Capacity (kW) 2 15 500 5,000
Battery Energy (kWh) 7 30 1,000 10,000
Use Case
Arbitrage,
Peak Reduction
Arbitrage,
Peak Reduction
Arbitrage,
Peak Reduction, Ancillary
Services
Ancillary Services,
Peak Reduction,
Renewables Integration

Page 99
D.3 Revenue Requirements Directional Analysis Details
Navigant leveraged the following overarching equation, with its parameters defined in Figure 53, to
calculate the incremental revenue requirements from smart grid investments:
Revenue Requirements = (Gross Investment – Accumulated Depreciation) * Rate of Return + Operating
Costs + Depreciation Expenses + Taxes + Other
ΔRR = (ΔGI – ΔAD) * R + ΔOC + ΔD + ΔT + ΔOther
where, ΔRB = ΔGI - ΔAD
Figure 53. Overarching Revenue Requirements Equation
Overall assumptions for the directional revenue requirements calculation:
PUDs comprise 42 percent, IOUs 58 percent of Distribution smart grid Investment based on
percent of MWh sold from 2014
BPA comprises 75 percent and IOUs and other transmission operators 25 percent of transmission
smart grid investment
Depreciation expenses are calculated using straight depreciation over the lifetime of each asset
BPA’s portion of transmission and PUDs finance each investment over the lifetime of each asset
at a 3.1 percent interest rate (from U.S. Treasury)
IOU’s finance investments based on the rate base (gross investment – accumulated depreciation)
multiplied by a Weighted Cost of Capital (WACC) of 10.33 percent; this WACC percentage
includes federal taxes. WACC obtained from Table 4.1.2.1-1: Schedule 2,
https://www.bpa.gov/Finance/ResidentialExchangeProgram/FY20142015UtilityFilings/ASC-14-
PS-01.pdf
IOU’s pay state taxes at a blended rate of 4 percent; PUDs and BPA do not pay taxes
Time series results in Figure 54, Figure 55, and Figure 56 for the three different analysis groups are
provided below.

Page 100
Figure 54. RR Results: Publicly Owned Utility Districts (PUD)
Figure 55. RR Results: IOU-Distribution Only
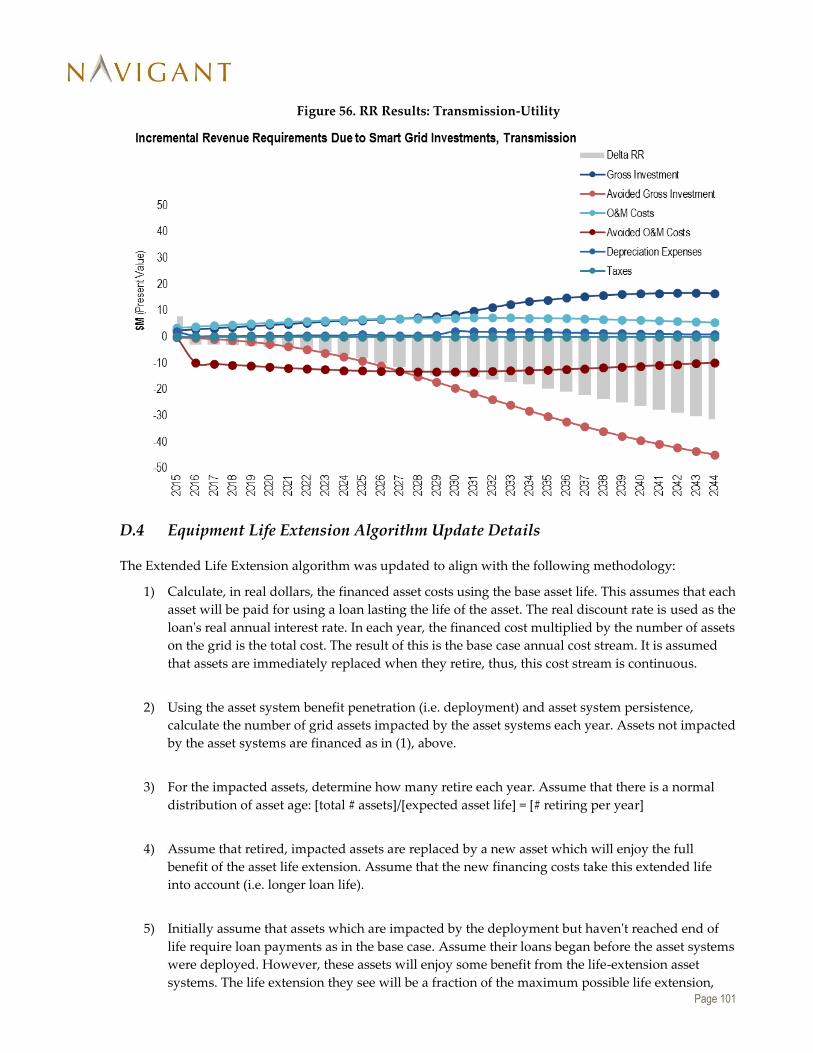
Page 101
Figure 56. RR Results: Transmission-Utility
D.4 Equipment Life Extension Algorithm Update Details
The Extended Life Extension algorithm was updated to align with the following methodology:
1) Calculate, in real dollars, the financed asset costs using the base asset life. This assumes that each
asset will be paid for using a loan lasting the life of the asset. The real discount rate is used as the
loan's real annual interest rate. In each year, the financed cost multiplied by the number of assets
on the grid is the total cost. The result of this is the base case annual cost stream. It is assumed
that assets are immediately replaced when they retire, thus, this cost stream is continuous.
2) Using the asset system benefit penetration (i.e. deployment) and asset system persistence,
calculate the number of grid assets impacted by the asset systems each year. Assets not impacted
by the asset systems are financed as in (1), above.
3) For the impacted assets, determine how many retire each year. Assume that there is a normal
distribution of asset age: [total # assets]/[expected asset life] = [# retiring per year]
4) Assume that retired, impacted assets are replaced by a new asset which will enjoy the full
benefit of the asset life extension. Assume that the new financing costs take this extended life
into account (i.e. longer loan life).
5) Initially assume that assets which are impacted by the deployment but haven't reached end of
life require loan payments as in the base case. Assume their loans began before the asset systems
were deployed. However, these assets will enjoy some benefit from the life-extension asset
systems. The life extension they see will be a fraction of the maximum possible life extension,

Page 102
and can be thought of as "free" years at the end of the asset's life. The original loan payments
stop at the end of the base life, but the loan payments for the new assets won’t have to start for
some additional time. This can be represented by subtracting some amount from the extended-
life asset's cost stream. That amount is equal to the number of "free" years added to the existing
assets’ life multiplied by the financed cost per asset. This needs to be calculated for each year,
based on the number of assets that would have (under the base case) retired during that year.
6) Following with the assumption of the normal distribution of age and the gradual deployment of
the asset system impact, assets will have, on average, experienced an effective number of years
of asset system benefit equal to: ([simulation year]-[model start year]) / 2.
7) Subtract the extended life cost stream from the base case cost stream to determine the benefit
stream in real dollars.
8) Convert from real to nominal dollars using the previously calculated discount factor (which is
later used to convert all model nominal dollar benefits back to real dollars and present value
when the outputs are calculated).
D.5 Deployment Methodology
The following describes how function deployment leads to costs and benefits.
A smart grid capability (function) is deployed across the region as a percentage of a particular
deployment grid characteristic (e.g., number of customers, number of transmission substations, etc.—
depending on the function). This triggers the deployment of costs and benefits, as described more below:
Costs: Costs are driven by assets. An asset will be “deployed” in the model when a smart grid
capability that requires that asset is deployed, and the asset is not already available for use or
sharing among capabilities (e.g., deployment of network assets can be driven by one capability,
and once deployed can be leveraged by other capabilities without further deployment).
Navigant controls and varies the capability deployment curves within the model, and the
necessary assets to meet this deployment are then deployed.
o Asset scaling: In the asset scaling worksheet, Navigant accounts for the percentage of
customers with a particular type of end use that is suitable for smart DR. For instance,
Navigant scales smart thermostats by 35 percent to account for the fact that about 35
percent of residential customers have electric space heating and would be eligible to
participate in a smart DR program. This then scales down the costs accordingly.
Benefits: Depending on the function, the deployment for an impact may be scaled down to
reflect that not all customers or stakeholders with a capability available will see benefits from it
(e.g., by choosing not to participate, not activating the technology, etc.). As an example of this,
Navigant can look at how the impacts from DR deployment are scaled down:
o Impacts: Impacts are calculated as a percent of end use load to reflect only those
customers with the end use technologies eligible for participation.
o Realization rate: Navigant also assumes a realization rate to account for the fraction of
participants that actually use the technologies and achieve savings by participating in
events.

Page 103
D.6 Cost Methodology
The following describes the cost categories used in the RBC model.
Asset System-level
Overhead (Admin, Customer Serv, Marketing, Training, Other) - $/year recurring cost
Overhead (Admin, Customer Serv, Marketing, Training, Other) - $ startup cost
Operations, Engineering, Other Labor - $/year recurring cost
Operations, Engineering, Other Labor - $ startup cost
Contracting - $/year recurring cost
Contracting - $ startup cost
Asset-level
Base Equipment - $/unit
Smart Equipment - $/unit
Installation - $/unit
Integration - $/unit
Maintenance - $/unit