small wind energy fundamentals · small wind energy fundamentals ... ksa 66-1,184 buy-back...
TRANSCRIPT

Small Wind Energy Fundamentals A Webinar for Midwest Energy Customers
Patrick Parke, VP Customer ServiceRay Harold, VP Engineering
November 3, 2009
Midwest Energy, Inc.Hays, Kansas
www.mwenergy.com
Agenda• Opening Comments• Kansas Interconnection Statutes• 10 Steps to a Sound Decision• Examples – Calculating Generating Cost• Time for Questions
Not on the Agenda• Climate change• Value of environmental benefits• Value of other factors such as “energy
independence”, economic development, etc.• Detailed zoning discussion• Commercial wind farms, wind leasing, etc.• “Off grid” systems

How many people are viewing this webinar at your location?
• A. One• B. Two• C. Three• D. Four or more

Midwest Energy Supports Wind• Smoky Hill Wind Farm: Purchase ~20%
of output for 20 years• Kansas leader in proportion of wind
~16% relative to peak retail load• Exceeds KS requirements through 2019

Neutral View of Small Wind• It’s your decision to make• Midwest Energy’s interests:
– Maintain safety of workers and public– Avoid harm to power quality or reliability– Avoid raising costs for others
• Concerned about some small wind claimsA major part of this meeting is helping you understand the economics of small wind.

Kansas Interconnection Statutes• KSA 66-1,184: Interconnection & buy-back
– Applies to all cooperatives and municipal utilities– Does not address zoning
• KSA 66-1263 thru 66-1271: Net metering and easy connection act (Customers of Investor Owned Utilities may choose this or 66-1,184.)
• KSA 17-4652: Renewable generation coops (100+ kW generators selling at wholesale)

KSA 66-1,184 Size Limitations
• Residential – 25 kW or less
• Commercial – 200 kW or less
• “Appropriately sized” for customer’s load
• Midwest Energy interpretation: No larger than customer load

KSA 66-1,184 Buy-back Provisions• Buy-back rate for excess RENEWABLE
generation is 150% of utility’s system average wholesale energy cost; rate paid =– 4.114 ¢/kWh for calendar year 2007– 5.438 ¢/kWh for calendar year 2008– 3.986 ¢/kWh for 6 months ended June, 2009
• Originally, an alternative to “net metering”• Net metering value would be about 8 ¢ per
kWh for Midwest Energy

KSA 66-1,184 Other Provisions
• Subject to KCC-approved regulations
• Method of payment to customer: bill credit or rebate
• Very general safety/protection guidelines
• # of generators connected may be limited by capacity of line or 4% of utility peak load
• Utility owns, supplies & maintains meter(s)

Midwest Energy Metering• Dual-register meter
– kWh sold to customer at regular rate
– kWh purchased by Midwest Energy per statute
• Additional meter placed on generator to measure total generation for study purposes – allows us to calculate “capacity factor”

Kansas wind speeds are the highest in the spring. Which season has the
lowest wind speeds? • A. Winter• B. Summer• C. Fall• D. Campaign season

10 Steps to a Sound Decision (Refer to Handout)
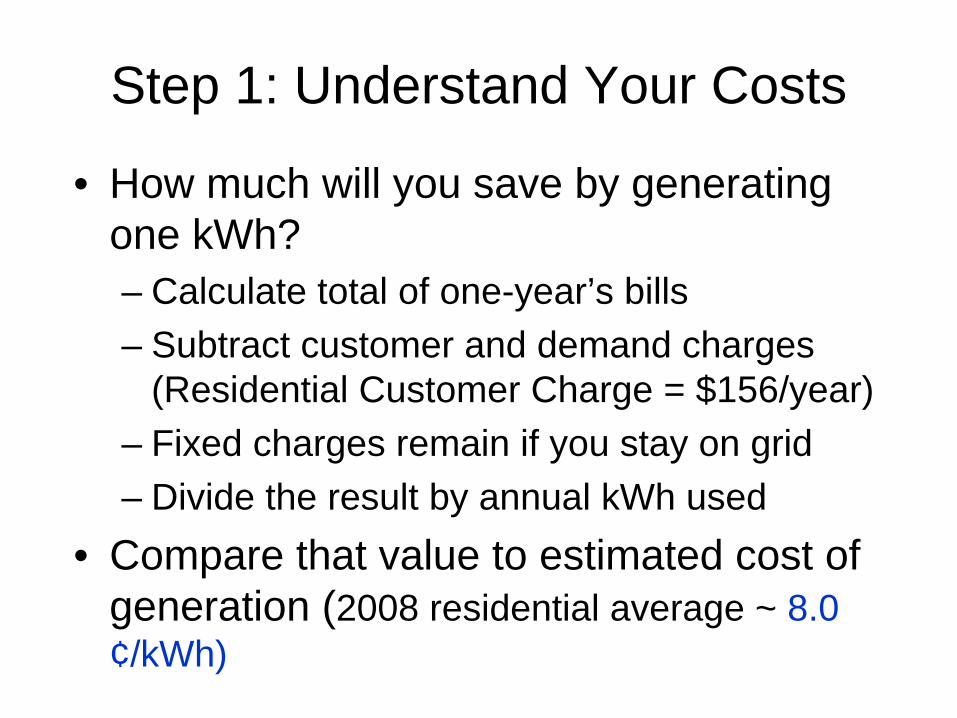
Step 1: Understand Your Costs
• How much will you save by generating one kWh?– Calculate total of one-year’s bills– Subtract customer and demand charges
(Residential Customer Charge = $156/year)– Fixed charges remain if you stay on grid– Divide the result by annual kWh used
• Compare that value to estimated cost of generation (2008 residential average ~ 8.0 ¢/kWh)

Step 1: Reduce Use First
• Cheapest and cleanest energy is what we don’t use
• Energy Efficiency comes first– Energy Efficiency as low as 3 ¢/kWh– Existing large-scale wind 4-5 ¢/kWh– New large-scale wind 6-7 ¢/kWh– Small wind ??

Step 1: Get Help with Efficiency• On-line energy calculators
• Midwest Energy on-site services (audits, infiltration & duct tests, infrared scans, etc.)
• How$mart® energy efficiency funds– Bill savings pay for improvements
– Obligation stays with the structure (survives tenant and ownership changes)
• Look for Energy Star products

Step 2: Determine Wind Resources• Almost a “no brainer” in Western Kansas
• Check KCC wind energy maps http://www.kcc.state.ks.us/energy/wind_maps.htm (use 30 meter wind speed for small turbines)
• Experts recommend at least Class 2 winds; Midwest Energy area mostly Class 3 & 4
• Beware: Wind speed maps do not indicate site- specific conditions (trees, buildings, etc.)

Average Annual Wind Speed – 30M

Average Annual Power Density – 30M
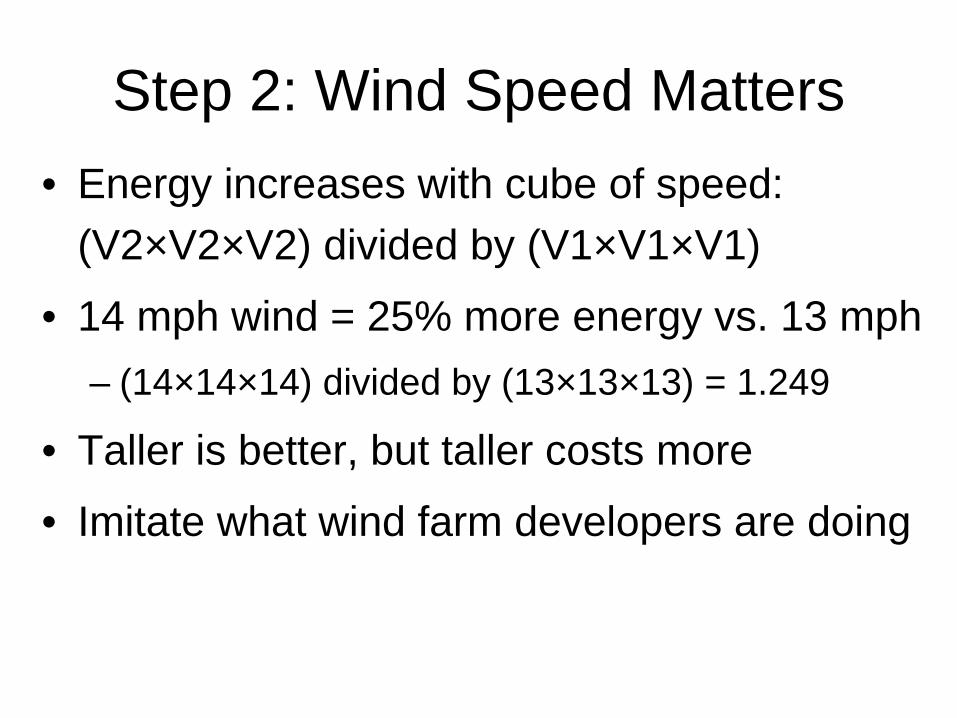
Step 2: Wind Speed Matters• Energy increases with cube of speed:
(V2×V2×V2) divided by (V1×V1×V1)
• 14 mph wind = 25% more energy vs. 13 mph– (14×14×14) divided by (13×13×13) = 1.249
• Taller is better, but taller costs more
• Imitate what wind farm developers are doing

Wind Shear Profile –
Importance of Height
and Speed


Step 2: Determine Site Suitability• Usually 1 or more acres to meet zoning
set-back requirements• Avoid turbulence – mount turbine 30 feet
higher than obstacles within 300 feet• Plan for mature tree height• Refer to DOE publication – Small Wind
Systems: A US Consumers Guide

Step 2: Minimize Turbulence
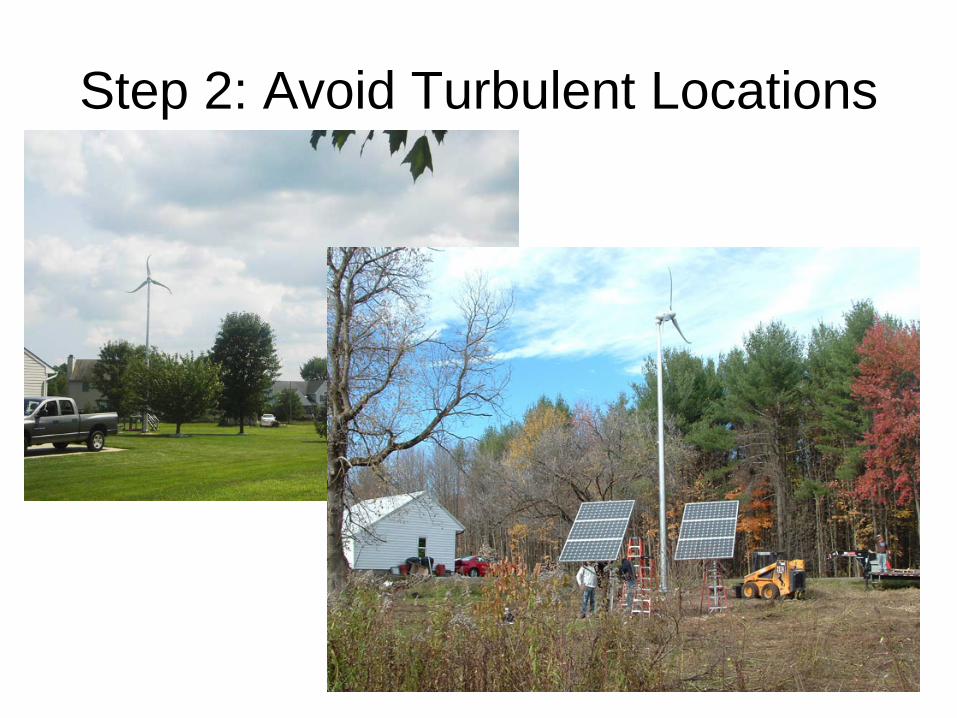
Step 2: Avoid Turbulent Locations

Step 2: Find Unobstructed Locations

Step 2: Contact Midwest Energy• Technical interconnection requirements
• Application forms
• Transformer size is approximate indicator of maximum generator size
• Need information for metering decisions (load research meters may require additional electrical enclosures)

Why do wind turbines cause bat deaths in some locations?
• A. Lethal, subsonic vibrations.
• B. Impact with turbine blades.
• C. Air pressure changes.
• D. Scared to death.

Step 3: Estimating Energy Output• Compare your annual use with manufacturer’s
estimated turbine output• Iowa Energy Center: 25% to 75% of needs• Estimate kWh by assuming capacity factor, or• NREL formula:
– Annual kWh = 0.01328×D2×V3
– Annual kWh = 0.01328×D×D×V×V×V– D = rotor diameter (feet)– V = average wind velocity (mph)

Step 3: Equipment Features• BEWARE: No industry-wide standards to
compare performance (in progress)• Critical specifications:
– Rotor diameter determines “swept area”
– Tower height (compare increased energy output versus additional tower cost)

Step 3: Height & Roughness Affect Wind Speed

Step 3: Available Energy vs. Height Speed: V2 = V1×(H2/H1)n
n = 0.15 to 0.18 for grass or low row crops
Energy: (V2×V2×V2) divided by (V1×V1×V1)
• If base case = turbine on tower 100* feet tall:– At 120 feet: 8 to 10 percent more energy– At 80 feet: 10 to 11 percent less energy– At 60 feet: 21 to 24 percent less energy– At 40 feet: 34 to 39 percent less energy*KCC maps provide speeds at 30 meters (~100’)
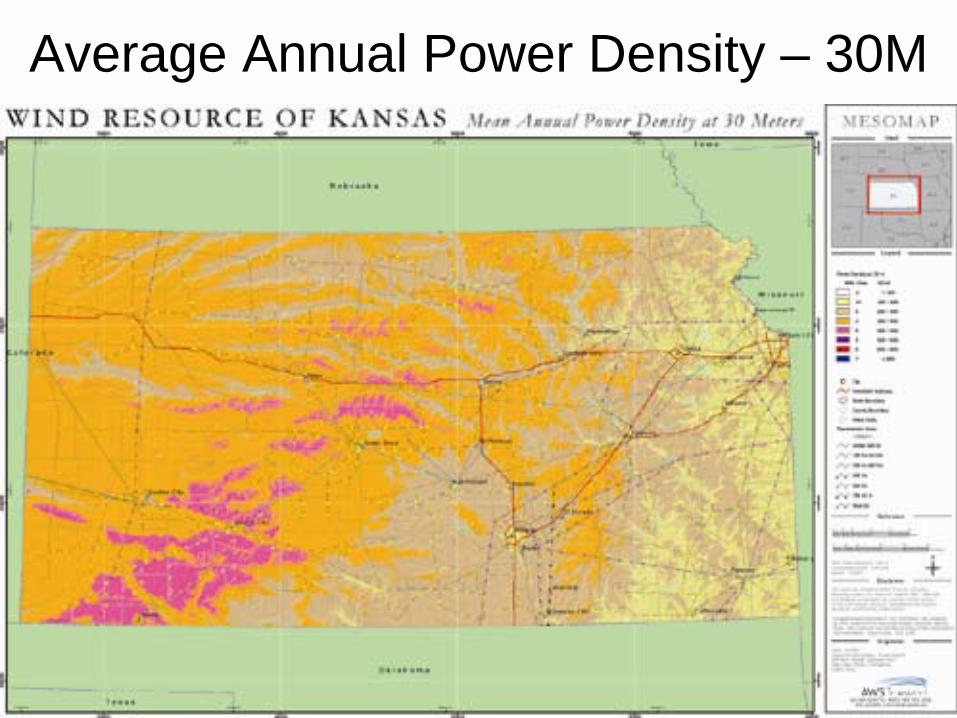
Average Annual Power Density – 30M
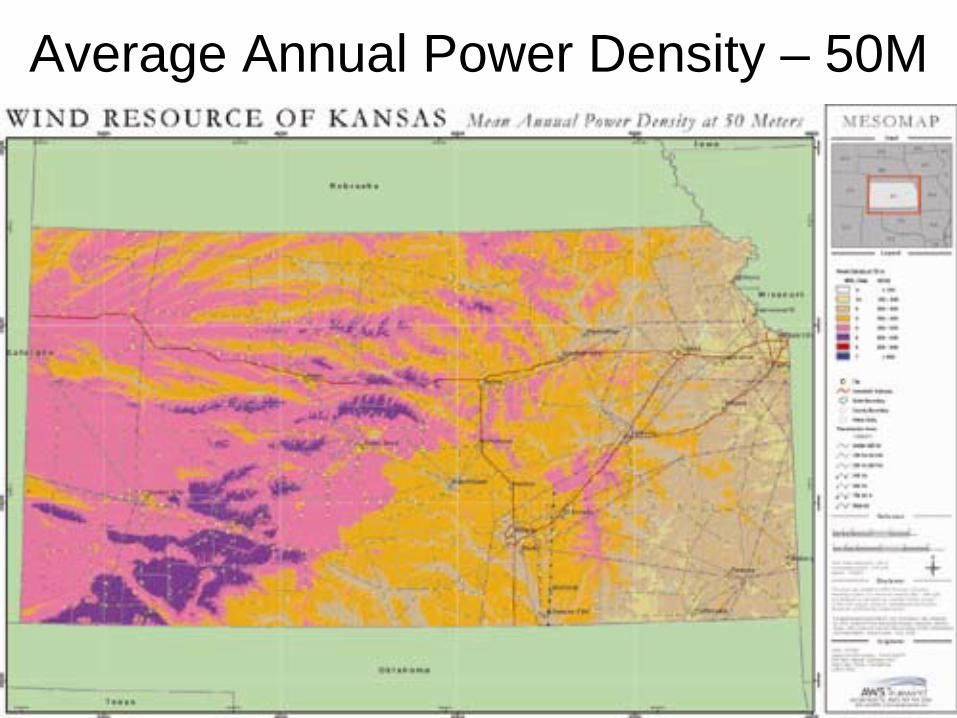
Average Annual Power Density – 50M

Step 3: Tower Cost vs. Height (from www.bergey.com for 10 kW unit)
• Guyed lattice
– 80 ft - $10,900
– 100 ft - $12,900
– 120 ft - $15,200
• Tilt-up
– 80 ft - $14,620
– 100 ft – $16,870

Step 3: Tower Cost vs. Height (from www.bergey.com for 10 kW unit)
• Self-supporting lattice
– 80 ft - $11,800
– 100 ft - $14,700
– 120 ft - $18,400

Step 3: Tower Cost vs. Height (from www.bergey.com for 10 kW unit)
• Tubular (monopole)– 60 ft - $17,900– 90 ft - $24,200– 120 ft - $33,500

Step 4: Federal Tax Credit• Federal tax credit (100 kW or less)
• 30% of total cost ($4,000 cap eliminated)
• Not refundable (must offset a tax liability)– May swap for Treasury grant (excluding residential)– For grants, must be in service before 2013– Treasury grant not available to tax-exempt entities
• 30% tax credit available through 2016
• Consult with your tax advisor!

Step 4: USDA Section 9007 Grants Rural Energy for America Program (REAP)
• 25% of eligible costs• $2500 to $500,000 grants• 50% of gross income from agriculture or be
a rural (under 50,000 population) small business (per SBA), for-profit entity
• Must submit application before purchase• Competing nationally for grant $• REAP includes energy efficiency grants

Step 4: Federal Production Tax Credit• 2.1 cents per kWh for 10 years; annual
escalation• Not for turbines generating power to be used
on site• Only for “sale of electricity” to unrelated
person (IRS Form 8835)• Consult with your tax advisor!!• Complete list of state & federal incentives:
http://www.dsireusa.org/

Step 5: Cost, Savings & Payback• $3000 to $6000 per kW of capacity
• Smaller systems may cost more per kW
• Obtain multiple dealer estimates & bids
• Small Wind Capital Cost Recovery Worksheet– Estimates cost of generation (cents/kWh)
• Cash flow analysis spreadsheet

Step 6: Zoning & Code Regulations• Zoning regulations (See “Ten Steps”
handout for AWEA link.)
• Building permits
• Electrical permits
• Talk to neighbors

Step 7: Utility Application• http://www.mwenergy.com/windprojectdev.aspx• Exhibit A – Application/Agreement for up to
10kW with UL listed inverter (“Simplified”) • Exhibits B & F – Application and Agreement for
turbines over 10kW• Complicated – Your dealer should be able to
interpret; good reason to contact us at Step 2

Step 7: Customer Cost Responsibility• Application fees
– Up to 10 kW (“Simplified”) = $0– Larger machines: $3 per kW ($300 minimum
$2,500 maximum)• Review and study costs (complex cases)• Special equipment and system
modification costs (if any)• Utilities must provide cost estimates in
advance (KSA 66-1,184)

Step 8: Select a Dealer/Installer
• Ask other owners for references
• American Wind Energy Association (AWEA)
http://www.awea.org/smallwind/
Click on “Equipment Providers”
• Get quotes from several
• Don’t settle for, “It’s the only one we sell.”

Step 8: Questions for Vendors• Assumptions used to estimate output;
calculation methods• Is inverter UL 1741 listed?• Component and total installed costs• Length of warranty; coverage • Lightning protection included?• Dealer/installer experience & credentials• More questions at web site in handout

Step 9: Look at Alternatives
• Different sizes of machine
• Different tower heights
• Different manufacturers
• Repeat “cost recovery worksheet” for multiple combinations
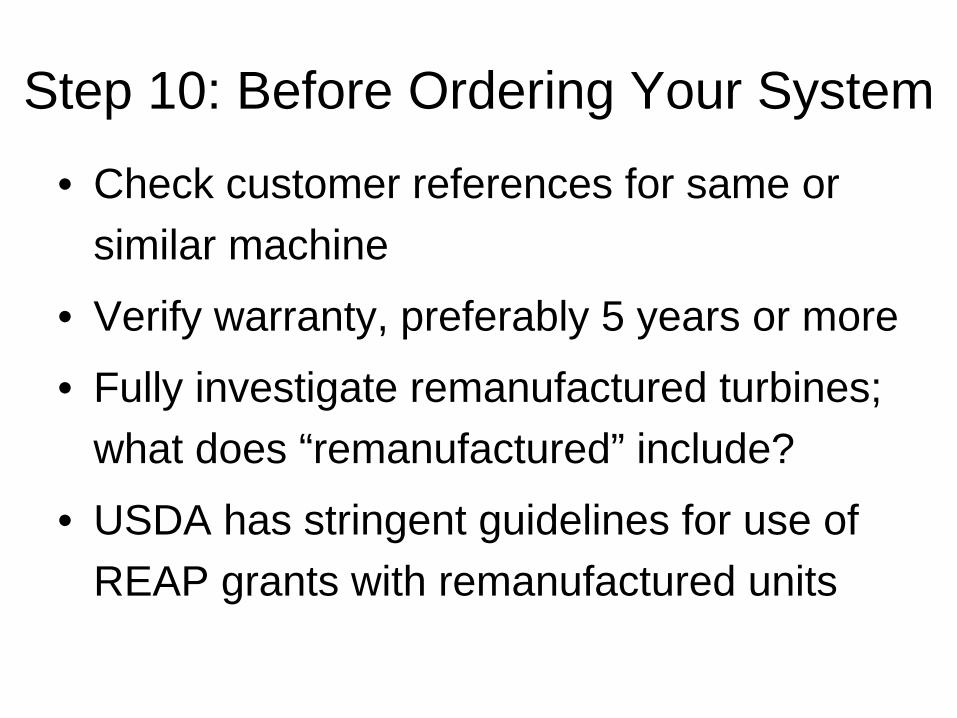
Step 10: Before Ordering Your System
• Check customer references for same or similar machine
• Verify warranty, preferably 5 years or more
• Fully investigate remanufactured turbines; what does “remanufactured” include?
• USDA has stringent guidelines for use of REAP grants with remanufactured units

When is more wind energy produced in Kansas, day or night? In other words, when is it windier?
• A. Day time (8 AM to 8 PM)
• B. Night time (8 PM to 8 AM)
• C. About the same, day and night

Exercise – Calculating Cost of Wind Turbine OutputPurpose of this Exercise:
To demonstrate the calculation process; you should repeat the calculations with your own
costs and output assumptions.
Handouts:Small Wind Capital Cost Recovery Worksheet
Small Wind Cost Estimation Answer Sheet

Bergey Excel (10 kW, 23-ft diameter)
• Web Site: $49,650 to $58,645 (100’ tower)
• Dealer: ~$58,000
• Cut in: 8 mph
• 10 kW at 31 mph
• 12 kW at 36 mph
• 5-year warranty

Skystream 3.7 (2.4 kW, 12-ft diameter)
• Web site: $12,000 to $18,000
• Bid for KDOT: $12,000• Controls and inverter
built into turbine head• Cut in: 8 mph• 2.4 kW at 29 mph• UL: 1.8 kW Continuous• 5-year warranty

Endurance S-343 (5.3 kW, 21-ft diameter)
• $47,500 on 105’ tilt- up tower
• 5.3 kW at 24.6 mph• Cut in: 6.7 mph• Cut out: 54 mph• Induction generator
(no inverter)• 5-year warranty

Example 1: Bergey Excel 10 kW; tax credit only; lower output
1. Total turbine and installation cost = $58,0002. 30% tax credit = $17,4003. Net project cost = $40,6004. Interest rate = 5.5%5. Loan term or equipment life = 20 years
(Number of years to recoup investment)6. From Table 1, cost recovery factor = 0.0837

Example 1 (Continued)
7. Estimated capacity factor = 25% (expected actual output compared to year-round operation at full output)
8. Multiply capacity factor times 8760 = equivalent 2,190 hours of full output.
9. Rated generating capacity = 10 kW10.Step 8 X Step 9 = 21,900 kWh11.Net cost X capital recovery factor =
$41,600 X 0.0837 = $3,398/year

Example 1 (Continued)12.Estimate maintenance cost at 1 ¢/kWh
= 21,900 X $0.01 = $219/year13.Total annual cost = amortization plus
maintenance = $3398 + $219 = $361714.Estimated operating cost = $3617 ÷
21,900 = $0.165/kWh15.Midwest Energy cost (net of fixed
monthly charges) = $0.08/kWh16.Year 1 savings = ($0.085/kWh)
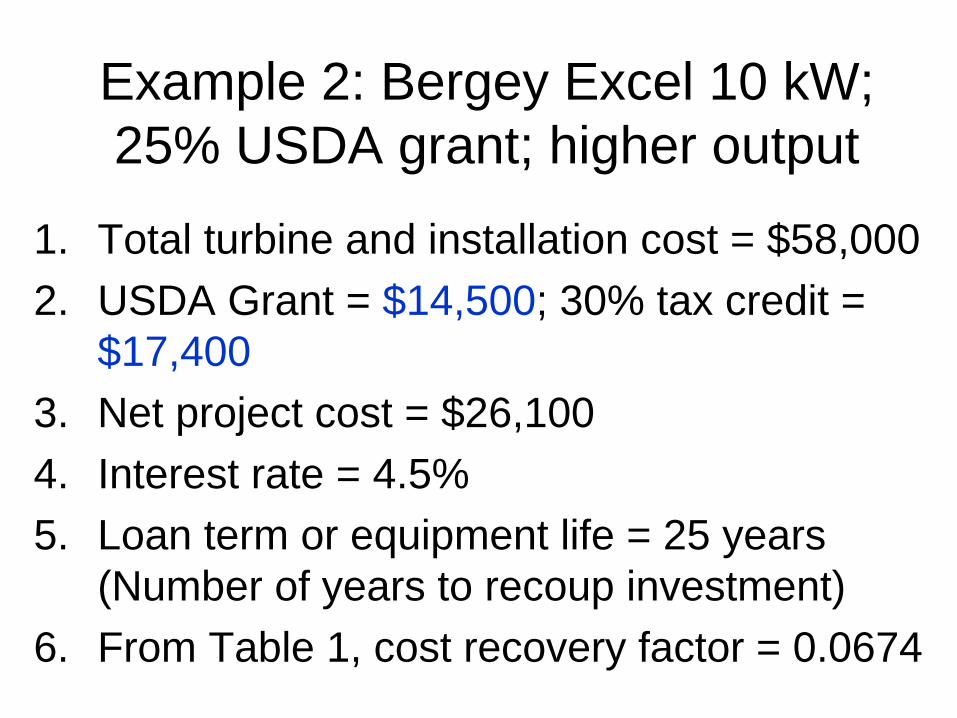
Example 2: Bergey Excel 10 kW; 25% USDA grant; higher output
1. Total turbine and installation cost = $58,0002. USDA Grant = $14,500; 30% tax credit =
$17,4003. Net project cost = $26,1004. Interest rate = 4.5%5. Loan term or equipment life = 25 years
(Number of years to recoup investment)6. From Table 1, cost recovery factor = 0.0674
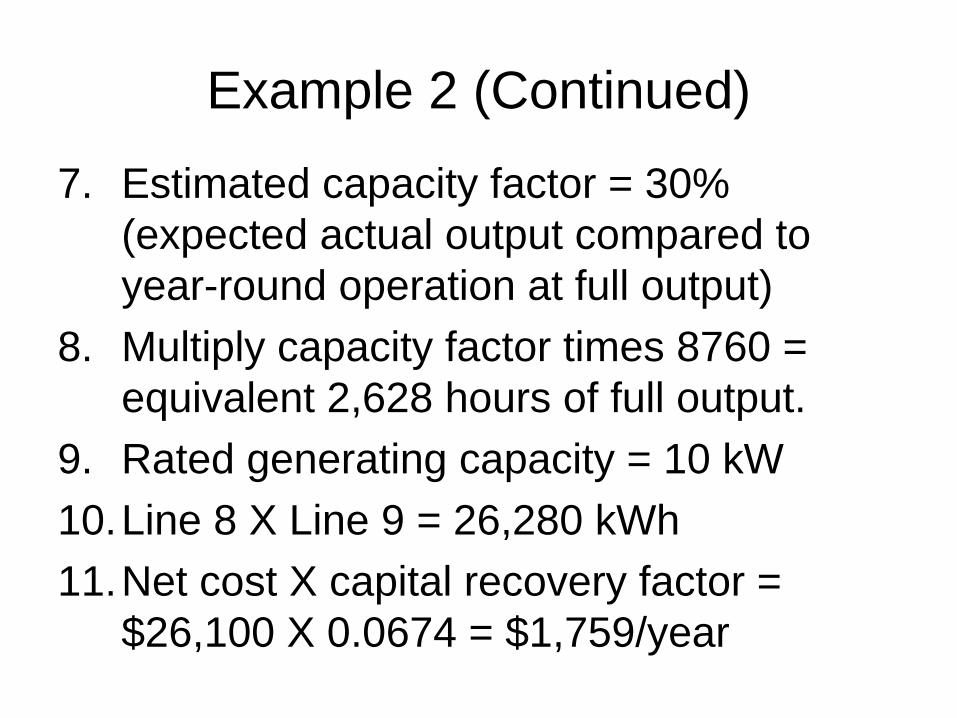
Example 2 (Continued)
7. Estimated capacity factor = 30% (expected actual output compared to year-round operation at full output)
8. Multiply capacity factor times 8760 = equivalent 2,628 hours of full output.
9. Rated generating capacity = 10 kW10.Line 8 X Line 9 = 26,280 kWh11.Net cost X capital recovery factor =
$26,100 X 0.0674 = $1,759/year

Example 2 (Continued)12.Estimate maintenance cost at 1 ¢/kWh
= 26,280 X $0.01 = $263/year13.Total annual cost = amortization plus
maintenance = $1,759 + $263 = $2,02214.Estimated operating cost = $2,022 ÷
26,280 = $0.077/kWh15.Midwest Energy cost (net of fixed
monthly charges) = $0.08/kWh16.Year 1 savings = $0.003/kWh
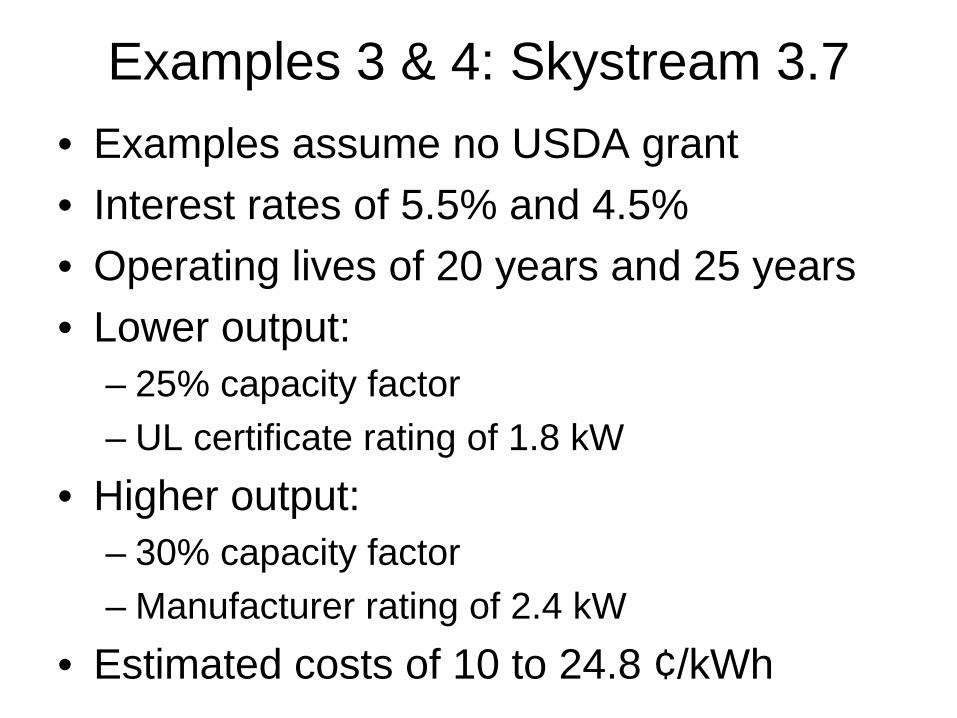
Examples 3 & 4: Skystream 3.7• Examples assume no USDA grant• Interest rates of 5.5% and 4.5%• Operating lives of 20 years and 25 years• Lower output:
– 25% capacity factor– UL certificate rating of 1.8 kW
• Higher output:– 30% capacity factor– Manufacturer rating of 2.4 kW
• Estimated costs of 10 to 24.8 ¢/kWh
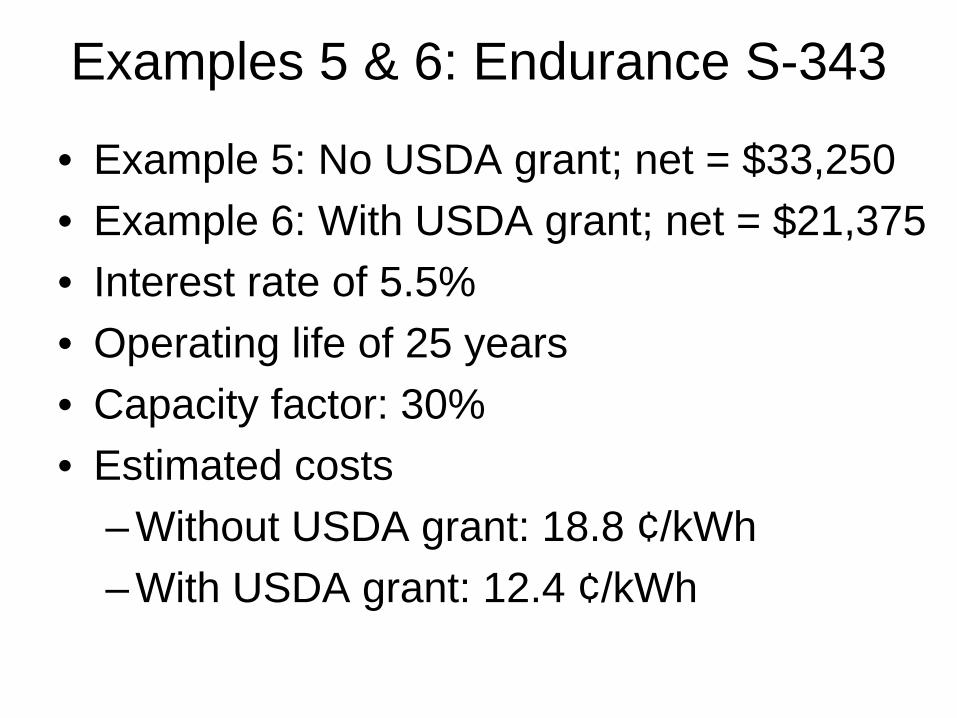
Examples 5 & 6: Endurance S-343
• Example 5: No USDA grant; net = $33,250• Example 6: With USDA grant; net = $21,375• Interest rate of 5.5%• Operating life of 25 years• Capacity factor: 30%• Estimated costs
– Without USDA grant: 18.8 ¢/kWh– With USDA grant: 12.4 ¢/kWh

Answer Sheet Reality Checks• Line 18: Capacity factor required to achieve
10 ¢/kWh cost of production – How does this compare to ~40% wind farm value?
• Lines 19 – 21: How many kWh does the NREL formula predict versus our Line 10 estimate?

Measured Capacity Factors
• Skystream 3.7 – 2 units with combined 599 days of operation; combined results =– 22% @ 1.8 kW UL rating– 16.5% @ 2.4 kW manufacturer’s rating
• 2 units in 50 kW to 150kW range– Combined 12 metered operating months– Monthly capacity factors range: 6.6% to 18.7%

So What Does This Mean? “It will pay for itself in “X” years!”
• Sample calculations assumed 20-25 yr life• If all assumptions are true, and calculated wind
cost/kWh = utility cost, then• Payback period will be the same 20-25 years!
To analyze shorter payback, recalculate the Capital Cost Recovery Worksheet beginning at Step 5 with fewer years. How does the new wind cost in Step 14 compare to the utility cost?

When Does the Tide Turn? Utility Cost Escalation vs. Wind Scenarios (See Answer Sheet)
0
5
10
15
20
25
30
2008
2010
2012
2014
2016
2018
2020
2022
2024
2026
2028
2030
2032
3% Escalation5% EscalationScenario 1Scenario 2Scenario 3Scenario 4
•Slow economy•New natural gas discoveries•Shift to higher customer charges•Transmission lines built to new markets
•Carbon taxes or cap-and-trade•Economic recovery or inflation•Increased use of natural gas

When Should I Jump In?
02468
1012141618
2008
2010
2012
2014
2016
2018
2020
2022
5% Escalation
Scenario 4Higher Cost for Wind
Savings from Wind
Tax Credit Expires 2016
This is NOT “breakeven” or “time to reach payback”.
Cumulative Positive Cash Flow Starts Here

How Complex Do You Want?1. Lifetime cash flow analysis – present value
– Requires estimate of total installed cost plus cost of lifetime repairs and maintenance
– Requires estimate of utility cost over turbine life
2. Cost of generation by turbine versus today’s utility rates (today’s method)
– Requires estimate of total installed cost plus cost of lifetime repairs and maintenance
– Uses known utility rates

Are Vendor Assumptions Valid?
$0.00$0.02$0.04$0.06$0.08$0.10$0.12$0.14$0.16$0.18
1988
1990
1992
1994
1996
1998
2000
2002
2004
2006
2008
2010
2012
2014
2016
Solid Blue = Actual History
Dashed Red = Vendor Sales Claim = 12.5%
per year
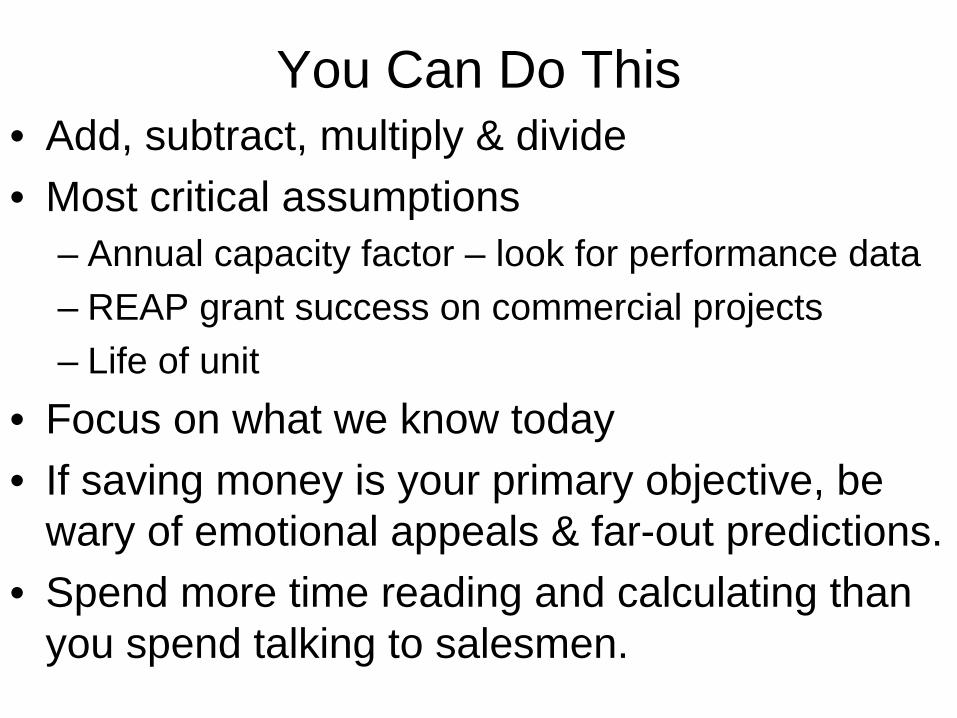
You Can Do This• Add, subtract, multiply & divide• Most critical assumptions
– Annual capacity factor – look for performance data– REAP grant success on commercial projects– Life of unit
• Focus on what we know today• If saving money is your primary objective, be
wary of emotional appeals & far-out predictions.• Spend more time reading and calculating than
you spend talking to salesmen.

Other Information Sources• Wind Energy Manual (Iowa Energy Center)
– www.energy.iastate.edu/Renewable/wind/wem- index.htm
• Connecting to the Grid (Interconnection Issues)– www.irecusa.org/fileadmin/user_upload/Connect
Docs/IC_Guide.pdf• Windustry www.windustry.com/ - Click on
“Small Wind Info”
Questions?
Patrick ParkeMidwest Energy, Inc.
Webinar Handouts:http://www.mwenergy.com/CustResources.aspx