small-scale spatial variation of the stress field in the...
TRANSCRIPT

2006) 249–267www.elsevier.com/locate/tecto
Tectonophysics 417 (
Small-scale spatial variation of the stress field in the back-arcAegean area: Results from the seismotectonic study of the
broader area of Mygdonia basin (N. Greece)
D.A. Vamvakaris ⁎, C.B. Papazachos, E.E. Karagianni,E.M. Scordilis, P.M. Hatzidimitriou
Geophysical Laboratory, School of Geology, Aristotle University of Thessaloniki, GR-54124, Thessaloniki, Greece
Received 25 February 2005; received in revised form 25 January 2006; accepted 27 January 2006Available online 24 March 2006
Abstract
In the present work a detailed seismotectonic study of the broader area of the Mygdonia basin (N. Greece) is performed. Digitaldata for earthquakes which occurred in the broader Mygdonia basin and were recorded by the permanent telemetric network of theGeophysical Laboratory of the Aristotle University of Thessaloniki during the period 1989–1999 were collected and fault planesolutions for 50 earthquakes which occurred in the study area were calculated with a modified first motions approach whichincorporates amplitude and radiation pattern information. Fault plane solutions for the 3 main shocks of Volvi (23/05/78, MW=5.8and 20/06/78, MW=6.5) and Arnaia (04/05/95, MW=5.8) events and the 1978 aftershock sequence were additionally used.Moreover, data from two local networks established in the Mygdonia basin were also incorporated in the final dataset.
Determination of the stress field was realized by the use of themethod of Gephart and Forsyth [Gephart, J.W., Forsyth, D.W., 1984.An improved method for determining the regional stress tensor using earthquake focal mechanism data: application to the SanFernando earthquake sequence: Jour. Geophys. Res., v.89, no. B11, p. 9305–9320] for the stress tensor inversion and the results werecompared with independent estimates based on the calculation of the average moment tensor [Papazachos, C.B.,Kiratzi, A.A., 1992.A formulation for reliable estimation of active crustal deformation and its application to central Greece. Geophys. J. Int. 111,424–432]. The obtained stress results show a relatively good agreement between the two approaches, with differences in the azimuthof the dominant extension axis of the order of 10°. Furthermore, comparison with independent information for the mean stress axesprovided by the study of kinematics on neotectonic faults [Mountrakis, D., Kilias, A., Tranos, M., Thomaidou, E., Papazachos, C.,Karakaisis, G., Scordilis, E., Chatzidimitriou, P., Papadimitriou, E., Vargemezis, G., Aidona, E., Karagianni, E., Vamvakaris, D.Skarlatoudis, A. 2003. Determination of the settings and the seismotectonic behavior of the main seismic-active faults of NorthernGreece area using neotectonic and seismological data. Earthquake Planning and Protection Organisation (OASP) (in Greek)] showsa similar agreement with typical misfit of the order 10°. The stress inversion method was modified in order to select one or both nodalplanes of the focal mechanism which corresponds to the “true” fault plane of the occurred earthquakes and was able to select a singlefault plane in the majority of examined cases. Using this approach, the obtained fault plane rose diagrams are in agreement withresults from various neotectonic studies. Moreover, several secondary active fault branches were identified, which are still not clearlyobserved in the field.© 2006 Elsevier B.V. All rights reserved.
Keywords: Mygdonia basin; Back-arc extension; Stress tensor inversion; Fault plane solutions
⁎ Corresponding author. Geophysical Laboratory, P.O. Box 352-1, Aristotle University of Thessaloniki, GR-54124. Tel.: +30 2310 998527.
E-mail address: [email protected] (D.A. Vamvakaris).0040-1951/$ - see front matter © 2006 Elsevier B.V. All rights reserved.doi:10.1016/j.tecto.2006.01.007

250 D.A. Vamvakaris et al. / Tectonophysics 417 (2006) 249–267
1. Introduction
Fault plane solutions constitute an importantelement in seismological research and a basic toolfor the stress field study. Several researchers (Etch-ecopar et al., 1981; Angelier et al., 1981, 1982; Armijoet al., 1982; Gephart and Forsyth, 1984; Gephart,1990a,b; Papazachos and Kiratzi, 1992; Loohuis andvan Eck, 1996) have developed methods that canemploy fault plane solutions to calculate the stresstensor describing the local stress field in a study area.In the present work, the stress tensor inversion methodof Gephart and Forsyth (1984) was used, using faultplane solutions for the Mygdonia basin area. A largenumber of publications which were based on thismethod, using earthquake sequences, have beenproposed for different seismotectonic regions, suchas Neri and Wyss (1993) (Tyrrhenian region — Italy);Horiuchi et al. (1995) (Nagano area — Japan);Caccamo et al. (1996) (western Sicily area — S.Italy); Cocina et al. (1997, 1998) (Mt. Etna — S.Italy); Eva and Solarino (1998) (western Alpine arc);Kiratzi (1999) (Kozani–Grevena area — C. Greece);
Fig. 1. Map of known earthquakes with MW≥3.0 which occurred in the broatill 2002. Black circles denote the epicenters of earthquakes with Mw≥Servomacedonian massif (shadowed area) and the North Aegean Trough. Th
Frepoli and Amato (2000) (Italy); Hinzen (2003)(Northern Rhine area, Central Europe).
The area examined in the present study is theMygdoniabasin, which is located in Northern Greece (CentralMacedonia). Its pre-alpine and alpine basement belongsto the Servomacedonian massif and the Circum RhodopeBelt Thrust System. Above this basement extensive NW–SE and E–W trending continental-type basins and grabenshave been filled with Neogene and Quaternary sediments.They were developed by a Miocene to present extensivebrittle extensional deformation that is mainly related tohigh-angle normal faults (Pavlidis and Kilias, 1987).Among these basins the E–W trending Mygdonia grabenand its precedingNW–SEPre-Mygdonia basin is located atthe center of the Servomacedonian massif (Fig. 1). Thebasin has a characteristic S-shape with its edges trending inaNW–SE direction, while the central part is approximatelyE–W oriented. Moreover, the active tectonics, thedeformation and seismicity of the broader area ofMygdonia basin have been studied in detail using bothseismological and neotectonic observations (Scordilis,1985; Pavlides, 1996; Martinod et al., 1997; Papazachoset al., 2001; Vamvakaris et al., 2003).
der area of central–northern Greece from the historical times (550 BC)6.5. A significant concentration of epicenters is identified in thee dashed line delineates the limits of the study area.

251D.A. Vamvakaris et al. / Tectonophysics 417 (2006) 249–267
In the present work, seismological data from differentsources were used in order to create a complete databaseof focal mechanisms for earthquakes which occurred inthe broader Mygdonia basin area. Additional fault planesolutions for the last decade are computed using localand regional recordings of the permanent seismologicalnetwork of the area. This dataset is employed for thedetermination of the main seismotectonic characteristicsand the spatial variation of the stress field in the studyarea.
2. Seismotectonic setting
The seismicity of the Servomacedonian massif whichextends from the FYROM-Bulgaria border up to theNorth Aegean Trough is the highest in N. Greece withevents up to MW=7.6 (Scordilis, 1985). A large portionof this seismic activity is located in the Mygdonia basinand its continuation towards the Ierissos bay area, whichis one of the most active seismogenic regions in theback-arc Aegean area. This central section is the mostseismically active and has received a lot of scientificattention since the occurrence of the MW=6.5 main-shock of June 20, 1978, which was the first major eventin Greece with significant impact on a modern urbancenter such as the city of Thessaloniki (Papazachos etal., 1979a,b; Pavlidis and Kilias, 1987; Pavlides et al.,1988; Hatzidimitriou et al., 1991). This intense seismicactivity is directly related to the extensional deformationwhich is in effect from Miocene to present. In Fig. 1 allthe known earthquakes with M≥3.0 which occurredfrom the historical times (550 BC) up to the present arepresented for the Central–Northern part of Greece.Except from the SE part of the area where the highseismicity level is associated with the N. Aegean Troughwhich is the continuation of the North Anatolia Fault inthe Aegean, seismic activity of the continental central–northern Greece is mostly located in the Servomacedo-nian massive (shadowed area) with a significantconcentration in the broader Mygdonia basin. Eightstrong earthquakes with M≥6.5 have occurred in theServomacedonian massif during the 20th century, thestrongest in Cresna (SW Bulgaria,M=7.6, 1904) and inAgion Oros (M=7.4, 1906). In the Mygdonia basin,seven strong events (6.0≤M≤7.0) are known from thehistorical times to the present (Fig. 1, data fromPapazachos and Papazachou (1997)). During the 20thcentury two destructive earthquakes occurred in thebroader area of Thessaloniki along the E–W Mygdoniagraben (Assiros, 5/7/1902, MW=6.5 and Stivos, 20/6/1978, MW=6.5). The 1978 Thessaloniki (Stivos)earthquake sequence comprises of the larger foreshock
on May 23 (MW=5.3), the mainshock on June 20(MW=6.5) and the larger aftershock on July 4(MW=5.0). On May 4, 1995 a strong event with magni-tude MW=5.8 occurred in the SE part of the basin(Arnaia). Most recently, intense seismic activity close tothe city of Thessaloniki occurred in the summer of 1999with the largest event ofM=3.7 on June 29 (Papazachoset al., 2000).
The faulting pattern of the broader area is compli-cated and includes NE–SW, E–Wand SE–NW strikingfaults, where the E–W trending faults are the mostactive ones related with the current seismic activity. Themajor faults are presented in Fig. 2 and summarisedbelow.
2.1. E–W striking faults
These faults with a general E–W direction present alocal variability from ENE–WSW to ESE–WNW,suggesting integration with pre-existing faulting zones.The most important faulting zone in the CentralMacedonia area is the one of Volvi, which determinesthe south part of the Mygdonia graben. Severalhistorical earthquakes have occurred along this zone(Papazachos and Papazachou, 1997) and many of itsbranches are clearly related with the seismic sequence of1978 (Papazachos et al., 1979a,b). Many of the knownactive faults can be included in the 70 km long Volvifault zone, such as (see Fig. 2) the Asvestochori–Polichni fault (A–P), Thessaloniki–Gerakarou fault(T–G), Gerakarou–Nikomidino–Stivos–Peristeronasfault (G–N–S–P) and Loutra Volvis–Nea Appoloniafault (V–NA) (Tranos et al., 2003). Finally, theAnthemountas faulting zone (Anth), located in thesouthern part of the study area, has an E–W to ESE–WNW strike, is dipping to the north and has a length ofabout 40 km (Mountrakis et al., 1996, 1997).
2.2. SE–NW striking faults
Faults with SE–NW direction have a significantcontribution to the topography of the large neotectonicbasins which are found in the Central Macedonia area (i.e.Langadas basin). Specifically, the Assiros–Analipsi–Scholari faulting zone (As–An–Sc) is a zone of totallength of 30 km on the south-eastern boundaries ofLangadas graben. A brunch of this zone was activatedduring the occurrence of the 1978 Thessaloniki earthquake(Papazachos et al., 1979a; Mountrakis et al., 1983). TheLiti–Lagina–Ag. Vassilios fault (L–L–AgV) is a SE–NWstriking fault continuing for 20 km towards the east, as anextension of the WSW striking G–N–S–P fault.

252 D.A. Vamvakaris et al. / Tectonophysics 417 (2006) 249–267
2.3. NE–SW striking faults
NE–SW striking faults are not clearly recognized inthe Mygdonia basin. Topography and geomorphologi-cal features (Tranos et al., 2004) give a strong indicationfor the existence of faults having this direction. How-ever, the Neogene–Quarternary sedimentary depositscover such faults so that they have no clear surfaceexpression.
3. Applied method
3.1. Estimation of fault plane solutions
Focal mechanisms can provide useful informationabout the structure and kinematics of faults, describing atthe same time the dominant crustal stress field in whichan earthquake occurs. The FPFIT program (Reasenbergand Oppenheimer, 1985) is one of the most often usedapproaches to calculate the fault plane solutions, usingthe P-wave first motion polarities from short-period data.A modified version of this program (Vamvakaris et al.,
Fig. 2. Epicenters for the 182 earthquakes used in the present work and main fet al. (2003).
2004) was used in order to obtain improved results forthe calculation of the fault plane solutions. In compar-ison to the original version of FPFIT the modified ap-proach takes also into account the radiation pattern of SVand SH waves. For each earthquake the horizontal andvertical components of each station were used and thefirst arrivals of P and S waves were picked. Using themaximum peak-to-peak amplitude of P and S waves theratio Pmax / (SN
2max+SE
2max)
1 / 2 was estimated, whereSNmax and SEmax are the maximum amplitudes of thetwo horizontal components (N–S, E–W) for the Swavesand Pmax is the maximum amplitude of the vertical onefor the P-waves. This ratio for the observed data, as wellas the corresponding ratio Prad / (SH
2rad+SV
2rad)
1 / 2 ofthe synthetic data was used as a weight for thedetermination of the observed and theoretical P-wavepolarities, respectively (Vamvakaris et al., 2004). Testswith synthetic and real data showed that this modifiedapproach results in the minimization of the derivation ofmultiple solutions, as well as of the uncertainties in thelocation of P and T axes of the determined fault planesolutions, similar to the other methods which employ
aulting zones (explanation in text) in the study area according to Tranos

253D.A. Vamvakaris et al. / Tectonophysics 417 (2006) 249–267
amplitude information (e.g. Hardebeck and Shearer,2003). We should point out that in those cases that nohorizontal components were available (only verticalseismometer available, less that 1 /3 of stations in ourcase) since theP /S ratio can not be estimated, the appliedsoftware was adapted in order to use only the availablepolarities of the first arrivals.
3.2. Stress tensor inversion
Several researchers have worked on the problem ofthe determination of a stress tensor related with a singlefault using field observations. Based on the work of Bott(1959), McKenzie (1969) and Angelier et al. (1982)studied the general case where a random discontinuitycould act as a fault, whose movement depends on asimple stress tensor. The principal constraint on thestress tensor in these analyses is that the shear stressdirection on any fault plane must coincide with theobserved slip direction in both orientation and sign. Inthe simplest case it is assumed that all slip events reflecta common stress field. Gephart (1990a,b) reviewed theprinciples of this analysis and described a straightfor-ward procedure for estimating stresses from groups offault geometries, defined as fault planes with associatedslip directions.
In the present work the method of Gephart andForsyth (1984) was applied for inverting earthquakefocal mechanism data to obtain the local stress field. Inthis method the orientation of fault planes and slipdirections provided by a large population of earthquakefocal mechanisms can be used to determine best fitregional principal stress directions and the parameterR=(σ2−σ1) / (σ3−σ1), which specifies the magnitudeof the intermediate σ2 compressive stress direction,relative to maximum σ1 and minimum σ3 compressivestress directions, under the assumption of uniform stressin the source region. The analysis allows for the pos-sibility that the failure occurs on pre-existing zones ofweakness of any orientation. The computer programFMSI (Gephart, 1990b) inverts observations of slipdirections on fault planes of known orientation in orderto determine the best-fitting four-parameter stresstensor, defined by the three principal stress directionsand the parameter R, as well the associated uncertainty.The definition of the best-fitting model and its iden-tification are two important aspects of the method. Themisfit between fault-plane solution observations and aspecific stress model is defined as a rotation of thecombined fault plane/slip vector that achieves an orient-ation for which the observed and predicted slip direc-tions on the fault plane are aligned. The best model is the
one that minimizes the sum of these values for all data,which predicts faults geometries that most closely matchthe observed ones. A grid search of stress models ratherthan a linearization scheme is used and a realistic erroranalysis can be performed in order to establish con-fidence limits for the preferred regional stresses. Themethod can be used to investigate possible stress in-homogeneities during earthquake sequences or a small-scale spatial variation of the stress field.
To confirm the reliability of the results produced bythe use of the stress tensor inversion we also applied ano-ther method proposed by Papazachos and Kiratzi (1992)based on the calculation of a representative “averagefocal mechanism tensor”. According to this method, forthe determination of the stress field the average “focalmechanism” tensor is calculated. This tensor is definedby the released moment Mo and a tensor F which is afunction of the strike, ζ, dip, δ, and rake, λ of the cor-responding fault plane (Aki and Richards, 1980), asshown by the equation:
Mn ¼ Mn0 d F
nðn; d; kÞ
From this equation, an average “focal mechanismtensor”,F̄, representing the deformation pattern of thearea, is estimated by the relation proposed by Papa-zachos and Kiratzi (1992),
F̄ ¼
XN
n¼1
Fn
N
According to the method, the eigenvalues of F̄correspond to the average P, T and N (null) axes of thelocal stress tensor. Therefore, the method allows thedefinition of an “average” kinematic (P, T and N) axiswhich is assumed to be identical with the principal stressaxes. It is clear that in areas where pre-existing struc-tures and complicated faulting dominates, deviationsfrom this assumption will lead to a systematic differenceof the stress axes obtained by this method in comparisonwith the method of Gephart and Forsyth (1984), whichcan be efficiently applied in such environments. How-ever, the additional application of this method allows: a)to obtain an independent stress field estimation andperform a comparison with the results obtained by themethod of Gephart and Forsyth (1984) in order toindirectly assess if such a complicated geotectonic set-tings exists for the study area and, b) to allow thedetermination of a starting stress field estimate, which isnecessary for the parametric search of the Gephart andForsyth (1984) method.

254 D.A. Vamvakaris et al. / Tectonophysics 417 (2006) 249–267
4. Data used
The data used for this study come from theSeismological Station of the Aristotle University ofThessaloniki and contain information about earth-quakes recorded by the permanent telemetric networkof the Geophysical Lab consists of 17 stations es-tablished mainly in N. Greece. Most of these stations(13 out of 17) are equipped with three-componentshort-period seismometers and only 4 with single ver-tical short-period seismometers, using a sampling fre-quency of 50 Hz. More than 473,000 waveforms inSAC format were obtained for 14,856 earthquakeswhich occurred in the broader Greek area during theyears 1989–1999.
Using this source database 50 earthquakes with epi-centers bounded by 22.85° E–23.70° E and 40.44°N–40.80° N (corresponding to the Mygdonia basin)were selected. This selection was made for events withmagnitude MW≥3.0, which mainly exhibit a good sig-nal to noise ratio and for which we were able to obtainreliable fault plane solutions, presented in Table 1. Theaverage number of first motion polarities used for these50 events was 9 (see column “FM” of Table 1) and theaverage horizontal uncertainty in the epicenter location(ERH) was of the order of 0.6 km. Note that the use ofthe radiation amplitude information for the FPS deter-mination allows to obtain good quality fault planesolutions (Vamvakaris et al., 2004), even if the numberof polarities is not as large as usually required in stan-dard first motion regional studies. Furthermore, allstudied events are at the center of the monitoring per-manent network, hence the azimuthal coverage used forthe fault plane solution determination was very good forall examined events. The analysis of the data was per-formed using the Seismic Analysis Code-SAC (Tull,1987; Tapley and Tull, 1992; Goldstein and Minner,1995).
Existing seismological data were also used for thecalculation of the stress field and the determination ofthe final seismotectonic model for the whole area.Due to their importance, 3 strong earthquakes of 1978in Volvi with magnitude MW=5.8, 6.5 (Papazachosand Papazachou, 1997) and MW=5.3, respectively(HARVARD CMT), and one which occurred in Arnaiaat 1995 with MW=5.8 (Papazachos and Papazachou,1997) were added to our dataset. Parameters for theseimportant earthquakes that occurred in the study areaare also presented in Table 1.
Furthermore, we have also used the aftershocks ofthe 1978 seismic sequence. Since most of them hadsimilar characteristics, they were grouped in 24 sets of
events with common parameters an4d an averageepicenter at the center of each cluster (Soufleris et al.,1983). Also, our dataset was enriched with 63 smallmagnitude earthquakes (MLb3.0) which occurred in theMygdonia basin in the spring of 1984 and 1985 andwere recorded by a local network (Christodoulou, 1986;Hatzfeld et al., 1987). Finally, 41 earthquakes whichoccurred during the period July 2001–April 2002 wereused, as they were recorded by a local network esta-blished to observe the microseismic activity in this area(Paradeisopoulou et al., 2004). These events correspondto the seismic sequence of October 8, 2001 with amainshock with ML=4.5 (Table 1). The epicenters ofthese events are mostly located in a narrow area in thesouthern border of the Langadas Lake with an averageepicentral error of approximately 1.0 km. The epicentersof the 182 earthquakes finally used in this work arepresented in Fig. 2.
It is interesting to notice that the average error for thedip/strike/rake of the 50 fault plane solutions determinedin the present work is of the order of 7°, 10° and 11°,respectively, while the corresponding errors of theprincipal kinematic axes (P, T and N) is of the sameorder (∼10°). Although the fault plane solutions for the1978 aftershock sequence and the other local experi-ments (1984–85 and 2001–2002) were determinedusing a standard first motion approach, the dense tem-porary networks employed resulted in similar magnitude(∼10–15°) of the corresponding axes errors (Soufleris etal., 1983; Christodoulou, 1986; Hatzfeld et al., 1987;Paradeisopoulou et al., 2004). Finally for the 4 strongershocks, the corresponding fault plane solutions havebeen determined by waveform modeling, as well as byadditional seismological and field information, hencethe corresponding errors of the geometrical character-istics of the stress axes should be of the same order oreven smaller. Therefore, despite the fact that the faultplane solutions form a quite heterogeneous dataset, thecorresponding errors of the individual should beconsidered of the order of 10° or slightly larger.
5. Estimation of stress field
In order to estimate the stress field in the Mygdoniabasin by the use of seismological data, we haveseparated the region in smaller areas with commonseismotectonic characteristics and a relative homogene-ity of stresses, so that the results can be considered aslocally representative. This zonation was performedtaking into account the information provided by theneotectonic rupture zones (Tranos et al., 2003)which are possibly related with the stress field, the
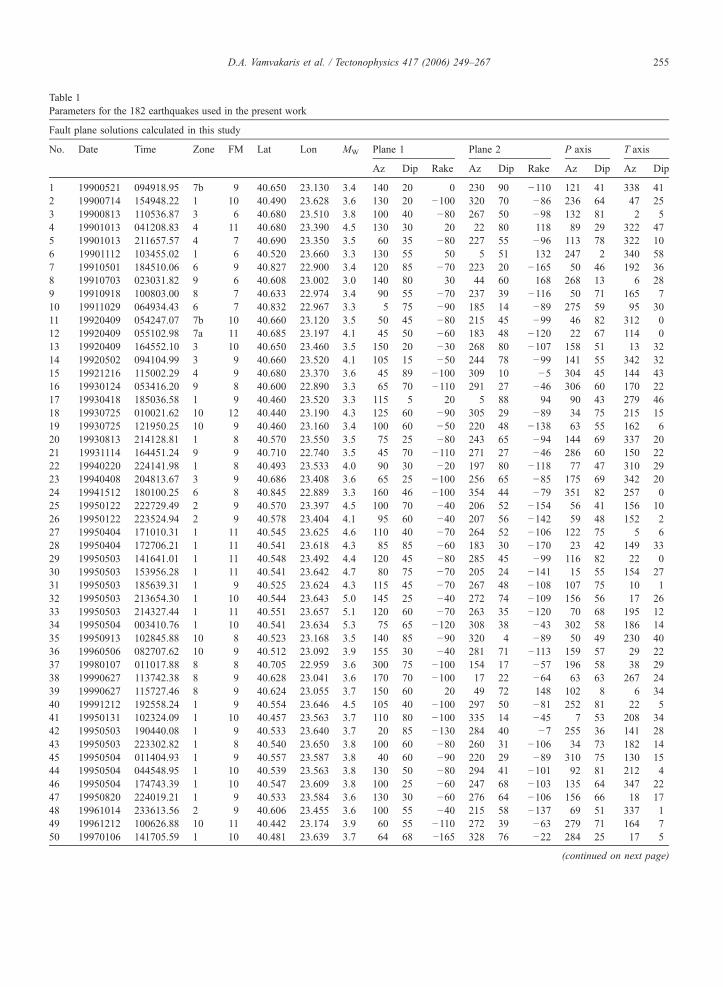
Table 1Parameters for the 182 earthquakes used in the present work
Fault plane solutions calculated in this study
No. Date Time Zone FM Lat Lon MW Plane 1 Plane 2 P axis T axis
Az Dip Rake Az Dip Rake Az Dip Az Dip
1 19900521 094918.95 7b 9 40.650 23.130 3.4 140 20 0 230 90 −110 121 41 338 412 19900714 154948.22 1 10 40.490 23.628 3.6 130 20 −100 320 70 −86 236 64 47 253 19900813 110536.87 3 6 40.680 23.510 3.8 100 40 −80 267 50 −98 132 81 2 54 19901013 041208.83 4 11 40.680 23.390 4.5 130 30 20 22 80 118 89 29 322 475 19901013 211657.57 4 7 40.690 23.350 3.5 60 35 −80 227 55 −96 113 78 322 106 19901112 103455.02 1 6 40.520 23.660 3.3 130 55 50 5 51 132 247 2 340 587 19910501 184510.06 6 9 40.827 22.900 3.4 120 85 −70 223 20 −165 50 46 192 368 19910703 023031.82 9 6 40.608 23.002 3.0 140 80 30 44 60 168 268 13 6 289 19910918 100803.00 8 7 40.633 22.974 3.4 90 55 −70 237 39 −116 50 71 165 710 19911029 064934.43 6 7 40.832 22.967 3.3 5 75 −90 185 14 −89 275 59 95 3011 19920409 054247.07 7b 10 40.660 23.120 3.5 50 45 −80 215 45 −99 46 82 312 012 19920409 055102.98 7a 11 40.685 23.197 4.1 45 50 −60 183 48 −120 22 67 114 013 19920409 164552.10 3 10 40.650 23.460 3.5 150 20 −30 268 80 −107 158 51 13 3214 19920502 094104.99 3 9 40.660 23.520 4.1 105 15 −50 244 78 −99 141 55 342 3215 19921216 115002.29 4 9 40.680 23.370 3.6 45 89 −100 309 10 −5 304 45 144 4316 19930124 053416.20 9 8 40.600 22.890 3.3 65 70 −110 291 27 −46 306 60 170 2217 19930418 185036.58 1 9 40.460 23.520 3.3 115 5 20 5 88 94 90 43 279 4618 19930725 010021.62 10 12 40.440 23.190 4.3 125 60 −90 305 29 −89 34 75 215 1519 19930725 121950.25 10 9 40.460 23.160 3.4 100 60 −50 220 48 −138 63 55 162 620 19930813 214128.81 1 8 40.570 23.550 3.5 75 25 −80 243 65 −94 144 69 337 2021 19931114 164451.24 9 9 40.710 22.740 3.5 45 70 −110 271 27 −46 286 60 150 2222 19940220 224141.98 1 8 40.493 23.533 4.0 90 30 −20 197 80 −118 77 47 310 2923 19940408 204813.67 3 9 40.686 23.408 3.6 65 25 −100 256 65 −85 175 69 342 2024 19941512 180100.25 6 8 40.845 22.889 3.3 160 46 −100 354 44 −79 351 82 257 025 19950122 222729.49 2 9 40.570 23.397 4.5 100 70 −40 206 52 −154 56 41 156 1026 19950122 223524.94 2 9 40.578 23.404 4.1 95 60 −40 207 56 −142 59 48 152 227 19950404 171010.31 1 11 40.545 23.625 4.6 110 40 −70 264 52 −106 122 75 5 628 19950404 172706.21 1 11 40.541 23.618 4.3 85 85 −60 183 30 −170 23 42 149 3329 19950503 141641.01 1 11 40.548 23.492 4.4 120 45 −80 285 45 −99 116 82 22 030 19950503 153956.28 1 11 40.541 23.642 4.7 80 75 −70 205 24 −141 15 55 154 2731 19950503 185639.31 1 9 40.525 23.624 4.3 115 45 −70 267 48 −108 107 75 10 132 19950503 213654.30 1 10 40.544 23.643 5.0 145 25 −40 272 74 −109 156 56 17 2633 19950503 214327.44 1 11 40.551 23.657 5.1 120 60 −70 263 35 −120 70 68 195 1234 19950504 003410.76 1 10 40.541 23.634 5.3 75 65 −120 308 38 −43 302 58 186 1435 19950913 102845.88 10 8 40.523 23.168 3.5 140 85 −90 320 4 −89 50 49 230 4036 19960506 082707.62 10 9 40.512 23.092 3.9 155 30 −40 281 71 −113 159 57 29 2237 19980107 011017.88 8 8 40.705 22.959 3.6 300 75 −100 154 17 −57 196 58 38 2938 19990627 113742.38 8 9 40.628 23.041 3.6 170 70 −100 17 22 −64 63 63 267 2439 19990627 115727.46 8 9 40.624 23.055 3.7 150 60 20 49 72 148 102 8 6 3440 19991212 192558.24 1 9 40.554 23.646 4.5 105 40 −100 297 50 −81 252 81 22 541 19950131 102324.09 1 10 40.457 23.563 3.7 110 80 −100 335 14 −45 7 53 208 3442 19950503 190440.08 1 9 40.533 23.640 3.7 20 85 −130 284 40 −7 255 36 141 2843 19950503 223302.82 1 8 40.540 23.650 3.8 100 60 −80 260 31 −106 34 73 182 1445 19950504 011404.93 1 9 40.557 23.587 3.8 40 60 −90 220 29 −89 310 75 130 1544 19950504 044548.95 1 10 40.539 23.563 3.8 130 50 −80 294 41 −101 92 81 212 446 19950504 174743.39 1 10 40.547 23.609 3.8 100 25 −60 247 68 −103 135 64 347 2247 19950820 224019.21 1 9 40.533 23.584 3.6 130 30 −60 276 64 −106 156 66 18 1748 19961014 233613.56 2 9 40.606 23.455 3.6 100 55 −40 215 58 −137 69 51 337 149 19961212 100626.88 10 11 40.442 23.174 3.9 60 55 −110 272 39 −63 279 71 164 750 19970106 141705.59 1 10 40.481 23.639 3.7 64 68 −165 328 76 −22 284 25 17 5
(continued on next page)
255D.A. Vamvakaris et al. / Tectonophysics 417 (2006) 249–267

Main earthquakes in the study area (data from Papazachos and Papazachou (1997))
No. Date Time Zone Lat Lon Mw Plane 1 P axis T axis
Az Dip Rake Az Dip Az Dip
1 19780523 23:34:11 4 40.680 23.340 5.8 76 50 −95 308 83 170 52 19780620 20:03:21 4 40.610 23.270 6.5 70 48 −109 267 75 174 13 19950504 00:34:11 1 40.541 23.634 5.8 131 60 −58 90 61 199 10
Main earthquake in the study area (data from Harvard, http://www.seismology.harvard.edu/)
1 19780619 23:31:08 4 40.706 23.260 5.3 69 50 −111 275 73 174 3
Fault plane solutions based on earthquakes recorded on a local network (Paradeisopoulou et al., 2004)
No. Date Time Zone Lat Lon ML Plane 1 P axis T axis
Az Dip Rake Az Dip Az Dip
1 20010810 21:49:39 4 40.673 23.376 3.7 102 60 −74 48 70 180 142 20010811 18:44:49 3 40.662 23.435 3.1 128 52 −30 38 64 218 263 20010821 06:01:22 7a 40.720 23.125 2.3 132 58 −30 98 42 4 44 20010903 10:04:16 7b 40.679 23.080 2.3 132 56 −30 42 62 222 285 20010915 17:47:13 6 40.813 22.995 2.7 130 48 −35 142 52 357 336 20010915 20:09:52 6 40.816 23.001 2.4 132 44 −30 111 49 3 157 20010928 21:06:37 8 40.657 22.991 2.0 114 60 −44 78 51 173 48 20011008 04:50:21 9 40.596 23.116 4.5 70 34 −124 20 65 200 259 20011008 05:25:31 9 40.597 23.143 2.5 110 50 −98 258 68 6 710 20011008 05:26:44 9 40.593 23.116 4.1 74 42 −122 323 72 181 1411 20011008 05:28:44 9 40.595 23.164 2.6 82 60 −102 360 72 180 1812 20011008 05:29:28 9 40.589 23.145 3.4 90 36 −100 302 70 195 613 20011008 05:32:16 9 40.589 23.126 3.9 88 54 −114 247 69 355 714 20011008 05:36:20 9 40.588 23.148 3.1 64 42 −120 260 69 166 215 20011008 06:52:48 9 40.593 23.124 3.3 56 50 −118 360 67 180 2316 20011008 06:55:29 9 40.599 23.111 3.2 90 46 −104 20 67 200 2317 20011008 07:04:27 9 40.588 23.133 3.0 110 46 −58 335 81 200 718 20011008 07:15:19 9 40.588 23.134 3.0 104 52 −98 346 60 166 3019 20011008 07:16:09 9 40.593 23.128 2.9 76 60 −104 6 71 186 1920 20011008 07:25:54 9 40.591 23.125 2.9 96 38 −92 308 67 206 521 20011008 07:26:32 9 40.596 23.117 2.8 96 54 −118 352 60 172 3022 20011008 08:00:25 9 40.590 23.126 3.6 82 60 −112 307 81 187 523 20011008 08:21:26 9 40.595 23.128 2.9 96 50 −100 20 72 200 1824 20011008 13:47:57 9 40.600 23.124 2.1 110 36 −90 322 79 199 625 20011008 13:49:19 9 40.596 23.123 2.1 100 52 −102 360 70 180 2026 20011008 19:00:28 9 40.593 23.134 1.6 90 40 −106 360 70 180 2027 20011009 06:59:05 9 40.597 23.169 2.7 90 40 −108 20 71 200 1928 20011011 16:31:46 9 40.584 23.152 3.0 110 38 −80 301 53 211 129 20011014 09:06:00 1 40.555 23.582 2.7 90 56 −136 20 69 200 2130 20011125 20:09:46 9 40.590 23.183 2.4 110 42 −90 126 51 7 2131 20011204 17:03:51 8 40.693 22.956 2.1 138 36 −30 36 66 147 1032 20011214 22:39:00 6 40.791 23.018 2.1 132 40 −30 156 52 11 3333 20020117 06:35:56 6 40.781 22.945 2.2 148 20 −30 240 78 12 834 20020224 21:50:00 9 40.575 23.257 2.3 106 60 −62 271 57 170 735 20020318 10:42:02 9 40.609 23.005 1.5 100 24 −98 69 57 170 736 20020413 08:10:41 7a 40.702 23.132 3.0 106 60 −52 343 73 195 1437 20020413 08:13:34 7a 40.707 23.133 3.0 98 60 −100 71 60 176 938 20020413 13:52:41 7a 40.710 23.127 2.2 110 60 −56 16 60 196 3039 20020413 17:46:06 7a 40.699 23.139 2.3 128 60 −30 76 48 169 240 20020413 21:06:01 7a 40.706 23.126 1.7 112 60 −40 89 47 180 141 20020416 11:11:39 7a 40.682 23.169 2.7 124 60 −38 237 66 4 15
Table 1 (continued)
256 D.A. Vamvakaris et al. / Tectonophysics 417 (2006) 249–267

Fault plane solutions from local networks (Christodoulou, 1986; Hatzfeld et al., 1987; Hatzidimitriou et al., 1991)
No. Date Time Zone Lat Lon ML Plane 1 Plane 2 P axis T axis
Az Dip Rake Az Dip Rake Az Dip Az Dip
1 840316 06:01 4 40.730 23.290 0.5 16 45 48 248 58 124 315 7 212 612 840316 07:22 4 40.730 23.290 0.5 8 50 34 254 64 134 314 9 214 503 840316 15:09 5 40.750 23.190 0.6 78 50 −139 320 60 −46 283 53 21 64 840316 19:58 4 40.730 23.290 0.5 17 50 26 270 71 137 328 13 225 445 840317 13:56 4 40.740 23.290 0.3 14 50 45 251 58 130 314 4 217 576 840317 18:12 4 40.720 23.320 0.3 288 78 4 197 86 168 243 6 152 117 840323 01:14 4 40.700 23.380 0.2 275 44 −85 90 46 −92 294 87 182 18 840323 10:24 3 40.650 23.440 1.2 286 40 −62 72 55 −110 291 71 177 89 840323 10:40 4 40.730 23.290 0.7 225 50 154 332 70 43 94 12 196 4410 840323 10:42 3 40.650 23.450 0.2 64 45 −119 284 52 −62 255 69 355 411 840323 13:02 4 40.730 23.290 0.5 1 48 24 255 73 136 313 15 208 4312 840324 17:08 3 40.640 23.400 0.8 7 56 −35 120 60 −140 335 48 243 213 840328 13:59 4 40.740 23.290 2.1 39 40 −127 264 60 −62 222 64 335 1114 840328 18:05 3 40.640 23.430 1.5 285 44 −58 66 54 −115 278 68 174 515 840328 21:21 3 40.630 23.430 1.8 283 45 −71 79 48 −106 278 77 181 216 840329 15:41 8 40.620 23.030 2.3 88 39 −135 321 64 −59 275 59 29 1417 840329 17:25 1 40.560 23.560 1.9 52 60 150 158 65 34 284 3 16 4118 840330 12:39 4 40.720 23.280 1.1 139 38 −32 255 70 −123 125 52 10 1919 840331 09:16 4 40.740 23.310 3.0 57 36 −122 276 60 −67 228 67 350 1320 840331 13:32 3 40.650 23.570 2.4 250 43 −53 25 56 −118 241 65 135 721 840401 04:07 4 40.730 23.290 2.5 39 38 −127 264 61 −63 219 64 335 1222 840401 04:11 4 40.730 23.280 2.4 61 43 −109 267 50 −72 240 76 345 423 840401 04:37 1 40.520 23.550 1.3 106 47 −54 241 53 −120 90 65 353 324 840401 11:37 1 40.520 23.550 1.8 308 38 −55 88 60 −112 313 67 194 1225 840401 13:51 2 40.620 23.430 1.1 222 70 159 320 70 21 91 0 181 2926 840401 15:58 1 40.540 23.580 1.9 259 49 −138 139 61 −48 102 54 202 727 840402 00:27 4 40.730 23.290 1.5 212 58 144 323 60 38 87 1 178 4728 840402 00:42 4 40.730 23.290 1.6 219 60 154 323 67 32 90 4 183 3829 840402 03:53 4 40.730 23.300 2.0 217 60 151 322 65 33 89 3 181 4030 840402 16:38 7a 40.700 23.110 1.6 90 36 −60 236 60 −108 105 69 340 1331 840402 18:30 2 40.600 23.460 2.0 106 40 −67 259 54 −106 118 74 1 732 840404 18:44 7a 40.700 23.110 1.6 92 28 −64 244 64 −102 129 68 344 1833 840405 18:25 7a 40.700 23.100 1.5 102 36 −68 256 56 −104 126 74 357 1034 840405 21:06 4 40.720 23.370 1.1 118 31 −99 310 59 −83 237 75 35 1435 840406 06:47 7b 40.680 23.080 2.4 92 42 −52 227 58 −117 85 65 337 936 840406 05:20 7a 40.700 23.130 1.6 95 33 −55 236 63 −109 110 66 341 1637 840406 22:08 3 40.680 23.410 2.4 49 26 −142 285 75 −68 222 55 358 2738 840407 00:24 3 40.700 23.440 1.6 122 44 −92 306 46 −86 279 88 34 139 840407 12:32 1 40.520 23.540 1.3 295 44 −69 89 50 −107 294 76 191 340 840407 19.20 1 40.570 23.600 1.6 69 70 −169 335 80 −19 291 21 23 741 840407 19:49 2 40.600 23.410 1.2 246 46 −116 102 50 −64 79 71 175 242 840407 20:25 3 40.680 23.410 1.3 11 32 −39 136 70 −115 12 57 245 2143 840410 02:09 3 40.680 23.430 0.9 128 38 −68 282 54 −105 145 75 23 845 840410 03:18 3 40.680 23.430 1.1 302 45 −93 128 45 −85 125 87 215 044 840410 15:02 4 40.740 23.330 1.5 14 28 −179 283 90 −61 218 39 348 3846 840410 00:44 4 40.730 23.370 1.6 142 38 −89 322 52 −89 232 83 52 747 840412 09:59 3 40.690 23.510 1.7 121 28 −47 256 70 −109 137 61 1 2248 840412 13:45 4 40.720 23.320 1.6 152 62 23 50 70 150 102 5 9 3549 840413 06:25 4 40.690 23.370 1.1 92 36 −87 269 54 −91 172 81 0 950 840413 08:36 4 40.720 23.320 1.1 304 70 −9 37 80 −159 262 21 169 751 840413 08:10 2 40.600 23.470 1.3 92 32 −69 249 60 −101 130 72 348 1452 840413 09:46 4 40.730 23.240 1.1 220 50 −123 87 50 −55 64 65 154 053 840414 21:48 3 40.640 23.500 1.0 98 46 −62 242 50 −114 85 71 349 254 840415 00:24 4 40.690 23.370 1.2 94 36 −85 269 54 −92 166 81 1 955 850427 18:37 7a 40.680 23.160 0.1 70 30 −82 242 60 −93 141 75 335 15
Table 1 (continued)
(continued on next page)
257D.A. Vamvakaris et al. / Tectonophysics 417 (2006) 249–267

Table 2Average epicentral uncertainties (ERH) for the epicenters of theearthquakes used in the present study
Source Number ofevents
ERH(km)
Present study 50 0.6Papazachos and Papazachou (1997) 3 5Christodoulou (1986); Hatzfeld et al. (1987) 63 2Paradeisopoulou et al. (2004) 41 1Soufleris et al. (1983) 24 2Average 181 1.4
Fault plane solutions from local networks (Christodoulou, 1986; Hatzfeld et al., 1987; Hatzidimitriou et al., 1991)
No. Date Time Zone Lat Lon ML Plane 1 Plane 2 P axis T axis
Az Dip Rake Az Dip Rake Az Dip Az Dip
56 850427 22:51 4 40.720 23.310 0.8 269 35 −82 80 55 −94 331 79 174 1057 850428 07:38 4 40.720 23.250 0.8 74 44 −86 250 46 −92 97 88 342 158 850428 21.09 4 40.710 23.320 0.5 54 71 161 150 72 19 282 1 12 2659 850429 12:13 3 40.650 23.430 2.4 140 40 −94 326 50 −85 266 84 53 560 850430 03:47 4 40.740 23.360 1.6 257 36 −70 54 57 −102 287 75 153 1161 850430 18:51 4 40.730 23.350 0.6 257 34 −77 63 56 −97 307 77 159 1162 850430 19:09 4 40.720 23.310 1.4 97 41 −78 263 49 −98 119 82 359 463 850505 18:19 4 40.730 23.290 1.2 253 38 −123 113 59 −66 68 67 187 12
Composite fault plane solutions for aftershocks of the 1978 earthquakes sequence (Soufleris et al., 1983)
No. Date Zone Lat Lon ML Plane 1 Plane 2 P axis T axis
Az Dip Rake Az Dip Rake Az Dip Az Dip
1 August, 1978 4 40.749 23.320 MLb3.8 287 36 −102 123 55 −80 66 78 206 102 4 40.718 23.251 185 26 −124 42 69 −73 326 52 124 103 7a 40.728 23.132 259 40 −110 105 53 −72 74 76 183 84 4 40.724 23.292 105 45 −89 285 45 −89 15 89 15 15 5 40.762 23.122 107 45 −75 267 46 −103 96 80 7 16 4 40.657 23.290 88 41 −102 285 50 −78 245 80 7 47 7a 40.736 23.187 211 62 −94 41 28 −80 118 51 123 48 5 40.753 23.212 240 39 −73 40 53 −102 261 78 139 89 7a 40.729 23.184 119 29 −53 259 67 −108 138 64 3 2010 7b 40.654 23.081 247 38 −82 58 52 −95 297 82 152 811 4 40.734 23.247 117 77 10 24 80 167 71 2 340 1612 7a 40.711 23.105 121 44 −121 341 54 −62 8 62 43 2813 5 40.700 23.227 322 29 −68 119 63 −100 5 70 217 1814 7a 40.709 23.144 263 38 −103 101 53 −78 64 80 183 1015 7a 40.700 23.115 116 50 −54 248 51 −124 60 60 9 1416 7b 40.685 23.042 99 41 −69 254 52 −105 110 76 355 617 4 40.721 23.318 125 35 −69 282 58 −102 156 74 21 1218 5 40.762 23.152 106 44 −86 282 46 −92 115 88 14 219 7a 40.705 23.136 255 40 −89 75 50 −89 345 85 165 520 5 40.771 23.132 118 40 −71 275 52 −103 124 78 16 821 5 40.746 23.186 280 28 −49 57 69 −108 297 62 161 2222 4 40.740 23.311 115 23 −89 295 67 −89 205 68 25 2223 7a 40.697 23.125 109 32 −65 262 61 −103 141 70 2 1424 4 40.732 23.333 297 30 −89 117 60 89 27 75 207 15
Table 1 (continued)
258 D.A. Vamvakaris et al. / Tectonophysics 417 (2006) 249–267
homogeneity of the fault plane solutions and thedirection of the T-axis from fault plane solutions.Thus, 11 zones were defined for the study area, whichwere considered to exhibit a uniform tectonic settingand a similar behavior.
We should point out that the adopted zonationapproach resulted in a few zones with a relativelysmall number of events (i.e. zone 7b, 8 and 10), howeverthe available fault plane solutions, as well as theneotectonic setting (observed active faults, etc.) of theseareas shows a clear differentiation which does not allowto merge them with vicinal zones and consider them aspart of a larger zone (i.e. zone 7a+7b). This is laterfurther discussed for the stress field estimation and itscorrelation with neotectonic information. Furthermore,
the selected subdivision of the study area resulted insome zones having a width of the order of 10 km.Nevertheless, the high precision of the epicentral

259D.A. Vamvakaris et al. / Tectonophysics 417 (2006) 249–267
locations (less than 1.5 km— see Table 2) suggests thatthe qualitative characteristics and the accuracy of theadopted subdivision is not affected by epicentrallocations, since even when examining neighboringzones (for example zones 7b and 8), it is easily seen(e.g. Fig. 3) that a very small number of events couldhave been misplaced in the wrong zone, given the verysmall epicentral uncertainties.
In Fig. 3 the focal mechanism for the 182 earth-quakes used in the present work, as well as the mainfracture zones described before are presented for the 11zones. Examination of this figure shows that the faultplane solutions show a similarity throughout the wholestudy area, as normal ruptures with a W–E direction aredominant. Similar results can be obtained whenconsidering the P and T axes of the focal mechanisms.Each one of these zones was examined individually anda representative stress field was estimated for everyzone. Both methods previously described were appliedfor the stress field determination for the 11, as well as forthe whole study area using all the examined events as acommon dataset. For the Gephart and Forsyth (1984)inversion method, the initial principal stress solution
Fig. 3. Separation of the study area in eleven (11) zones, based on the 182 f
was adopted from the Papazachos and Kiratzi (1992)results. For the parametric search a 30° search areaaround this solution was performed using a 5°-spacingpredefined grid, which means that 85 different primarystress axes were tested within an angle of 30° “around”the initial primary stress axis.
The final stress models determined by the GF methodfor the various zones correspond to values of R mainlybetween 0.3 and 0.7 for each zone (Table 3). In generalthe observed R value are slightly greater than 0.5, whichsuggests that σ2 is closer in magnitude to σ3 than σ1
(RN0.5). This pattern corresponds to zones whereexcept from the dominant extension (and compression)giving typical double couple fault plane solutions, aslight secondary principal extensional stress is alsofound, which suggests a small-scale variation of thedominant extension even within each zone. Anexception is found for zones 5, 7a where R=0.3 andzone 9 with an extreme value of R=0.1, suggesting thatσ2 is closer or almost equal in magnitude to σ1 hence auniaxial extension dominates in these zones.
The obtained results shows an average azimuthaldifference of 11.5°±7° for the principal extension axis
ault plane solutions for the earthquakes used and main faulting zones.

Table 3Azimuth and dip angle values for σ1 and σ3 principle stress directionsfor each one of the 11 zones of the study area, as they have beendetermined by the methods of Papazachos and Kiratzi (1992) andGephart and Forsyth (1984)
Zone Papazachos andKiratzi (1992)
Gephart and Forsyth(1984)
R Av.min.rotationmisfit
σ1-axis σ3-axis σ1-axis σ3-axis
Az Dip Az Dip Az Dip Az Dip
1 82 83 188 2 97 72 193 2 0.5 122 68 53 161 2 85 60 320 18 0.7 143 159 76 3 12 104 68 195 1 0.5 64 264 86 356 0 11 66 155 20 0.7 115 101 87 2 0 233 63 14 22 0.3 36 116 77 14 3 27 75 177 14 0.7 37a 82 73 177 2 86 53 352 3 0.3 77b 101 71 342 9 121 63 338 22 0.6 158 125 69 7 10 100 58 207 11 0.8 49 276 79 8 0 249 51 12 24 0.1 310 67 75 192 9 82 70 197 9 0.5 2
Mean values from both applied methods are shown in the last line ofthe table. The average minimum rotation misfit and values forparameter R are also presented for each zone.
260 D.A. Vamvakaris et al. / Tectonophysics 417 (2006) 249–267
(σ3) between the two methods, as is shown in Fig. 4,where the white arrows present the results of thePapazachos and Kiratzi method and the black onespresent the results of the stress tensor inversion ofGephart and Forsyth. All stress vectors are plotted in arepresentative location in each zone, depending on theepicenters of the earthquakes which where used for thespecific zone. In the same figure, the average stress axesfor the major active neotectonic faults provided by thestudy of kinematics (Mountrakis et al., 2003) are alsopresented with thick gray arrows.
The results for the maximum σ1 and minimum σ3
principal stress directions, provided by the use of bothmethods are also shown in Table 3, both for the wholearea of interest as well as individually for the 11 zones.Moreover, R values and values for the average minimumrotation misfit provided by the inversion method for thezones selected are also presented in Table 3. It should bepointed out that when considering the angular differencebetween the two methods, a mean difference of 18° isfound for both σ1 and σ3 stress axes. These differencesare obviously associated with the inhomogeneous stressdistribution and pre-existing ruptures within each zoneand are within the range of the resolution of themethods. However, the observed bias is slightly largerthan the expected data error (∼10°) of the kinematicaxes from the fault planes of our dataset, which suggeststhat although both methods provide relatively similarresults, the Gephart and Forsyth (1984) results should be
adopted, as the method can handle such inhomogeneousstress effects.
This suggestion is further supported when consider-ing information for the mean extensional stress axesfrom field observations of the most important neotec-tonic fault zones (Mountrakis et al., 2003) which ispresented in Table 4 and compares them with thecorresponding seismological information for the zoneswhere the corresponding neotectonic faults are present.A good match of the values for the maximum extensionstress axes, T, is found for all 6 zones for whichcorresponding neotectonic information was available,when considering the results of the Gephart and Forsyth(1984) method, as σ3 seems to be almost parallel to the Taxes provided by the fault kinematics, with an azimuthmisfit between the stress axes from the seismologicaland neotectonic data less than 7°. This misfit increasesto 12° when the corresponding results of Papazachosand Kiratzi method are used, which further verifies thesuperiority of the inversion process in identifying thecorrect stress field. On the other hand, it is interesting tonotice that this seismological–neotectonic stress fieldcoincidence suggests that the stress field derived usingthe available fault plane solutions is practically identicalto the stress field shown by the available neotectonicfield data, despite its inhomogeneous original dataset orthe specific zonation scheme adopted. This observationverifies that the zonation procedure followed in thepresent study was not based on an over-interpretation ofthe available data (fault plane solutions, active faults,neotectonic setting), given the specific data uncertainties(e.g. epicentral locations).
5.1. Spatial variation of the stress field
Fig. 4 summarizes the stress field estimates derivedfrom seismological data for the broader area ofMygdonia basin. In general, the stress field in thestudy area is extensional, with a subhorizontal minimumstress axis (σ3) showing a∼N–S (6°) direction, as shownby the mean extensional stress vectors at the bottom ofthe Fig. 4. High seismicity and independent seismic(active) crustal deformation estimates show that theextension is a continuous process, mainly in the centralpart of the basin, following the lowest topographicdepression between the two lakes with an extension rateup to 3.4 mm/yr (Papazachos et al., 2001).
For most zones (zones 1, 3, 5, 6, 7a, 9 and 10) thedominant extension exhibits a general N–S direction.An extension with a NNW–SSE (∼320°− 335°)direction is found for zones 2, 4 and 7b while a NE–SW (∼25°) extension is only identified in zone 8.

Fig. 4. Maximum extensional principal stress direction (σ3) for each one of the 11 zones. White arrows correspond to the results of the Papazachosand Kiratzi (1992) method, while with black arrows the ones of Gephart and Forsyth (1984) method are shown. Thick arrows denote the averageminimum principal stress direction for the whole data (bottom part of the figure). Average stress axes for the major active faults in representativelocations (thick gray arrows) provided by the study of the kinematics (Mountrakis et al., 2003) are also presented in the same figure.
261D.A. Vamvakaris et al. / Tectonophysics 417 (2006) 249–267
Similar variations are found from neotectonic observa-tions. Specifically, for the eastern part (zone 3) thestresses provided by the seismological data and theextensional neotectonic stresses related with the ob-served V–NA faulting zone are identical. The same isobserved for the central part of the study area containingthe G–N–S–P fault located in zone 4 and in thenorthern part (zone 5) related to the As–An–Sc faultingzone, where the misfit between the average T–axes forthe neotectonic and seismological data is less than 5°.
In the western part, for the zones 7b and 9 theextension stresses using the two methods seems to bealmost parallel for the seismological data (differenceless than 5°). Neotectonic observations for the centraland eastern part of T–G faulting zone, shows that theaverage stress is in good agreement with the seismo-logical data (7° misfit). In zone 8, kinematics for the A–P fault provides similar stress axes information with theseismological data. Finally, a misfit of about 11° bet-ween the stresses provided by the seismological andneotectonic data is found for zone 10 where the Anth
fault is located. However, it should be pointed out thatseismological information was available only for theeastern section of the fault (Fig. 3) where the fault“bends” towards the south, suggesting a possible localvariation of the obtained stress field.
For the examined zones a significant small-scalespatial variation of the orientation of the mean exten-sional axis from NNW–SSE to NNE–SSW (320–30°)is independently observed from both seismological(fault plane solutions) and geological field observations(faults, neotectonic ruptures). These results suggest thatthe improved fault plane solutions determined in thepresent study, the applied zonation scheme, as well asthe stress tensor inversion method have allowed thereliable estimation of the local stress field in the studyarea.
5.2. Stress field inversion and fault determination
Fault plane solutions define both nodal planesdescribing the rupture (main and auxiliary) but it is

Table 4Values for azimuth and dip angle of the mean extension stress axes inthe Mygdonia basin from neotectonic data (Mountrakis et al., 2003)and extensional principal stress directions (σ3) from the present work(seismological data), for the corresponding zones where neotectonicfaults are found
Neotectonic data Seismologicaldata
Fault T axis Zone σ3 axis
Az Dip Az Dip
V–NA Volvi–Nea Apollonia 10 4 3 15 1G–N–S–P Gerakarou–Nikomidino–
Stivos–Peristeronas150 7 4 155 20
As–An–Sc Assyros–Analipsi–Scholari
18 17 5 14 22
A–P Asvestochori–Polichni 19 4 8 27 11T–G Thessaloniki–Gerakarou
(Central and Eastern part)173 6 7b 158 22
9 12 24Anth Anthemountlas 6 4 10 17 9
262 D.A. Vamvakaris et al. / Tectonophysics 417 (2006) 249–267
not clear which one of them is the fault plane associatedwith the earthquake. Application of the stress-tensorinversion, using the method of Gephart and Forsyth(1984) for the seismological data allows to chose theplane corresponding to the minimum misfit rotationabout any axis of general orientation which is needed tomatch an observed fault plane/slip direction with oneconsistent with the given stress model. These faults areidentified by the inversion method to be the “ideal” faultplanes on which the corresponding earthquakesoccurred.
As previously described, the nodal plane corres-ponding to the minimum misfit is identified by themethod as the fault plane. However, it is clear that thisselection is arbitrary if both nodal planes exhibit similarmisfit values which are either small (both planes areacceptable) or very large (both could be considered as“incompatible” with the determined stress field). Takinginto account the average uncertainty of 10° related withthe provided fault plane solutions and their kinematicaxes, we can consider the difference of the misfit valuesof the two planes provided by the method as a qualitymeasure for the selection procedure. In order to obtainmore realistic and reliable results we have assumed thatif the misfit calculated for both fault planes (main andauxiliary) is relatively small (less than 2–3 times largerthan the average uncertainty, i.e. 25°) and theirdifference is less than the average uncertainty (10°),then both planes should be considered and included inthe results of this study, as they are practicallyindistinguishable with respect to their misfit using thedetermined stress field. For larger rotation misfit dif-ference values (larger than 10°), we took the traditional
approach and kept the plane which was most compatiblewith the determined stress field (smaller misfit). For thecases for which the rotation misfit was too large (morethan 25°) for both fault planes, then neither plane wereadopted and both planes were rejected from furtherprocessing, as completely “incompatible” with the de-termined stress field.
This modified selection procedure resulted in reject-ing about one third of the fault planes provided by thefault plane solution database, leaving approximately240 fault planes which were selected as candidates forthe active faults which generated the examined earth-quakes. This rejection practically means that for aboutfor 65% of the examined fault planes a single nodalplane was selected as the “true” fault plane. Further-more, 225 out of 240 planes selected (more than 93%)exhibit a misfit less than 15° (upper limit of typicalkinematic axis error) and only in 5 cases (out of 182)both planes of the calculated focal mechanism exhibiteda misfit greater than 25° and were discarded. Thisremoval of “incompatible” data (∼2.5%) is too small toaffect the dataset used and change the obtained stressfield results. Furthermore, it should be noted that about45% of the fault planes selected show a misfit less than5°, verifying the good quality of the results.
In Figs. 5 and 6 fault planes identified by the stressinversion method of Gephart and Forsyth (1984) arepresented as linear elements, for two of the examinedzones worked (zones 3 and 7a, respectively). In eachfigure the identified faults are also presented using tworosediagrams. The upper one corresponds to the clas-sical presentation of the direction of the fault planes,while the lower one adopts the Aki and Richards(1980) convention, which gives additional informationabout the dip direction of the fault plane. For instance,in zone 7a (Fig. 6) all NW–SE trending faults dip tothe south, while NE–SW trending faults dip to thenorth. Both rosediagrams describe the dominant orien-tation of the fault planes, as this is determined by theuse of focal mechanisms and the stress inversionmethod.
A joint view of the major neotectonic fracture zonesand the directions of the faults provided by the seis-mological data is presented in Fig. 7 for each one of the11 studying zones, using rosediagrams for the presen-tation of the selected fault plane data. In the same figure,the average extension stresses derived by the use of thetwo methods employed are also shown.
In most cases, the faults “proposed” by the inversionmethod are in agreement with the faults observed in thefield or with the expected directions of the faults, asthese are depicted by the seismicity distribution.
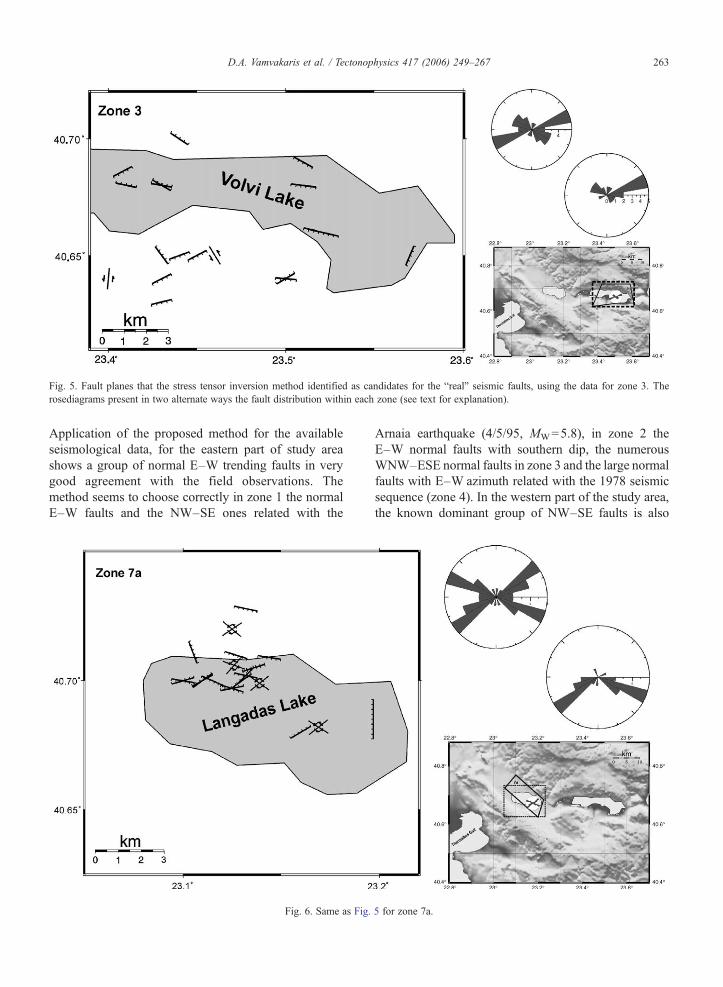
Fig. 5. Fault planes that the stress tensor inversion method identified as candidates for the “real” seismic faults, using the data for zone 3. Therosediagrams present in two alternate ways the fault distribution within each zone (see text for explanation).
263D.A. Vamvakaris et al. / Tectonophysics 417 (2006) 249–267
Application of the proposed method for the availableseismological data, for the eastern part of study areashows a group of normal E–W trending faults in verygood agreement with the field observations. Themethod seems to choose correctly in zone 1 the normalE–W faults and the NW–SE ones related with the
Fig. 6. Same as Fig.
Arnaia earthquake (4/5/95, MW=5.8), in zone 2 theE–W normal faults with southern dip, the numerousWNW–ESE normal faults in zone 3 and the large normalfaults with E–W azimuth related with the 1978 seismicsequence (zone 4). In the western part of the study area,the known dominant group of NW–SE faults is also
5 for zone 7a.

Fig. 8. Rosediagrams for the central and eastern part of theThessaloniki–Gerakarou faulting zone from neotectonic observations(gray color, Tranos et al., 2003) and from the fault planes availablefrom seismological data for the corresponding zones 7b and 9 (blackcolor).
Fig. 7. Joint presentation of the main neotectonic settings and rosediagrams of fault planes identified by the analysis of the seismological data for eachzone. In the same figure the average principal extensional stresses of Fig. 4 are also presented.
264 D.A. Vamvakaris et al. / Tectonophysics 417 (2006) 249–267
found by the seismological data, while another branchwith NE–SW faults is also found. More specifically, forzones 6, 7a and 7b faults with both NE–SWand NW–SEazimuth are identified. The WNW–ESE trending faultsmatch with the dominant rupture zones found in thisarea, while the second group of faults is almostperpendicular to the first one. These branches of NE–SW direction are very interesting because several small-scale fractures of the same azimuth are detected fromfield observations in this area (Tranos et al., 2004).Finally, there is a very good concurrence of the results ofthe inversion and the geological observations for zones 9and 10, where the WNW–ESE to E–WandWNW–ESEfaults identified by seismological data are also observedin the field, respectively.
The use of rosediagrams allows the derivation ofimportant information regarding the dominant faultingzones. In Fig. 8 the directions of faults provided by thestress inversion of seismological data and the rupturesdistribution determined by field measurements (Tranoset al., 2003, 2004) are presented for two zones. The graycolor rosediagram depicts the results of Tranos et al.

265D.A. Vamvakaris et al. / Tectonophysics 417 (2006) 249–267
(2003) for the direction of 128 ruptures at the central andeastern part of the T–G fault zone and the 71 ruptures ofanother branch of the eastern part of the same fault zone.These branches correspond to zones 7b and 9, for whichthe corresponding fault-plane distributions are presentedin the black rosediagram for seismological data. It isimportant to notice that the presence of NE–SW rup-tures in zone 7b almost perpendicular to the dominantWNW–ESE to W–E structure, as the neotectonic datashow (Tranos et al., 2003, 2004), is independentlyproposed by the seismological data. In both cases, a verygood agreement of the fault rupture azimuth for bothneotectonic and seismological data shows that theapplied inversion method for the stress field estimationallowed not only the reliable determination of the stressfield but the identifications of the main active faultdistribution for the study area.
6. Conclusions
In the present work a detailed seismotectonic study ofthe Mygdonia basin is realized, showing a general N–Sextension that is also derived in this study. The ap-plication of inversion method for the stress field studyshows that information provided by the use of seis-mological data is in a good agreement with the stresspattern described by the available neotectonic observa-tions (Fig. 4). The average difference between theminimum principal stress directions and the extensionalstress axes for the seismological and neotectonic ap-proach is typically less than 10°, suggesting that thestress tensor inversion using fault plane solutions ispractically identical to the stress field shown byindividual neotectonic data. This agreement is importantand quite surprising, if we consider that the seismolog-ical information concerns a few mainshocks (MWN5.5),several intermediate magnitude events (5.5NMWN3.5)recorded by the permanent network and three localexperiments which monitored the 1978 aftershock se-quence and the 1984–1984 and 2001–2002 microearth-quake activity. Hence, we can conclude that, at least forthe study area, earthquake fault plane solutions can beefficiently used in order to determine the active seis-motectonic setting, even when coming from very diversesources.
The usage of fault plane solutions allowed the deter-mination of the stress pattern for areas not previouslystudied or not directly related with already known faultsidentified by field observations. The processing of thefocal mechanisms confirms the relation between theoccurred earthquakes and several rupture zones, evensome which are not clearly identified on the surface,
confirming the significant effect of the pre-existingseismotectonic environment on the development of activedeformations on existing faults through earthquakes.These secondary faulting branches (mostly in the westernpart of the Mygdonia basin) are probably related in mostcases with blind faults, without a significant effect on thegeomorphological structure of the area.
The detailed investigation of the study area by thedefinition of zones of similar fault plane solutions andneotectonic observations shows a significant small-scalevariation in the local extensional stress field, which canreach up to 70° (e.g. compare zones 2 and 8 — seeTable 3). Such variations are found even for neighboringzones at distances of the order of 10 km (e.g. zones 7band 8 show a difference of at least 25° of their T-axes—see Table 3). This significant small-scale variation of thestress field appears to contradict previous large-scaleresults (e.g. Papazachos and Kiratzi, 1996), which showa more or less gradual variation of the extensional axis inthe back-arc Aegean area from NNE–SSW in westernAnatolia to NW–SE in western Greece. However, suchlarge-scale studies can not depict the small-scale vari-ations of the stress field in smaller regions, such as theMygdonia basin area, as they fail to reflect the role of thepre-existing fault system on active tectonics. Hence, theinformation presented in the present work can provideaccurate information concerning active tectonics in thevicinity of a major metropolitan center such as the city ofThessaloniki, allowing the realistic modeling of strongearthquake generation scenarios, especially in zoneswhich are favorably oriented with the large-scale stressfield found from large-scale studies.
Acknowledgements
This work was partly supported by the EuropeanCommission Project No. EVG1-CT-2001-00040EUROSEIS-RISK.
References
Aki, K., Richards, P., 1980. Quantative Seismology: Theory andMethods. Freeman, San Francisco, California. 557 pp.
Angelier, J., Dumont, J.F., Karamandersei, H., Poisson, A., Sinsek, S.,Uysal, S., 1981. Analyses of fault mechanisms and expansion ofsouthwestern Anatolia since the late Miocene. Tectonophysics 75,T1–T9.
Angelier, J., Tarantola, A., Valette, B., Manoussis, S., 1982. Inversionof field data in fault tectonics to obtain the regional stress.-I. Singlephase fault populations: a new method of computing the stresstensor. Geophys. J. R. Astron. Soc. 69, 607–621.
Armijo, R., Carey, E., Cisternas, A., 1982. The inverse problem inmicrotectonics and the separation of tectonic phases. Tectonophy-sics 82, 145–160.

266 D.A. Vamvakaris et al. / Tectonophysics 417 (2006) 249–267
Bott, M.H.P., 1959. The mechanics of oblique slip faulting. Geol. Mag.96, 109–117.
Caccamo, D., Neri, G., Sarao, A., Wyss, M., 1996. Estimates of stressdirections by inversion of earthquakes fault-plane solutions inSicily. Geophys. J. Int. 125, 85–868.
Christodoulou, A., Etude Sismotectonique et Inversion Tridimen-sionnelle en Grece du Nord. PhD thesis, University of Grenoble I,pp. 181, 1986.
Cocina, O., Neri, G., Privitera, E., Spampinato, S., 1997. Stress tensorcomputations in the Mt. Etna area (Southern Italy) and tectonicimplications. J. Geodyn. 23 (2), 109–127.
Cocina, O., Neri, G., Privitera, E., Spampinato, S., 1998. Seismogenicstress field beneath Mt. Etna (South Italy) and possible relation-ships with volcano–tectonic features. J. Volcanol. Geotherm. Res.83, 335–348.
Etchecopar, A., Vasseur, G., Daignieres, M., 1981. An inverse problemin microtectonics for the determination of stress tensors from faultstriation analysis. J. Struct. Geol. 3, 51–65.
Eva, E., Solarino, S., 1998. Variations of stress directions in thewestern Alpine arc. Geophys. J. Int. 135, 438–448.
Frepoli, A., Amato, A., 2000. Spatial variation in stresses in peninsularItaly and Sicily from background seismicity. Tectonophysics 317.
Gephart, J.W., 1990a. Stress and the direction of slip on fault planes.Tectonics 9 (4), 845–858.
Gephart, J.W., 1990b. FMSI: a FORTRAN program for inverting fault/slickenside and earthquake focal mechanism data to obtain theregional stress tensor. Comput. Geosci. 16 (7), 953–989.
Gephart, J.W., Forsyth, D.W., 1984. An improved method fordetermining the regional stress tensor using earthquake focalmechanism data: application to the San Fernando earthquakesequence. J. Geophys. Res. 89 (B11), 9305–9320.
Goldstein, P., Minner, L., 1995. A Status Report On The DevelopmentOf SAC2000: ANewSeismic Analysis Code. Lawrence LivermoreNational Laboratory, Livermore, CA. UCRL-ID-121523.
Hardebeck, J., Shearer, P., 2003. Using S /P amplitude ratios toconstrain the focal mechanisms of small earthquakes. Bull.Seismol. Soc. Am. 93, 2434–2444.
Hatzfeld, D., Christodoulou, A.A., Scordilis, E.M., Panagiotopoulos,D., Hatzidimitriou, P.M., 1987. A microearthquake study of theMygdonian graben (northern Greece). Earth Planet. Sci. Lett. 81,379–396.
Hatzidimitriou, P.M., Scordilis, E.M., Papadimitriou, E.E., Hatz-feld, D., Christodoulou, A.A., 1991. Microearthquake studyof the Thessaloniki area (northern Greece). Terra Nova 3,648–654.
Hinzen, K.-G., 2003. Stress field in the Northern Rhine area, CentralEurope, from earthquake fault plane solutions. Tectonophysics 377(3–4, 31), 325–356.
Horiuchi, S., Rocco, G., Hasegawa, A., 1995. Discrimination of faultplanes from auxiliary planes based on simultaneous determina-tion of stress tensor and a large number of fault plane solutions.J. Geophys. Res. 100 (B5), 8327–8338.
Kiratzi, A.A., 1999. Stress tensor inversion in Western Greece usingearthquake focal mechanisms from the Kozani–Grevena 1995seismic sequence. Ann. Geophys. 42 (4).
Loohuis, J., van Eck, T., 1996. Simultaneous focal mechanism andstress tensor inversion using a genetic algorithm. Phys. Chem.Earth 21 (4), 267–271.
Martinod, J., Hatzfeld, D., Savvaidis, P., Katsambalos, K., 1997. RapidN–S extension in Mygdonian graben (Northern Greece) deducedfrom repeated geodetic surveys. Geophys. Res. Lett. 24 (24),3293–3296.
McKenzie, D.P., 1969. The relationship between fault plane solutionsfor earthquakes and the directions of the principal stresses. Bull.Seismol. Soc. Am. 59 (2), 591–601.
Mountrakis, D., Psilovikos, A., Papazachos, B.C., 1983. Thegeotectonic regime of the 1978 Thessaloniki earthquake. In:Papazachos, B.C., Carydis, P.G. (Eds.), The Thessaloniki,Northern Greece, Earthquake of June 20, 1978 and Its SeismicSequence, pp. 11–27.
Mountrakis, D., Kilias, A., Pavlidis, S., Sotiriadis, L., Psilovikos, A.,Astaras, T., Vavliakis, E., Koufos, G., Dimopoulos, G., Soulios, G.,Christaras, B., Skordilis, E., Tranos, M., Spyropoulos, N., Patras,D., Siridis, G., Lamprinos, N., Laggalis, T., 1996. Neotectonic mapof Greece, Langadas Sheet, Scale 1 :100.000. Edition of theEarthquake Planning and Protection Organisation (OASP) and theEuropean Centre on Prevention and Forecasting of Earthquakes(ECPFE) (in Greek).
Mountrakis, D., Kilias, A., Pavlidis, S., Sotiriadis, L., Psilovikos, A.,Astaras, T., Vavliakis, E., Koufos, G., Dimopoulos, G., Soulios, G.,Christaras, B., Skordilis, E., Tranos, M., Spyropoulos, N., Patras,D., Siridis, G., Lamprinos, N. and Laggalis, T., 1997. Specialedition of the Neotectonic map of Greece, Langadas Sheet, Scale1 :100.000 (explanatory issue). Edition of the Earthquake Planningand Protection Organisation (OASP) and the European Centreon Prevention and Forecasting of Earthquakes (ECPFE), 1–79(in Greek).
Mountrakis, D., Kilias, A., Tranos, M., Thomaidou, E., Papazachos, C.,Karakaisis, G., Scordilis, E., Chatzidimitriou, P., Papadimitriou, E.,Vargemezis, G., Aidona, E., Karagianni, E., Vamvakaris, D.,Skarlatoudis, A., 2003. Determination of the settings and theseismotectonic behavior of themain seismic-active faults ofNorthernGreece area using neotectonic and seismological data. EarthquakePlanning and Protection Organisation (OASP) (in Greek).
Neri, G., Wyss, M., 1993. Preliminary results from stress tensorinversion of earthquake fault-plane solutions in the southernTyrrhenian region. Boll. Geofis. Teor. Appl. 35 (139), 349–362.
Papazachos, C.B., Kiratzi, A.A., 1992. A formulation for reliableestimation of active crustal deformation and its application tocentral Greece. Geophys. J. Int. 111, 424–432.
Papazachos, B.C., Papazachou, K., 1997. The Earthquakes of Greece.Ziti Publi, Thessaloniki, Greece. 304 pp.
Papazachos, B., Mountrakis, D., Psilovikos, A., Leventakis, G., 1979a.Surface fault traces and fault plane solutions of May–June 1978major shocks in the Thessaloniki area, Greece. Tectonophysics 53,171–183.
Papazachos, B.C., Mountrakis, D., Psilovikos, A., Leventakis, G.,1979b. Focal properties of the 1978 earthquakes in theThessaloniki area. Bulg. Geophys. J. 6, 72–80.
Papazachos, C., Soupios, P., Savvaidis, A., Roumelioti, Z., 2000.Identification of Small-Scale Active Faults Near MetropolitanAreas: An Example From The Asvestochori Fault NearThessaloniki.
Papazachos, C.B., Kiratzi, A.A., 1996. A detailed study of the activecrustal deformation in the Aegean and surrounding area.Tectonophysics 253, 129–153.
Papazachos, C.B, Vamvakaris, D.A., Vargemezis, G.N., Aidona, E.V.,2001. A study of the active tectonics and deformation in theMygdonia basin (N. Greece) using seismological and neotectonicdata. 9th International Congress of the Geological Society ofGreece. Bull. of the Geol. Soc. Of Greece., vol. XXXIV. No. 1,pp. 303–309.
Paradeisopoulou, P.M., Karakostas, V.G., Papadimitriou, E.E., Tranos,M.D., Papazachos, C.B., Karakaisis, G.F., 2004. Microearthquake
267D.A. Vamvakaris et al. / Tectonophysics 417 (2006) 249–267
study of the broader Thessaloniki area. 5th International Symposiumon Eastern Mediterranean Geology, Thessaloniki.
Pavlidis, S.B., Kilias, A.A., 1987. Neotectonic and active faults alongthe Servomacedonian zone (SE Chalkidiki, northern Greece). Ann.Tecton. I (2), 9–104.
Pavlides, S.B., Kondopoulou, D.P., Kilias, A.A., Westphal, M., 1988.Complex rotational deformations in the Serbo-Macedonian massif(north Greece): structural and palaeomagnetic evidence. Tectono-physics 145, 329–335.
Pavlides, S., 1996. First palaeoseismological results from Greece.Ann. Geophys. XXXIX (3).
Reasenberg, P., Oppenheimer, D., 1985. FPFIT, FPPLOT andFPPAGE: fortan computer programs for calculating and displayingearthquake fault-plane solutions. USGS Open-File Report,vol. 85–739, p. 109.
Scordilis, E.M., 1985 Microseismic study of the Servomacedonianzone and the surrounding area. Ph.D. Thesis, University ofThessaloniki (in Greek).
Soufleris, C., Jackson, J.A., King, G.C.P., Spencer, C.P., 1983.Thessaloniki 1978 earthquakes: locally recorded aftershocks. In:Papazachos, B.C., Carydis, P.G. (Eds.), The Thessaloniki,Northern Greece, Earthquake of June 20, 1978 and Its SeismicSequence, pp. 159–185. Thessaloniki.
Tapley, W.C., Tull, J.E., 1992. SAC — Seismic Analysis Code: UsersManual. Lawrence Livermore National Laboratory. March 20,Revision 4. 388 pp.
Tranos, M.D., Papadimitriou, E.E., Kilias, A.A., 2003. Thessaloniki–Gerakarou fault zone (TGFZ): the western extension of the 1978Thessaloniki earthquake fault (Northern Greece) and seismichazard assessment. J. Struct. Geol.
Tranos, M.D., Meladiotis, I.D., Tsolakopoulos, E.M., 2004. Geomet-rical characteristics, scaling properties and seismic behaviour ofthe faulting of Chortiatis region and Anthemountas basin(Northern Greece). 5th International Symposium on EasternMediterranean Geology, Thessaloniki.
Tull, J.E., 1987. SAC — Seismic Analysis Code. Tutorial Guide forNew Users. Lawrence Livermore National Laboratory, Livermore,CA. UCRL-MA-112835.
Vamvakaris, D.A., Papazachos, C.B., Savvaidis, P.D., Tziavos, I.N.,Karagianni, E.E., Scordilis, E.M., Hatzidimitriou, P.M., 2003.Stress-field and time-variation of active crustal deformation in theMygdonia basin based on the joined interpretation of seismolog-ical, neotectonic and geodetic data. Geophys. Res. Abstr. 5, 08794.
Vamvakaris, D.A., Papazachos, C.B., Karagianni, E.E., Scordilis,E.M., Hatzidimitriou, P.M., 2004. Determination of fault planesolutions using waveform amplitudes and radiation pattern in theMydgonia basin (N. Greece). Bull. Geol. Soc. Greece XXXVI.