small-scale farming and food security: the enabling role ...ftp.iza.org/dp10377.pdf · small-scale...
TRANSCRIPT

Forschungsinstitut zur Zukunft der ArbeitInstitute for the Study of Labor
DI
SC
US
SI
ON
P
AP
ER
S
ER
IE
S
Small-Scale Farming and Food Security:The Enabling Role of Cash Transfers inSouth Africa‘s Former Homelands
IZA DP No. 10377
November 2016
Dieter von FintelLouw Pienaar

Small-Scale Farming and Food Security: The Enabling Role of Cash Transfers in
South Africa’s Former Homelands
Dieter von Fintel Stellenbosch University, ReSEP, LEAP
and IZA
Louw Pienaar
Western Cape Department of Agriculture
Discussion Paper No. 10377 November 2016
IZA
P.O. Box 7240 53072 Bonn
Germany
Phone: +49-228-3894-0 Fax: +49-228-3894-180
E-mail: [email protected]
Any opinions expressed here are those of the author(s) and not those of IZA. Research published in this series may include views on policy, but the institute itself takes no institutional policy positions. The IZA research network is committed to the IZA Guiding Principles of Research Integrity. The Institute for the Study of Labor (IZA) in Bonn is a local and virtual international research center and a place of communication between science, politics and business. IZA is an independent nonprofit organization supported by Deutsche Post Foundation. The center is associated with the University of Bonn and offers a stimulating research environment through its international network, workshops and conferences, data service, project support, research visits and doctoral program. IZA engages in (i) original and internationally competitive research in all fields of labor economics, (ii) development of policy concepts, and (iii) dissemination of research results and concepts to the interested public. IZA Discussion Papers often represent preliminary work and are circulated to encourage discussion. Citation of such a paper should account for its provisional character. A revised version may be available directly from the author.

IZA Discussion Paper No. 10377 November 2016
ABSTRACT
Small-Scale Farming and Food Security: The Enabling Role of
Cash Transfers in South Africa’s Former Homelands*
Cash transfers successfully alleviate poverty in many developing countries. South Africa is a case in point, implementing one of the largest unconditional cash transfer programmes internationally, and with substantial benefits to household well-being along multiple dimensions. Yet, grants discourage formal labour market attachment, creating dependencies on the fiscus. This study uses a fuzzy regression discontinuity design to establish that state-funded Old Age Pensions encourage non-market economic activity (in the form of small-scale farming), and improve the self-reported food security of rural households that farm, vis-à-vis those that do not. However, only non-farming households increase market food expenditure and consume more diverse diets from market-sourced foods: diet quality improves with greater spending, while food sufficiency remains unaffected. Farmers, on the other hand, do not change food spending patterns, but self-rated food sufficiency improves due to greater levels and diversity in home production. The role of small-scale farming is of broader interest in rural development, given the context of the 1913 and 1936 Land Acts that constrained this form of livelihood in former apartheid homelands. This paper’s contribution is two-fold: grants are an effective channel to actively promote rural development through small-scale farming, and they improve food security by non-market mechanisms. JEL Classification: Q12, Q18, Q15, D13, C26 Keywords: cash transfers, small-scale farming, food security, South Africa,
Apartheid homelands, regression discontinuity design Corresponding author: Dieter von Fintel Department of Economics University of Stellenbosch Private Bag X01 Matieland, 7600 Republic of South Africa E-mail: [email protected]
* The authors gratefully acknowledge the useful comments of Hans Binswanger, Michael Aliber, Jorge Aguero, Cally Ardington, Martin Wittenberg, Silvia Napolitano, Anton Ehlers, Debra Shepherd, Servaas van der Berg, Nick Vink, Lulama Traub and Jan Greyling, as well as other participants at the International Conference of Agricultural Economists, the Microeconomic Analysis of South African Data conference, the Agricultural Economics Association of South Africa conference and seminars in the Research on Socioeconomic Policy and Laboratory for the Economics of Africa’s Past groups at Stellenbosch University. We gratefully acknowledge funding from Economic Research Southern Africa who published a prior version of this paper as ERSA Working paper 647. Errors remain our own.

IZA Discussion Paper No. 10377
NON-TECHNICAL SUMMARY
Public expenditure on South Africa’s cash transfer (or social grants) programme is one of the most extensive (as a proportion of GDP) among developing countries. Most evaluations of this large-scale policy focus on how grants change individuals’ incentives to enter or exit the labour market (with conflicting results), while others focus on the benefits for childrens’ health and educational outcomes. No studies have considered the role that grants play in promoting informal economic activity, especially in contexts of high unemployment and poverty. New research that focuses specifically on their role in small-holder farming fills this gap. South Africa’s National Development Plan prioritises rural economic development, with technical support to small-scale farmers proposed as one way to achieve this. Small-scale farmers remain largely concentrated in former apartheid homelands, where poverty and unemployment are also most severe nationally. Similarly, social grant recipients are also largely concentrated in these regions. This research asks whether the two policies are complementary: does social grant receipt provide necessary incomes to promote the uptake of and investment in small-scale farming in former apartheid homelands, and can food security be improved if households opt to farm? Farming households in the former homelands do not enjoy the same access to salary incomes and credit as households that do not embark on any agricultural activities. They therefore generally face resource constraints that would, presumably, also limit their ability to invest in small-scale farming. Instead, they report their main source of income to be derived from social grants. It appears, therefore, that small-scale farming is a necessary supplementary activity to obtain food when market income is lacking and households rely on cash transfers. Turning the question around, however, is it possible that the cash injection from grants can promote farming activity and improve food security? International evidence suggests that this is possible, but only when complementary interventions are also pursued. By contrast, South African transfer recipients are not required to participate in any other programmes, so that the anticipated effects could be zero. Limiting ourselves to homelands households that live on tribal lands, we first establish that the state-funded Old Age Pension (OAP) causally raises the probability of household farming. There is no evidence to suggest that household members exited the formal labour market to instead start farming. In other words, the increase in home production arises among households that would otherwise not have worked or farmed, so that the additional farmers represent new informal economic activity. How is this achieved? Especially among households headed by women, the cash injection from the OAP was invested in fertilizer for the purposes cultivation. Other unmeasured inputs may have also increased in response to the income, though this cannot be firmly established by the data used. Importantly, farming and non-farming households’ food security situation in these regions changes in different ways in response to incomes from grants. Non-farming households report zero changes in self-reported hunger rates when they receive income from the OAP; however, they do report more expensive food purchases in the marketplace and greater diversity in the food groups contained in their diets (which indicates improved nutrition). Overall, this slightly wealthier group used the cash injection to improve the quality of their diets by buying more food types, while maintaining their levels of food consumption. To the contrary, farming households reported reductions in self-reported hunger, indicating that more food was available for consumption. However, no shifts in the levels or diversity of their market purchases could be detected. Instead, the monetary value of their own production increased, as did the number of food groups they could consume from their yields.

Food security improved for both farming and non-farming households when they receive transfer income. However, the ability of farming households to achieve this position with limited access to salary income and without changing food purchasing patterns, illustrates that this positive impact can be achieved even in regions where labour and product markets are thin. Should the investment in household agriculture resulting from the grant ensure yields in multiple seasons, the food security benefits may additionally extend to the long run rather than only stimulating immediate purchases. Cash transfers therefore have a role to play in promoting rural development, despite the fact that they are unconditional in nature.

2
1 Introduction
Publicly funded cash transfers effectively reduce poverty and improve socioeconomic conditions
in many developing countries (Schultz, 2004; Ardington et al., 2013; Filipski et al., 2015; Gertler
et al., 2012; Macours et al., 2012; Schady & Rosero, 2008). However, many assessments focus
on direct welfare outcomes (such as health or education), or whether the injected income frees
resources that allow households to access formal labour and product markets. This study turns
the focus to whether cash transfers raise non-market home production, with potential long-run
benefits for consumption. Our study context, South Africa, has high unemployment rates and,
relative to other developing countries, low rates of participation in the informal sector and
household agriculture (Kingdon & Knight, 2004). We therefore question whether cash injections
can assist in creating informal economic activity when the formal labour market is slack and in a
setting where segregation legislation limited the extent of home production as an alternative
livelihood to salary incomes. Additionally, we consider the effects of transfers that are
unconditional in nature, with the possibility that other household spending priorities may crowd
out investment in home production.
Hoddinott et al. (2012) contend that cash transfer programmes are usually effective at meeting
short-run household food needs (through market consumption), but may not promote investment
in agricultural activities that improve long-run self-sufficiency. This is particularly true in the
case where complementary interventions or conditionality must be in place to achieve long-term
benefits. However, this study contends that even unconditional cash transfers can be effective at
increasing the prevalence of small-scale farming in a setting of high unemployment, which in
turn has the potential to support food security over the long run. We show this by using data

3
from the former apartheid homelands, regions of South Africa that remain highly impoverished,
have high concentrations of cash transfers among households and also represent the greatest
prevalence of subsistence farmers in the country.
The role that small-scale agriculture should play in economic development remains disputed,
with 2014 having marked the international year of the family farm (Christiaensen et al., 2010).
While economic growth may be driven by modernising sectors, others maintain that the poor
tend to benefit directly from subsistence agriculture (even if this does not stimulate aggregate
economic activity). Subsistence activity is therefore postulated to be pro-poor and reduces
inequality. Concerns with feeding an estimated worldwide population of 9 billion by 2050 have
again placed the focus on the role of small-scale agriculture to create sustainable livelihoods,
curtail food insecurity and create employment in rural areas (Machethe, 2004; Dercon, 2009;
Birner & Resnick, 2010).
In South Africa this sector has been handpicked to drive development in rural areas, particularly
in the former apartheid homelands. These regions were the only legally designated parts of South
Africa where black households could farm, as stipulated by the 1913 and 1936 Land Acts. The
legacy of these now-abandoned pieces of legislation remains a central contention in the current
public discourse. The National Development Plan (NDP) has earmarked the small-scale farming
sector to create 370 000 improved livelihoods in the former homeland regions (NPC, 2011).
However, it is well known that the 4 million-strong (traditionally black African) small-scale
sector in homeland areas only produces about 5% of agricultural output, compared to the 35 000
(traditionally white) commercial farmers who produce the rest (Aliber & Hart, 2009). Because of
limited capacity, some critics oppose proposals in the NDP to promote small-holder farming as a
vehicle for development and poverty alleviation. Sender (2016:18), for instance, emphasises

4
small-holders’ “…insignificant contribution to food availability and national output” (emphasis
added). This stance, however, ignores the potential of the sector to combat food insecurity
among the poorest households. Palmer & Sender (2006) estimate that in 2001 only 3% of rural
households sold more than 25% of their produce, with another 44% of the population engaging
in “subsistence” activity1. Some constraints include the rise of a small elite that has dominated
the sector in the former homelands, with substantial portions of land remaining fallow (Sender,
2012; Sender, 2016). Specific food production projects apparently do not improve food security
in these regions (Sender, 2016). Small farmers reportedly do not consume more nutritious diets
than other rural households, or substantially raise incomes from own production (Palmer &
Sender, 2006). However, cash transfers and households cultivation in food gardens in the former
homelands are both positively correlated with lower self-reported hunger levels (Pienaar & von
Fintel, 2014). This paper investigates whether – despite the constraints – cash transfers interact
with household production to improve food security.
South Africa has a well-developed social assistance system, which is widely known for its
success in targeting the poor and its mitigating impact on poverty (van der Berg et al., 2010).
Recipients are most concentrated in the homelands regions where poor small-scale farmers are
also still dominantly located. Of the eight available social grants, the old age pension (OAP)
remains the best researched and documented, due to the substantial amounts that accrue to
households monthly (Neves et al., 2009). This unconditional cash transfer is means-tested and is
only targeted at individuals who are no longer considered to be of working age. Evidence
suggests that the OAP positively impacts household well-being (Ardington & Lund, 1995),
improves food security (Case & Deaton, 1998; Pienaar & von Fintel, 2014; Duflo, 2003;
1 The data used in this study indicate that in 2008/9 approximately 6.6% of homelands households sold at least some of their produce, while another 31.6% engaged in farming activity without selling.

5
D’Agostino et al., 2016), mitigates impacts of HIV/Aids (Booysen, 2004), enables migration to
urban labour markets (Posel et al., 2006) and more recently have been shown to promote job
search among younger rural household members (Ardington et al., 2013). Each of these studies
shows that social assistance directly improves household well-being, while the latter also
suggests that second-round benefits arise due to the economic activity that cash transfers
generate. Cash transfers therefore enable the poor to integrate into formal markets by
encouraging the movement of some household members from slack to tight local labour markets
(Posel et al., 2006). This stands in contrast to other studies, which suggest that labour supply
reduces in response to receiving OAPs: poor households are apparently becoming more
dependent on the fiscus than on income generated in the labour market (Bertrand et al., 2003;
Ranchod, 2006; Abel, 2013). Posel et al. (2006), however, emphasise that conclusions differ
because of household definitions that are used by various survey data: if non-resident migrants
(who were sent by rural households) are considered as a part of the household, labour supply
increases in response to the OAP; on the other hand, resident (rural) household members appear
to be less attached to the formal labour market in response to the OAP. In the latter case, many
such household members live in high unemployment rural areas. Be that as it may, it remains
unclear whether cash grants are enablers in small-scale (non-market) farming activities within
rural homeland areas, where formal jobs are scarce and poverty is high.
This paper fills this gap by estimating whether the OAP in South Africa contributes to the ability
of rural households to pursue small scale farming activities, using a well-known regression
discontinuity design that results from the age-eligibility criteria of this unconditional cash grant
(Duflo, 2003; Bertrand et. al., 2003; Ranchod, 2006). It continues to assess whether grants have a
direct or indirect impact on food security, by estimating their effect on self-reported hunger
levels within farming and non-farming households respectively. We find that grants causally

6
increase the probability of farming, without substitution away from formal employment among
resident household members. Households that do farm report lower levels of hunger in response
to receiving income from the OAP. This is not the case for non-farming households. Among
farming households, additional income from the OAP increases neither market expenditure on
food, nor dietary diversity from market consumption; it does, however, raise output and dietary
diversity from home production. Self-reported hunger in farming households is therefore
mitigated by non-market activity; this is in turn supported by cash transfers that are not spent on
food purchases in the market. Transfers have no positive effects on labour supply and home work
decisions, but some evidence suggests that they aid the acquisition of farming inputs. Among
non-farming households, food expenditure levels and dietary diversity improve in response to
OAP receipts, but in this case all food is purchased from the market. Additional spending on
food does not coincide with reductions in self-reported hunger, but does improve the quality of
diets.
Hence, subsistence farming is enabled through the OAP and improves food security through non-
market channels. These benefits are likely to have longer lasting impacts than the case of non-
farmers, who improve their diets by spending more in the market in the short-run. The rest of this
paper starts with a review of the impacts of cash grants on socio-economic outcomes, and the
role of small-scale farming in rural livelihoods. The subsequent section outlines data and
methods used, followed by a discussion of results and our conclusions.
2 Cash transfers in developing countries
Cash transfers have been implemented by many developing countries in order to improve the
lives of the poor. In South Africa, this programme has been particularly large, with close to 16.6
million recipients (of which nearly 3.1 million were awarded as OAP’s) by 2015 (South African

7
Social Security Agency, 2015). As a proportion of GDP, South Africa’s cash transfer programme
ranks among the largest in the world (van der Berg et al., 2010). In general, South African social
grants are a means of redistributing income to directly impact poverty and inequality in both its
incidence and severity (Inchauste et al., 2015). Furthermore, cash transfers also have intangible
impacts: they foster social cohesion and improve human capital development (Jacobs et al.,
2010). Grants also display positive externalities by impacting health and housing positively,
while also seemingly supporting informal economic activities (Altman et al., 2008; Neves et al.,
2009).
Collective international evidence also suggests that cash transfers have positive impacts on
socio-economic outcomes in many different contexts. A focal point of this literature is the
positive effects that they have on food security and nutrition. In defiance of the Engel curve, the
income shock from cash grants increases food budget shares in Ecuador (Schady & Rosero,
2008). Other forms of income do not induce the same type of behaviour, with food shares
typically declining with income from other sources. Cash grants therefore prompt specific
changes to expenditure patterns that are beneficial to households. In various other contexts
(ranging from Mexico, Nicaragua to South Africa) cash transfers have been found to improve
childhood development, particularly through the channel of improved nutrition (Macours et al.,
2012; Fernald et al., 2009; Duflo, 2003; Coetzee, 2013, d’Agostino et al., 2016).
Nutrition can improve either due to direct spending in food markets, or because transfers also
promote non-market home food production. Only limited evidence exists to support the latter
mechanism. Randomised control trial evidence from Mexico suggests that approximately 25% of
cash transfers are re-invested into productive activity that directly raises household agricultural
output (Gertler et al., 2012). While most of the cash grant is immediately consumed in the
market, a sizable proportion stimulates long-run subsistence consumption that results from

8
small-scale farming activity. Similarly, Tanzanian households increased investments in livestock,
while they did not spend additional grant money on market food expenditure (Evans et al., 2014).
Hence, cash transfers have the potential to improve livelihoods and food security through the
promotion of own account economic activity, in particular through investment in small-scale
farming.
In South Africa, the proposed channel through which cash transfers improve food security is
usually presumed to be through direct market expenditure, or through the grants’ role in enabling
formal labour market attachment. Yet, the extensive social grant system has in many instances
been found to reduce labour supply and employment (Bertrand et al., 2003; Ranchod, 2006;
Abel, 2013). While some attribute this to the elderly that exit the formal labour market
(reportedly to retire and care for the children of prime-aged labour force participants), others do
find that the extra income frees the young to migrate from their rural homes and embark on job
search in urban areas (Ardington et al., 2013; Ardington et al., 2009; Posel et al., 2006). Yet, no
study considers the role that grants play in improving rural livelihoods through household
farming activity. As the next section argues, small-scale farming is a historically neglected and
depressed sector in rural South Africa. Cash transfers can, however, potentially re-invigorate this
type of livelihood and involvement in this activity can provide explanations for their poverty-
reducing effects in rural areas.
3 The proposed role of small-scale farming in supporting food security
3.1 Smallholder agriculture in the former apartheid homelands
While Fields (2011) emphasises the importance of small-scale agriculture in most developing
countries (where formal labour markets are too small to absorb the entire labour force into
employment) this alternative form of livelihood generation is more constrained in South Africa

9
than the rest of the continent. The agricultural sector in South Africa is characterised by a
dualistic structure (Vink & Kirsten, 2003). A division between the commercial, large-scale
farming sector and the comparatively low productive, struggling small-scale sector is only
partially a manifestation of economies of scale. Rather, this phenomenon is a direct result of
historical patterns of dispossession and impoverishment, which systematically eroded historically
successful land-based production systems and livelihoods in South Africa (Neves et al., 2009).
Thus, a small-scale farmer today is typically black, landless, poor, farms on very small pieces of
(communal) land for household subsistence and the majority of farmers depend on social grants
payments from the government’s social protection programme (Fenyes & Meyer, 2003;
Groenewald & Nieuwoudt, 2003; Lahiff & Cousins, 2005). By all existing indications, then, this
is a non-buoyant sector, characterised by dependency, rather than being enabled by social
programmes. Critics go as far as claiming that policies should not consider this form of
livelihood as a poverty-reducing tool (Sender, 2016; Sender, 2012; Palmer & Sender, 2006).
Agriculture continues to be characterized by inequality in terms of the distribution of economic
assets, support services, market access, infrastructure and income (Oettle et al., 1998).
Nevertheless, the sector remains an important livelihood activity among the dwindling rural
South African population, with the majority of households directly or indirectly involved in
farming (Machethe, 2004; Pauw, 2007). Recent estimates from Statistics South Africa’s 2013
General Household Survey suggest that 51% of all households in tribal (former homeland) areas
are directly involved in farming activities, while the absolute number of farming households in
former homelands has increased from 2.28 million in 2003 to 2.68 in 2013. The increase is
matched by a large rise in social grants over the same period, particularly within the homelands
regions. This begs the question whether grants have enabled subsistence activity, or whether
increasingly impoverished small-scale farmers are forced to rely on transfer income. These

10
households improve livelihoods for many residents, supplementing the source of food within
their respective communities that are plagued by high levels of unemployment.
3.2 Linkage between social grants and farming
We turn to the formal link between cash grants and their impact on agriculture specifically.
Small-scale food production contributes modestly to income, emphasizing its subsistence
characteristic (Palmer & Sender, 2006). Furthermore, declining proportions of households rely
on salary incomes and remittances from family members in recent years, and publicly funded
social transfers have become a dominant source of income (Cousins, 2013). Figure 1 illustrates
the potential grant dependence of households in former homeland areas. Approximately 50% of
farming households list transfers as their main source of livelihood. On the other hand, non-
farmers depend on salary incomes, though grants are still the main source for more than 30% of
this group.
While these figures may suggest that cash transfers lead to dependency, recent research
investigates its benefits for agriculture. Lewis et al. (2011) show that the introduction of social
grants in the Mbongolwane Wetland (in KwaZulu-Natal) area played a catalytic role in the
development from a largely subsistence, resource-based local economy to a strongly commercial,
cash-based economy. Furthermore, these grants were said to boost households’ purchasing
power indirectly and provided capital for farmers to start businesses. Individuals receiving old
age pensions continued to pursue land-based livelihoods. The younger generation was clearly
unwilling to take up these farming activities (Lewis et al., 2011), but other evidence suggests that
they become enabled to enter urban labour markets due to the resources now available to
households (Ardington et al., 2009; Ardington et al., 2013).

11
The rest of this paper distinguishes between the dependency and enabling hypotheses, by finding
causal estimates of grants on farming and food security. We isolate the channels by which
farmers are able to create better livelihoods.
Figure 1 Black African homeland households’ main income sources, by farming status. Source: Own calculations from General Household Survey, 2010-2013
4 Data and Methodology
4.1 Data
The data utilized in this paper is the nationally representative Living Conditions Survey (LCS)
survey, conducted by Statistics South Africa during 2008 and 2009 (Statistics South Africa,
2008/09). It included 25 075 households, with questions on household income and expenditure,
subjective poverty, assets and more importantly, detailed information on small-scale farming.
The latter remains limited in many other sources, but this survey allows for successful
differentiation between farming households and non-farming households. The questionnaire
continues to collect detailed information on income and, more specifically, cash transfers
(Statistics South Africa, 2008/09).

12
We sample households residing within the boundaries of South Africa’s former homeland areas,
as demarcated by the Natives’ Land Acts of 1913 and 1936 (Pienaar, 2013). Most subsistence
farming activity is concentrated in these regions. Former homelands constitute 13% of the total
land area of South Africa. These areas were developed separately during the most part of the
previous century and remain distinct in their economic characteristics to this day.
We furthermore limit ourselves to tribal areas within former homelands, because these areas
have been targeted for the expansion of small-scale farming as a means of increased livelihood
activity. As a result, we exclude urban areas and also avoid including commercial farmers who
do not operate on tribal lands. These areas are also the poorest and receive a large concentration
of social transfers. We also restrict ourselves to the black African subpopulation, as this group
was directly affected by the imposition of the Land Acts and other apartheid policies that
enforced separate development.
Small-scale farmers are identified based on their responses to the question on whether or not the
household produced any agricultural produce during the previous 11 months. In every instance,
farmers reported farming on small pieces of land in the chosen region.
4.2 Methodology
The causal impact of South Africa’s social grants have been identified using multiple methods,
including propensity score matching (Coetzee, 2013; Aguero et al., 2007), panel data methods
(Ardington et al., 2013; Ardington et al., 2009; Abel, 2013) and a fuzzy regression discontinuity
design (RDD) (Duflo, 2003; Bertrand et al., 2003; Ranchod, 2006; d’Agostino, 2016; Ranchhod
& Wittenberg, 2016).
This paper takes the latter approach. RDD’s have become an increasingly popular tool to identify
causal effects in social sciences, and are relatively easy to interpret (Imbens & Lemieux, 2008;

13
Angrist & Pischke, 2009). In this case, the age of the household head is the continuous running
variable. Beyond stipulated thresholds (as discussed below) income is shocked due to a rule-
based external policy or eligibility criteria. Households just below that threshold and just above it
are, for all intents and purposes, similar, except that they fall on either side of the policy
eligibility criteria. This separates respondents into a neat treatment and control group around the
cut-off point. Any large differences in outcome variables around the threshold are plausibly
caused by the external “rule” only2. In the case of the OAP, a clear age-eligibility criteria is in
place, alongside means testing. Households with a head above the threshold age are in the
treatment group, as the home’s decision-maker qualifies for the OAP only because they have
become older3. Heads below that age are mostly excluded. The question in this analysis is
whether the propensity to embark on small scale farming and food security outcomes also change
around the age eligibility criteria, so much so that we can causally attribute this to OAP receipt.
At the time of the survey used in this data, only women above the age of 60, and men above the
age of 61 or 63 (depending on the time of the interview) were considered for receipt of the OAP.
Initially men only qualified from the age of 65: however, a 2008 Constitutional Court ruling
progressively lowered this threshold during the time that the LCS was enumerated, to converge
on the criteria for women by 2010 (Department of Social Development, 2008). While the means
test further restricts eligibility, about 90% of individuals in the relevant age range receive this
grant in rural South Africa, so that age is the primary criteria for being treated (Ardington et al.,
2013; Ardington et al., 2009).
2 Ardington et al., (2009), however, show that household composition changes when a household receives or loses a grant over time. We study such confounding factors in our robustness checks. 3 We use the age of the household head as running variable instead of the age of the oldest person in the household. In 93% of households the two definitions coincide. In other cases, we presume that an OAP recipient who is not the oldest household member will also not make decisions about farming and food expenditure. Therefore, we opt for the first definition.

14
Figure 2 Discontinuity in Old-Age Pension Take-up. Source: Own Calculations from LCS (2008/9)
Figure 2 shows the discontinuity in both the number of pensions and total household income
from the OAP that arises when the household head crosses the relative threshold (at 0 years from
eligbility; negative values indicate that the head is younger than the eligible age, and positive
values indicate being older). The jump is not sharp, because many younger individuals also live
in households with pension recipients and benefit from this type of income. This household
formation pattern is common in rural areas, whereby the unemployed tend to congregate in
households with pensioners (Klasen & Woolard, 2009).
Typically fuzzy RDD’s are estimated using Two-Stage Least Squares (2SLS), with the threshold
serving as the exogenous instrument to identify causal effects. The first stage models the total
income that the household receives from the OAP, as a function of the head’s age, while the
second stage estimates the responsiveness of various indicators to this income.

15
log ∗
log ̂
where y is the outcome of interest and is the required causal effect. The first stage can be
estimated with polynomials in age, interacted with the threshold indicator. Such an approach is
necessary if the relationship between the running variable and the endogenous variable is non-
linear around the threshold. We do not show results that follow this approach, as they are similar
to the linear specification.
The RDD strategy is most effective at reducing bias if conducted on a sub-sample close to the
threshold; conversely, limiting the sample to a region in the data that is concentrated too close to
the cut-off may result in imprecise estimates. On balance, we choose a sample of households
whose heads are 10 years younger and older than the eligibility criteria. We present extensive
robustness checks to show that our results are stable across samples that include older and
younger individuals.
While recent research conducted in Lesotho shows that local spillovers also benefit non-recipient
households (Filipski et al., 2015), these community-level externalities are not explored here. As a
result, the effects noted in this study are potentially understated, and could be larger than
reported. Yet, given the widespread coverage of the OAP in former homelands, spillover effects
are likely to be less important in this context.
We limit ourselves to study the OAP, as its income is sizable compared to other grants and
sources of income, amounting to roughly twice the per capita black income (Bertrand et al.,
2003). In 2008, when the survey used in this study was collected, the monthly payout stood at
R940 (about US$120) per recipient. Exploiting the fuzzy RDD apparent in the data, we study the

16
effect of the OAP on the probability of being a farmer, and also on various food security
outcomes in former apartheid homeland regions. We also uncover the channels through which
farmers maximise the benefits of the transfers vis-à-vis non-farmers: we consider whether the
cash is spent on direct market expenditure, on inputs into the production process, or whether it
relieves individuals from formal labour market work in order to focus on hunger-reducing home
production.
5 Results
Table 1 indicates the substantive socioeconomic differences between households that have at
least one OAP recipient and those with none, as well as between those that farm and those that
do not. Transfers are correctly targeted towards households with lower per capita income. As
noted above, farming households are more reliant on transfer income than non-farmers, who
have greater access to salary streams. Farming and OAP recipient households share the
characteristics of less educated heads, fewer household members in employment outside the
home and significantly more household members work in home production. Farmers’ access to
credit is substantially lower than that of non-farmers.
Ironically, non-farmers are closer to food markets and have better access to water infrastructure
(though the former difference is not statistically significant). Non-farmers are close to food
markets for consumption purposes, while those who do cultivate lands are likely doing so for
subsistence purposes rather than for selling at the market. Farmers’ self-rated poverty is
marginally lower than non-farmers. Overall, then, farmers seem to be initially poorer and
supplement their livelihoods with subsistence activity in the absence of substantial labour market
income. Despite these differences, reported hunger levels are not significantly different across

17
groups, indicating that this livelihood strategy is successful at bridging welfare gaps to ensure
food security. We investigate the role that the transfer income plays in bridging this gap.

18
Table 1 Household differences by OAP receipt and farming status
OAP Recipient
Non-recipient Difference Farmer
Non-Farmer Difference
Per capita monthly household income (Rands) 594.07 995.59 -401.52*** 652.61 970.75 -318.14*** Per capita monthly income from OAP (Rands) 283.01 0.00 283.01*** 104.10 64.33 39.77*** Per capita monthly household income from salaries (Rands) 161.80 684.64 -522.85*** 276.03 639.79 -363.76*** Per capita access to immediate credit (Rands) 70.50 157.39 -86.89*** 92.40 149.49 -57.09*** Education of head (years) 2.97 7.57 -4.60*** 5.26 6.74 -1.49*** Proportion of heads female 0.63 0.51 0.12*** 0.57 0.53 0.04** Proportion of heads married 0.36 0.46 -0.10*** 0.52 0.41 0.12*** Household size 5.55 4.21 1.33*** 5.53 4.24 1.30*** Distance to food market (m) 398.97 397.58 1.39 413.18 392.90 20.28 Proportion of households with access to piped water 0.48 0.55 -0.07*** 0.37 0.58 -0.21*** Number of household members employed in last week 0.35 0.59 -0.24*** 0.40 0.57 -0.17*** Number of non-recipient household members employed in last week 0.32 0.59 -0.27*** 0.39 0.57 -0.18*** Number of household members employed in last year 0.42 0.67 -0.26*** 0.49 0.64 -0.16*** Number of non-recipient household members employed in last year 0.38 0.67 -0.30*** 0.47 0.64 -0.17*** Number of household members that work on a plot 0.54 0.30 0.24*** 1.03 Number of non-recipient household members that work on a plot 0.32 0.30 0.01 0.84 Number of household members that work in the home 1.77 1.27 0.49*** 2.14 1.16 0.98*** Number of non-recipient household members that work in the home 1.27 1.27 -0.01 1.86 1.08 0.79*** Proportion rating themselves as poor 0.14 0.14 0.00 0.12 0.15 -0.03** Proportion reporting child hunger 0.09 0.09 0.00 0.10 0.09 0.01 Proportion reporting adult hunger 0.09 0.10 -0.01 0.11 0.09 0.01
NOTES: own calculations from LCS 2008/9. All households in tribal areas within former apartheid homelands regions are included. Estimates are weighted. * p<0.1, ** p<0.05, *** p<0.01

19
5.1 The causal effect of OAP income on the probability of farming
We start with the question of whether farming households are reliant on grant income for
additional livelihood, or whether the OAP enables households to pursue non-market farming
activities. We limit ourselves to households whose heads are aged within 10 years of the
eligibility threshold, but conduct robustness checks below.
Table 2 Linear Probability Model for the propensity to engage in farming activities
P(Farming) P(OAP) P(Farming)OLS 2SLS first stage 2SLS second stage
log(per capita income from OAP) 0.009*** 0.012*** log(per capita income from salaries) -0.004 -0.056*** -0.004 log(per capita income from other sources) 0.011** -0.034 0.011** log(per capita access to credit) 0.007** -0.012 0.007** HH head education -0.001 -0.014 0.000 HH head education squared 0.000 -0.005 0.000 HH head is female -0.030 -0.028 -0.029 HH head is married 0.054* 0.141 0.057* log(HH size) 0.068*** 0.102 0.067*** Distance to food market <750m -0.031 -0.136 -0.031 Distance to food market 0.75-1.5km -0.053 -0.317 -0.052 Distance to food market 6-15km 0.007 -0.217 0.008 Distance to food market >15km -0.025 -0.172 -0.026 Access to piped water -0.182*** -0.127 -0.183*** Age from eligibility threshold 0.129*** Above age eligibility threshold 5.123*** Age from threshold * above threshold 0.241*** Constant 0.294*** -2.906*** 0.294*** R-squared 0.082 0.666 0.081 N 1603 1603 1603 Hausman p-value 0.068* First stage F statistic 948.871 NOTES: own calculations from LCS 2008/9. Only households with heads whose ages are 10 years above or below the pension eligibility threshold and living in rural tribal areas are included in the sample. Estimates are weighted. * p<0.1, ** p<0.05, *** p<0.01

20
OLS results in Table 2 suggest that a 1 percentage point increase in per capita income from the
OAP is associated with an approximately 0.9 percent increase in a household’s probability to
engage in farming. Yet, these results cannot distinguish between the two lines of causality noted
above. Fuzzy RDD estimates in the third column are higher at 1.2 per cent, and now give the
causal impact of transfer income on pursuing farming activity (and not the other way around).
Figure 3 shows that the probability of farming jumps at the age eligbility threshold, so that the
impacts we measure can be attributed causally to pension receipt. The instrument is strong, with
a first stage F statistic of 948.871 (much larger than the rule of thumb of 10), and the Hausman
test on the second stage rejects that the OLS and RDD estimates are equivalent. The first stage
regression shows that crossing the threshold substantially raises the probability of receiving the
OAP. A similar first stage regression is used in all subsequent 2SLS results, but is not shown
again. The downward bias of the OLS coefficient indicates that poorer farmers select into social
grant receipts, as was also indicated by the descriptive analysis in Table 1.
We briefly discuss the importance of some of the control variables. Notably, salary incomes are
associated with a lower probability of farming (though the coefficient is not statistically
significant). Households that are attached to the labour market therefore tend to select out of
farming, so that the activity represents a coping strategy in the absence of salary income. Our
result also suggests that salary income is not used to overcome any constraints to start farming,
but is sufficient for securing livelihoods. Income from other non-labour sources and credit
availability, on the other hand, tend to ease credit constraints and motivate individuals to farm.
Larger households are significantly more likely to participate, ,so that small-holder farming
represents a livelihood coping strategy when large families are not adequately supported by other
forms of income. More importantly than their effects, each of these factors controls for the
confounding effects of changes in other household circumstances when a member receives an

21
OAP. Younger household members become empowered by the OAP income to migrate and seek
jobs in urban regions (Ardington et al, 2009), while the long-term unemployed return to the
pension households to be supported by this type of income (Klasen & Woolard, 2009).
Consequently some households become more integrated into the formal labour market as a result
of OAP receipt, while other households that are isolated from the job market over the long-run
grow when they receive transfer income. Our results suggest that the former type of household
becomes less reliant on farming, while the latter type of household becomes more dependent on
subsistence activity to sustain growing households. We explore these mechanisms in greater
detail below, when we directly model the effects of transfer income on changes in market and
home employment.
A control for access to piped water is introduced to account for potential selection on
infrastructure and access to service delivery that may be essential to home production:
households that are generally poorly resourced choose to farm, supporting the notion that this
type of activity supports subsistence living rather than production for market purposes. The rest
of this paper will only focus on the coefficient of interest (income from the OAP), departing
from the variables considered in this paragraph.
Figure 3 Discontinuity in probability of farming around age threshold. Source: Own Calculations from LCS (2008/9)

22
5.2 The causal effect of OAP income on food security
We rely on a number of indicators to assess whether households are food secure in response to
receiving the OAP. The first considers whether households report that children or adults have
sufficient food to meet their needs. Clearly this measure has many shortcomings and cannot be
studied in isolation. Firstly, self-reported hunger is subjectively reported and prone to
measurement error. What one household reports as “enough” may be considered insufficient by
another. Secondly, having sufficient food – even if accurately reported – does not fully
encapsulate food security conceptually: importantly, if household members are to maintain
healthy lives, the correct combination of food groups from a diverse diet is necessary. Hence, we
construct dietary diversity measures to extend our understanding of whether the OAP improves
the quality of nutrition among farmers and non-farmers.
We begin our assessment of food security with results in Table 3 estimating the impact of
income from the OAP on self-reported hunger levels of children, differentiated by households’
farming status. We split the sample to assess whether the OAP income has a more elastic effect
on food security among farming households vis-à-vis those that rely on labour market incomes.
Child hunger is defined as a dummy variable that indicates when a household reports that any
child was hungry “often” or “always”. Below we will consider more objective measures of food
security.
The instruments are again strongly correlated with the endogenous variables (with particularly
high first stage F statistics), and the Hausman test suggests that they differ from OLS estimates
in the case of farmers. Whilst salary incomes are associated with lower prevalence of self-
reported child hunger, the coefficients are not statistically significant. In contrast, coefficients on

23
OAP income are substantially larger in absolute value, and are aditionally statistically significant
for the OLS estimates. Studying the causal 2SLS estimates, non-farming households do not
report significantly lower levels of child hunger when they receive additional OAP income (the
effect is less than half a per cent and cannot be statistically differentiated from zero). Conversely,
in farming households income from the OAP significantly reduces self-reported child hunger at
the 1% level of significance. Therefore only farming households experience hunger reductions
after receiving the cash transfer. The effect is quantitatively large for this group, with a 1%
increase in per capita income from the OAP reducing the probability of child hunger by 1.2%.
Should an additional person cross the age eligibility threshold in an existing one-pensioner
household, reported child hunger would be eliminated among farming households, but not
among non-farming households. Similar results are obtained for adult hunger, with income from
the OAP only causally reducing self-reported hunger in farming households.
Given that the OAP prompted households to pursue small-scale farming operations, these results
suggest that a channel through which income support alleviates reported child hunger in the
homelands is through subsistence cultivation.

24
Table 3 Linear Probability Models of the prevalence of adult hunger
P(Child Hunger) P(Adult Hunger)
Non-Farmer Farmer Non-Farmer Farmer Non-Farmer Farmer Non-Farmer Farmer
OLS OLS 2SLS 2SLS OLS OLS 2SLS 2SLS
log(p.c. income: OAP) -0.005** -0.007** -0.004 -0.012*** -0.007*** -0.007** -0.004 -0.011*** log(p.c. income: salaries) -0.001 -0.003 -0.001 -0.004 -0.002 -0.003 -0.002 -0.004
log(p.c. income: other) -0.006 0.006 -0.005 0.005 -0.003 0.007 -0.003 0.007
log(p.c. access to credit) 0.001 0.002 0.001 0.002 -0.001 0.003 -0.001 0.003
HH head education -0.011 -0.006 -0.010 -0.007 -0.008 0.003 -0.007 0.002
HH head education2 0.000 0.000 0.000 0.000 0.000 -0.001* 0.000 -0.001*
HH head is female -0.005 -0.100** -0.004 -0.105** -0.023 -0.131*** -0.022 -0.134***
HH head is married -0.059** -0.093* -0.057** -0.099** -0.056** -0.140*** -0.054** -0.144***
log(HH size) 0.107*** 0.017 0.106*** 0.018 0.048*** 0.006 0.047*** 0.006
Distance to food market:
<750m 0.021 -0.037 0.020 -0.040 0.01 -0.046 0.01 -0.048
0.75-1.5km 0.054 -0.057 0.055 -0.057 0.044 -0.033 0.044 -0.032
6-15km -0.057** -0.017 -0.057** -0.017 -0.035 -0.026 -0.034 -0.025
>15km 0.025 0.073 0.024 0.071 0.044 0.069 0.043 0.067
Access to piped water -0.032 -0.02 -0.033 -0.02 -0.036* 0.000 -0.037* 0.001
Constant 0.003 0.202** 0.004 0.211*** 0.115*** 0.233*** 0.117*** 0.241***
R-squared 0.065 0.067 0.065 0.062 0.05 0.074 0.048 0.071 N 843 450 843 450 1035 507 1035 507
Hausman p-value 0.293 0.041** 0.136 0.073*
First stage F statistics 568.983 365.602 496.347 391.088 NOTES: own calculations from LCS 2008/9. Only households with heads whose ages are 10 years above or below the pension eligibility threshold and living in rural
tribal areas are included in the sample. Estimates are weighted. * p<0.1, ** p<0.05, *** p<0.01

25
Table 4 2SLS Regressions modelling food consumption and production patterns
Market Consumption Home Production
log(per capita food exp) Dietary Diversity log(output) DDS log(fertilizer) log(tools) Non-Farmer Farmer Non-Farmer Farmer Farmer Farmer Farmer Farmer
2SLS 2SLS 2SLS 2SLS 2SLS 2SLS 2SLS 2SLS log(p.c. income: OAP) 0.016*** 0.001 0.017* 0.011 0.095** 0.013** 0.046 0.029 log(p.c. income: salaries) 0.009** 0.016*** 0.015 0.046*** 0.005 -0.006 -0.008 -0.011 log(p.c. income: other) 0.016** 0.022** 0.033** 0.056** 0.006 -0.002 -0.145** 0.018 log(p.c. access to credit) 0.000 0.005 0.002 0.003 0.028 0.006 0.016 0.018 HH head education 0.006 -0.001 0.054* -0.001 0.024 -0.005 -0.024 0.049 HH head education2 0.001 0.002 -0.003 0.003 0.000 0.001 0.017* -0.001 HH head is female 0.033 0.036 0.136 -0.085 0.015 -0.032 -0.528 0.171 HH head is married 0.174*** 0.128* 0.081 0.076 0.434 0.055 0.122 0.398 log(HH size) -0.528*** -0.602*** 0.458*** 0.351*** -0.991*** 0.009 0.386 0.055 Distance to food market:
<750m -0.051 -0.041 -0.044 0.232 -0.131 -0.023 0.733 0.393* 0.75-1.5km 0.072 0.064 0.069 0.26 -0.555 -0.063 0.890 0.770*
6-15km 0.142* 0.114 0.308* 0.467** 1.199 0.200 0.683 0.826* >15km 0.120** 0.039 0.302** 0.05 -0.042 -0.036 0.418 0.195
Access to piped water 0.068* -0.101* -0.077 -0.237* 0.853** 0.090 -2.059*** -0.068 Constant 8.213*** 8.495*** 4.941*** 5.349*** -3.359*** 0.188 -0.871 -5.031*** R-squared 0.272 0.310 0.091 0.093 0.046 0.039 0.107 0.037 N 1081 522 1081 522 522 522 522 522 Hausman p-value 0.516 0.486 0.983 0.874 0.761 0.707 0.968 0.059 First stage F statistics 535.792 402.800 535.792 402.800 402.800 402.800 402.800 402.800 NOTES: own calculations from LCS 2008/9. Only households with heads whose ages are 10 years above or below the pension eligibility threshold and living in rural tribal areas are included in the sample. Estimates are weighted. * p<0.1, ** p<0.05, *** p<0.01

26
We now turn to more objective measures of food security. We first investigate changes to market
expenditure on food across farming and non-farming households. In particular, the aim is to
disinguish whether the additional income was spent directly on immediate consumption in the
market, or whether farming households achieved this by using OAP income to cultivate their
own food. Should transfers not be spent on market purchases (particularly by farming
households), then they are, by implication, spent on investments in non-market food production
that in turn reduces self-reported hunger. As noted above, evidence from other settings suggests
that this particular channel raises consumption expenditure over the long-run, and not only in the
short-run (Gertler et al., 2012). We therefore also test whether the estimated monetary value of
food output from farmers’ own production increases in response to the cash transfer, supporting
long-run improvements in consumption levels1. Additionally, the analysis uses measures of
dietary diversity2, both from food bought in the market place and produced on own plots, to
understand whether nutrition quality improved instead of only having enough.
Table 4 starts with models of per capita food expenditure (in other words, the value of food that
is bought on the market only, excluding that which is home-produced for own consumption)3.
Transfer income only significantly raises food expenditure in non-farming households, while the
impact is small and statistically insignificant in farming households.
1 Many farming respondents reported zero value of home production, so that under-reporting is likely to attenuate coefficients towards zero. We nevertheless present these estimates to aid the discussion. 2 A very simple dietary diversity score, measured from 0 to 7, indicates the number of COICOP food groups that the household consumed (from the market or home production, respectively) 3 We do not show OLS results from here on. They are qualitatively similar to RDD estimates, as attested to by the mostly insignificant Hausman tests.

27
Among households that are reliant on salary incomes, the OAP promotes direct market
expenditure on food, without the need for additional home production. Given that self-reported
hunger did not also decrease for this group, the higher OAP elasticity on food expenditure for
this sub-sample implies that food security improved along another dimension beyond the levels
of intake. The third and fourth columns indicate that dietary diversity from market-acquired
food, as with expenditure levels, only improved among the non-farming group. Together, the
results therefore emphasise that households with access to some salary income are not “forced”
to farm; they also do not necessarily buy more food; rather, they use additional income from cash
transfers to improve the quality of their diets by expanding food baskets to more expensive
products.
In farming households the pattern differs in important ways. Market consumption does not
increase, nor does the variety of the market food basket. However, levels and diversity of home
production both increase significantly in response to OAP income (as shown in the second panel
of Table 4). Despite potential downward bias that may arise from under-reported estimates of
home production, the effect on farmers’ home production levels is quantitatively much larger
than the impact on non-farmers’ market consumption levels. More vulnerable households are
therefore more likely to farm when transfer incomes increase, raise food consumption and
diversity through home production and consequently improve self-reported food security and
nutritional quality. This large effect occurs outside the market context (both in terms of food
consumption and production), and emphasises the complementary role of cash transfers and
small-holder agriculture in bolstering food security. Importantly, this result is achieved for an
unconditional cash transfer, unlike in other settings where complementary programmes were
required (Hoddinott et. al., 2012).

28
5.3 Channels
The mechanisms through which cash transfers improve food security differ for farmers and non-
farmers. In the first case, we speculate that the effect is more obvious than in the second case:
less vulnerable households spend the additional transfer cash in the market to improve diet
quality, not food amounts. The mechanisms in the second case are less clear, but more policy
relevant, and will be uncovered in greater detail. As highlighted in section 5.1., transfers appear
to be compensating for a lack of salary income in the decision to farm; other forms of non-labour
income tend to do the same. One potential explanation, therefore, is that small-holder farmers are
capital constrained and do not have funds to invest in the inputs of home production.
Alternatively, however, we also noted that larger households are more likely to farm and that
grants tend to attract other unemployed household members. A second potential explanation for
the large effects of transfers among farming households is, therefore, that the long-run
unemployed exit the labour market and assist elderly recipients in successful home production.
Ranchod (2006) has already shown that the elderly withdraw from the labour market in response
to receiving the OAP. Cash transfers therefore potentially introduce substitution between market
and non-market economic activity.
Subsequent analysis therefore focusses on farming households to distinguish whether they
employed more capital inputs (fertilizer and tools) or labour inputs to achieve greater food
security.
The last two columns of table 4 consider capital constraints among farmers. While a 1% increase
in OAP income raises fertilizer expenditure by approximately 4.6%, this estimate is not
significantly different from zero. Similarly, pension income raises the asset value of tools used

29
for cultivation, but not significantly. Evidence to suggest that the acquisition of new agricultural
inputs with OAP income is therefore limited4.
We therefore turn to changes in labour market behaviour in response to receiving the OAP as an
explanation. Table 5 presents various models of the number of wage employed household
members as a function of transfer income. Because grants may prompt retirement among the
age-eligible (Ranchhod, 2006), we also exclude recipients from total household employment in
some specifications. Results that exclude recipients therefore focus on the behaviour among the
young. The first column of the table supports the evidence of Ardington et. al. (2009), where
employment in the prior week among non-farmers increases in households that receive the OAP.
The effect is, however not significant. No other statistically significant effects are measured,
except for a reduction in non-recipient wage employment in the last year among farmers. The
reference period of one year points to a long-run withdrawal from the wage-paying labour
market that is not attributable to a retirement effect.
4 Again, underreporting (with many reported zeroes) may be reducing precision, so that it is not possible to conclude whether the null effects are real or a statistical artefact.

30
Table 5 2SLS Regressions modelling wage employment
log(HH members wage employed in last week) log(HH members wage employed in last year) Including pensioner Excluding pensioner Including pensioner Excluding pensioner
Non-Farmer Farmer Non-Farmer Farmer Non-Farmer Farmer Non-Farmer Farmer 2SLS 2SLS 2SLS 2SLS 2SLS 2SLS 2SLS 2SLS
log(p.c. income: OAP) 0.007 -0.009 -0.002 -0.023 -0.006 -0.021 -0.017 -0.040** log(p.c. income: salaries) 0.377*** 0.387*** 0.372*** 0.369*** 0.400*** 0.414*** 0.394*** 0.393*** log(p.c. income: other) -0.002 0.001 -0.008 -0.002 0.017 -0.001 0.009 -0.007 log(p.c. access to credit) 0.003 -0.004 0.000 -0.010 -0.002 -0.012 -0.002 -0.017 HH head education -0.032 0.029 -0.034 0.019 0.003 0.02 0.001 -0.016 HH head education2 0.003* -0.001 0.003* 0.000 -0.001 -0.002 -0.001 0.001 HH head is female -0.035 0.078 -0.012 -0.032 0.001 0.094 0.04 -0.052 HH head is married -0.057 0.105 -0.033 0.037 -0.122 0.035 -0.098 0.026 log(HH size) 0.384*** 0.256*** 0.399*** 0.265*** 0.226*** 0.290*** 0.252*** 0.338*** Distance to food market:
<750m 0.042 0.162 0.05 0.134 0.092 -0.212 0.115 -0.218 0.75-1.5km 0.093 0.115 0.107 -0.068 -0.18 -0.176 -0.145 -0.318
6-15km -0.104 0.054 -0.174 0.04 -0.021 -0.106 -0.1 -0.242 >15km 0.045 0.095 0.014 0.085 0.014 -0.119 0 -0.119
Access to piped water 0.068 0.055 0.073 0.132 0.057 -0.052 0.058 -0.003 Constant -3.222*** -3.390*** -3.261*** -3.376*** -2.867*** -2.837*** -2.943*** -2.842*** R-squared 0.74 0.76 0.736 0.737 0.766 0.796 0.761 0.768 N 1081 522 1081 522 1081 522 1081 522 Hausman p-value 0.373 0.257 0.349 0.212 0.483 0.328 0.789 0.618 First stage F statistics 535.792 402.8 535.792 402.8 535.792 402.8 535.792 402.8 NOTES: own calculations from LCS 2008/9. Only households with heads whose ages are 10 years above or below the pension eligibility threshold and living in rural tribal areas are included in the sample. Estimates are weighted. * p<0.1, ** p<0.05, *** p<0.01

31
Table 6 2SLS Regressions modelling home activity
log(HH members working on plot) log(HH members doing any house work)
Including Excluding Including pensioners Excluding pensionersFarmer Farmer Non-Farmer Farmer Non-Farmer Farmer
2SLS 2SLS 2SLS 2SLS 2SLS 2SLS
log(p.c. income: OAP) 0.028 -0.087*** -0.040* 0.000 -0.110*** -0.120*** log(p.c. income: salaries) 0.012 0.014 -0.066*** 0.009 -0.059*** 0.024 log(p.c. income: other) 0.056 0.064 -0.002 0.000 -0.003 0.009 log(p.c. access to credit) 0.053** 0.035 -0.002 0.040** -0.006 0.017 HH head education 0.115 0.163** -0.020 0.061 -0.026 0.041 HH head education2 -0.005 -0.008 -0.004 -0.005 -0.003 -0.003 HH head is female -0.780** -0.613** 0.160 -0.407* 0.115 -0.451* HH head is married 0.091 -0.062 0.006 -0.102 -0.111 -0.265 log(HH size) 0.567*** 0.789*** 0.586*** 0.819*** 0.839*** 1.472*** Distance to food market:
<750m -0.622** -0.566** 0.375* 0.311 0.190 0.346 0.75-1.5km 0.819* 1.110*** -0.095 0.938*** -0.055 0.991***
6-15km 0.852* 0.770* -0.290 0.521* -0.298 0.385 >15km 0.180 0.372 0.304 0.349 0.287 0.422*
Access to piped water -0.740*** -0.682*** -1.206*** -0.696*** -1.183*** -0.712*** Constant -2.626*** -3.747*** -1.682*** -1.035*** -2.265*** -2.529*** R-squared 0.107 0.16 0.126 0.143 0.16 0.256 N 522 522 1081 522 1081 522 Hausman p-value 0.501 0.592 0.898 0.419 0.763 0.353 First stage F statistics 402.8 402.8 535.792 402.8 535.792 402.8
NOTES: own calculations from LCS 2008/9. Only households with heads whose ages are 10 years above or below the pension eligibility threshold and living in rural tribal areas are included in the sample. Estimates are weighted. * p<0.1, ** p<0.05, *** p<0.01

32
Does the withdrawal of non-recipients correspond to a similar increase in engagement in home
work? Table 6 shows that grant income has an insignificant positive impact on the number of
members working on their own plots for food production. Once recipients are excluded, a
significant negative effect appears. The result for all household members is therefore a
combination of two opposing effects: OAP recipients become more likely work on their own
plots, while other household members become less likely to do so. A similar pattern holds with
respect to any work in the household in both farming and non-farming households. While there is
limited support for non-recpients’ withdrawal from wage employment, they certainly do not
change their behaviour to contribute more to home production. This is supported by the results of
Ranchhod and Wittenberg’s (2016) time use study, which suggests that women recipients
increase time spent on care for children, while younger women reduce this figure. Hence, our
results suggest that there is no talk of substitution between market and non-market activity.
Instead, the burden of increased household labour falls on the transfer recipient. This person has
command over the added household resources, but also invests them in home production. While
our results do not support that this investment was made in fertilizer or tools, other unmeasured
inputs may have been acquired through the cash transfer. Unfortunately the data does not provide
sufficient information to establish whether other inputs have increased, though our robustness
checks in the next section indicate that women-headed households spend the grant income on
fertilizer.
5.4 Robustness checks
We conduct robustness checks due to two primary concerns. The first objective relates to
coefficient stability and inference, while the second distinguishes whether the measured impacts
are driven by the pension directly or retirement more generally. The latter is done by estimating

33
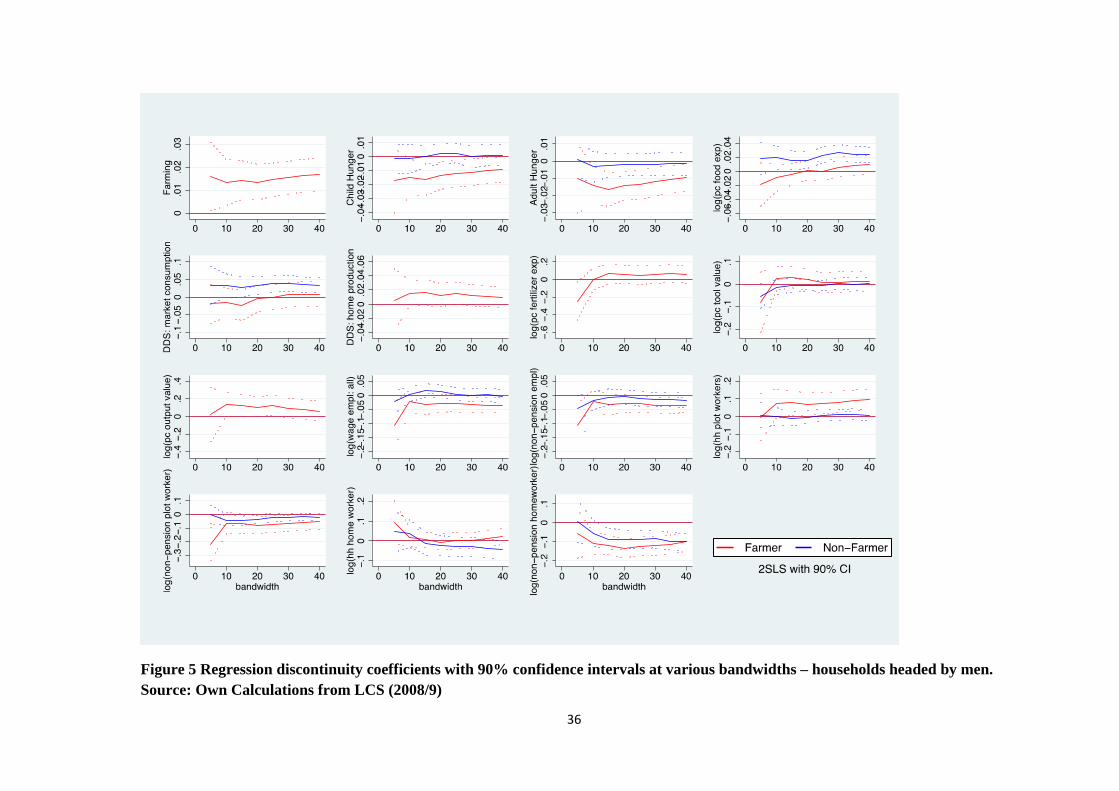
the models separately by gender of the household head. Figures 4, 5 and 6 summarise the checks
that we conducted.
5.4.1 Coefficient stability
All estimates presented in the tables above are conducted using a sample that falls within 10
years of the age threshold. Figure 4 shows a set of RDD estimates that are similar to those
presented above, but using various samples. In other words, 5 on the x axis suggests that all
individuals 5 years younger and older than the age cut-off are used in estimation. At 10 a larger
age range is included. Smaller bandwidths include fewer observations and reduce precision.
However, narrower limits are preferable to ensure that similar individuals just below and above
the cut-off are compared in estimation. Overall, conclusions remain robust for larger sample
sizes.
In most instances, coefficients grow in size as the sample includes respondents further from the
cut-off. This provides a clear indication of selection bias as more dissimilar individuals are
compared to each other. However, small sample sizes for bandwidths of below 10 lead to very
broad confidence bands, with almost no significant effects. Coefficients and their significance
generally remain stable above this point, so that our analysis above is considered credible.
5.4.2 Gender distinctions
Figures 5 and 6 re-estimate all effects by gender of the household head. Ranchhod and
Wittenberg (2016) show, that at the pension age cut-off men substitute substantial time allocation
away from labour market work to home work. An potential objection to our results, therefore, is
that all impacts are largely driven by normal transitions into retirement as opposed to the effects
of pension income. Fortunately, women’s time allocation changes more gradually as they age
and does not correspond as closely to OAP eligibility. A separate analysis of women therefore

34
confirms whether the measured impacts can be attributed to the pension incomes or retirment
more generally.
Most results are similar across sample, so that we are confident that our results are not driven by
sudden retirement that is prompted by eligibility for the OAP. One important difference,
however, strengthens our results. At acceptable bandwidths, households headed by women use
the transfer income to increase fertilizer usage. This confirms our assertion that non-labour
inputs constitute the most likely reason for increased home production and food security.

35
Figure 4 Regression discontinuity coefficients with 90% confidence intervals at various bandwidths – all households. Source: Own Calculations from LCS (2008/9)
36
Figure 5 Regression discontinuity coefficients with 90% confidence intervals at various bandwidths – households headed by men. Source: Own Calculations from LCS (2008/9)

37
Figure 6 Regression discontinuity coefficients with 90% confidence intervals at various bandwidths – households headed by women. Source: Own Calculations from LCS (2008/9)

38
6 Conclusion
Our results show that a large unconditional cash transfer in rural South Africa raises the
probability of household farming without substitution away from formal employment. While a
large number of these farmers exhibit a depend on cash transfers as a main source of income, the
amount is used to invest in subsistence economic activity, stimulating food security. The
potential for reaping long-run benefits (which cannot be measured here), as noted in other
economies, also exists (Gertler et al., 2012). Importantly, these effects are achieved with an
unconditional transfer, and in the context of long-run restrictions on small-scale farming in the
former apartheid homelands. Therefore, contrary to other settings (Hodinott et al, 2012),
complementary interventions are not a prerequisite for positive agricultural effects.
In particular, farming households tend to be larger and have poorer access to food markets and
infrastructure. These factors are likely to leave them at greater risk of food insecurity. The
income from the OAP is therefore vital to household livelihood, and is invested in farming
activities that mitigate the risks of food insecurity. The result is that the relatively low market
expenditure on food can be compensated with own production that is funded by the OAP.
Income from the OAP reduces self-reported hunger substantially among farming households,
alleviating the higher dependency burden within this group. The effect is quantitatively large:
one additional pension per household would eliminate self-reported hunger; additionally,
farmers’ increases in food output in response to transfer income is far greater than the increase in
market expenditure on food realised by non-farmers. For these households, the quality of diets
improves in response to grant income (instead of the absolute levels of hunger). We establish that
there is no substitution away from wage employment to home work to achieve this outcome. To

39
the contrary, OAP non-recipients tend maintain employment and reduce engagement in home
production. While it is difficult to pinpoint exact mechanisms with the available data, our results
show that transfers raise fertilizer usage in women-headed households.
This concurs with past results. Duflo (2003) shows that the OAP improves child outcomes if
grandmothers (women in particular) receive transfer income and Coetzee (2013) shows that
similar benefits accrue to children due to the Child Support Grant. Our results, however, add
substantially to the picture by showing that small-scale farming is one of the important
mechanisms through which these benefits arise. Importantly, then, grants improve livelihoods in
multiple ways: through direct effects (by, for instance, enabling food expenditure in the market),
they promote youth attachment to the labour market to generate additional income (Ardington et
al., 2013) and, as we show, they even reach the most resource constrained by allowing them to
produce food for own consumption among households with elderly members. Hence, while
many rural households depend on grants as a dominant income source, this form of social
assistance also enables secondary economic activity.
In a slack labour market with a small informal sector and historical restrictions on land
ownership, the relatively low levels of home production are a concern. Our results show that an
unconditional cash transfer provides a realistic alternative for households to acquire relevant
inputs for food production, without necessarily resorting to thin produce and labour markets.
Hence, cash transfers can stimulate economic activity and rural development, even in regions
that are isolated from central markets.

40
7 Bibliography
Abel, M., 2013. Unintended labour supply effects of cash transfer programmes: Evidence from
South Africa’s old age pension. SALDRU working paper 114. Cape Town: Southern
Africa Labour and Development Research Unit.
Aguero, J.M., Carter, M. & Woolard, I., 2007. The Impact of Unconditional Cash Transfers on
Nutrition: The South African Child Support Grant. Working Paper 39. United Nations
Development Programme.
Aliber, M. & Hart, T., 2009. Should Subsistence Farming be Supported as a Strategy to address
Rural Food Security. Agrekon, 48(4), pp.434-58.
Altman, M., Boyce & G, 2008. Policy options to leverage the system of social grants for
improved access to economic opportunities. Employment Growth & Development
Initiative.
Angrist, J.D. & Pischke, J.-S., 2009. Mostly Harmless Econometrics: An Empiricist's
Companion. Princeton: Princenton University Press.
Ardington, C., Barnighausen, T., Case, A. & Menendez, A., 2013. Social protection and labour
market outcomes of youth in South Africa. Working Paper 96. Southern Africa Labour
Development and Research Unit.
Ardington, C., Case, A. & Hosegood, V., 2009. Labour supply responses to large social transfers:
Longitudinal evidence from South Africa. American Economic Journal: Applied
Economics, 1(1), pp.22-24.
Ardington, E. & Lund, F., 1995. Pensions and development: Social security as complimentary to
programmes of reconstruction and development. Development Southern Africa, 12(4),
pp.557-77.
Bertrand, M., Mullainathan, S. & Miller, D., 2003. Public Policy and Extended Families:
Evidence from Pensions in South Africa. The World Bank Economic Review, 17(1),
pp.27-50.
Birner, R. & Resnick, D., 2010. The Political Economy of Policies for Smallholder Agriculture.
World Development, 38(10), pp.1442-52.
Booysen, F., 2004. Social grants as safety net for HIV/AIDS-affected households in South
Africa. Journal of Social Aspects of HIV/AIDS Research Alliance, 1(1), pp.45-56.

41
Case, A. & Deaton, A., 1998. Large cash transfers to the elderly in South Africa. The Economic
Journal, 108(450), pp.1330-61.
Christiaensen, L., Demery, L. & Kuhl, J., 2010. The (evolving) role of agriculture in poverty
reduction: An empirical perspective. Journal of Development Economics, 96, pp.239–54.
Coetzee, M., 2013. Finding the benefits: estimating the impact of the South African Child
Support Grant. South African Journal of Economics, 81(3), pp.427-50.
Cousins, B., 2013. Smallholder irrigation schemes, agrarian reform and 'accumulation from
above and from below' in South Africa. Journal of Agrarian Change, 13(1), pp.116-39.
D’Agostino, G., Scarlato, M. & Napolitano, S., 2016. Do Cash Transfers Promote Food
Security? The Case of the South African Child Support Grant. Munich Personal RePEC
archive
Department of Social Development, 2008. Old Age Grant. [Online] Available at:
http://www.dsd.gov.za/index.php?option=com_content&task=view&id=106 [Accessed
12 June 2015].
Dercon, S., 2009. Rural poverty: Old challenges in new contexts. The World Bank Research
Observer, 24(1), pp.1-28.
Duflo, E., 2003. Grandmothers and Granddaughters: Old-Age Pensions and Intrahousehold
Allocation in South Africa. The World Bank Economic Review, 17(1), pp.1-25.
Ellis, F., 1998. Household strategies and rural livelihood diversification. The Journal of
Development Studies, 35(1), pp.1-38.
Evans, D.K., Hausladen, S., Kosec, K. & Reese, N., 2014. Community-Based Conditional Cash
Transfers in Tanzania: Results from a Randomized Control Trial. Washington, DC: The
World Bank.
Fenyes, T. & Meyer, N., 2003. Structure and production in South African agriculture. In L.
Nieuwoudt & J. Groenewald, eds. Agriculture in the National Economy.
Pietermaritzburg: University of Natal Press. pp.21-45.
Fernald, L.C.H., Gertler, P.J. & Neufeld, L.M., 2009. 10-year effect of Oportunidades, Mexico’s
conditional cash transfer programme, on child growth, cognition, language, and
behaviour: a longitudinal follow-up study. Lancet, 374, pp.1997-2005.
Fields, G., 2011. Labor market analysis for developing countries. Labour Economics, 18,
pp.S16-22.

42
Filipski, M.J., Taylor, J.E., Thome, K.E. & Davis, B., 2015. Effects of treatment beyond the
treated: a general equilibrium impact evaluation of Lesotho’s cash grants program.
Agricultural Economics, 46, pp.227-43.
Gertler, P.J., Martinez, S.W. & Rubio-Cordina, M., 2012. Investing Cash Transfers to Raise
Long-Term Living Standards. American Economic Journal: Applied Economics, 4(1),
pp.164-92.
Groenewald, J. & Nieuwoudt, L., 2003. Chapter 15: Demands on and Challenges for South
African Agriculture. In L. Nieuwoudt & J. Kirsten, eds. The challenge of change:
Agriculture, land and the South African economy. Pietermaritzburg: University of Natal.
pp.265-83.
Hoddinott, J., Berhane, G., Gillingan, D.O., Kumar, N. & Taffesse, A.S., 2012. The Impact of
Ethiopia’s Productive Safety Net Programme and Related Transfers on Agricultural
Productivity. Journal of African Economies, 21(5), pp761-786.
Inchauste, G., Lustig, N., Maboshe, M., Purfield, C. & Woolard, I., 2015. The Distributional
Impact of Fiscal Policy in South Africa. World Bank Policy Research Working Paper.
Washington DC: World Bank.
Imbens, G.W. & Lemieux, T., 2008. Regression discontinuity designs: A guide to practise.
Journal of Econometrics, 142, pp.615-35.
Jacobs, P., Ngcobo, N. & Hart, T., 2010. Developmental social policies for the poor in South
Africa: Exploring options to enhance impacts?. Human Sciences Research Council.
Klasen, S. & Woolard, I., 2009. Surviving Unemployment Without State Support:
Unemployment and Household Formation in South Africa. Journal of African
Economies, 18(1), pp.1-51.
Lahiff, E. & Cousins, B., 2005. Smallholder agriculture and land reform in South Africa. IDS
Bulletin, 36(2), pp.127-31.
Lewis, F., McCosh, J. & Nxele, Z., 2011. The influence of social welfare grants on the
dependency on and valuation of wetland ecosystem services. WRC Report No. KV
279/11. Institute of Natural Resources.
Machethe, C., 2004. Agriculture and poverty in South Africa: Can agriculture reduce poverty?
Paper presented at the Overcoming Underdevelopment Conference, 28-29 October 2004.
Pretoria: Department of Agricultural Economic, Extension and Rural Development.

43
Macours, K., Schady, N. & Vakis, R., 2012. Cash Transfers, Behavioral Changes, and Cognitive
Development in Early Childhood: Evidence from a Randomized Experiment. American
Economic Journal: Applied Economics, 4(2), pp.247-73.
Neves, D. et al., 2009. The use and effectiveness of social grants in South Africa. Economic
Policy Research Institute.
NPC, 2011. National Development Plan: Vision for 2030. Pretoria: National Planing
Commission.
Oettle, N. et al., 1998. Agricultural services in southern Africa: Encouraging sustainable
smalholder agriculture in South Africa. Glos: Environment and Development
Consultancy Ltd.
Palmer, K. & Sender, J., 2006. Prospects for On-Farm Self-Employment and Poverty Reduction:
An Analysis of the South African Income and Expenditure Survey 2000. Journal of
Contemporary African Studies, 24(3), pp.347-376.
Pauw, K., 2007. Agriculture and poverty: Farming for food of farming for money? Agrekon,
46(2), pp.195-218.
Posel, D., Fairburn, J.A. & Lund, F., 2006. Labour migration and households: A reconsideration
of the effects of the social pension on labour supply in South Africa, Economic
Modelling, 23, pp. 836-853.
Perret, S., Anseeuw, W. & Mathebula, F., 2005. Poverty and livelihoods in rural South Africa.
Report on theme 1: Strategies for Poverty Alleviation and Food Security. Pretoria: Post-
Graduate School for Agriculture and Rural Development University of Pretoria.
Pienaar, L. & Von Fintel, D., 2014. Hunger in the former apartheid homelands: Determinants of
converging food security 100 years after the 1913 Land Act. Agrekon, 54(4).
Pienaar, L., 2013. Typology of smallholder farming households in South Africa's former
homelands: Towards an appropriate classification system. Masters thesis. University of
Stellenbosch.
Ranchhod, V., 2006. The Effect of the South African Old Age Pension on the Labour Supply of
the Elderly. South African Journal of Economics, 74(4), pp.725-44.
Ranchhod, V. & Wittenberg, M., 2016.The Social Pension and Time Allocation in Poor South
African Households. In Besley, T. (ed.) Contemporary Issues in Development Economics.
London: Palgrave Macmillan.

44
SAGS, 2014. South African Government Services. [Online] Available at:
http://www.services.gov.za/services/content/Home/ServicesForPeople/Socialbenefits/old
agegrant/en_ZA [Accessed 28 October 2014].
Schady, N. & Rosero, J., 2008. Are cash transfers made to women spent like other sources of
income? Economics Letters, 101, pp.246-48.
Sender, J., 2012. Fictions and elephants in the rondawel: a response to a brief chapter in South
Africa’s National Development Plan. Transformation – Critical Perspectives on Southern
Africa, 78(1): pp.98-114.
Sender, J., 2016. Backward Capitalism in Rural South Africa: Prospects for Accelerating
Accumulation in the Eastern Cape. Journal of Agrarian Change, 16(1), pp.3-31.
Schultz, T.P., 2004. School subsidies for the poor: evaluating the Mexican Progresa poverty
program. Journal of Development Economics, 74(1), pp.199-250.
South African Social Security Agency, 2015. Statistical Report. [Online] SASSA Available at:
http://www.sassa.gov.za/index.php/knowledge-centre/statistical-
reports?download=367:statistical-report-3-of-2015 [Accessed 12 June 2015].
Statistics South Africa, 2008/09. Living Conditions Survey in SA. Pretoria.
Thirtle, C., van Zyl, J. & Vink, N., 2000. South African agriculture at the crossroads: An
empirical analysis of efficiency, technology and productivity. London: Macmillan Press
Ltd.
Tittonell, P. et al., 2010. The diversity of rural livelihoods and their influence on soil fertility in
agricultural systems of East Africa – A typology of smallholder farms. Agricultural
Systems, 103, pp.83-97.
van der Berg, S., Siebrits, K. & Lekezwa, 2010. Efficiency and equity effects of social grants in
South Africa. Stellenbosch Economic Working Papers: 15/10. Stellenbosch: Department
of Economics University of Stellenbosch.
Vink, N. & Kirsten, J., 2003. Agriculture in the national economy. In L. Nieuwoudt & J.
Groenewald, eds. The challenge of change: Agriculture, land and the South African
economy. Pietermaritzburg: University of Natal Press. pp.3-19.