small guide to making nice tables - eth z
TRANSCRIPT

Small Guide to Making Nice Tables
Markus PüschelCarnegie Mellon Universitywww.ece.cmu.edu/~pueschel

Which One Looks Better?
Easy decision, isn’t it?
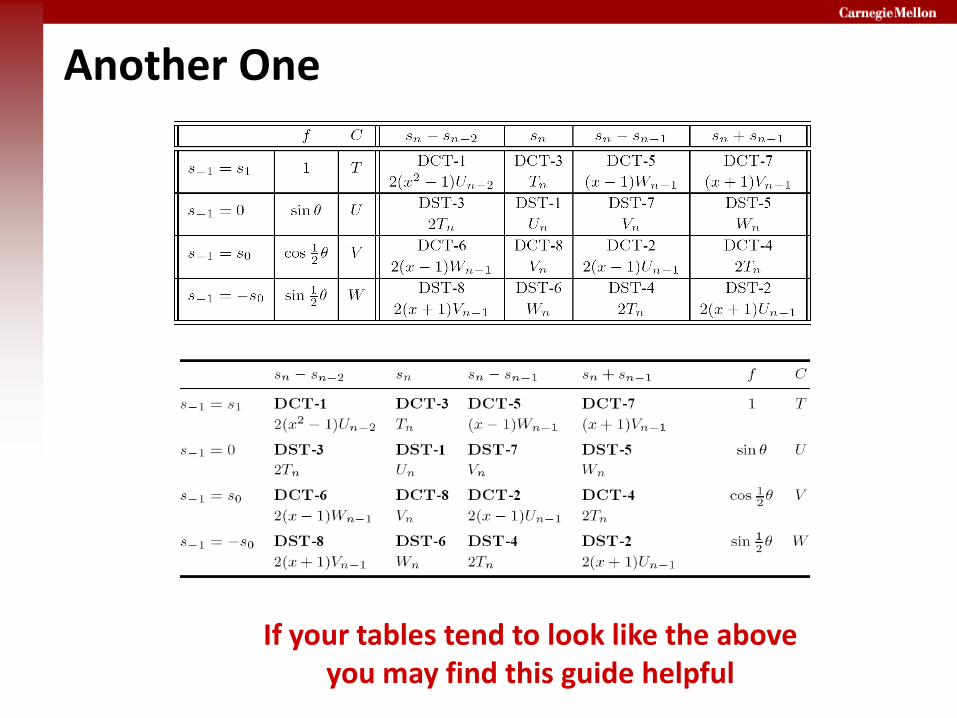
Another One
If your tables tend to look like the aboveyou may find this guide helpful
Background
Up to 2005, I had been writing technical publications for 8 years, creating roughly 35 fully reviewed papers, 2 theses, 20 proposals, and many other pages of technical writing
In each case I spent a lot of effort on content and visual presentation; I am really picky
In 2005 I learned (from Goran Frehse, thank you!) that I had had no clue how to make tables
I summarize what I have learned in this short guide

Resources
“Chicago Manual of Style,” The University of Chicago Press
Latex users: Use booktabs.sty and its documentation http://texcatalogue.sarovar.org/entries/booktabs.html
Most Important Guidelines for Making Tables
Avoid vertical lines
Avoid “boxing up” cells, usually 3 horizontal lines are enough: above, below, and after heading (see examples in this guide)
Avoid double horizontal lines
Enough space between rows
If in doubt, align left

Example: Before and After
Before:
After:
space to the left edge removed space to the right edge removed
more space between rows
everything left alignedalso the first column gets a header
three horizontal lines only,I like the top and bottom ones bolder
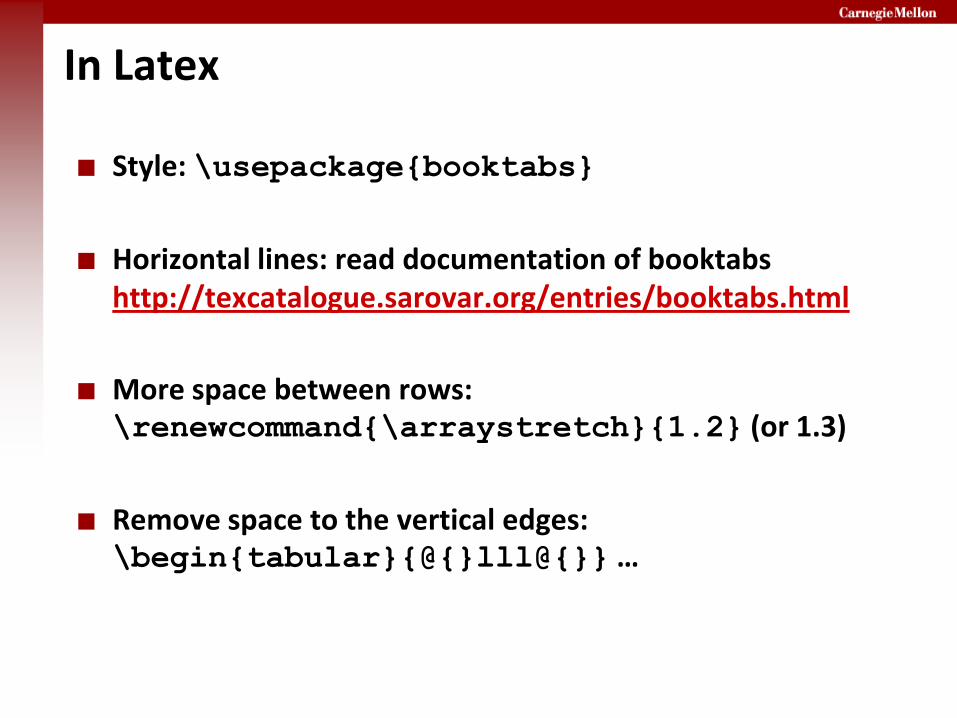
In Latex
Style: \usepackage{booktabs}
Horizontal lines: read documentation of booktabshttp://texcatalogue.sarovar.org/entries/booktabs.html
More space between rows: \renewcommand{\arraystretch}{1.2} (or 1.3)
Remove space to the vertical edges:\begin{tabular}{@{}lll@{}}…
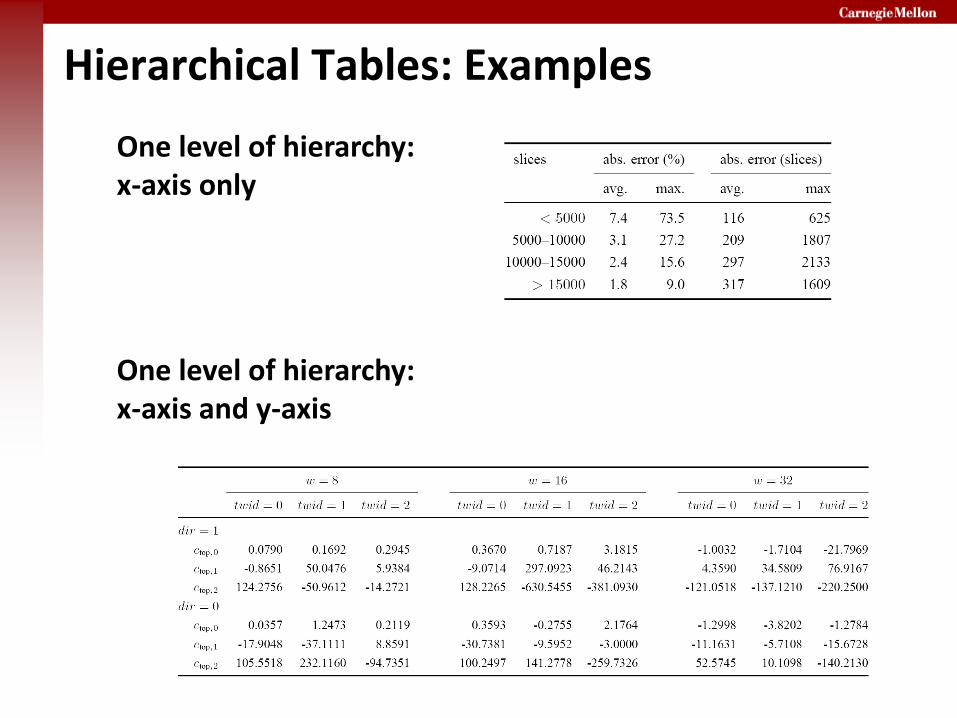
Hierarchical Tables: Examples
One level of hierarchy: x-axis only
One level of hierarchy: x-axis and y-axis

Latex Example
\usepackage{booktabs}
\newcommand{\ra}[1]{\renewcommand{\arraystretch}{#1}}
\begin{table*}\centering
\ra{1.3}
\begin{tabular}{@{}rrrrcrrrcrrr@{}}\toprule
& \multicolumn{3}{c}{$w = 8$} & \phantom{abc}& \multicolumn{3}{c}{$w = 16$} &
\phantom{abc} & \multicolumn{3}{c}{$w = 32$}\\
\cmidrule{2-4} \cmidrule{6-8} \cmidrule{10-12}
& $t=0$ & $t=1$ & $t=2$ && $t=0$ & $t=1$ & $t=2$ && $t=0$ & $t=1$ & $t=2$\\ \midrule
$dir=1$\\
$c$ & 0.0790 & 0.1692 & 0.2945 && 0.3670 & 0.7187 & 3.1815 && -1.0032 & -1.7104 & -21.7969\\
$c$ & -0.8651& 50.0476& 5.9384&& -9.0714& 297.0923& 46.2143&& 4.3590& 34.5809& 76.9167\\
$c$ & 124.2756& -50.9612& -14.2721&& 128.2265& -630.5455& -381.0930&& -121.0518& -137.1210& -220.2500\\
$dir=0$\\
$c$ & 0.0357& 1.2473& 0.2119&& 0.3593& -0.2755& 2.1764&& -1.2998& -3.8202& -1.2784\\
$c$ & -17.9048& -37.1111& 8.8591&& -30.7381& -9.5952& -3.0000&& -11.1631& -5.7108& -15.6728\\
$c$ & 105.5518& 232.1160& -94.7351&& 100.2497& 141.2778& -259.7326&& 52.5745& 10.1098& -140.2130\\
\bottomrule
\end{tabular}
\caption{Caption}
\end{table*}
Table from the bottom of the previous slide:
Further Examples
The following tables are taken from the magazine Economist
They demonstrate How to handle multiple levels of hierarchy
Alignment, handling of long headers
The use of light gray to further divide the tables
Horizontal lines provide readability under denser packing and when lots of numbers are organized
Sans serif fonts are preferrable for readability; of course, if you need math symbols and use latex, then stick with roman
Title above table, sometimes with unit of measure
The use of footnotes
Different types of horizontal lines (I personally don’t like the use of more than two)
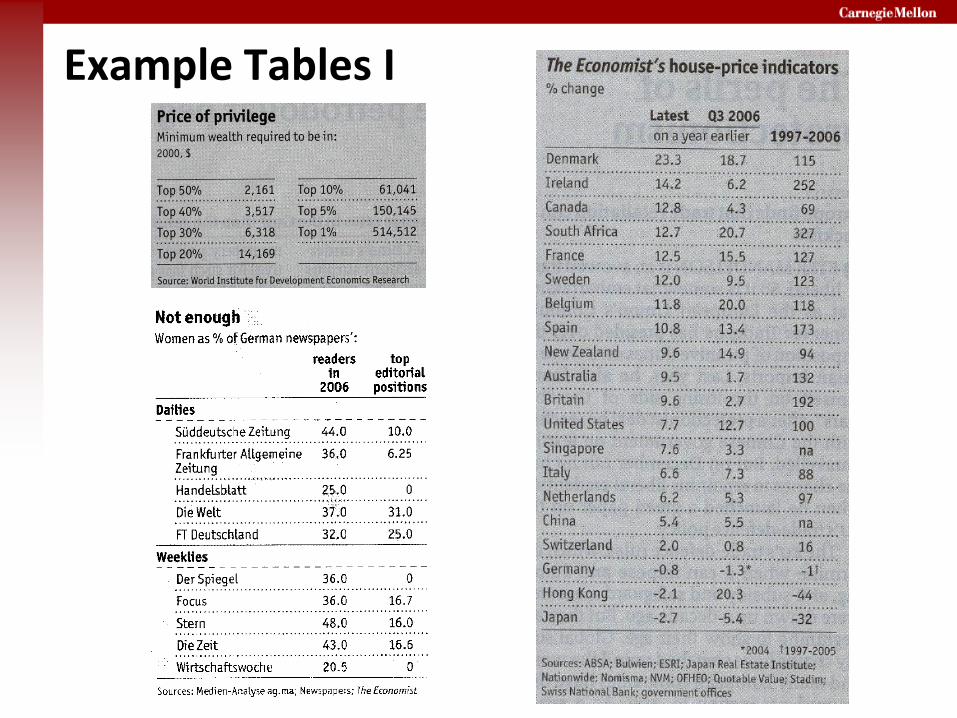
Example Tables I
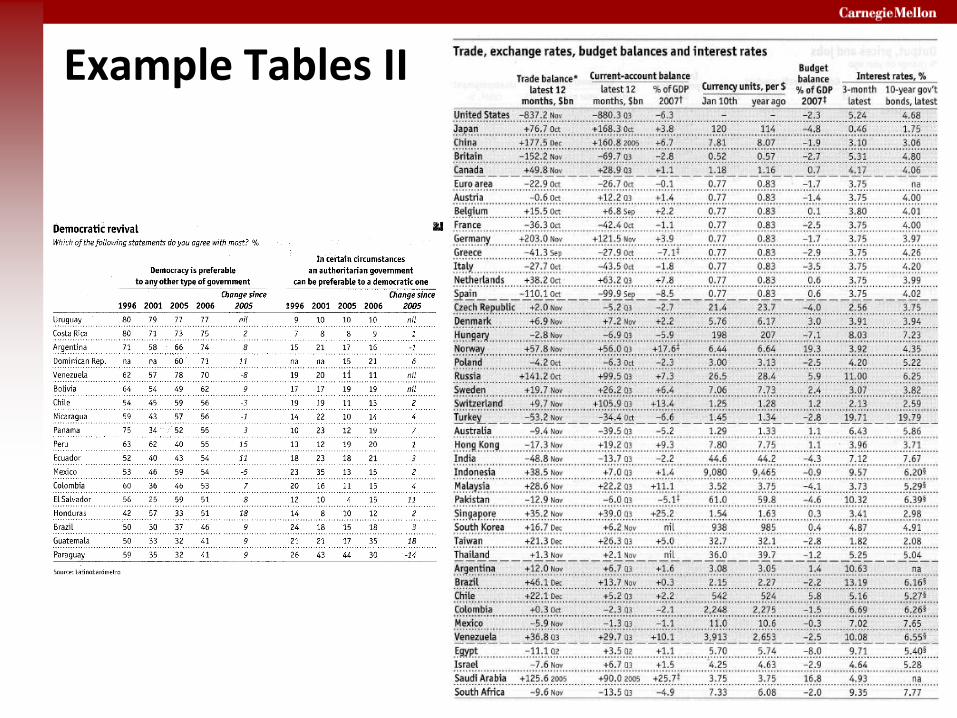
Example Tables II
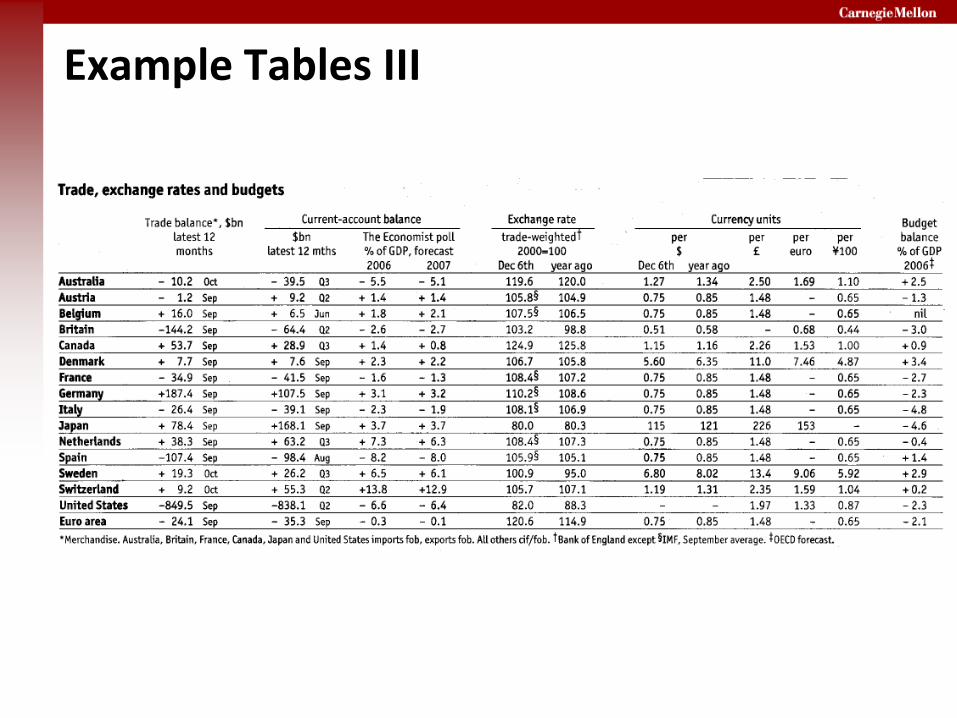
Example Tables III

Example Tables IV

Example Tables V