slums down the drain
TRANSCRIPT

1
S(l)ums down the drain?
Socio-economic impact analysis of yearly floods on the urban poor:
The case of Jakarta
J. I. Schellekens
Spatial, Transport and Environmental Economics
Vrije Universiteit, Amsterdam
13 May 2015
Prof. Dr. J. van Ommeren1
Keywords: Urban poor, Flood damage estimation, Cost-Benefit Analysis, Jakarta, Resilience,
Exposure, Vulnerability, Flood mitigation,
1 I am very grateful to Prof. Olivier Hoes (TUD); Prof. I Made Wiryana (GU); Marloes van Ginkel
(RHDHV); Manfred Wienhoven (Ecorys); Yus Budiyono (BPPT); Philip Ward (VU); Het
Lammingafonds (TUD); Victor Coenen (W+B); and Ad Sannen (RHDHV), for all suggestions,
comments, opportunities and experience recieved during this project. In addition, I would like to
thank the lecturers and students who assisted me at Gunadarma University with contacting local
stakeholders, conducting surveys and providing language aid during site visits.

2
Abstract
The capital city of Indonesia, Jakarta, is threatened by severe flood events. These floods cause
significant damage to housing, offices, infrastructure, public goods and also disrupts society. In the
aftermath measures need to be taken to avoid or reduce the damage from new floods. Starting
point when considering mitigative measures are the costs and benefits of these measures. Making
a complete inventory of the damage directly after a flood is a necessary activity for proper water
resources management, the urban poor however are often not part of these inventories and are left
out of the analysis. Due to the fact that they are neglected in flood measure cost-benefit analysis
their situation does not change and the annually returning floods restrain them from investing in
their house/neighbourhood. This study builds forward on the methodology guidelines for flood
damage calculation by Meyer & Messner (2006) and incorporates for Jakarta specific estimated
exposure and vulnerability values of the urban poor. Results show that the urban poor make up
4.4% of the total direct tangible flood damage ($16.5 million). Further assessment of production
loss, negative health effects and inconvenience of post-flood recovery to the urban poor on the one
hand and mitigative measures conducted by various organisations on the other, shows that the total
yearly damage from rain floods to the urban poor is $14.5 million dollar in total. These results are a
strong signal and recommendation for future flood damage assessments to incorporate the group of
urban poor in their analysis.

3
Table of Contents
1 Background: Jabodetabek and flood risk 5
1.1.1 The Jabodetabek area 5
1.1.2 Urban expansion and –inequality 6
1.1.3 Flood risk 8
1.1.4 Reading guide 9
2 Direct yearly damage from rain flooding 10
2.1 Inundated area per land use 10
2.1.1 Jakarta’s land use 10
2.1.2 Jakarta’s floods 13
2.1.3 Jakarta’s locations at risk 16
2.2 Vulnerability to floods 17
2.3 Exposure to floods 20
2.4 Expected annual total damage 22
2.5 Total yearly direct damage from rain floods Jakarta per land use class 23
3 Indirect yearly damage from rain floods in slums 25
3.1 Identification of indirect costs 25
3.2 Survey in the slums of Jakarta 26
3.3 Indirect yearly flood damage calculation per topic 28
3.4 Total indirect yearly flood damage to the urban poor 29
4 Damage mitigating factors 31
4.1 Identification of aid providers: description of aid provider 31
4.2 Aid projects in slums: location, restrictions and effect of aid given 32
4.3 Total damage mitigating effect of flood aid in slums 33
4.4 Summary: impact of yearly flood damage to the urban poor 34
5 Policy actions for increasing urban resilience to natural hazards 35
6 The perfect flood measure: A hypothetical cost-benefit analysis 38
6.1 Methodology 38
6.2 Results 40
6.3 Reflection 40
7 Conclusion 41
8 References 43
Annex A: Slum description 45
Annex B: Vulnerability Curves 46
Annex C: Questionnaire 47

4
List of Tables
Table 1 Overview of urban poor population estimates for DKI Jakarta.............................................. 7
Table 2 Shortcut to most interesting study results ............................................................................. 9
Table 3 Jakarta land use distribution, excluding slum area ............................................................. 11
Table 4 Jakarta land use distribution, including slum area .............................................................. 13
Table 5 Exposure- / land use values, various land use classes ...................................................... 20
Table 6 Exposure- / land use values, rich- and poor slum ............................................................... 21
Table 7 Expected annual damage, total Jakarta after 2010 flood events ........................................ 23
Table 8 Flood damage per land use class ....................................................................................... 24
Table 9 Slum survey results ............................................................................................................ 27
Table 10 Flood costs, illness ........................................................................................................... 29
Table 11 Indirect damage from floods to the urban poor in Jakarta, per household, per year ......... 29
Table 12 Flood damage mitigating factors methodology ................................................................. 31
Table 13 Total impact yearly floods to the urban poor of Jakarta .................................................... 34
Table 14 Inputs to estimate break-even point of flood measure investment ................................... 39
Table 15 Overview of break-even investment values of a perfect flood measure ........................... 40
List of Figures
Figure 1 Indonesia and Jakarta ......................................................................................................... 5
Figure 2 Land subsidence Jakarta, period 1974-2010 ...................................................................... 6
Figure 3 Total yearly flood damage methodology............................................................................ 10
Figure 4 Incorrect land use classification ........................................................................................ 11
Figure 5 Location of slum area in Jakarta, enlarged map on the right side: red is slum area .......... 12
Figure 6 Old land use and final land use map including slum (orange) ........................................... 13
Figure 7 Flood map with various return periods .............................................................................. 15
Figure 8 Jakarta inundated area per land use Map ......................................................................... 16
Figure 9 Zonal statistics .................................................................................................................. 17
Figure 10 Vulnerability curves for Jakarta ....................................................................................... 18
Figure 11 Slum vulnerability estimation ........................................................................................... 18
Figure 12 Slum vulnerability curves ................................................................................................. 19
Figure 13 Slum exposure estimation ............................................................................................... 21
Figure 14 Calculation of Expected Annuel Damage (EAD) (adapted from Meyer, 2007) ................ 23
Figure 15 Total indirect yearly flood damage methodology ............................................................. 25
Figure 16 Survey locations .............................................................................................................. 27

5
1 Background: Jabodetabek and flood risk
The Jabodetabek region is located on Java Island, which is one of the seven large island (out of a
total of 18.307 islands) who together make up the main land mass of Indonesia. Java Island is
home to the countries capital, the main governmental centre and is also by far the strongest
economic province. Java island, and Bali, make up 62% of Indonesia’s total GDP in 2012 (BPS,
2012).
1.1.1 The Jabodetabek area
Jakarta is part of the Jabodetabek region. The Jabodetabek region is the 2th
largest metropolis in
the world and has a total of over 30 million inhabitants (BPS, 2014). The city of Jakarta is the
largest urban conglomeration in Jabodetabek and has roughly 10 million inhabitants, which makes
it the largest city of Indonesia and it also is its capital. Other cities who make up Jabodetabek area
are: Depok, Bogor, Kota Tangerang and Kota Bekasi. The Jabodetabek basin is cut in half by the
Ciliwung river. The river has its origin close to the Gunung Gede Volcano and has a mean average
runoff of 95.1 m3/s. The Ciliwung increases in volume upriver and decreases in volume near
Jakarta, where it splits and becomes the Ciliwung delta. The largest of the delta rivers is the main
part of the Ciliwung river, additionally there are 13 other large rivers in Jakarta who make up the
main body of the Ciliwung Delta.
Figure 1 Indonesia and Jakarta
The city of Jakarta is known to be hit by floods on an occasional basis. Recent events are 2007,
with an estimated loss between $400.- to $879.- million dollar and around 190.000 people fell ill,
around 70% of the city was flooded up to sometimes four meters high2. The main causes for these
floods are heavy rainfall upstream, extreme local rain in the city, and overtopping of banks near the
ocean (during 2007 flood). The recurrence time of these floods is decreasing, meaning that floods
occur more often and are due to the increase in population and value of property more severe. The
developments below are pointed out as possible contributors to the increasing damage from floods:
climate change, land subsidence, lack of infrastructure maintenance, rapid urbanisation,
degradation of mangrove forests, land reclamation activities, informal villages (slums!), extensive
groundwater extraction and increasing purchase power. Obviously many of these recent
2 Malaysian National News, 2007 (insurance claims); The Jakarta Post, 2007 ; Herald Sun, 2007. Darthmouth flood observatory,
2007.

6
developments are linked and a more detailed insight in some of these developments is provided
below.
In the Jabodetabek- and especially northern Jakarta region groundwater is being extracted for
industrial use. Although groundwater extraction has always occurred by residents and SMEs in this
region, the current increase in fresh-water-production has increased at such a rate that it is
affection groundwater levels. The growing demand for groundwater has actually lead to a decrease
in the piezometric pressure by 52.5m in 1990 (Soetrisno et. al., 1997). The demand for groundwater
has only increased ever since and a greater decrease in piezometric pressure is expected.
Figure 2 Land subsidence Jakarta, period 1974-20103
Jakarta faces next to an increasing demand for groundwater the problem of land subsidence (see
figure 2). Because of the land subsidence many parts of upper north Jakarta are currently below
sea level and in 10-20 years’ time an even larger part of northern Jakarta will be located below sea
level. The rate of land subsidence and groundwater extraction are similar and possibly connected.
In answer to these developments the Indonesian -and Dutch governments are working together
under the NCICD program, which has as aim to make Jakarta flood resilient by reducing the
ongoing land subsidence, to increase the groundwater level and improve sanitation.
1.1.2 Urban expansion and –inequality
The Jabodetabek region has grown from approximately 2 million inhabitants in 1970, to the 25
million urban agglomeration of today in around 40 years. This massive expansion is mainly due to
the late 1900’s development into a global economy, an increase in need for industrial workers and
the centralization of the national regime. These factors contributed to an increase in purchasing
power and provided for many Indonesians enough of a lure to move from the country side, legal
3 Source: Deltares 2011

7
and/or illegal, to the capital. This rapid urban expansion is difficult to organize properly and is in
combination with a large pool of unskilled labour a recipe for the development of slums.
In Jakarta there are many informal settlements, also known as slums or squatter villages, and the
estimations of the number of people living in these slums differ a lot. Approximation range from 6%
to 25%, or between 0.65 –and 2.7 million. Slums are further oft located in the less desirable
locations of the city. These locations are near dumpsites, train tracks, riverbeds and the lower lying
areas which are prone to floods. The number of urban poor who live in Jakarta depends on the
chosen definition of poverty. Statistical databases are divided on the number of urban poor in
Jakarta and the main reason for the various estimates lies in the chosen definition of poverty and/or
urban poor. There are many different definitions and thus many different outcomes in the number of
urban poor. Although there is no universal definition of urban poor, all do agree on the fact that
Jakarta’s urban poor live in a kampung, which is the local word for village. The UN-habitat definition
of a slum, see below, gives an idea of the living conditions in a slum.
The UN-Habitat defines a slum/kampung as a group of individuals living under the same roof in an
urban area who lack one or more of the following (UN-Habitat 2003: XXVI, 16, Zimmer 2011):
1. Durable housing of a permanent nature that protects against extreme climate conditions.
2. Sufficient living space which means not more than three people sharing the same room.
3. Easy access to safe water in sufficient amounts at an affordable price.
4. Access to adequate sanitation in the form of a private or public toilet shared by a reasonable
number of people.
5. Security of tenure that prevents forced evictions.
This definition of a slum provides a handhold for the living conditions and the scale of this project. If
one combines various literature, blogs and statistical (not official government statistics) numbers
then the share of Jakarta’s population living in a kampung is around 20-25 percent, with an
additional 4 to 5 percent located illegally on riverbanks, flood plains and empty lots. This rough
estimation does however not provide a good value on the number of urban poor, since a kampung
is not exclusively inhabited by the urban poor.
The share of urban poor in DKI Jakarta is not available or estimated correctly, because of this the
values for Java are taken. According to the Worldbank the urban poverty rate of Java is 9.6%
(Susenas survey, 2010). The Worldbank identified the urban poor based on their average wage
using the international urban poverty standard, which states that one can be counted as urban poor
when the wage is below $2.-/day. Additionally to the group of urban poor, there are the urban ‘near’
poor (7.9%). This group of society earns 20 percent more per day than the urban poor, which is not
much considering a $2.-/day wage. In this study these two classes are combined, assuming that
both live in the kampungs of Jakarta, under the name of ‘urban poor’. The total number of urban
poor for Java amounts up to 17.5% of the total population, for Jakarta this would be roughly 1.1
million people.
Table 1 Overview of urban poor population estimates for DKI Jakarta
Name Percentage Number of people
DKI Jakarta - 10.194 million
Kampung 20% – 25% + 4% – 5% ~2.29 mil + ~0.46 mil = ~2.75 mil
Urban poor 9.6% 0.98 million
Urban near poor 7.9% 0.80 million
Total urban poor 17.5% 1.78 million
4 World population statistics, 2013.

8
In the table above a distinction is made between the residents in a ‘normal’ kampung (20-25%) and
residents located near riverbeds, along train tracks and at empty lots (4-5%). This second group is,
according to the Worldbank 2010, completely part of the group of urban poor. This study will refer to
this group as the ‘poor’ slum. The remaining 12.5% of the group of urban poor lives in a kampung
and will in this study be referred to as the ‘rich’ slum5.
1.1.3 Flood risk
One of the largest problems in Jakarta, and in many other Asian countries, is the high occurrence of
natural disasters. In particular the risk of flooding has, according to recent studies, a high impact on
the population and its economy. The reason that many Asian metropolitan cities have a high risk of
flooding is partly explained by the fact that they are located in low lying deltas. Other reasons for
the high flood risk are the limited drainage and flood protection infrastructure in these cities. This
leads to periods in which parts of these cities are flooded for several days. As a result large groups
of people can’t go to their respective offices and factories and the economy comes to a standstill.
After the flood, the water slowly withdraws and while recovering the economy starts up again.
Although, in the lowest areas these floods last longer. The lowest areas are populated by the urban
poor. They don’t have the means to live on higher grounds and this forced them to settle in flood
prone areas.
In the aftermath of a flood measures need to be taken to avoid or reduce the damage from new
floods. Starting point for considering mitigative measures are the costs and benefits of such a
measure. The cost element in a cost-benefit analysis is built-up of investment -, annual operation -
and maintenance costs. Benefits are determined by the decrease in flood damage due to the
investment. Making a complete inventory of the damage directly after a flood is a necessary activity
for proper water resources management.
The reality is that after a flood more often than not only the damage for large themes is collected,
since these are fairly easy to estimate. They are for instance based on the production of factories,
number of office employees, shops that need to close their doors. The urban poor are often not part
of these inventories, as:
1. They possess not much;
2. They tend to exaggerate their damage: perhaps I’ll get compensation;
3. They tend to underestimate their income: to prevent that they need to pay taxes;
4. The government neglects them: they live illegally in riparian areas and by this blocking the
access for maintenance of rivers and canals;
5. Recovering from the damage has a higher priority than collecting data.
By leaving them out of these analyses, their situation also does not change. Measures are taken
elsewhere, and the annually returning floods restrain them from investing in their house /
neighbourhood. However, despite the individual minor damage, the group of urban poor is so large,
that this group as a whole contributes significantly to the total damage. The hypotheses of this
study is that with sufficient insight in the damage of the urban poor, their position in a cost benefit
analyses increases, which shows if it is welfare beneficial to take larger measures. The objective of
this study is to gain insight in the yearly damage of the urban poor during a flood. This study
focusses on the total yearly damage of rain flooding to the group of urban poor as percentage of the
total yearly rain flood damage of Jakarta and per person.
5 Please skip forward to Annex A if you are interested in a more graphic explanation of housing differences between the two
sub-groups in the group of urban poor.

9
There are a number of sub-questions, and the results of each sub-question will function as input for
next steps in this study, and will provide useful parameters for other similar studies. The table below
provides a shortcut to these questions in their respective sections.
Table 2 Shortcut to most interesting study results
Nr. Chapter Sub questions
2.3 Vulnerability - How vulnerable are the urban poor to flooding?
2.4 Exposure (asset value) - How exposed are the urban poor to flooding?
2.6 Expected annual damage per sector - What is the direct yearly impact of flooding to the urban
poor?
3.2 Identification of indirect damage - What are the indirect damage effects from floods to the
urban poor?
3.3 Survey in slums - Socio-economic characteristics of slum inhabitants
3.5 Indirect yearly flood damage - What are the indirect yearly impacts to the urban poor?
4.4 Damage mitigation - How does aid help in mitigating flood damage?
5 Policy actions - What policies increase urban resilience?
6 The perfect flood measure - What is the break-even investment value of a
hypothetical flood measure?
7 Conclusion - What is the total yearly damage to the urban poor due to
floods in Jakarta?
1.1.4 Reading guide
Chapter 2, Direct yearly damage from rain flooding, is a methodological chapter on flood damage
calculation. This chapter describes the effect of yearly floods in Jakarta with special emphasize on
the urban poor. Chapter 3, Indirect yearly damage from rain flooding, focusses on the identification
and estimation of indirect costs from floods to the urban poor. Next to damage, there is also aid.
The aid component will be discussed in chapter 4, Damage mitigating factors, and will provide
background information on the various aid providers. Secondly it will go into the location of aid,
restrictions to provide aid and what effect the aid has on the urban poor. Chapter 5, Policy actions
for increasing urban resilience to natural hazards, provides information on various methods –and
best-practices for policy makers and local communities to improve urban resilience to natural
hazards. The perfect flood measure, chapter 6, calculates the break-even point of a hypothetical
flood measure investment and reflects on the effects of using different discount rates Chapter 7,
Conclusion, will combine all results from the sub questions and provide an answer to the research
question.
10
2 Direct yearly damage from rain flooding
The capital city of Indonesia, Jakarta, is threatened by severe floods on a yearly basis. These
floods cause significant damage to housing, offices, infrastructure, public goods and also disrupts
society. That floods are costly for society can be derived from this, it is however important to have a
reliable estimate of the yearly costs. This estimation is important for the government, for
investments in future flood reduction; for industries, flood location influences their location choice;
and for civilians, they relocate if possible to more desirable locations.
This chapter first describes the methodology used to determine the direct (property value of build-
up goods and other property (laptop/electricity system)) damage of floods, as developed by Meyer
and Messner in 2006 as part of the EUs 6th Framework Program FLOODsite. The intermediate
steps and changes made to the used data/parameters are discussed and from this input the
average yearly flood damage is calculated. The distribution of the total costs over the various ‘large’
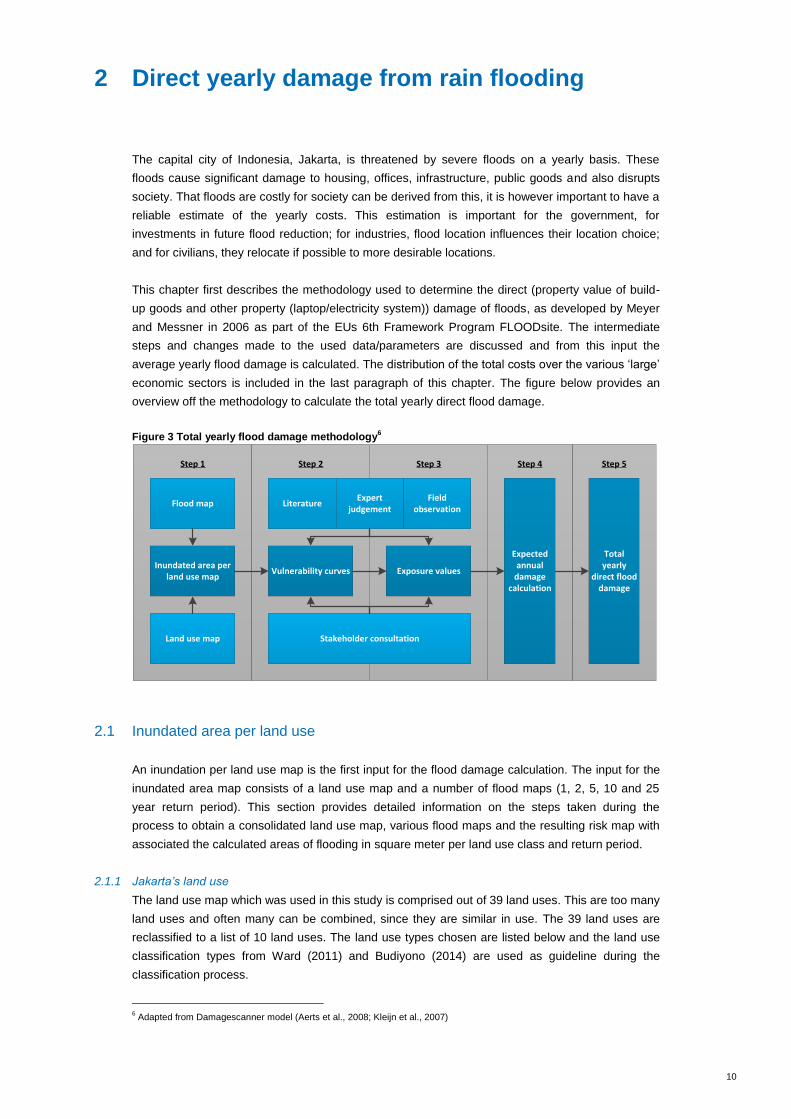
economic sectors is included in the last paragraph of this chapter. The figure below provides an
overview off the methodology to calculate the total yearly direct flood damage.
Figure 3 Total yearly flood damage methodology6
Step 5Step 4Step 3Step 2Step 1
Flood map
Land use map
Vulnerability curves Exposure valuesInundated area per
land use map
Stakeholder consultation
LiteratureField
observationExpert
judgement
Expected annual
damage calculation
Total yearly
direct flood damage
2.1 Inundated area per land use
An inundation per land use map is the first input for the flood damage calculation. The input for the
inundated area map consists of a land use map and a number of flood maps (1, 2, 5, 10 and 25
year return period). This section provides detailed information on the steps taken during the
process to obtain a consolidated land use map, various flood maps and the resulting risk map with
associated the calculated areas of flooding in square meter per land use class and return period.
2.1.1 Jakarta’s land use
The land use map which was used in this study is comprised out of 39 land uses. This are too many
land uses and often many can be combined, since they are similar in use. The 39 land uses are
reclassified to a list of 10 land uses. The land use types chosen are listed below and the land use
classification types from Ward (2011) and Budiyono (2014) are used as guideline during the
classification process.
6 Adapted from Damagescanner model (Aerts et al., 2008; Kleijn et al., 2007)

11
Table 3 Jakarta land use distribution, excluding slum area
Land use class (old) Percentage of total land area Jakarta (%)
Industry and warehouse 14%
Commercial and business 13%
Government facility 4%
Transportation facility 18%
Education and public facility 4%
Residential area 32%
Forestry 7%
Swamp, river and pond 5%
Park and cemetery 4%
Agriculture and open space 0%
Total 100%
Incorrect land use classification
The base land use map contains two classification errors, see figure 5 below. There are two large
grey spots (yellow) which represent the land use class ‘road’, these areas are misclassified and
need to be corrected. This issue is solved by determining a ‘standard’ land distribution area in
Jakarta with similar surroundings as both error areas. This standard land use area is circled in
green.
Figure 4 Incorrect land use classification
7
7 The yellow circles are errors in the base map; the green circles distribution of land use is used to correct for this.

12
The land use is corrected by determining the average land use per land use class (in percentage)
of the green area and replacing the grey areas land use with the ‘standard’ land use percentages
distribution. The land use correction has been done mathematically and not visually.
Land use class: Slum
In current land use maps provided by the Jakarta planning agency slums are not identified as a
land use. Since at least 17.5% (1.8 million people) of Jakarta’s citizens are counted as urban poor
and live in slums, this map is not correct. A land use map correction is needed. In 2008, BPS
identified slum areas in Jakarta by surveying leaders of RW’s (inner-city district supervisors). They
were interested which areas of an RW could be counted as a rich-/poor slum according to the head
of the respective RW. This information, including geographic coordinates of perceived slum
locations, was used during a study by Universitas Indonesia (Nursidik, 2012). In collaboration with
Universitas Indonesia the slum location has been geo-referenced onto the base land use map, slum
land use makes up roughly a third of north-Jakarta in the new land use map, see below:
Figure 5 Location of slum area in Jakarta, enlarged map on the right side: red is slum area
The above map shows the city of Jakarta on the left side and (enlarged) on the right side the slum
land use in red. The right map, depicting slum area, shows only what is slum (red) and what is
another land use class (white). The 2008 BPS study shows that the assumption, namely that the
current land use map is incorrect, is valid and that the land use: slum, should be added. The final
land use map is created by assuming that the slum land use area (study area) is truer than any
other ‘old’ land use. Therefore it replaces the old land use with slum land use when they overlapped
in north-Jakarta, see map below.

13
Figure 6 Old land use and final land use map including slum (orange)
After reclassifying, correcting and inserting slum as a land use (both in our study area and
extrapolating the slum land use to DKI Jakarta) the following land use distribution follows (Table 4).
Table 4 Jakarta land use distribution, including slum area
Land use class (new) Study area (%) Rest of Jakarta
area (%)
Total for DKI
Jakarta
Slum area 28% 26% 27%
Industry and warehouse 4% 8% 7%
Commercial and business 13% 9% 10%
Government facility 4% 3% 3%
Transportation facility 13% 13% 13%
Education and public facility 3% 4% 3%
Residential area 24% 20% 22%
Forestry 3% 8% 6%
Swamp, river and pond 3% 4% 4%
Park and cemetery 4% 4% 4%
Agriculture and open space 0% 1% 1%
Total 100% 100% 100%
2.1.2 Jakarta’s floods
A flood map shows inundation depth and should be available for various return periods. The
inundation maps (1, 2, 5, 10 and 25 year return periods) for Jakarta are produced by the Flood
Hazard Mapping framework (FHM), developed by Deltares in 2007 and 2009. There are maps
available for the flood hazard situation before- and after the implementation of the 2010 flood
adaptation measures. For this study the flood maps for the situation after 2010 are used. The FHM
framework includes a hydrological and hydraulic model of the Ciliwung River integrated with an
overland flow model of the province of Jakarta (DKI). The framework is used by and updated in
close communication with stakeholders in Jakarta (i.e. local office of Public Works (PU DKI) and the
office for Ciliwung Cisadane management (BBWSCC)). The hydrological and hydraulic processes
are computed using the SOBEK model. The flood map from Deltares, SOBEK model, for the dike
and rain intensity situation after 2010 is one of the main inputs when developing the flood maps.
These flood maps give information on the height- (0cm – 250cm) and the location of the flooding.

14
The SOBEK model is used for flood forecasting, optimization of drainage systems, control of
irrigation systems, sewer overflow design, river morphology, salt intrusion and surface water quality.
The components within the SOBEK modeling framework simulate the complex flows and the water
related processes in almost any system. The one and two dimensional (1D/2D) hydrodynamic
engine works with the complete Saint-Venant Equations, including transient flow phenomena and
backwater profiles (Stelling and Verwey, 2005). The hydrodynamic engine has an automatic drying
and flooding procedure that is 100% mass-conservative. The engine can deal with steep canals
with supercritical flows, moving hydraulic jumps and complex interloped water systems.
In the FHM framework, all major rivers discharging to Jakarta Bay are included in a 1D network for
the computation of water levels and discharges. A 2D grid is included for the computation of
overland flow in case 1D embankments are overtopped. The overland flow model uses grid-cells of
50x50m at the Ciliwung floodplain and 100x100m for the rest of the Jakarta province. To force the
1D model, a library of Rainfall Runoff (RR) models is available in SOBEK. In the Ciliwung
catchment the Sacramento model (Burnash, 1995) is used to generate runoff for 449 sub-
catchments from rainfall and evaporation records. Sacramento discriminates an upper zone and
lower zone for the computation of quick (e.g. surface runoff) and slow (e.g. base flow) runoff
components. Incorporation of both quick and slow runoff components is important for a proper
simulation of major flood events. Such events are characterised by days or weeks of wet conditions
increasing baseflow and an extreme rainfall event at which river and canal embankments are
overtopped (Budiyono et al., 2014).

15
The figure below gives information on the effect of floods with a different return period. (no
distinction in flood height is made, only distinction in area affected by a flood depending on the
return period).
Figure 7 Flood map with various return periods

16
2.1.3 Jakarta’s locations at risk
The above section described both the steps taken to create both a consolidated land use map and
the inputs on which the flood map is based. To create the inundated area per land use map both
the land use and flood map are combined, see below:
Figure 8 Jakarta inundated area per land use Map
(Flood height is shown in cm, total of 13 land use classes as described in section 2.2.2 are
reclassified to 8 classes to improve visibility)

17
With the above map the flooded area per land use class can be calculated using zonal statistics
from ArcGiS. With the zonal statistics technique one can calculate statistics on values of a raster
within the zones of another dataset, making it possible to determine the risk area8.
Figure 9 Zonal statistics
The output of the risk map zonal statistics informs per land use class and flood event (different
return periods) the square meter area per flood height (indices of 25cm) for Jakarta. These values
are the base inputs for step 2: Vulnerability.
2.2 Vulnerability to floods
The risk area estimation results provide a certain square meter of flooded area with various flood
height. The second input part of this analysis is vulnerability, which provides information on the
susceptibility to being damaged by a natural hazard (flood damage per height in centimetres for
instance). First the concept of vulnerability is described and second the used methodology to
estimate the vulnerability of slum land use is set out in detail.
The concept of vulnerability explained
Vulnerability is the factor that corrects/reduces the area of total flooding to the percentage of this
area which is actually reaching the maximum damage, see next section, for this land use class. 0
percent vulnerability means that no damage will occur, this is equal to 0 centimetre of flood height.
100 percent vulnerability means that the entire building and all its good are destroyed.
For example:
A commercial land use will have high initial (low flood height) vulnerability, due to costs relating
to hardware and the fact that people can not access the building.
A residential land use will have a medium initial vulnerability, due to the fact that many hardware
can be placed easily to the second floor (fridge) and an increase in vulnerability if the water
reaches the second floor.
The figure below gives an overview of some of the vulnerability curves, based on a workshop
consultation, conducted in previous research, focussing on Jakarta’s vulnerability to flood9:
8 Both land use map and flood map computations are made using 0,5 square meter grid cells, this greatly increases accuracy
when calculating flooded land use- and flood height per land use values. 9 See annexes for a full overview of used vulnerability curves
Land use Flood area Inundated area per land use

18
Figure 10 Vulnerability curves for Jakarta
(source: adapted from Budiyono et al, 2014)
Vulnerability to flood in slums
As stated earlier, all land use classes have their own type of vulnerability and corresponding
vulnerability curve. This does however not mean that all vulnerability curves are known or
geographically coherent. The focus of this study is the effect of floods on urban poor and there is
currently no vulnerability curve available for this population group/land use class. Below we will
describe the methodology used to estimate the vulnerability curve for this group.
Figure 11 Slum vulnerability estimation
Step 3Step 2Step 1
Literature
Field observation
Stakeholder consultation
Worldbank
RHDHV
HOPE Indonesia
BPPT
BPBD
Expert judgementSlum
vulnerability
Rich Slum
Poor Slum
Step 4
Discus-sion of Results
An input for the vulnerability estimation comes from a conducted literature study. As shown in
Figure 10, there are some vulnerability curves available specifically for Jakarta. Next to these
vulnerability curves for Jakarta more general vulnerability from de Standaardmethode Aerts/de
Moel are used. There are currently no vulnerability curves which describe how different flood
heights affect damage to slum valuables and housing. The next steps describe in what way the
vulnerability curves for slum are estimated.
cm
%

19
As described in section 1.1.2, there are two different kind of slums, with possibly a different level of
vulnerability. Based on field (survey) observations the research team was able to verify the
existence of two different kinds of slum, the “rich” slum and the “poor” slum. The criteria below
explain the differences between the rich- and poor slum:
Rich slum: 1. Availability of a second floor which can be used to store goods on during a medium
flood, 2. Relative stronger building material (such as bricks), 3. Relative stronger community, which
can be used to aid in reconstructing works and providing financial/other required aid.
Poor slum: 1. Almost no houses with a second floor to store valuable goods, 2. Very low quality
building materials (mainly wood, cardboard), 3. Easily damage property, mainly due to not having a
second floor and storage facility elsewhere10
.
Based on the literature study, field observations and the availability of a vulnerability curve for urban
kampungs (Budiyono et al, 2014), a vulnerability curve for the rich- and poor slum land use, which
has as goal to provide stakeholders with a starting point during the discussion part of the
stakeholder consultation round, could been constructed.
There are many institutions in Jakarta who are working with, in or for the slum population. These
institutions have a very good understanding of life in slums and how slums are affected during
floods. For this reason various stakeholders were contacted for a consultation, namely: the
Worldbank, HOPE, BPPT, BPBD and RHDHV which is operating as one of the partner in the
NCICD program. During the consultations the stakeholders were informed on the hypothesis, goal
and objective of this study, the state of affairs and how the expert judgement on the vulnerability
curve for rich- and poor slums was derived. The stakeholders commented on the preliminary
vulnerability curve and gave their opinion based on their longstanding field expertise.
The information from the consultations and field surveys are used to construct an estimation of the
vulnerability curve for both rich- and poor slums, see below.
Figure 12 Slum vulnerability curves
(note: horizontal graph depicts flood height in cm, vertical graph the percentage of house affected
by flood, according to stakeholders it barely occurs that a household completely gets destroyed,
hence not 100% of vulnerability)
Figure 12 shows that a rich slum is less vulnerable than a poor slum. There are according to
consulted stakeholders three main reasons for this disparity:
1) The option to store valuable goods at the second floor is only available to the rich slum houses.
This results in a lower maximum vulnerability at high flood heights. 2) Moving valuable goods to a
different “safe” location. This option is not available to poor slums, since their neighbours also have
no possibility to store goods safely. This results in a high increase in vulnerability when floods reach
10
See annexes for pictures showcasing the rich- and poor slum differences.
%
cm

20
over 150cm height. 3) Flood mitigation measures, like building the entrance to your house at higher
elevation, is an option only available to the rich slums. This results in no flood damage at low flood
heights.
2.3 Exposure to floods
The risk area provides us with a certain square meter (sqm) of flooded area with a variating flood
height. The second variable in this analysis is vulnerability, which provides information on the
susceptibility to being damaged by a natural hazard, a flood for this study, and reduces the total
damage effect of floods considerably. The third input to calculate the direct flood damage is to
combine the land use (sqm) and exposure of this land use per sqm. This setion describes first the
concept of exposure (asset value) and secondly the methodology used to estimate the exposure of
slum land use.
The concept of exposure explained
Exposure, or asset value, is a parameter of total potential damage that can be reached because of
a flood for a certain type of land use. The definition of exposure however is very diverse in use and
there is need to clearly define the definition used in this study. The used exposure definition in this
study takes the damage to buildings, contents and infrastructure into account11
Table 5 Exposure- / land use values, various land use classes
Land use class Exposure (*1000$/ ha12
)
Industry and warehouse $ 517.90
Commercial and business $ 517.90
Government facility $ 517.90
Residential area $ 231.6013
Transportation facility $ 331.50
Education and public facility $ 259.00
Forestry $ 10.40
Swamp, river and pond $ 3.80
Park and cemetery $ 3.10
Agriculture and open space $ 2.00
(Source: adapted from Budiyono et al, 2014)
The above table in an example:
If an area of 2.5 hectare government facility, after vulnerability reductions, is flooded that the
total damage will be: $517.90 * 1000.- * 2.5 = $1,294,750.-.
If an area of 2.5 hectare agriculture and open space, after vulnerability reductions, is flooded
that the total damage will be: $2.00 * 1000.- * 2.5 = $5000.-.
As stated earlier, all land use classes have their value and corresponding exposure value. For slum
land use there are no housing values available and thus also no exposure values. A similar
methodology as described in the vulnerability section to estimate these values is used.
11
These are direct tangible damages (Physical damage to assests), see Penning-Rowsel et al., 2003; Smith and Ward 1998 12
Inundated area per land use is also calculated in ha / land use class 13
Combination of 3 land use class exposure values, because in the land use map available to this study there was one
dominant land use, residential area.

21
Figure 13 Slum exposure estimation
Step 2Step 1
Literature
Stakeholder consultation
Worldbank
RHDHV
HOPE Indonesia
BPPT
BPBD
Field observation
Step 3
Slum exposure
Rich Slum
Poor Slum
Step 4
Discus-sion of Results
The input for the slum exposure value estimation are the exposure values derived from literature.
The exposure value for high density urban kampung (Budiyono et al., 2014) is the land use class
which has the most similarities between rich- and poor slums. Since for one there is great similarity
between the housing conditions of the urban kampung and slum based on field observations and
secondary when reclassifying urban kampung to slum land use (section 2.2.1) it is found that the
new slum land consists of 54% of old urban kampung land use.
There are many institutions in Jakarta who are working with, in or for the slum population. These
institutions have a very good understanding of life in slums and how slums are affected during
floods. For this reason various stakeholders for a consultation were contacted, namely: the
Worldbank, HOPE, BPPT, BPBD and RHDHV which is operating as one of the partner in the
NCICD program. During the consultation with stakeholders the exposure values, in addition to the
earlier discussed vulnerability values, for rich- and poor slums were discussed. The stakeholders
were informed on the exposure value of high density urban kampung, which was estimated through
a multi-stakeholder consultation in an earlier study, and requested from them how much percentage
of this value would be a correct value when taking the rich- and poor slum respective conditions into
account. The stakeholders had pictures of the field observation and their own knowledge as
additional inputs. The input from stakeholders is used to provide an estimation of exposure values
for both rich- and poor slums, see below.
Table 6 Exposure- / land use values, rich- and poor slum
Land use class Exposure (*1000$ / ha)
Rich slum $ 124.30
Poor slum $ 27.20
Table 6 shows that a rich slum has a higher exposure than a poor slum. There are according to the
stakeholders two main reasons for this disparity, namely: 1) The cost of a house in a rich slum is
considerable more expensive/built-up with more expensive materials compared to a house in a
poor slum. 2) There are more durable goods in a rich slum house then in a poor slum house, and
these goods lead also to a higher exposure value. During the consultation session it was apparent
that a rich slum house is not too different to an urban kampung when taking location, housing
material and a second floor into account. The main characteristic that divides these two groups of
society are wage and education. The rich slum house had an exposure level between 70-80%-,
whereas a poor slum house was worth between 20-30% of a high density urban kampung house.

22
2.4 Expected annual total damage
An integral part of flood damage calculation is the calculation off the statistical total yearly expected
damage. This is important, since the various weather events, like for instance a once in a hundred
years flood, are monstrous in damage but are off less significance when calculating the yearly
costs. This section will first set out the calculation steps and use this calculation to estimate the
expected annual flood damage.
The average annual damage, or yearly expected damage, can be estimated by the expected yearly
damage approach14
.
D̅ = ∑ 𝐷[𝑖]
𝑘
𝑖=1
∗ 𝛥𝑃𝑖15
D[i]̅̅ ̅̅ ̅ = 𝐷(𝑃𝑖−1) + 𝐷(𝑃𝑖)
216
Where:
ED = Expected total damage
D = Damage in return period year X
ΔP = Incremental probability or frequency
∑ = From 1 to the total number of incremental probabilities
The figure below is an indicative graph of the change from flood damage to expected annual flood
risk. Below in table 7, the calculation using information from steps 1 to 3 has been used to calculate
expected annual flood damage for Jakarta.
14
Meyer, 2007 15
= expected anual damage 16
= mean damage of two known points of the curve

23
Figure 14 Calculation of Expected Annuel Damage (EAD) (adapted from Meyer, 2007)
Table 7 Expected annual damage, total Jakarta after 2010 flood events17
Return period (years) Incremental probability Total damage of an X
year flood (*1000 USD)
Expected annual
damage (*1000 USD)
1 - $182,976 -
2 0,500 $246,857 $153,202
5 0,3 $343,312 $96,045
10 0,1 $412,551 $54,959
25 0,06 $513,018 $30,888
50 0,02 $600,549 $16,266
100 0,01 $682,894 $9,420
200 0,005 $764,749 $5,326
>200 0,005 - $3,824
Total 1,00 $3,746,906 $369,930
The total yearly expected direct damage of floods in Jakarta is roughly 370 million / year. In the next
section this value is broken down to the yearly damage per land use class.
2.5 Total yearly direct damage from rain floods Jakarta per land use class
The goals off this study is to estimate the yearly damage from floods to the urban poor in Jakarta. A
large part of this damage comes from the damage to housing and valuable goods. This section
described the methodology steps taken to calculate the damage to housing and valuable goods to
the main land use types in Jakarta. The flood damage to the whole of Jakarta is calculated to
17
The flood damage values for 50, 100 and >100 year are extrapolated values of the flood damage for the years 2, 5, 10, 25.
Extrapolation corrections have been made to better estimate future damage
24
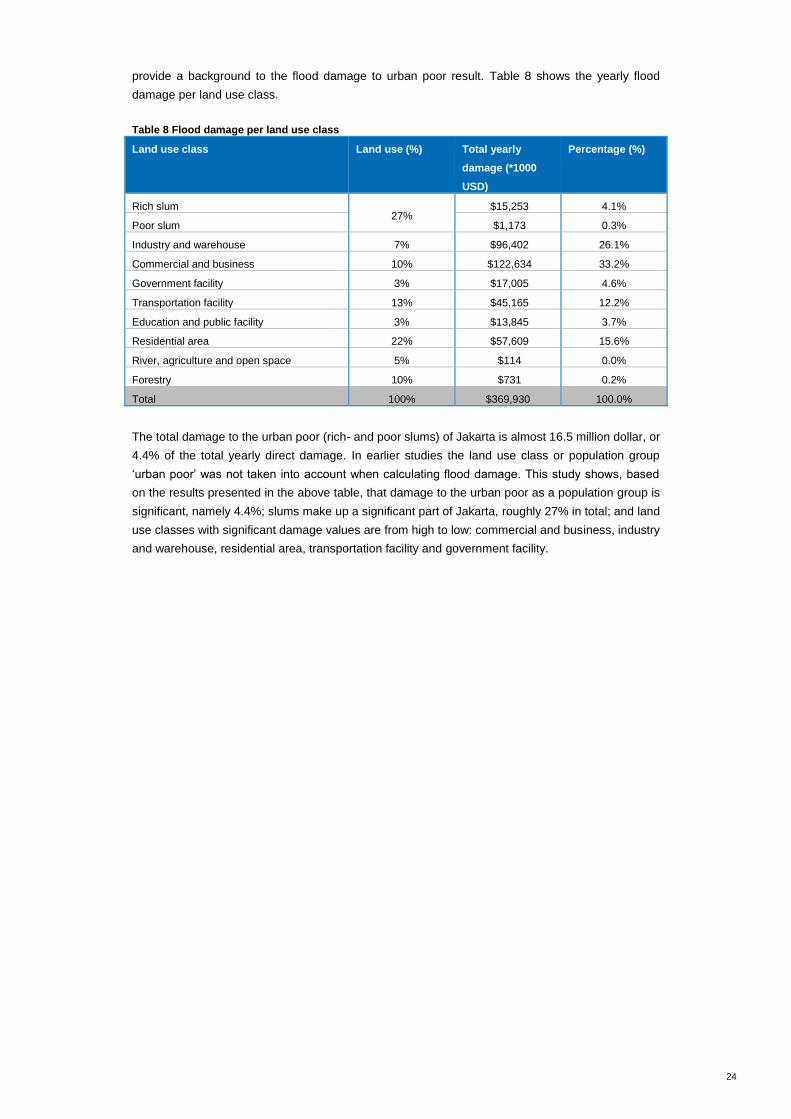
provide a background to the flood damage to urban poor result. Table 8 shows the yearly flood
damage per land use class.
Table 8 Flood damage per land use class
Land use class Land use (%) Total yearly
damage (*1000
USD)
Percentage (%)
Rich slum 27%
$15,253 4.1%
Poor slum $1,173 0.3%
Industry and warehouse 7% $96,402 26.1%
Commercial and business 10% $122,634 33.2%
Government facility 3% $17,005 4.6%
Transportation facility 13% $45,165 12.2%
Education and public facility 3% $13,845 3.7%
Residential area 22% $57,609 15.6%
River, agriculture and open space 5% $114 0.0%
Forestry 10% $731 0.2%
Total 100% $369,930 100.0%
The total damage to the urban poor (rich- and poor slums) of Jakarta is almost 16.5 million dollar, or
4.4% of the total yearly direct damage. In earlier studies the land use class or population group
‘urban poor’ was not taken into account when calculating flood damage. This study shows, based
on the results presented in the above table, that damage to the urban poor as a population group is
significant, namely 4.4%; slums make up a significant part of Jakarta, roughly 27% in total; and land
use classes with significant damage values are from high to low: commercial and business, industry
and warehouse, residential area, transportation facility and government facility.

25
3 Indirect yearly damage from rain floods in slums
Floods disrupt Jakarta on an almost yearly basis. There are several negative effects from these
floods, of which one is the direct damage to housing and goods. Next to this effect there are other
perhaps less clearly defined direct costs from rain floods. All layers of society will encounter some
indirect damage from floods, this chapter will focus solemnly on the urban poor. This chapter will
first identify which indirect economic costs can be caused by long severe floods and secondly set
out the used methodology to identify the volume of these costs and in the end provide a summary
of the indirect yearly damage from rain flooding to slums. The figure below provides an overview of
the methodology to calculate the total indirect yearly flood damage.
Figure 15 Total indirect yearly flood damage methodology
Step 2 Step 5Step 4Step 3Step 1
Literature
Stakeholder consultation
Survey
Field observation
Identification of additional costs
Total additional
yearly damage
from rain floods
Survey results
Loss of income
Costs of sickness
Costs of cleaning
3.1 Identification of indirect costs
Floods causes damage to houses and valuable goods, but it can also affect ones ability to work,
health status, number of social interactions and the ability to travel over long (-or short) distances.
Different layers of society might have different negative effects caused by a flood. This section will
identify- and quantify the indirect negative effects caused by floods which affect the part of the
population residing in slums.
Inability to work
The first, and probably, the largest indirect damage effect are the costs that are caused because a
person can not work or can work less. In a slum the day’s wage is oft spend on the same day for
clothes, food, housing (rent) and other immediate needs. This is the main reason that they do not
have much savings, the other reason is that they can not open a bank account. When you combine
this with the fact that only around 12% of the urban poor have a fixed job, with a monthly stable
wage independent of weather conditions, it leaves 88% of the urban poor who live on an almost
day-to-day salary. As stated above, a large portion of the urban poor do not have a fixed job and a
strongly variating day-to-day income. It is commonly believed that slum inhabitants can not provide
correct estimates of their income as it varies to much; are not willing to provide correct information,
since they are afraid of additional taxation; and it is believed that a large part of goods are not sold
using currency but rather by means of trade (for other goods or services).Therefore earlier studies

26
have focussed on the expenditures of urban poor, rather than income, since these are assumed
easier to measure and provide a better indication of their true income. Based on the Worldbank,
2011, study the expenditure for the urban poor is 17,750 ruppia / day, which is around $1.52 dollar /
day.
In this study the focus is on the actual income level, by asking a minimum and maximum family
income level. Of these values we will take the average and hereby have the household income, or
per person income, since we also use this technique on household size. The Worldbank 2011
expenditure rate is used as a validation measure, to control our income per person / household
estimate. The income result from this study should not deviate more than 10% from the expenditure
value to be accepted as an unbiased result. The income estimate will be used in combination to the
inability to work results from the survey to calculate the effect of a flood on household / person
income levels.
Costs of being sick
Floods causes water to climb out of the riverbed and move into the residential area. Since slums
are often located closest to the river basin, their houses and living space is flooded the most. A
flood in Jakarta can last days and on some occasion even weeks up to a month. And during this
time all debris, with bacteria, is spilled out from the sewers into the living area of slum residents.
The people who live in this area see additionally their space in their own house or the shelter
location crowd up. These conditions are optimal for spreading diseases like typhoid, dengue and
various viruses. When determining the costs of being sick one can discern two types of costs,
namely direct (medicine- and hospital bills) and indirect (inability to work). A study conducted in the
slums of Chennai, South India provides empirical results on the costs of being sick. In this study
they investigated the costs of being sick in proportion to household income. Their results, from the
slums of Chennai, are comparable to the slums of Jakarta and will be one of the main inputs in this
studies costs of illness due to a flood calculation. The second input is a calculation of the number of
people actually getting sick because of a flood. In 2011 the Worldbank did a research on the
environmental effects of floods and one of their survey results was that 6.2% of the slum population
gets sick during/after a flood. During the survey the actual income will be discerned (see inability to
work section), further it will be check whether the effect of illness is a serious issue and if this has a
considerable effect on purchasing power according to the urban poor.
Cleaning your neighbourhood/house
The rain floods in Jakarta are often caused by both heavy rainfall in and above Bogor/Depok and in
Jakarta. These floods take in their way down to the ocean a lot of debris and silt along. When a
severe flood enters a slum, much of this debris and silt is brought into the slum. In the aftermath of
such a flood, after the river returns to its normal state, much of the debris and silt stays behind as it
is heavier than water. Residents of slums see it as their task to clean up their own living area (note:
there is also no public authority responsible to do it for them). This task is heavy labour and often
performed by the young and strong off the neighbourhood/household, prohibiting them to continue
with their various “normal” work. An educated guess will be provided due to lack of information on
this topic, based on field observations and stakeholder consultations, on how much time and
associated costs are consumed by this activity.
3.2 Survey in the slums of Jakarta
There are two reasons to conduct a survey. First to obtain first-hand data and second to increase
knowledge on the topic at hand through a field observation. The first-hand data focussed mainly on
estimating the effect of a flood on the possibility, or rather the impossibility to work and confirming

27
the average wage level of urban poor in the slums (Rashid, 200718
). The field observation mainly
focussed on the distinction between the rich- and poor slum classification.
The survey locations, see figure 16, are spread over the city based on the following two principles:
Location near a riverbed (GiS flood map); and a good distribution over the various slum areas of
Jakarta (Gunadarma University).
Figure 16 Survey locations
Over a period of 5 weeks the research team, assisted by Gundarma University, conducted short
interviews with 46 households. The average age of the study group was 45 years old and consisted
of a mix of both man and women. Although the study group consists of a mix, the more dominant
sub-group who participated in the interviews were mothers and older men. In the table below the
main interview results have been set out. Next to this results from similar studies are provided,
which show that with a response rate of 46, significant results can be obtained.
Table 9 Slum survey results
Question Survey average Literature comparison
Number of people in the household 5.2 people 5 (Worldbank, 2013)
Household monthly income $ 224.- dollar 19
Less then $ 293.- dollar
(Worldbank, 2011)
Loss of income per household,
because of a flood in the last 5 years
$13.84 dollar -
18
Lessons on conducting a survey in a slum, regarding questions and what information is more/less relevant, were taken from
Rashid et al., 2007 19
Exchange rate Indonesian ruppia to dollar, 29-08-2014
Legend:
1. Kampung Pulo
2. Kebon Melati
3. Pasar Baru
4. Cilincing
5. Koja
6. Kampung Melayu

28
Question Survey average Literature comparison
Income per person / day ;
expenditure per person / day
$ 1.54 dollar income per day (within
10% expenditure range)
$ 1.52 dollar expenditure per
day
Number of in-house floods in last 5
years
4.9 times -
Flood duration 4.3 days In 50% of flood events the water
resided over 24 hours in a
house (Worldbank, 2011)
Flood height in-house 1.1 meter high in the house -
Effect on possibility to work 41% less able to work 68% less able to work
(Worldbank, 2011)
Most heard problems caused by
floods
- Damage to the house and need
for repairs.
- Not being able to go to work.
- Sickness due to the flood.
- To much time spent cleaning the
house and streets afterwards.
- Many goods are damaged.
- Problems with transportation to
work.
People responsible for waste
collection did not do their task
according to 74% of the
respondents, leading to high
volumes of waste. (Worldbankd,
2011)
Often damaged goods Mattress, fan, tv, dvd player,
clothes, chair, floor and walls,
waching machine, refrigerator,
motorcycle, cupboard and chairs
-
3.3 Indirect yearly flood damage calculation per topic
Loss of income
To calculate the loss of income to the urban poor the following study results were combined:
The total yearly direct flood damage, chapter 2 – section 5, for rich- and poor slums for all return
periods.
The affected area for all return periods, the total slum land use with which we calculated the
percentage of affected slum land use.
Inputs 1 and 2 are used to calculate the number of urban poor in Jakarta affected yearly by the
floods.
The number of flood days, on average, per year and time in which a person was not able to
work because of a flood (2.04 days).
The number of people who do not have a fixed income (88%).
When combining these numbers the total damage, caused by the inability to earn income, adds up
to $1,254,330 dollar, affecting 537.150 urban poor. When dividing the total costs over the number
of households (5.2 people per household) the total costs are $12.1420
dollar per household.
Costs of being sick
The calculation of direct- and indirect costs combines three inputs, namely the empirical findings of
the proportion of household income in the slums of Chennai, the effect of floods on illness in
Jakarta and the actual income in the slums of Jakarta. The results are presented in a table below:
20
This number is slightly lower than in our survey results. In our study results we were not able to correct for a person who has
a fixed job and is therefore not income wise affected by a flood.

29
Table 10 Flood costs, illness
Input Rich slum Poor slum Total urban poor
Portion of income
- Direct 4.0% 15.3% 22.1%
- Indirect 3.2% 6.8% 7.2%
Monthly household income Less than $330.- Less than $56.- $224.-
Number of people affected 381,380 155,775 537,155
Number of people falling ill 13,817 5,527 19,334
Total cost $328,303 $99,972 $428,275
- Av. Per person / year $0.86 $0.64 $0.80
- Cost if sick / household $23.76 $12.38 $20.46
The total costs are split out in above table to average healthcare costs due to floods per
person/year, to show the yearly average small effect on purchasing power. The cost per household,
if the main income owner is sick, are also shown to show the effect that being ill has on one
household (assuming that the income is owned by one person of the household).
Costs of cleaning
In the aftermath of a flood event, which affects the house and living conditions of the urban poor on
an almost yearly basis, the neighbourhood needs to be cleaned. This task will not be taken up by
government institutions, since many urban poor live illegally (and do not pay taxes). Therefore the
residents of the kampung need to work together to clean their own indoor- and outdoor living space.
This task consumes time, which otherwise could have been used to work and earn a day’s wage.
Stakeholder consultation, interviews with locals and field observations provide input for an educated
guess on the amount of time needed to clean the neighbourhood after a significant flood. The
estimated time needed to clean the living area is 4 days with full contribution from all the
households. In monetary terms this sums up to $825,165.
3.4 Total indirect yearly flood damage to the urban poor
The goals off this study is to estimate the yearly damage from floods to the urban poor in Jakarta. A
large part of this damage comes from the damage of not being able to work, sickness and time lost
due to cleaning of the living area after a flood. This chapter described the methodology steps taken
to calculate the damage off not being able to work, sickness and time lost due to cleaning of the
living area after a flood to the rich- and poor slum residents in Jakarta. The table below shows the
indirect yearly flood damage for rich- and poor slum households.
Table 11 Indirect damage from floods to the urban poor in Jakarta, per household, per year
Name Rich slum Poor slum Total slum
Number of people
affected
383.680 153. 70 537.150
Number of households
affected
73.780 29.510 103.300
Cost of inability to work21
$15.9 $2.9 $12.1
Cost of falling ill $23.8 $12.4 $20.5
Cost of cleaning $41.8 $7.5 $32.-
Household total $81.5 $22.8 $64.6
21
Correction has been made for people with a fixed monthly income, 12% of slum population.

30
Name Rich slum Poor slum Total slum
Total $6,013,070 $672,830 $6,673,180
The total indirect damage to the urban poor (rich- and poor slums) of Jakarta is almost 7 million
dollar, of which 90% to the rich- and 10% to the poor slum residents. The land use class or
population group ‘urban poor’ has not been taken into account when calculating flood damage in
earlier studies. This study shows, based on the results presented in the above table, that there is a
significant indirect damage affect, almost 7 million dollar; the damage per household is considerably
high when compared to the household income; and that there is a large difference in total indirect
damage between the rich and poor urban poor, caused mainly by their difference in income.

31
4 Damage mitigating factors
There are many institutions, both public and private, who provide aid during a flood. The first and
foremost institution who provides flood aid (or hazard aid in general) is the BPBD (Jakarta Disaster
Mitigation Agency), supported by the BNPB (National Agency for Disaster Management). Other
hazard / flood aid providers are various NGO’s (Non-Governmental Organisations), CSR
(Corporate Social Responsibility) actions by large companies and many various local projects.
These institutions, companies and local aid providers provide aid to the citizens of Jakarta after it
has been struck by a major flood and/or other hazard. The various aid providers all operate in a
different way, have different goals and this chapter will describe their activities shortly. Further, this
chapter deals with the question what part of the flood damage is flood aid mitigating. Section 4.3
provides a consolidated overview of all impacts and mitigation measures to the urban poor of
Jakarta related to yearly rain floods, both on city and household level. The figure below provides an
overview off the methodology used to identify mitigative actions focussed on reducing flood impact
to the urban poor.
Table 12 Flood damage mitigating factors methodology
Step 2Step 1
Aid projects in slumsIdentification of aid
providers
Step 3
Total damage mitigating effect of flood aid in slums
Location Restrictions
Results
Direct damage mitigating
effect
Additional damage
mitigating effect
Description of aid provider
CSR Local projects
BNPB/BPBD NGO’s
4.1 Identification of aid providers: description of aid provider
Name Description
BNPB / BPBD The BNPB / BPBD, or government agencies of respectively Indonesia /
Jakarta who focus on hazards, is the authority on hazard mitigation. They
have as main tasks to regulate logistics, provide first aid safety to citizens,
maintain flood gates and dikes, collect flood data and inform other
organizations and institutions on the severity of the hazard.
Non-
Governmental
Organisations
There are many NGO’s operating in Indonesia. Projects carried out by these
NGO’s are various and focus on many different topics. Some off these topics
are: info-/ education, healthcare, micro-financing, hazard mitigation- ,
protection- and aid. During this research the contacted NGO’s are HOPE
Indonesia, the Worldbank Indonesia and IFRC (Indonesian Red Cross).
32
Name Description
Corporate Social
Responsibility
CSR, short for Corporate Social Responsibility is the combined term for
projects who have as goal to be socially responsible and which are financed
by large corporate firms (generally). When scoping this to flood aid, it means
that large corporations provide food, shelter, electricity or other
goods/services that help people in need.
Local projects There are in Jakarta many projects who are operated by local companies and
institutions. One should think of mosks, schools, garages, religious public
places (other than mosks) and personal houses. The local projects are
characterised by the following terms: non-profit, community based and partly
Government/NGO/CSR dependent (food supplier).
4.2 Aid projects in slums: location, restrictions and effect of aid given
Location of aid projects
BNPB / BPBD - The Indonesian government and DKI Jakarta work together to mitigate, during and
after a flood. Their actions are located in all flood struck areas, as is their obligation. The measures
taken however focusses first on safety and transportation, secondly on the business/economic
drivers and thirdly on the government and communities in the city.
Non-Governmental Organisations - NGO’s are often referred to charity organisations and a large
part of their budget comes from public-, corporate- and private donations. Donations to an NGO are
implicit donations to a charity and are meant for the poor, and in the case of DKI Jakarta operating
NGO’s to the urban poor.
Corporate Social Responsibility - Jakarta is the main business centre in Indonesia and a visible
location to have corporate headquarters when operating in Indonesia. The number of flood related
CSR projects in DKI Jakarta are therefore also numerous and spread out all over the city, since the
slum area is most often struck by floods this area is getting a large share of CSR aid.
Local projects - These projects are often in or close to flood struck neighbourhoods (and therefore
often in/near a slum) and are a safe location for local residents who can not live in their house for
an X amount of time. The regulation of the local projects is often administrated through the RT/RW
and is therefore also the lowest rung in Government/NGO/CSR aid distribution networks.
If people flee a flood struck area to further away located relatives it is counted as a local project.
Mitigation restrictions
BNPB / BPBD - The urban poor are an important part in the society and economy of DKI Jakarta.
But the urban poor are also often illegal immigrants from other parts of Indonesia. Their illegality
comes forward in three aspects:
1. They are not registered as official citizens and are therefore not documented, which leads to
one of the initial problems in this and other studies, namely: how many urban poor does Jakarta
(or any other metropolitan city with a slum) have.
2. They do not pay taxes, at all or without any income basis.
3. A share of urban poor live on illegal property (government ground such as riverbanks and next
to train tracks).
Due to the fact that they are illegal and live on not residential land the government does not feel
inclined to provide aid more than necessary to aid the urban poor in their most basic needs, such
as food and water. The government imposes a restriction of financial aid, needed for rebuilding
housing and repairing valuable goods, to the urban poor after a flood event.

33
Non-Governmental Organisations - NGO’s operate from donations and have often a yearly fixed
budget, with only small saving possibilities. An NGO can not predict whether this year or in ten year
a major flood occurs and are during a major flood event restricted by their budget in aid they can
provide.
Corporate Social Responsibility - The aid provided by CSR projects has, based on stakeholder
consultation and expert judgement, two goals. The first goal is to help people in high need. The
second goal is visibility, marketing, of the firm. The second goal restricts one to include CSR as a
pure aid input (cost wise).
Local projects - The local projects are dependent on donations, food and healthcare from
Government/NGO/CSR and volunteers who help their flood struck community members. If a flood
is very severe, then a local project providing shelter can become a hazardous location, since it is
often close to the living area of the people it is trying to help.
Effects of provided aid
BNPB / BPBD - The BNPB / BPBD provides next to food and water in some of the slums also
protection (military), logistics for government / NGO / local aid and a flood information network
(accessible by the RW/RT). The information provided by the BPBD is however on the level of the
total organisation, and as stated before, the BPBD provides their services to all land users of DKI
Jakarta. Therefore these figures are not detailed enough and can not be used to calculate the effect
that government aid has in slums.
Non-Governmental Organisations - The budget from NGO’s in DKI Jakarta is almost exclusively
used for the urban poor, although not exclusively to flood aid. During this study detailed input from
IFRC and HOPE Indonesia was provided, with information on their yearly spending’s on flood aid. It
was however not possible to determine their share of the total NGO flood aid spending’s.
Corporate Social Responsibility - The two-sided goal of aid, and the numerous small spread out aid
provided by CSR in Jakarta made it not possible to estimate an accurate figure of total yearly aid.
The CSR aid is therefore taken up as a PM22
post.
Local projects - Local projects have not identifiable benefits, since the food and healthcare are often
a top-down distributed from other aid providers and can not be contributed to local projects. Local
projects are standing alone in providing shelter, this good is not quantifiable, since the shelter
location does not have a market value. Simply put: school classes and mosks are normally not
rented to live/stay in. One can argue that a parking garage has costs, since no one can park here
during the time it functions as shelter, therefore local projects are taken into consideration as a PM
post.
4.3 Total damage mitigating effect of flood aid in slums
This chapter described the actions taken to estimate the damage mitigated through flood aid to both
rich –and poor slums in Jakarta. The above results show and explain why an adequate estimation
is not possible, which is mainly caused due to a lack of information. During interviews however it
became apparent that the various institutions who provide aid focus on providing food and safety to
the urban poor, and almost never provide financial compensation or some sort of lending/rebuilding
scheme.
22
PM (pro memorie): additional cost/benefit post which could not be identified.

34
Based on this information the following assumption is made: The combined cost effects of cleaning
the neighbourhood, the loss of income needed for nutrition and the immediate need for shelter due
to a flood are mitigated by the various flood aid institutions such as the BNPD, HOPE, CSR and
local assistance. Medical costs due to flooding are, as far as information is available, not provided
and costs from this are for the urban poor.
4.4 Summary: impact of yearly flood damage to the urban poor
Table 13 Total impact yearly floods to the urban poor of Jakarta
Name Rich slum Poor slum Total slum
Number of people
affected
383.680 153.470 537.150
Number of households
affected
73.780 29.510 103.300
Direct house/property
damage
$15,252,880 $1,172,970 $16,425,850
Cost of inability to work $1,173,100 $81,620 $1,254,720
Cost of falling ill $1,755,960 $365,330 $2,121,290
Cost of cleaning $3,081,050 $221,330 $3,302,380
Total cost $21,262,990 $1,841,250 $23,104,240
Flood related aid $4,254,150 $302,950 $4,557,100
Total impact $17,008,840 $1,538,300 $18,547,140
Impact per household $231.- $52.- $180.-

35
5 Policy actions for increasing urban resilience to natural hazards
The concept of resilience, and the methods to achieve an increase in urban resilience, is still under
development and no universal criteria is present. Various international institutions (United Nations /
World Health Organisation) have adopted/created their own version of what resilience entails.
According to them resilience explains, among others, the capacity of a system, community or
society potentially exposed to hazards to adapt, by resisting or changing in order to reach and
maintain an acceptable level of functioning and structure. The level of resilience is determined by
the degree to which the social system is capable of organising itself to increase this capacity for
learning from past disasters for better future protection and to improve risk reduction measures23
. A
disaster resistant society is capable of withstanding impacts and to quickly recover from hazards24
.
International organizations, such as the UN, have carried out various resilience improvement
projects in third world countries during the last decade. From these projects general lessons and
insights can be taken on the best approaches of increasing societal resilience. Additional focus is
given to how to increase the resilience of urban poor. In the following, an overview of lessons to
improve resilience is provided.
Government-Community dialogue. Impacts and losses can be substantially reduced at times of
disaster if authorities, individuals and communities in hazard-prone areas are prepared and ready
to act and are equipped with the knowledge and capacities for effective disaster management. To
do so, they need to promote and support dialogue, exchange information with the community and
coordinate early warning broadcasts, disaster response, food/medical logistics and conduct regular
disaster preparedness exercises, including evacuation drills and share disaster action plans. This
method of local preparedness is an effective way to reduce impacts and losses. However,
community coordination can only be effective if local governments have the necessary capacity,
resources, accountability and transparency. If these conditions are absent the local authorities can
be underqualified to conduct tasks demanded by them in a hazard situation25
.
Decentralization of hazard management responsibilities. Decentralizing disaster risk reduction-
related measures to the appropriate level is key to resilience. Some disaster risk reduction tasks
are best centralized. Others are best undertaken when they are specific to local needs and are
locally owned and managed. Progress in devolving power from national to the regional government
has often been achieved. However, in some cases groups at different ‘vertical’ governance levels
still work independently from one another and are unaware of each-others’ actions. This causes
fragmentation, making it harder to promote change and sustainability. Effective decentralization
requires attention to the promotion of disaster risk reduction understanding within local government
institutions. This involves strengthening institutional mechanisms to empower local governments to
act effectively in reducing their risks, and improving communication to help bridge gaps among
groups working on common issues at national and local levels. It also involves building local
capacity to allow better planning and the integration of disaster risk reduction in local actions26
.
Policy applicability. Social resilience is built up of many factors. Policy makers need to combine
policies on health, education, nature management, safety, road constructing and increased access
to both labour and credit markets to facilitate communities in becoming social resilient. This is a
23
UN/ISDR. Geneva 2004. 24
UN, sustainable future. 25
The Hyogo framework for action (HFA) (2005-2015): Building the Resilience of Nations and Communities to Disasters. 26
A catalyst for Change: How the Hyogo Framework for Action has promoted disaster risk reduction in South-East Europe.

36
new territory for many third world policy makers. Identification and the sharing of practical policy
recommendations for authorities and other stakeholders provides a tool to adapt current policy
measures, which often focus on particular economic or social sectors, into policies which take the
complex interconnecting conditions leading to a resilient society into account27
.
Investments in disaster risk prediction. Developments in disaster prediction and disaster reduction
have greatly reduced the number of lives lost due to natural hazards. One of the most recent
developments in this field are early-warning systems. Early-warning systems combine historic
hazard information to inform disaster management teams of an increase in risk, giving them the
possibility to act in time and reduce the damage and number of lives lost due to a natural hazard.
Currently active early-warning systems are for instance: Bangladesh Cyclone Preparedness
Programme; Cuba Tropical Cyclone Early Warning System; The French “Vigilance” System; The
Warning Management of The Deutscher Wetterdienst in Germany; Multi-Hazard Early Warning
System in Japan; Multi-Hazard Early Warning System of The United States’ National Weather
Service; and Shanghai Multi-Hazard Emergency Preparedness Programme. In the last decade
these systems have saved many lives, which provides evidence for the need to have accurate and
precise (natural) hazard data and the sharing between institutions and countries of this data28
.
Hazard communication. During a crisis, both governments and community leaders need to produce
accurate up-to-date information and disseminate this quickly to endangered communities.
Fortunately, they can now do this effectively in a variety of ways – print, radio, television, internet
and mobile phones. Social media platforms are also proving invaluable29
.
Formal and informal resilience systems. In the absence of formal social protection, most people rely
on traditional or informal protection systems within households, groups and social networks.
Generally, in many developing countries, social protection is likely to involve a combination of
informal and formal channels – taking advantage of informal connections and systems and
supporting these with formal mechanisms where appropriate. The government could support this by
strengthening systems of social protection – including old age and disability pensions,
unemployment pay, maternity and child benefits, and universal access to essential health care30
.
Policy system response. Resilience is largely interpreted as system response, including time of
recovery and degree of risk reduction. Insight in the relevant systems of a resilience framework is
therefore important to policy makers.
As such the following systems, with fields of application, are identified:
Physical system (e.g. critical infrastructure, communication systems, etc.)
Human system (e.g. skills, knowledge, health, education, etc.)
Social system (e.g. community networks, trust, civic engagement, norms, etc.)
Institutional system (e.g. first responders, response systems, etc.)
Technical system (e.g. warning systems, emergency plans, etc.)
Economic system (e.g. income, productivity, etc.)
Environmental system (e.g. fresh water, arable land, etc.)
Ecological system (e.g. pollination, carbon sinks, etc.)
These systems should be taken, as much as possible and applicable, into account when creating a
resilience framework31,32
.
27
Understanding community resilience: Findings from community-based resilience analysis (CoBRA) assessments. 28
UN system task team on the post 2015 UN development agenda: Disaster risk and resilience. 29
ESCAP, Building Resilience to Natural Disasters and Major Economic Crisis, May 2013. 30
ESCAP, Building Resilience to Natural Disasters and Major Economic Crisis, May 2013. 31
For more information regarding integrating resilience frameworks see: Berkes and Ross, 2013. 32
From social Vulnerability to Resilience: Measuring progress towards Disaster Risk Reduction.

37
Social inclusion. Countries that are characterised by conflicts and violence, exclusionary policies,
elite rent-seeking and unaddressed social grievances are more vulnerable due to a lack of
combined effort in resilience building and trust. Programmes that enhance social inclusion can
improve resilience and damage management efforts in countries with above characteristics.
Policies and institutions that fight exclusion and marginalization, create a sense of belonging and
the opportunity of upward mobility can reduce the potential for conflict. These kind of developments
builds trust and lays the foundation for infrastructural development to recover from crises in the
short run and increase resilience to future hazards33
.
Place-based-policy. Strengthening of certain weak regions or groups in society could be seen as a
task for the government. Empirical studies suggest that agglomeration economies and human
capital spillover policies could improve welfare. These positive externalities however do not indicate
which places should be subsidized to achieve the planned effect. Glaeser and Gotlieb, 2008,
empirically reviewed past, present and modern methods of place-based-policies, which can help
governments in increasing the effectiveness of, for instance, place-based-resilience-policy
implementation measures. Transportation investments had in the past a great effect on the growth
of a region, in particular positive benefits were realised when investments were made in areas
which already had relative strong agglomeration effects. Investments in lagging regions had less
benefits due to the smaller base agglomeration effect present. In addition, they find that most large-
scale place-based policies have only a small impact and that policies of Empowerment Zones,
although relatively expensive in respect to their achievements, have a larger effect. The most
promising measure for an effective place-based-policy is to remove land use barriers often present
around countries’ most productive areas. There is evidence that it is productivity enhancing to
further increase the population of a thriving city, compared to investments in less productive
areas34
.
Local investments and possible sorting effects. Households locate themselves over different
locations based on their wealth and particular preferences. Particular preferences are among others
local amenities, commuting times, closeness to relatives, varieties of goods, flood risk and job
opportunities. Local government investments, aimed to provide aid to urban poor, can have an
effect on the type of households that locate themselves at a certain location, the so-called sorting
effect. An investment in locational characteristics can attract wealthier households and conversively
not lead to the desired effect of the local investment, which was to support the urban poor. The self
sorting mechanism should be taken into account when deciding on a local investment. One of the
strategies to reduce the change that the benefits of a local sustainable investment end up at
another group of society than the target group is providing tenure rights and/or regulating housing
rents.
Tenure security. Many of the poor households in Jakarta are located on ground owned by the
government. The relocation of resource rights to communities and individuals would provide this
group with security of residence. Tenure security is an effective means to improve urban/rural
development and to increase equity between groups in society. Further, it increases participation of
the urban poor in damage mitigation, adding to a more resilient society. In addition, a government
can steer poor communities in their location behaviour by providing tenure (in)security35
and local
investments in for instance safety would lead to less negative sorting effects (sorting can still occur,
but households will be compensated more fair for relocating by wealthier households).
33
HDR 2014 Sustaining human progress: Reducing vulnerability and building resilience. 34
The economics of place-making policies, Glaeser and Gotlieb, 2008. 35
World Resources, Roots of Resilience: Growing the wealth of the poor.

38
6 The perfect flood measure: A hypothetical cost-benefit analysis
As stated in the introduction, this studies purpose is to provide insight in the flood damage to
housing, offices, infrastructure, public goods and additionally to the urban poor. Such insight is the
starting point for policy makers, flood measure engineers and other stakeholders when thinking of
new innovative ways to reduce total flood impact and loss of life. This chapter builds forward on this
studies results by providing a preliminary calculation on the investment amount of a hypothetical
‘perfect’ flood measure and by doing so provide above stakeholders with a starting point for a flood
measure cost-benefit analysis, where the focus lies on finding the break-even point of flood damage
reduction benefits and flood measure costs. The following assumption is the main input for this
chapter: The ‘perfect’ flood measure is capable of nullifying the flood damage to Jakarta, it is in
other words capable of reducing the total flood damage to zero. A flood measure is for instance a
drainage system, dike, or other innovative method.
6.1 Methodology
Various inputs and perhaps strong assumptions will be used to calculate the break-even point. This
methodology should provide insight in the costs and benefits of a perfect flood mitigation measure
and be of assistance to stakeholders as a rough estimate when considering a new measure.
However, it is not a solid business case, and additional case-by-case inputs should be
considered36
. Below some of the main identified inputs are described, followed by a table in which
the input values are taken up.
Densification of the urban area - Jakarta has an average population growth of 1.4 percent between
2000 and 201037
. This is contradicting the beliefs of the 90’s, where people expected to see a
decrease in urban population size. In addition, Jakarta is becoming more and more an urban jungle
with various skyscraper projects for both offices and living. The increase in population occurs at all
levels of society and some end up in the numerous squatter villages, where others live in new high-
rise residential housing. We assume that the effect on total land use in Jakarta is slightly positive,
leading to a more densely use of land and an increase in expected damage if a flood would occur.
Our assumption means that the city has a doubled land use intensity in 47 years.
Climate Change - According to the IPCC 2007 climate report38
, there is a high confidence that river
runoff will increase in the next fifty years and delta’s in Asia are more at risk. These results will
definitely have impact on Jakarta and we assume that the impact from rain floods will increase
every year slightly, with higher impacts as a result. Our assumption means that the city is has a
doubled flood intensity in 39 years.
Residual value - A flood mitigation measure, say a dike, is operative for a certain amount of years,
after this date the flood mitigation measure is not functioning anymore and new investments need
to be made. But a flood mitigation measure is at the end of its life not without value. It can still be
sold for scrap, used as foundation when building a new flood measure or is perhaps still functioning
36
Economic impact (indirect effects!), government balance, land subsidence, labour availability and local opinion for instance 37
http://www.thejakartapost.com/news/2011/03/26/population-growth-greater-jakarta-and-its-impact.html 38
IPCC, 2007

39
for a few years (which is also valuable). In any case there is a residual value and this value should
be taken into account when considering the break-even investment value.
Maintenance cost - The costs for maintaining the flood measure should be deducted from the initial
investment and saved separately to cover any operating and maintenance costs during the
measures lifespan. We have taken the ‘normal’ percentage of investment to control for this factor.
Discount rate - The assessment of flood mitigation measures involves the comparison of economic
flows that occur in different points in time. The discount rate is used to compare the economic
effects which occur at different times. Discounting converts future economic costs –and/or benefits
into their (net-)present day value. A flood measure should be seen as an investment and as such
the return on this investment can be used to decide how much can be spent on mitigation. It
functions as a tool to calculate the break-even point between current spending and future profits.
The height of the discount rate is a much debated topic when considering long term investments
with unsure future developments. This is especially true for the fields of climate change and hazard
mitigation. There is extensive literature and even more discussion available on what discount rate
to apply when considering long term mitigation investments. Three streams exist:
Stern, after the “Stern Review on the Economics of Climate Change”; which states that a zero-
discount rate should be applied (“losses tomorrow, or even 200 years from tomorrow, are just
as worth worrying about as losses today”39
).
Nordhaus disagrees with Stern and although he states that he is not defending his discount rate
value, he has strong arguments against a near zero-discount rate (for instance that this is
infeasible when applied in military policies).
At the high end of this discussion stands Taylor. He suggested to use the discount rate that
matches the return on Treasure bills (“or, put another way, the figure people apply themselves
when considering the value of money today versus the value of money tomorrow”).
Table 14 Inputs to estimate break-even point of flood measure investment
Input Value Source
General inputs
Densification urban area (and
therefore a higher impact per ha)
1.5% per year Expert assumption
Climate change (yearly increase of
flood risk)
1.8% per year IPCC (high confidence that river
runoff will increase)
Residual Value (end-of-life value,
additional benefit)
5% of flood damage (reduction in
damage)
Expert assumption.
No data available, based on Jones,
201340
Expected maintenance/operating
costs of measure
5% of total measure value Expert judgement
Discount rate low 0.1% Stern
Discount rate middle 3% Nordhaus
Discount rate high 5% Taylor
Jakarta
Expected annual damage $ 370.- million Section 2.5
Slums of Jakarta
Expected annual damage $ 16.5,- million Section 2.5
Indirect damage $ 7.- million Section 3.4
39
http://www.cato.org/blog/nordhaus-vs-stern 40
http://web.mit.edu/hsr-group/documents/Jones%20et%20al_TRB%202014.pdf

40
6.2 Results
Table 15 Overview of break-even investment values of a perfect flood measure
Lifetime of rain
flood measure
Direct flood
damage (x million)
Net-present investment value (x million)
Stern DR Nordhaus DR Taylor DR
Jakarta
10 $4,475 $4,251 $3,195 $2,635
20 $10,577 $10,048 $5,675 $3,863
30 $18,914 $17,968 $7,627 $4,283
40 $30,320 $28,804 $9,189 $4,258
50 $45,941 $43,644 $10,465 $4,000
Slums of Jakarta
10 $199 $189 $142 $117
20 $471 $447 $252 $171
30 $843 $801 $339 $190
40 $1,351 $1,284 $409 $189
50 $2,048 $1,946 $466 $178
Indirect damage to slums
10 $84 $80 $60 $49
20 $199 $189 $106 $72
30 $357 $339 $143 $80
40 $573 $544 $173 $80
50 $868 $825 $197 $75
*DR = Discount Rate
6.3 Reflection
How much one can invest to build the perfect flood measure is, as shown in table 15, very much
depending on the discount rate applied. When observing a measure with a lifespan of 20 years for
instance, the total difference between the high and low discount rate is roughly 2.5 times. The
discussion on the discount rate that should be used when considering long term hazard (including
climate hazard) investments is heated and this exercise gives further proof that this discussion is
very important. For practical matters the Nordhaus discount rate is advised to use when considering
a flood mitigation measure. When considering the Nordhaus discount range, the break-even
investment would amount up to $10.5 billion dollars when considering a 50-year measure
lifespan41
. It should however be noted that a 100% flood reduction measure is probably non-
existing, a flood measure only reduces the flood damage by a certain percentage.
41
An actual investment plan should be analysed in further detail and include effects of investment on the economy, government
debt, amount of labour available and population opinion when drafting a business case.

41
7 Conclusion
The capital city of Indonesia, Jakarta, is annually threatened by severe floods on a yearly basis.
These floods cause significant damage to housing, offices, infrastructure, public goods and also
disrupts society. In the aftermath measures need to be taken to avoid or reduce the damage from
new floods. Starting point for considering measures are the cost and benefit of these measures.
Making a complete inventory of the damage directly after a flood is a necessary activity for proper
water resources management, the urban poor however are often not part of these inventories and
are left out of the analysis. Due to the fact that they are neglected in flood measure cost-benefit
analysis their situation does not change and the annually returning floods restrain them from
investing in their house/neighbourhood. The hypotheses of this study is that with sufficient insight in
the damage of the urban poor, their position in a cost benefit analyses increases, which makes it
attractive for national and/or regional government to take larger resilience measures. The objective
of this study is to gain insight in the yearly damage of the urban poor during a flood.
The first part of this study builds on work conducted in the field of flood damage estimation by
Meyer & Messner, 2006; Ward, 2011 and Budiyono et al., 2014. The methodology is expanded with
the urban poor land use and population category. The urban poor and near poor make up 17.5% of
the total population of Jakarta and use roughly 27% of the land. In addition, the urban poor’
vulnerability and damage functions are estimated (providing information on both rich- and poor slum
dwellers) through stakeholders consultation and expert judgement. The calculated flood risk,
vulnerability curve, damage function and GIS computation (using small scale land use (0.5 sqm)
are used to estimate the flood damage to Jakarta and its poor. After deducing this damage to yearly
direct damage the total direct damage of rain floods to Jakarta sums up to $370 million dollar. Of
this damage 4.4%, or $16.5 million dollar, is the yearly damage to the group of urban poor.
Next to direct damage to property and housing, floods also have indirect negative impacts. The
indirect impact of floods to the urban poor has been estimated through a combination of literature
research, a survey and stakeholder consultation. Identified indirect impacts from floods are the
inability to work, illness due to flood and time spent on cleaning your own neighbourhood. When
quantified; these impacts sum up to almost $7 million dollar per year.
Mitigating measures, first aid, are taken in the aftermath of a flood by the government,
local/international NGO’s, large corporations and local benefactors. The combined effort of these
benefactors are of great importance and provide the urban poor with much needed first life aid after
a crisis. Due to the spread out and various flood aid providers and the fact that they focus efforts on
aid rather than data collection it was not possible to derive qualitatively an estimate of the total
yearly aid. However, based on interviews with both aid providers and aid receivers it was possible
to provide a rough estimate on the total flood aid received. The surveyed aid receivers did (almost)
not lack food and/or shelter during the flood and its aftermath. The impact of inability to work and
cleaning your neighbourhood are therefore mitigated and total flood aid to the urban poor is
assumed to be equal to these costs, roughly $4.5 million dollar per year. An increase of data
availability in this field would improve insight in the total amount of flood aid significantly.
The yearly effect of rain floods to the urban poor is $17 million dollar, or $231.- dollar for rich slum
households and $52.- dollar for poor slum households. When taking into account that the average
income per day per household is respectively $10.4- dollar for the rich slum and $1.9 dollar for the
poor slum, than the flood damage is a huge impact on their yearly income and this makes it difficult

42
to improve their living condition. This study shows that the urban poor are incorrectly left out of flood
damage studies (4.4% of total damage) and it is strongly recommended that they are included in
future flood damage assessments. In addition, this study provides a handhold for policy makers
when determining if an investment in flood risk reduction is welfare increasing, taking into account
that one should clearly explain why a certain discount rate has been applied in the cost-benefit
analysis.

43
8 References
Abelson, P. (1996). Evaluation of slum improvements; Case study in Visakhapatnam, India. Great
Britain: Cities, Vol. 13, No. 2, pp. 97-108. Aerts, J., & De Moel, H. (2012). Damagescanner model. Amsterdam.
Arcadis Euroconsult. (2007). Indonesië: Een nationale strategie voor participatief waterbeheer in
laaglandgebieden.
Brinkman, J., & Hartman, M. (after 2007). Jakarta Flood Hazard Mapping Framework. Jakarta.
Budiyono et al., Y. (2014). Rapid flood risk assessment for delta mega-cities: a case study of
Jakarta. Forthcomming.
Caljouw, M., Nas, P., & Pratiwo. (after 2007). Flooding in Jakarta towards a blue city with improved
water management. Jakarta.
Carthy, M. (2003). Global Report: Jakarta. Opgehaald van http://www.ucl.ac.uk/dpu-
projects/Global_Report/pdfs/Jakarta.pdf, McCarthy, 2003
Coordinating committee for geoscience programs in east and Southeast Asia. (sd).
Darthmouth flood observatory. (2007).
De Risi et al, R. (2013). Flood risk assessment for informal settlements. Nat Hazards (2013)
69:1003–1032.
ESCAP. (2013). Building Resilience to Natural Disasters and Major Economic Crisis.
EU FP6. (2007). Evaluating flood damages: Guidance and recommendations on principles and
methods. Opgehaald van flood site:
http://www.floodsite.net/html/partner_area/project_docs/t09_06_01_flood_damage_guideli
nes_d9_1_v2_2_p44.pdf
Gall, M. (2013). From social vulnerability to resilience: Measuring progress toward disaster risk
reduction. Bonn: UNU-EHS no.13/2013.
Gleaser, E., & Gottlieb, J. (2008). The Economics of Place-Making Policies. Boston: Brookings
Papers on Economic Activity, Spring 2008.
Hasanuddin et al., Z. A. (2007). Land subsidence characteristics of Jakarta between 1997 and
2005, as estimated using GPS surveys. Jakarta: GPS Solut (2008) 12:23–32.
Hassanudin et al., Z. A. (2009). Land Subsidence and Urban Development in Jakarta (Indonesia).
Hanoi: Spatial Data Serving People: Land Governance and the Environment – Building the
Capacity.
IPCC. (2007). Fourth Assessment Report: Climate Change 2007.
(sd). Kali Ciliwung; Descriptive statistics of Jabodetak delta.
Malaysan National News. (2007).
Meyer. (2007). Expected annual damage model.
Naik, Sinukaban, & Trihono Kadri. (sd). Integrated Watershed Management to Prevent Floods and
Sustain water resources in Jakarta, Indonesia. Bogor.
Nursidik, H., Pahala, S., & Aniati, M. (2012). An Automatic Detection Method for High Density
Slums based on Regularity Pattern of Housing using Gabor Filter and GINI Index. Depok.
Rashid, H., Hunt, L., & Haider, W. (2007). Urban Flood Problems in Dhaka, Bangladesh: Slum
Residents’ Choices for Relocation to Flood-Free Areas. Environ Manage 40:95–104.
Sakdapolrak, P., Seyler, T., & Ergler, C. (2013). Burden of direct and indirect costs of illness:
Empirical findings from slum settlements in Chennai, South India. Progress in
Development Studies, 13(2), 135-151.
Stern. (2006). Stern review on the economics of climate change.
Surbakti, & Indra, M. (2010). Jakarta City Report: Information related to Climate Change in Jakarta
City. Jakarta.

44
Takeuchi, A., Cropper, M., & Bento, A. (2007). Measuring the Welfare Effects of Slum Improvement
Programs: The Case of Mumbai. New York: WP 2007-18 Department of Applied
Economics and Management.
Tambunan, P., & Mangapul. (2007). Flooding area in the Jakarta province on February 2 to 4 2007.
Jakarta.
Tanaka, T. (2007). Methodology of integrated watershed management for sustainable. Tsukuba.
Taylor. (2006). CATO. Opgehaald van www.cato.org/blog/nordhaus-vs-stern
The Jakarta Post. (2007). Various arcticles. Opgehaald van www.thejakartapost.id
Tollenaar, D., Vatvani, D., Brinkman, J., & Bons, K. (2013). NCICD - MP; Behoeftespecificatie FHM
and JCDS basics and specifications. Jakarta: Deltares.
TU Delft. (sd). Indonesië: Integrale planning voor ruimte en water.
UN. (2013). Plan of Action on Disaster Risk Reduction for Resilience.
UN panel on global sustainability. (2012). Resilient people resilient planet.
UN. (sd). Sustainable future. Opgehaald van www.un.org/en/sustainablefuture/disasters.asp
UN. (sd). The Hyogo Framework for Action.
UN/ISDR. (2004). Geneva.
UNDP. (2011). Towarsd human resilience: Sustaining MDG progress in an age of Economic
uncertainty. New York.
UNDP. (2014). Understanding Community Resilience: Findings from Community-Based Resilience
Analysis (CoBRa) Assessments. Nairobi: UNON, Publishing Services Section, Nairobi,
ISO 14001:2004-certified.
UNDP, Worldbank, UNEP, WRI. (2008). World Resources: Roots of Resilience; Growing the wealth
of the poor. Washington: World Resources Institute.
UNISDR, WMO. (2012). Disaster risk and resilience; Thematic think piece.
Ward et al., P. (2011). Coastal inundation and damage exposure estimation: a case study for
Jakarte. Jakarta: Nat Hazards (2011) 56:899–916.
Wilhelm, M. (2011). Approaching Disaster Vulnerability in a Megacity: Community Resilience to
Flooding in two Kampungs in Jakarta. Jakarta.
World population statistics. (sd). Population Statistics. Opgehaald van
www.worldpopulationstatistics.com/jakarta-population-2013/
Worldbank. (2006). Impact evaluation for Slum upgrading interventions.
Worldbank. (2013). Indonesia: Urban Poverty and Program Review.
Worldbank, GFDRR, & UNISDR. (sd). A catalyst for change; How the hyogo framework for action
has promoted disaster risk reduction in south east europe.

45
Annex A: Slum description
Poor slum
1. Almost no houses with a second floor to store
valuable goods,
2. Very low quality building materials (mainly wood,
cardboard),
3. Easily damage property, mainly due to not
having a second floor and storage facility
elsewhere.
Rich slum
1. Availability of a second floor which can be used to
store goods on during a medium flood,
2. Relative stronger building material (such as bricks),
3. Relative stronger community, which can be used
to aid in reconstructing works and providing
financial/other required aid.

46
Annex B: Vulnerability Curves
Land use class 0 25 50 75 100 125 150 175 200 225
Sour
-ce
Rich slum 0% 0% 0% 10% 10% 10% 25% 25% 30% 30% 1
Poor slum 0% 0% 10% 20% 20% 20% 40% 40% 40% 40% 1
Industry and
warehouse 0% 30% 60% 80% 80% 80% 80% 80% 80% 80% 2
Commercial and
business 0% 37% 76% 82% 83% 83% 83% 83% 83% 83% 2
Government
facility 0% 22% 33% 41% 47% 53% 58% 62% 66% 69% 3
Planned house 0% 2% 10% 30% 40% 50% 60% 63% 65% 65% 3
Transportation
facility 0% 7% 14% 21% 28% 33% 37% 42% 46% 51% 3
Education and
public facility 0% 22% 33% 41% 47% 53% 58% 62% 66% 69% 3
HD urban
kampung 0% 6% 14% 28% 35% 40% 60% 60% 60% 60% 2
LD urban
kampung 0% 6% 14% 28% 35% 40% 60% 60% 60% 60% 2
Forestry 0% 30% 40% 50% 60% 70% 80% 80% 80% 80% 3
Swamp, river and
pond 0% 0% 0% 0% 0% 0% 0% 0% 0% 0% 3
Park and
cemetary 0% 10% 20% 25% 30% 33% 35% 38% 40% 45% 3
Agriculture and
open space 0% 38% 51% 54% 58% 60% 62% 65% 67% 70% 3
Source:
1 = Schellekens, 2014
2 = Budiyono, 2014
3 = Standaardmethode Aerts/De Moel, various years

47
Annex C: Questionnaire
Flooding in Kelurahan
How are floods affecting the urban poor in Jakarta?
1. How old are you?
Berapa umur anda?
2. What is your current kind of employment?
Apa jenis pekerjaan anda sekarang?
3. What is your education level?
Apa tingkat pendidikan Anda?
4. With how many people do you live in your house?
Ada berapa banyak orang yang tinggal dengan anda di rumah?
5. What is the monthly income in your house/family?
Berapa pendapatan keluarga di rumah anda dalam sebulan?
6. How many times did you experience a flood in the last 5 years?
Berapa kali Anda mengalami banjir dalam 5 tahun terakhir ini?
7. How many days did the flood last?
Berapa lama banjir bertahan (dalam hari)?
8. How many times did water get into your house?
Berapa kali air masuk ke dalam rumah Anda?
9. What was the height of the flood in your house (cm)?
Berapa ketinggian banjir di rumah Anda (cm)?
10. Were you still able to work during the flood? (in percentage of less days able to work)
Apakah Anda masih dapat bekerja selama banjir?
(berapa persentase yang dapat anda berikan untuk kemampuan bekerja saat banjir melanda?)
11. What was the largest problem caused by the flood according to you?
Apa masalah terbesar yang disebabkan oleh banjir menurut Anda?
12. What kind of actions did you take to reduce the flood damage?
Apa usaha yang Anda lakukan untuk mengurangi dampak dari banjir (sebelum dan selama banjir
terjadi)?
Locations 1. Kampung Pulo, 2. Kebon Melati, 3. Pasar Baru, 4. Cilincing, 5. Koja, 6. Kampung
Melayu
Interviewer(s) Lulu, Ajeng and Joachim
Date February/March 2014