slow slide? europe’s largest banks face eroding financial ... · joão soares is a partner with...
TRANSCRIPT

Investors may be overly optimistic about banks with relatively weak balance sheets. By João Soares
Slow Slide? Europe’s Largest Banks Face Eroding Financial Positions

João Soares is a partner with Bain & Company’s Financial Services prac-tice. He is based in London. The author thanks Justyna Nowicka for her contribution to the European health check analysis and to this brief.
Net Promoter®, Net Promoter System®, Net Promoter Score® and NPS® are registered trademarks of Bain & Company, Inc., Fred Reichheld and Satmetrix Systems, Inc.
Copyright © 2018 Bain & Company, Inc. All rights reserved.

Slow Slide? Europe’s Largest Banks Face Eroding Financial Positions
1
At a Glance
Ourlatestannualanalysisshowsthat,onaverage,measuresofprofitability,efficiency,capitaladequacyandassetqualityimprovedforEuropeanbanks,andinvestorsraisedtheirvaluationsaccordingly.
Themarketcontinuestobepolarized,asthereisnoonehomogeneousEuropeanbankingsystem.Thelargestbanks,though,havelostgroundrelativetothesectorforseveralyears.
Investorshavebeenespeciallylenienttowardbankswithweakerbalancesheets.
Winningbanksalsohavehigherloyaltyscores,whichreflecttheirbettercustomerexperienceandleadtostrongereconomics.
European banks are benefiting from investor enthusiasm—and perhaps a dollop of overoptimism. By the end of 2017, investors raised their valuations for European banks, on average, from the previous year: The asset-weighted price-to-book ratio of their stocks rose from 0.82 in 2016 to 0.92 at year-end 2017. And investors have been increasingly and disproportionately tolerant of banks with relatively weak balance sheets, whether because they were reassured by recent recapitalizations or because they have not found better alternatives for their money.
Higher valuations might be a prudent direction, on average, but greater risks emerge when one de-composes the average to analyze the situation by bank size and categories of health. The positions of the different banks highlight the polarization of banking in Europe, where there is no homogeneous banking system.
Notably, on average, the largest European banks have lost ground in both profitability and capital posi-tion relative to the sector as a whole. They have been on a downward trajectory for several years—a trend that could spell trouble for investors and the broader financial system.
These conclusions emerge from Bain & Company’s 2018 health check of the banking system, the fifth annual analysis, covering 100 banks in the base study. Our health check scoring model derives from three dimensions, two of which represent banks’ robustness (see the sidebar “How the scoring model works”):
• profitability and efficiency;
• asset and liability health (here, we give a relatively heavy weighting to asset quality as essential for future earnings); and
• stability of the operating environment.

Slow Slide? Europe’s Largest Banks Face Eroding Financial Positions
2
Figure 1:Equityinvestorsgivewinnersalargemultipleadvantage
Weaker balance sheet19% of banks
Price-to-book: 0.94 (2016: 0.71)
Highest concern26% of banks
Price-to-book: 0.43 (2016: 0.32)
Winners32% of banks
Price-to-book: 1.32 (2016: 1.29)
Weaker business model 23% of banks
Price-to-book: 0.60 (2016: 0.63)
Note: Price-to-book ratios for institutions that are publicly tradedSources: SNL Financial; banks’ 2017 annual reports; World Bank; Trading Economics; Bain analysis
Asset and liability score
Profitabilityand efficiencyscore
Our scoring brings together data from financial providers such as SNL Financial and Moody’s and combines their findings with banks’ own financial statements. The health check provides a uniquely integrated view, which stands in contrast to looking only at a balance sheet or income statement. Based on the combination of the critical financial ratios, we calculate a score for each bank and place it in one of four categories (see Figures 1 and 2).
• Winners. Some 32% of the banks attained this strong position. Scandinavian, Dutch and Belgian banks continue to outperform on virtually all financial indicators. Investors pushed up the price-to-book ratio for this group very slightly from 1.29 to 1.32.
• Weaker business model. Banks in this category represent 23% of the total, consisting primarily of UK and German banks, the business models of which continued to struggle. Investors kept pricing essentially flat, with a price-to-book ratio of 0.60 vs. 0.63 the year prior.
• Weaker balance sheet. Some 19% of banks have a priority to fix weak balance sheets. Over the years, banks in this category have shown vulnerabilities not yet fully reflected in their profit and loss statements. The markets punished these banks far less harshly, with an average price-to-book ratio rising to 0.94 in 2017.
Median Tier 1 capital for these banks, the core capital that regulators focus on, has reached 13.3%, which could help explain the higher valuations. Rational markets, however, would accord a lower

Slow Slide? Europe’s Largest Banks Face Eroding Financial Positions
3
Figure 2:SouthernEuropewarrantsthehighestconcern,whiletheUKandGermanycontinuetostrugglewiththebusinessmodel
–1
Notes: Bank scores calculated as the weighted average of respective and normalized ratios; country scores calculated as the average of relevant national samplebanks weighted by total assetsSources: SNL Financial; banks’ 2017 annual reports; World Bank; Trading Economics; Bain analysis
0
1
Profitability and efficiency score
Asset and liability score–1 0 1
Austria
Sweden
Belgium
Denmark
Slovenia
Ireland UK
France
Netherlands
Germany
Cyprus
Poland
Spain
Portugal
GreeceItaly
Weaker business modelHighest concern
WinnersWeaker balance sheet
valuation to a weaker balance sheet than to a weaker business model, as a bank’s long-term health depends critically on its balance sheet health.
Spanish banks make up a large share of this category, with capital positions that are much weaker than the median European bank. Tier 1 capital ratios at roughly half of Spanish banks are below 13%, and all but one of these institutions have above-median ratios of problem loans. The largest Spanish banks have a particularly poor position. Any more stringent change in regulation or an economic downturn would raise the level of nonperforming loans and potentially force large Spanish banks into the highest concern category.
• Highest concern. Of the total base, 26% of banks flash a high-risk signal. A troubling sign is that investors pushed valuations up by 11 points, to 0.43. Banks in southern Europe—including more than half of banks in Italy, Greece, Portugal and Cyprus—have distressed levels of profitability and asset quality. Note that every bank that failed in the past decade (for which there are financial state-ments available), as well as many others that merged with other entities, fell into this category before their demise. In fact, several banks in this quadrant at the end of 2016 disappeared throughout 2017, either by resolution or absorption into other entities.
Stepping back to look at the entire base of banks, we see several broad trends.

Slow Slide? Europe’s Largest Banks Face Eroding Financial Positions
4
Sources: Bain analysis; SNL Financial
Bank 10
Bank 9
Bank 8
Bank 7
Bank 6
Bank 5
Bank 4
Bank 3
Bank 2
Bank 1
−0.73
0.02
0.02
0.30
0.06
−0.09
−0.35
0.01
0.08
−0.08
Profitability
0.22
0.28
0.05
−0.14
−0.02
0.13
0.15
0.14
−0.06
0.16
Asset/liability
−0.24
0.07
−0.12
0.22
−0.12
−0.24
−0.53
0.02
−0.02
0.05
Profitability
0.24
0.22
−0.01
−0.27
−0.15
0.10
0.20
0.08
−0.16
0.15
Asset/liability
2016 2017
Figure 3:Ofthe10largestEuropeanbanks,onlyoneimproveditsrelativeposition
First, profitability and efficiency indicators improved across the board. Net income as a share of risk-weighted assets increased by 0.3 percentage points, to 1.1%. Continued strong underlying econo-mies in most countries helped banks in this regard. In addition, the median cost-to-income ratio dropped 3 percentage points, to 60%, although German and UK banks continue to lag the sector.
Capital adequacy and asset quality measures improved as well. Tier 1 capital rose by 1 percentage point, to 16%, and tangible common equity as a share of risk-weighted assets rose by 3 percentage points, to 17%. Median asset quality improved, as problem loans declined by 1.1 percentage points, to 4.2%, and loan-loss provisions dropped by 0.1 percentage points, to 0.2%. Banks also improved their liquidity, with the loan-to-deposit ratio dropping from 116% to 111%.
Is the music still playing for large banks?
Homing in on the largest banks, we see a greater cause for concern. Of the top 10 banks by assets, only one improved its financial position during the year; all others suffered a decline in financial health and resilience relative to the sector as a whole (see Figure 3). If the top 10 were one institution, they would be in the weaker business model category for every year since 2013.
The biggest percentage-point difference between the largest banks and the rest occurs in the cost-to-income ratio, in which the median for the 10 largest is 69%, compared with 60% for other banks. A
Slow Slide? Europe’s Largest Banks Face Eroding Financial Positions
5
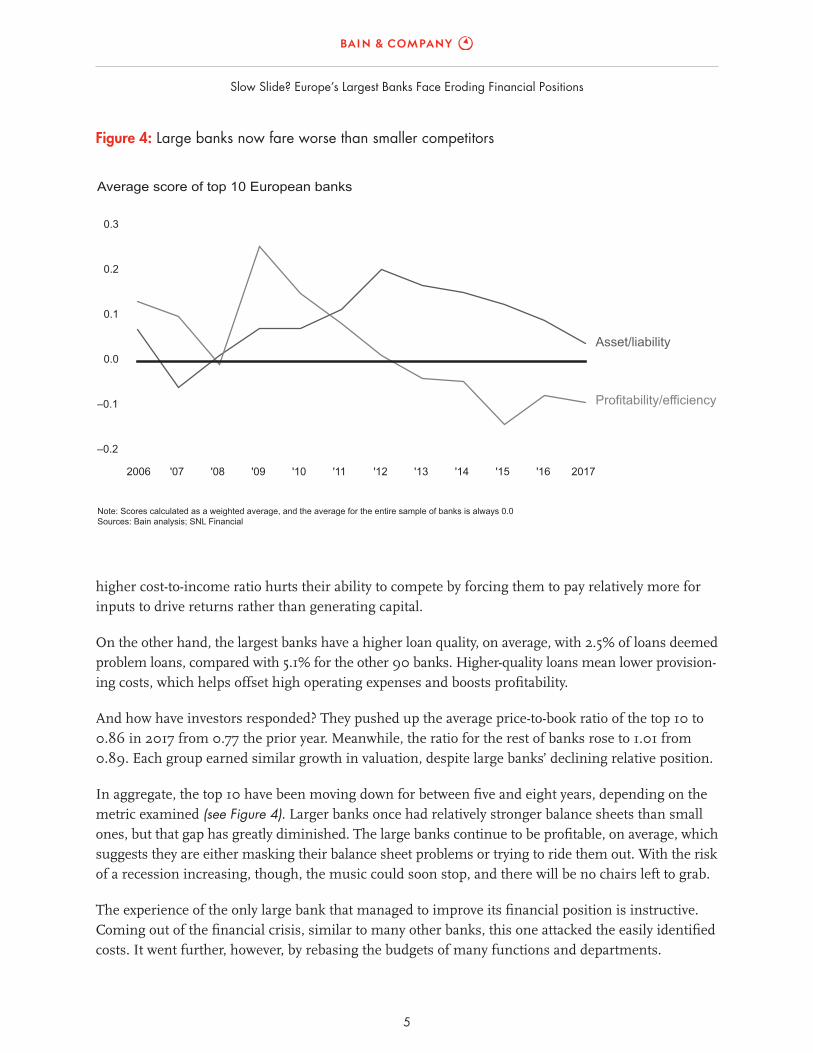
Figure 4:Largebanksnowfareworsethansmallercompetitors
Note: Scores calculated as a weighted average, and the average for the entire sample of banks is always 0.0Sources: Bain analysis; SNL Financial
–0.2
–0.1
0.0
0.1
0.2
0.3
Average score of top 10 European banks
Asset/liability
Profitability/efficiency
2006 '07 '08 '09 '10 '11 '12 '13 '14 '15 '16 2017
higher cost-to-income ratio hurts their ability to compete by forcing them to pay relatively more for inputs to drive returns rather than generating capital.
On the other hand, the largest banks have a higher loan quality, on average, with 2.5% of loans deemed problem loans, compared with 5.1% for the other 90 banks. Higher-quality loans mean lower provision-ing costs, which helps offset high operating expenses and boosts profitability.
And how have investors responded? They pushed up the average price-to-book ratio of the top 10 to 0.86 in 2017 from 0.77 the prior year. Meanwhile, the ratio for the rest of banks rose to 1.01 from 0.89. Each group earned similar growth in valuation, despite large banks’ declining relative position.
In aggregate, the top 10 have been moving down for between five and eight years, depending on the metric examined (see Figure 4). Larger banks once had relatively stronger balance sheets than small ones, but that gap has greatly diminished. The large banks continue to be profitable, on average, which suggests they are either masking their balance sheet problems or trying to ride them out. With the risk of a recession increasing, though, the music could soon stop, and there will be no chairs left to grab.
The experience of the only large bank that managed to improve its financial position is instructive. Coming out of the financial crisis, similar to many other banks, this one attacked the easily identified costs. It went further, however, by rebasing the budgets of many functions and departments.

Slow Slide? Europe’s Largest Banks Face Eroding Financial Positions
6
Figure 5:NetPromoterScore®andbankhealthscorearecorrelated
Notes: Bank scores calculated as the weighted average of respective and normalized ratios; country scores calculated as the average of relevant national samplebanks weighted by total assetsSources: Bain analysis; SNL Financial; Bain 2017 Loyalty in Banking Survey
–1
0
1
–1 0 1
Profitability and efficiency score
Asset and liability score
Weaker business modelNet Promoter Score: 4
Highest concernNet Promoter Score: −10
WinnersNet Promoter Score: 10
Weaker balance sheetNet Promoter Score: 12
Top quartile Net Promoter Score (>10) Second quartile Net Promoter Score (>0)Third quartile Net Promoter Score (>−9) Bottom quartile Net Promoter Score (<−9)
In tandem, the bank has invested substantially in customer-friendly digital technologies, including a mobile app that has won praise from consumers, and thus migrated more routine transactions to lower-cost, self-serve channels and away from high-cost branches.
The bank also simplified its value proposition in several respects. It pared down product lines to keep only products that would enhance the experience of target customer segments, rather than trying to offer broad lines for their own sake. The bank shed many noncore assets and businesses, such as down-sizing investment banking in the UK, in order to focus on retail and commercial banking there. It also doubled down on being a strong franchise (No. 1 or No. 2) in its key markets.
Customers have responded favorably to its simple digital tools, thoughtful cost reduction and sharper focus on key markets after the crisis. The bank saw its home market Net Promoter Score®, a key metric of customer loyalty, rise by 6 points in 2017, which was the third-highest increase among 14 banks in the country.
Indeed, loyalty and financial health are closely intertwined. Banks in the winners category have a weighted average Net Promoter Score 20 points higher than the highest-concern banks (see Figure 5). It should come as no surprise that banks that invest in better identifying and addressing their customers’ needs, in solving their problems, and in making banking simple and digital are winning. What may be surprising is how analytical, focused and deliberate these improvements can be. No one size fits all, but clearly, there is a right size that every bank can work toward.

Slow Slide? Europe’s Largest Banks Face Eroding Financial Positions
7
How the scoring model works
ThescoringmodelinBain’shealthcheckofthebankingsystemgathersdatainsixareas,withtheheaviestweightingonassetquality(seefigure).
Profitability:Thekeydeterminantofsustainablesuccessorfailure,itmeasurestheabilitytocreateeconomicvalueandtopreserveorimproveriskprotectionforcreditors.Performancemetricsincludepreprovisionincomeasapercentageofrisk-weightedassetsandnetincomeasapercentageofrisk-weightedassets.
Efficiency:Costcontainmentisastrategicfocalpoint;itallowsbankstosatisfystakeholders’require-mentswithoutoverlyaggressiverisktaking.Performancemetricsincludeoperatingexpensesasapercentageofnetrevenue.
Asset quality:Amainfactorinfutureearningsandcapitalgenerationorerosion,loanqualityisakeytodeterminingabank’sstability.Nonperformingloanspredictfuturelosses.Performancemetricsasapercentageofgrossloansincludeproblemloans,loan-lossprovisionsandcorporateloans.
Capital adequacy:Bankstypicallyfailduetolossesintheloanportfolio,poorbusinessmodelsorfraud—allofwhichleadtoadeclineincapital.Inthecaseoflowprofitability,capitalisthemostimportantbufferforabsorbingriskcosts.PerformancemetricsincludeTier1capitalasapercentageofrisk-weightedassetsandtangiblecommonequityasapercentageofaveragerisk-weightedassets.
Liquidity: Illiquidityisoftenaproximatecauseoffailureasbanksmightnotanylongerbeabletofinancethemselvesunderpressure.Accesstomarketfundingmaynotbebasedonlong-termrela-tionshipsbutratheroncreditworthiness.Performancemetricsincludegrossloansasapercentageoftotaldepositsandtotaldebt—thatis,liquidassetsasapercentageoftotalassets.
Operating environment: Bankperformanceisoftenconstrainedbyviolenteconomiccycles,adversepoliticaldecisionsorweaklegalsystems.Declinesineconomicgrowthcorrelatehighlywithworsen-ingassetquality.Performancemetricsincludeassessmentofsovereigncreditratingandcorruption.
Profitability and efficiency
Financial robustness Nonfinancialrobustness
Profitability
Assets and liabilities
Efficiency Asset quality
Performance metrics
Economic insolvency override analysis
Notes: Select dimensions are based on the best practices of rating agencies; override analysis incorporates the automatic downgrade of banks with serious assetquality problems Source: Bain analysis
Capital adequacy Liquidity Operatingenvironment
Assessment ofsovereign
credit ratingand corruption
Stability
Components of the banking health check scoring model

Slow Slide? Europe’s Largest Banks Face Eroding Financial Positions
8

Shared Ambition, True Results
Bain & Company is the management consulting firm that the world’s business leaders come to when they want results.
Bain advises clients on strategy, operations, technology, organization, private equity and mergers and acquisitions. We develop practical, customized insights that clients act on and transfer skills that make change stick. Founded in 1973, Bain has 57 offices in 36 countries, and our deep expertise and client roster cross every industry and economic sector. Our clients have outperformed the stock market 4 to 1.
What sets us apart
We believe a consulting firm should be more than an adviser. So we put ourselves in our clients’ shoes, selling outcomes, not projects. We align our incentives with our clients’ by linking our fees to their results and collaborate to unlock the full potential of their business. Our Results Delivery® process builds our clients’ capabilities, and our True North values mean we do the right thing for our clients, people and communities—always.

For more information, visit www.bain.com