slow-rolling response tests on the test pavements at the
TRANSCRIPT

1
Slow-Rolling Response Tests on the Test Pavements at the National Airport Pavement Test Facility (NAPTF)
Gordon F. Hayhoe1, Robert Cornwell2, Navneet Garg3
Abstract Airport pavement thickness design procedures predict a significant amount of interaction between the loads from multiple-wheel and closely spaced multiple-truck landing gear configurations. But the true degree of interaction is not known, and measurements from full-scale tests are required to determine how closely wheels and trucks can be spaced without significant load interaction. As a supplement to traffic tests run to failure at a later date, pavement response tests were performed to study the wheel load interaction effects. Pavement responses (stresses, strains, deflections, etc.) were measured at various depths in each of the nine pavement test items at the National Airport Pavement Test Facility (NAPTF) for different combinations of wheel configurations, truck configurations, and load levels. Moving loads were applied at a speed of 0.15 m/sec (0.5 feet/second). A total of 522 tests were performed on six flexible pavement test items and 108 tests were performed on three rigid pavement test items. This paper describes the response test objectives and test procedures. Some typical pavement responses are presented. Data from the response tests is being analyzed at the FAA Center of Excellence for Airport Technology at the University of Illinois. The raw data is also available from the FAA for independent analysis.
1 FAA William J. Hughes Technical Center, Airport Technology Research and
Development Branch, AAR-410, Atlantic City International Airport, NJ 08405, (609) 485-8555, [email protected]
2 Boeing Commercial Airplane Group, P.O. Box 3707 MS 67-KR, Seattle, WA 98124-2207, (425) 965-0107, [email protected]
3 Galaxy Scientific Corporation, 2500 English Creek Ave., Bldg. C, Egg Harbor Twp., NJ 08234-5562, (609) 645-0900, [email protected]

2
Introduction The design of the National Airport Pavement Test Facility (NAPTF) was primarily determined by the need to develop pavement design procedures for the new generation of large civil transport aircraft, including B-777, B-747 Stretch, and A380 class aircraft. Current design procedures predict a significant amount of interaction between the loads from the multiple wheels and close spacing of the trucks that will be used on these aircraft, particularly within the subgrade in flexible pavements. But the true degree of interaction is not known, and measurements from full-scale tests are required to determine how closely wheels and trucks can be spaced without significant load interaction. As a supplement to traffic tests to failure run at a later date, pavement response tests were performed to study the pattern of wheel load interaction effects. Pavement responses (stresses, strains, deflections, etc.) were measured at various depths in each of the pavement test items for different combinations of truck configurations and load levels. As a group, the tests performed are referred to as the �stationary tests.� The objectives of the stationary tests were to: • Measure pavement response with precise control of magnitude/position of
load. • Measure interaction of pavement response at different wheel and gear
spacings. • Compare response with static and moving loads. • Compare response with static and heavy weight deflectometer (HWD) loads. • Compare measured responses with computed responses.
The tests included dual-wheel, dual-tandem, and dual-tridem configurations. Gear separation tests with four- and six-wheel gears were also performed to study the effects of gear spacing on pavement response. The test plan is described first, followed by a general description of the conduct of the tests and an outline of the data acquisition system. Typical response measurements are also presented for vertical pavement deflection at various depths, vertical pressure at various depths, and horizontal strain in asphalt and concrete layers. Analysis of the measurements is currently underway.
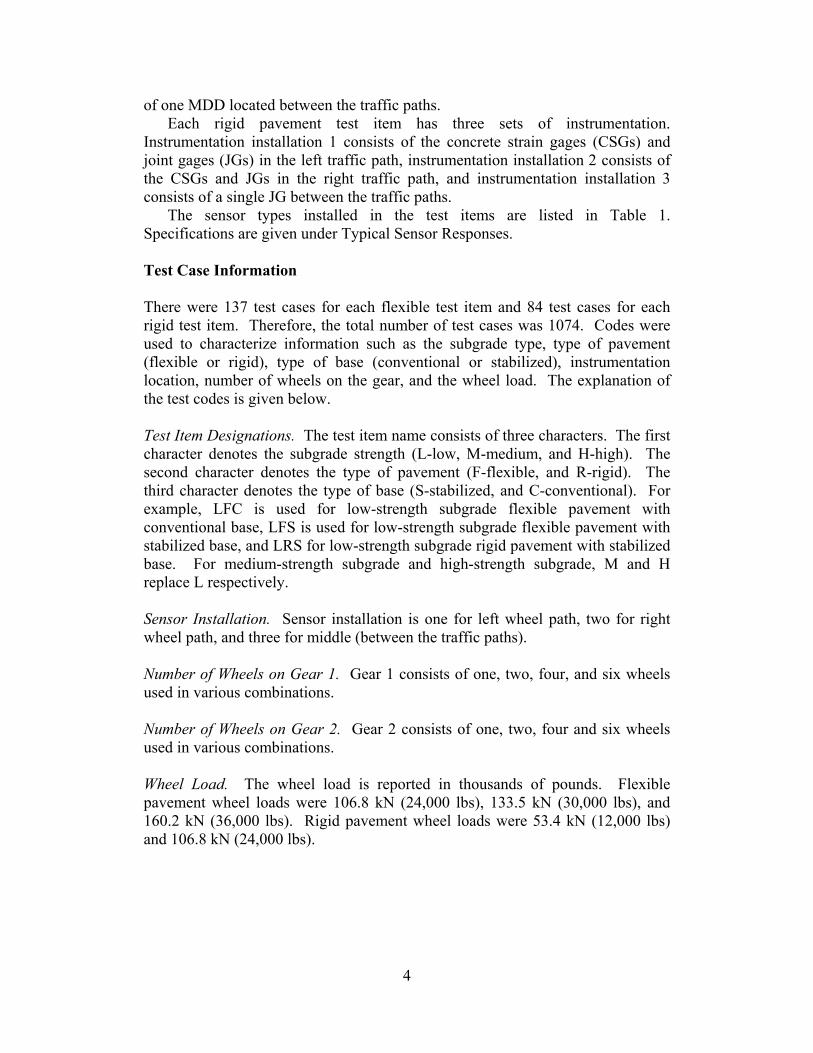
Copies of the data on CD-ROM can be obtained from the Federal Aviation Administration (FAA) at the Airport Technology Research and Development Branch, AAR-410. A comprehensive description of the test program, with a listing of all the tests cross referenced to the data files, is available on the AAR-410 web site www.airporttech.tc.faa.gov. National Airport Pavement Test Facility The NAPTF is located at the FAA William J. Hughes Technical Center, Atlantic City International Airport, New Jersey. A 5340 kN (1.2 million lb) pavement testing machine (test vehicle, Figure 1) spans two sets of railway tracks that are 23.2 meters (76 feet) apart. The vehicle is equipped with six adjustable dual-

3
wheel loading modules. A hydraulic system applies the load to the wheels on the modules. The major specifications for the test track are as follows: • Test pavement 274.3 meters (900 feet) long by 18.3 meters (60 feet) wide. • Nine independent test items (six flexible and three rigid) along the length of
the track. (The pavement cross-sectional details can be found on the AAR-410 website.)
• Twelve test wheels capable of being configured to represent two complete landing gear trucks having from two to six wheels per truck and adjustable up to 6.1 meters (20 feet) forwards and sideways.
• Wheel loads adjustable to a maximum of 333.75 kN (75,000 lbs) per wheel. Operating Restrictions The �slow-rolling� response tests were conducted under the following operating restrictions: • The load for any test did not exceed 80% of the trafficking load for the
flexible pavement test items or 50% of the load necessary to generate slab stresses equivalent to the modulus of rupture for the rigid pavement test items in order to eliminate/minimize pavement damage.
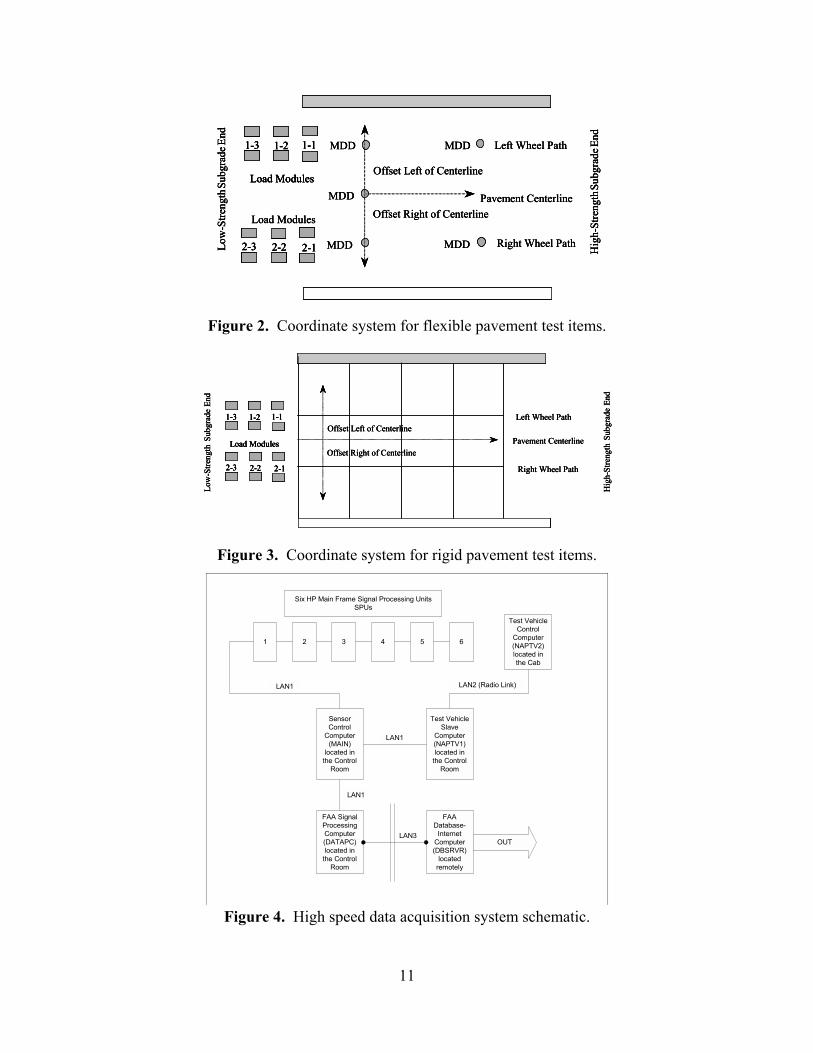
• Longitudinal (tandem) axle spacing of 144.8 cm (57 inches) was used. • Transverse (dual) wheel spacing of 137.2 cm (54 inches) was used. Orientation to Test Facility and Instrumentation In order to uniquely identify all of the test configurations, the individual instrumentation installations and load modules are referred to based upon an overall orientation scheme relative to the entire test facility. The following descriptions are referenced from a point between the traffic lanes at the low-strength (west) end of the facility and facing the high-strength (east) end of the facility as shown in Figure 2. Load modules. The north (left) carriage is designated �Carriage-1� and the south (right) carriage is designated �Carriage-2.� The three load modules on Carriage-1 are designated 1-1, 1-2, and 1-3 respectively. Load module 1-1 (front) is toward the high-strength end of the facility and load module 1-3 (rear) is toward the low-strength end of the facility. The three load modules on Carriage-2 are designated 2-1, 2-2, and 2-3 respectively. Load module 2-1 (front) is toward the high strength end of the facility and load module 2-3 (rear) is toward the low-strength end of the facility. Instrumentation Installations. Each flexible pavement test item has three sets of instrumentation. Instrumentation installation 1 consists of multidepth deflectometers (MDDs), pressure cells (PCs), and asphalt strain gages (ASGs) in the left traffic path; instrumentation installation 2 consists of the same set of instrumentation in the right traffic path; and instrumentation installation 3 consists
4
of one MDD located between the traffic paths. Each rigid pavement test item has three sets of instrumentation.
Instrumentation installation 1 consists of the concrete strain gages (CSGs) and joint gages (JGs) in the left traffic path, instrumentation installation 2 consists of the CSGs and JGs in the right traffic path, and instrumentation installation 3 consists of a single JG between the traffic paths.
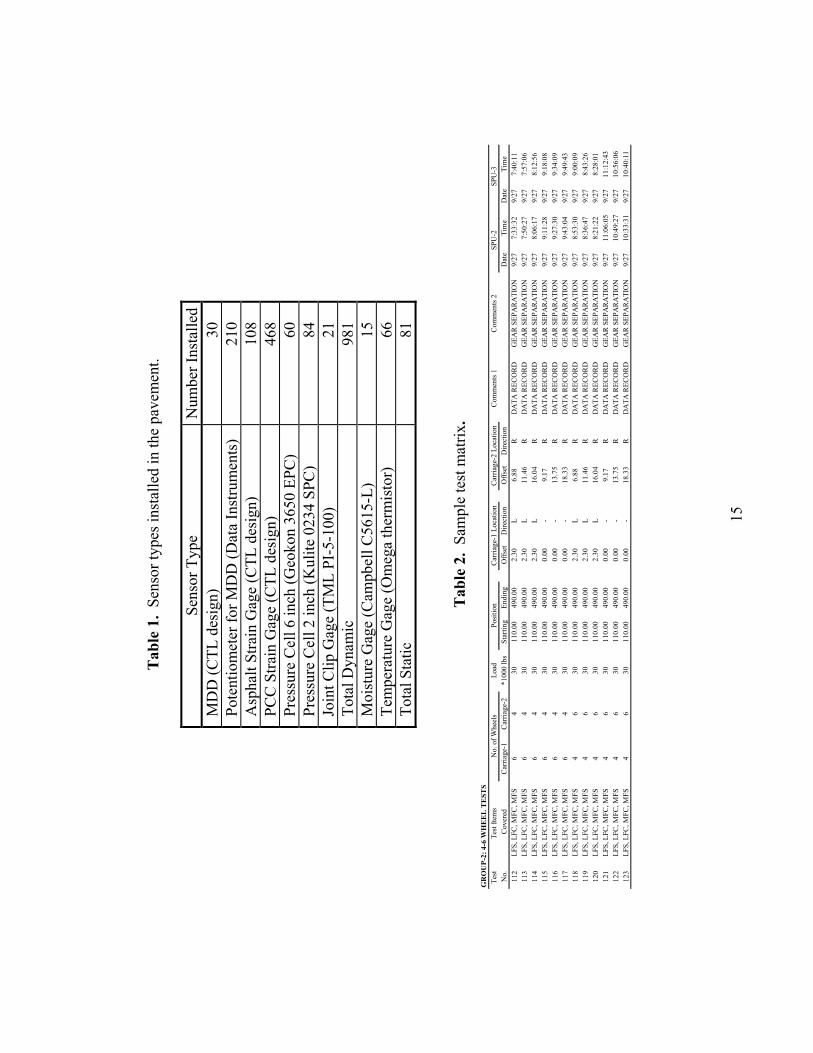
The sensor types installed in the test items are listed in Table 1. Specifications are given under Typical Sensor Responses. Test Case Information There were 137 test cases for each flexible test item and 84 test cases for each rigid test item. Therefore, the total number of test cases was 1074. Codes were used to characterize information such as the subgrade type, type of pavement (flexible or rigid), type of base (conventional or stabilized), instrumentation location, number of wheels on the gear, and the wheel load. The explanation of the test codes is given below. Test Item Designations. The test item name consists of three characters. The first character denotes the subgrade strength (L-low, M-medium, and H-high). The second character denotes the type of pavement (F-flexible, and R-rigid). The third character denotes the type of base (S-stabilized, and C-conventional). For example, LFC is used for low-strength subgrade flexible pavement with conventional base, LFS is used for low-strength subgrade flexible pavement with stabilized base, and LRS for low-strength subgrade rigid pavement with stabilized base. For medium-strength subgrade and high-strength subgrade, M and H replace L respectively. Sensor Installation. Sensor installation is one for left wheel path, two for right wheel path, and three for middle (between the traffic paths). Number of Wheels on Gear 1. Gear 1 consists of one, two, four, and six wheels used in various combinations. Number of Wheels on Gear 2. Gear 2 consists of one, two, four and six wheels used in various combinations. Wheel Load. The wheel load is reported in thousands of pounds. Flexible pavement wheel loads were 106.8 kN (24,000 lbs), 133.5 kN (30,000 lbs), and 160.2 kN (36,000 lbs). Rigid pavement wheel loads were 53.4 kN (12,000 lbs) and 106.8 kN (24,000 lbs).

5
Load Module Position For slow-rolling tests, the load module position (starting and ending) was defined relative to the transition sections adjoining the pavement section that was being tested. The transverse position of the load module was defined in terms of carriage offsets. Offsets were measured �Left� or �Right� of the pavement centerline (Figure 2). For static response tests, the x-y coordinates of the starting and ending positions defined the load module position. The intersection of the west edge of item LRS and the pavement centerline was defined as the origin. The x direction was along the pavement centerline and the y direction was transverse to the pavement centerline. For rigid pavement test items, the load module position was defined in the same way as discussed above and is shown in Figure 3. High-Speed Data Acquisition System (HDAS) The HSDAS was used to gather data from the dynamic pavement sensors and transmit the data to a computer in the control room. The HSDAS has six Hewlett Packard VXI Mainframe Signal Processing Units (SPU). Each SPU has a 133-MHz Pentium computer system card and three analog to digital converter (ADC) cards with a 64-channel multiplexer on each card. Each rigid test item has a dedicated SPU. Each pair of flexible test items (on a given strength subgrade) has a dedicated SPU. The schematic for data collection is shown in Figure 4. Automatic Data Acquisition The procedure for automatic data acquisition is as follows. • Trigger signals are generated for each SPU by infrared (IR) emitter-detector
pairs located between the rails. A reflecting surface is located on the test vehicle (TV), which causes the IR sensors to generate the trigger pulses. The IR sensors can be moved in the longitudinal direction so that the trigger time can be varied.
• When an ON trigger signal is detected by an SPU, the SPU starts storing data to a binary file.
• When an OFF trigger signal is detected by an SPU, the SPU stops storing data to the file.
• If one SPU processes sensors in only one test item, then the data files are as long as is required to measure the sensor responses for that test item.
• If one SPU processes sensors in two test items, then the data files are as long as is required to measure the sensor responses in both test items.
• The SPU data files are initially stored on the hard disks on the SPU computers. The files are periodically downloaded from the SPUs to the MAIN computer and stored on its hard disk. There is one directory for each SPU. The files on the SPU computers are deleted after they have been downloaded.
6
TV log files are downloaded from the NAPTV2 computer to the NAPTV1 computer at periodic intervals and then transferred to the MAIN computer. The log files store time, vehicle position along the track, skew force, and the vertical loads on each of the load modules.
Signals from the pavement sensors are conditioned by �plug-ins� on the ADC cards. Each plug-in provides eight channels of conditioning with an independent 10 Hz low-pass filter on each channel. Maximum sampling frequency for an ADC is 100 kHz. As currently configured, all 64 channels on one card are sampled, and the maximum data rate is therefore 1,562 Hz. Sampling frequency for all of the response tests was 20 Hz, except for measurements made during the HWD tests. Response Tests for Flexible Test Items The pavement responses measured in the flexible test items were: • Vertical deflection within the pavement component layers (MDD
measurements). • Vertical strain in the subgrade (MDD measurements). • Vertical pressure in the subgrade (pressure gages). • Horizontal strain at the bottom of the asphalt concrete layers (strain gages). The response tests for flexible pavement test items were divided into the following categories: • Slow-rolling tests for instrument installation 1 • Static test at MDD locations for instrument installation 1 • Slow-rolling tests for instrument installation 2 • Static test at MDD locations for instrument installation 2 • Slow-rolling tests for instrument installation 3 • Static test at MDD locations for instrument installation 3 • Gear Separation: six-wheel gear wheel path over MDD of instrument
installation 3 • Gear Separation: six-wheel gear centerline over MDD of instrument
installation 3 • Gear Separation: four-wheel gear wheel path over MDD of instrument
installation 3 • Gear Separation: four-wheel gear centerline over MDD of instrument
installation 3 For each flexible test item, 137 response tests were planned. There are six flexible test items in the test facility, which resulted in a total of 822 response tests. HWD tests were run in conjunction with the static tests. A sample test matrix is given in Table 2. Response Tests for Rigid Test Items The pavement responses measured in the rigid test items were:
7
• Horizontal stress at the top and bottom of the concrete slabs. • Horizontal joint movement. The response tests for rigid pavement test items were divided into the following categories: • Slow-rolling tests for instrument installation 1 • Slow-rolling tests for instrument installation 2 • Slow-rolling tests for instrument installation 3 For each rigid test item, 84 response tests were planned. There are three rigid test items in the test facility, which results in a total of 252 response tests. Slow-Rolling Response Test Procedure The test machine was rolled at a speed of 0.15 meter/sec (0.5 feet/second). For each of the two-wheel, slow-rolling tests on flexible pavements, the test machine was rolled from east to west, and this roll was designated as the �conditioning roll.� During the conditioning roll, data from the sensors were not recorded. After the conditioning roll was completed, the test machine was rolled from west to east, and this was called the �test roll� during which the sensor data were recorded. The tests were conducted in groups. In other words, tests on two or more different test items were conducted simultaneously. The groups were as follows: GROUP-I: LRS [rigid test item on low-strength subgrade] GROUP-II: LFS, LFC, MFC, MFS [flexible test items on low-strength and medium-strength subgrade] GROUP-III: MRS, HRS [rigid test items on medium-strength and high-strength subgrade] GROUP-IV: HFS, HFC [flexible test items on high-strength subgrade]
For two-wheel tests, the middle modules (1-2 and 2-2) were used. In the case of gear separation tests (four-wheel and six-wheel gear configurations), modules 1-2 and 1-3 were used for four wheels on Carriage 1 and modules 2-2 and 2-3 were used for four wheels on Carriage 2.
During the slow-rolling tests, the power supply for SPU-1 did not operate correctly, and the tests on test item LRS were repeated. ADC Card 2 in SPU-2 also experienced problems, and the tests on test items LFS and LFC were repeated. Because of time and operational constraints, single-wheel tests were not performed. A total of 522 tests were performed for flexible pavement test items and 108 tests were performed for rigid pavement test items. Static Response Tests and Heavy Weight Deflectometer Tests The static response tests were the same as the slow-rolling tests, except that the load was applied to the pavement with the test vehicle stationary and with one of the wheels directly over an MDD. A separate test was performed over each
8
MDD. Otherwise, wheel configurations, group membership, and file numbering schemes were the same. Additionally, HWD tests were performed at the same time. The test sequence was as follows: 1. The HWD equipment was positioned so that the load plate was centered
directly over the MDD at the test location. 2. A normal HWD test was performed with deflections measured and recorded
by each of the HWD sensors. Also, MDD sensor response was recorded at the same time using the test pavement data acquisition system.
3. The HWD was then moved away from the vicinity of the test location. 4. The test vehicle was positioned so that one of the aircraft tires, as indicated by
the detailed test tabulation, was centered directly over the MDD at the test location.
5. Started data acquisition on the appropriate SPU with the test pavement data acquisition system. Load was applied to the load modules, as indicated by the detailed test tabulation, at the normal loading rate and held for 1 minute. The load was released and aircraft tires were lifted clear of the pavement. Continued to record data for 1 minute after releasing the load.
6. Steps 4 and 5 were repeated twice to complete the sequence with two, four, and six wheels loaded.
7. Moved the test vehicle away from the vicinity of the test location. 8. Repeated steps 1 and 2 to make a repeat measurement with the HWD.
A blue chalk line was drawn along the MDD (transverse direction) and a plumb bob was used for positioning the load modules over the MDD. The test pavement data acquisition system was set at a data rate of 20 Hz when loading with the test vehicle and a data rate of 100 Hz when loading with the HWD. Typical Sensor Responses Sensors were embedded in the pavement layers to measure the pavement response to applied loads. Of primary interest in the response tests are the responses measured by ASGs, MDDs, PCs, and CSGs. Typical responses (time history plots) measured during the slow-rolling tests by different sensors are presented (Figures 5 through 19). Asphalt Strain Gage. The ASGs were fabricated at Construction Technology Laboratories, Inc. (CTL). Strain gages were applied on 0.79-cm (0.31-inch)-diameter and 20.3-cm (8-inch)-long polyester bars at midlength between end flanges. Four 350-ohm gages, two axial and two transverse (rotated 90 degrees from the active gages), are used on each bar. They are connected electrically in a full Wheatstone bridge circuit and arranged on the polyester bar so that the average longitudinal strain through the bar is measured. The strain gage is encapsulated in polyamide with large, rugged copper-coated solder tabs. The strain gage sensor circuitry is encapsulated in wax and epoxies for physical and environmental protection. Both longitudinal and transverse ASGs were installed. Typical longitudinal ASG responses to single-axle, tandem, and tridem gear (for

9
36,000-lb wheel load) are shown in Figures 5, 6, and 7 respectively. Figures 8, 9, and 10 show the responses from a transverse ASG for single-axle, tandem, and tridem gear for 160.2-kN (36,000-lb) wheel load. Displacement Transducer (DT). The MDDs were used to measure deflections of pavement layers at multiple vertical locations referenced to a stable point. Each MDD contains seven potentiometer displacement transducers. The DTs are positioned in the head assembly of the MDD at the pavement surface. The head assembly is positioned above a lined borehole. At the bottom of the bore hole an expandable hydraulic anchor is placed as the stable reference point. Six snap ring anchors are placed at various depths in the lined borehole. The DTs are connected to the anchors with carbon-graphite fiberglass composite rods. Figures 11, 12, and 13 show surface deflections measured by an MDD for single axle, tandem, and tridem gear respectively for 160.2-kN (36,000-lb) wheel load. Pressure Cells (PC). A total of 60 15.2-cm (6-inch PC6) and 84 5.1-cm (2-inch PC2) pressure cells were installed to measure pressures. The PC6 sensors were installed in the unbound granular base and subbase, and the PC2 sensors were installed in the subgrades. Figures 14, 15, and 16 show PC2 measurements for single axle, tandem, and tridem gear respectively for 160.2-kN (36,000-lb) wheel load. PC2 are Kulite Model 0234 Soil Pressure Cells. They are small diameter soil pressure cells consisting of a liquid-filled hollow steel cell approximately 5.1 cm (2 inch) in diameter and 1.3 cm (0.5 inch) thick, with an electrical pressure transducer housed within the cell. Concrete Strain Gage (CSG). The CSGs are of the same basic design as the ASGs, except that the foil gages are affixed to 0.79-cm (0.31-inch)-diameter and 20.3-cm (8-inch)-long steel bars. Figures 17, 18, and 19 show CSG measurements for single-axle, tandem, and tridem gear respectively for 106.8-kN (24,000-lb) wheel load. Summary Test Program. Slow-rolling response tests along with static and HWD tests were performed on pavement test items at the NAPTF. The main objective was to provide data to study wheel-load interaction effects on the critical pavement responses. A total of 522 tests were performed on six flexible test items (LFS, LFC, MFC, MFS, HFS, and HFC), and 108 tests were performed on three rigid test items (LRS, MRS, and HRS). Slow-rolling tests were performed with the test vehicle moving at a speed of 0.15 meters/sec (0.5 feet/second). For the flexible pavement test items, tests were performed at three different wheel loads�106.8 kN (24,000 lbs), 133.5 kN (30,000 lbs), and 160.2 kN (36,000 lbs). For the rigid pavement test items, the tests were conducted at 53.4 kN (12,000 lbs) and 106.8 kN (24,000 lbs) wheel load. HWD tests were conducted over the MDDs in conjunction with the static tests (only for flexible pavement test items).

10
Availability of Data. Approximately 1.2 gigabytes of data were collected during the response tests. The raw data is available on CD-ROM from the FAA Airport Technology Research and Development Branch, AAR-410. Supplementary information is also available from the FAA Airport Technology Branch web site: www.airporttech.tc.faa.gov. The supplementary information includes a compre-hensive description of the test program with a listing of all the tests cross referenced to the data files, a program for reading and displaying the data files, and a database of sensor locations and calibrations. Acknowledgements/Disclaimer The work described in this paper was supported by the FAA Airport Technology Research and Development Branch, Manager, Dr. Satish K. Agrawal. The contents of the paper reflect the views of the authors, who are responsible for the facts and accuracy of the data presented within. The contents do not necessarily reflect the official views and policies of the FAA or the Boeing Commercial Airplane Group. The paper does not constitute a standard, specification, or regulation.
Figure 1. National airport pavement test facility (NAPTF). The test vehicle is shown at the start of LRS.
11
Low
-Stre
ngth
Subg
rade
End
Hig
h-St
reng
th Su
bgra
de E
nd
Left Wheel Path
Right Wheel Path
Pavement Centerline
MDD
MDD
MDD
MDD
MDD2-3 2-2 2-1
Load Modules
1-3 1-2 1-1
Load ModulesOffset Left of Centerline
Offset Right of CenterlineLo
w-S
treng
th Su
bgra
de E
nd
Hig
h-St
reng
th Su
bgra
de E
nd
Left Wheel Path
Right Wheel Path
Pavement Centerline
MDD
MDD
MDD
MDD
MDD2-3 2-2 2-1
Load Modules
1-3 1-2 1-1
Load ModulesOffset Left of Centerline
Offset Right of CenterlineLo
w-S
treng
th Su
bgra
de E
nd
Hig
h-St
reng
th Su
bgra
de E
nd
Left Wheel Path
Right Wheel Path
Pavement Centerline
MDD
MDD
MDD
MDD
MDD2-3 2-2 2-12-3 2-2 2-1
Load Modules
1-3 1-2 1-1
Load Modules
1-3 1-2 1-1
Load ModulesOffset Left of Centerline
Offset Right of Centerline
Figure 2. Coordinate system for flexible pavement test items.
Hig
h-St
reng
th S
ubgr
ade
End
Left Wheel Path
Right Wheel Path
Pavement Centerline
Low
-Stre
ngth
Sub
grad
e En
d
1-3 1-2 1-1
Load Modules
2-3 2-2 2-1
Offset Left of Centerline
Offset Right of Centerline
Hig
h-St
reng
th S
ubgr
ade
End
Left Wheel Path
Right Wheel Path
Pavement Centerline
Low
-Stre
ngth
Sub
grad
e En
d
1-3 1-2 1-1
Load Modules
2-3 2-2 2-1
Offset Left of Centerline
Offset Right of Centerline
Hig
h-St
reng
th S
ubgr
ade
End
Left Wheel Path
Right Wheel Path
Pavement Centerline
Low
-Stre
ngth
Sub
grad
e En
d
1-3 1-2 1-1
Load Modules
1-3 1-2 1-1
Load Modules
2-3 2-2 2-12-3 2-2 2-1
Offset Left of Centerline
Offset Right of Centerline
Figure 3. Coordinate system for rigid pavement test items.
1 65432
Test VehicleControl
Computer(NAPTV2)located inthe Cab
Six HP Main Frame Signal Processing UnitsSPUs
SensorControl
Computer(MAIN)
located inthe Control
Room
Test VehicleSlave
Computer(NAPTV1)located in
the ControlRoom
FAA SignalProcessingComputer(DATAPC)located in
the ControlRoom
FAADatabase-
InternetComputer(DBSRVR)
locatedremotely
OUT
LAN1
LAN1
LAN1
LAN2 (Radio Link)
LAN3
Figure 4. High speed data acquisition system schematic.

12
Figure 5. Longitudinal ASG response to single-axle gear. Units are millistrain.
Figure 6. Longitudinal ASG response to tandem gear. Units are millistrain.
Figure 7. Longitudinal ASG response to tridem gear. Units are millistrain
Figure 8. Transverse ASG response to single-axle gear. Units are millistrain.
Figure 9. Transverse ASG response to tandem gear. Units are millistrain.

13
Figure 10. Transverse ASG response to tridem gear. Units are millistrain.
Figure 11. Surface deflection from DT for single-axle gear. Units are inches.
Figure 12. Surface deflection from DT for tandem gear. Units are inches.
Figure 13. Surface deflection from DT for tridem gear. Units are inches.
Figure 14. Pressure cell (PC2) response to single-axle gear. Units are psi.

14
Figure 15. Pressure cell (PC2) response to tandem gear. Units are psi.
Figure 16. Pressure cell (PC2) response to tridem gear. Units are psi.
Figure 17. CSG response to single-axle gear. Units are millistrain.
Figure 18. CSG response to tandem gear. Units are millistrain.
Figure 19. CSG response to tridem gear. Units are millistrain.
15
Tab
le 1
. Se
nsor
type
s ins
talle
d in
the
pave
men
t.
Sens
or T
ype
Num
ber I
nsta
lled
MD
D (C
TL d
esig
n)
30
Pote
ntio
met
er fo
r MD
D (D
ata
Inst
rum
ents
) 21
0 A
spha
lt St
rain
Gag
e (C
TL d
esig
n)
108
PCC
Stra
in G
age
(CTL
des
ign)
46
8 Pr
essu
re C
ell 6
inch
(Geo
kon
3650
EPC
) 60
Pr
essu
re C
ell 2
inch
(Kul
ite 0
234
SPC
) 84
Jo
int C
lip G
age
(TM
L PI
-5-1
00)
21
Tota
l Dyn
amic
98
1 M
oist
ure
Gag
e (C
ampb
ell C
5615
-L)
15
Tem
pera
ture
Gag
e (O
meg
a th
erm
isto
r)
66
Tota
l Sta
tic
81
Tab
le 2
. Sa
mpl
e te
st m
atrix
.
Test
Te
st It
ems
Load
Com
men
ts 1
Com
men
ts 2
No.
Cov
ered
Car
riage
-1C
arria
ge-2
*100
0 lb
sSt
artin
gEn
ding
Offs
etD
irect
ion
Offs
etD
irect
ion
Dat
eTi
me
Dat
eTi
me
112
LFS,
LFC
, MFC
, MFS
64
3011
0.00
490.
002.
30L
6.88
RD
ATA
REC
OR
DG
EAR
SEP
AR
ATI
ON
9/27
7:33
:32
9/27
7:40
:11
113
LFS,
LFC
, MFC
, MFS
64
3011
0.00
490.
002.
30L
11.4
6R
DA
TA R
ECO
RD
GEA
R S
EPA
RA
TIO
N9/
277:
50:2
79/
277:
57:0
611
4LF
S, L
FC, M
FC, M
FS6
430
110.
0049
0.00
2.30
L16
.04
RD
ATA
REC
OR
DG
EAR
SEP
AR
ATI
ON
9/27
8:06
:17
9/27
8:12
:56
115
LFS,
LFC
, MFC
, MFS
64
3011
0.00
490.
000.
00-
9.17
RD
ATA
REC
OR
DG
EAR
SEP
AR
ATI
ON
9/27
9:11
:28
9/27
9:18
:08
116
LFS,
LFC
, MFC
, MFS
64
3011
0.00
490.
000.
00-
13.7
5R
DA
TA R
ECO
RD
GEA
R S
EPA
RA
TIO
N9/
279:
27:3
09/
279:
34:0
911
7LF
S, L
FC, M
FC, M
FS6
430
110.
0049
0.00
0.00
-18
.33
RD
ATA
REC
OR
DG
EAR
SEP
AR
ATI
ON
9/27
9:43
:04
9/27
9:49
:43
118
LFS,
LFC
, MFC
, MFS
46
3011
0.00
490.
002.
30L
6.88
RD
ATA
REC
OR
DG
EAR
SEP
AR
ATI
ON
9/27
8:53
:30
9/27
9:00
:09
119
LFS,
LFC
, MFC
, MFS
46
3011
0.00
490.
002.
30L
11.4
6R
DA
TA R
ECO
RD
GEA
R S
EPA
RA
TIO
N9/
278:
36:4
79/
278:
43:2
612
0LF
S, L
FC, M
FC, M
FS4
630
110.
0049
0.00
2.30
L16
.04
RD
ATA
REC
OR
DG
EAR
SEP
AR
ATI
ON
9/27
8:21
:22
9/27
8:28
:01
121
LFS,
LFC
, MFC
, MFS
46
3011
0.00
490.
000.
00-
9.17
RD
ATA
REC
OR
DG
EAR
SEP
AR
ATI
ON
9/27
11:0
6:05
9/27
11:1
2:43
122
LFS,
LFC
, MFC
, MFS
46
3011
0.00
490.
000.
00-
13.7
5R
DA
TA R
ECO
RD
GEA
R S
EPA
RA
TIO
N9/
2710
:49:
279/
2710
:56:
0612
3LF
S, L
FC, M
FC, M
FS4
630
110.
0049
0.00
0.00
-18
.33
RD
ATA
REC
OR
DG
EAR
SEP
AR
ATI
ON
9/27
10:3
3:31
9/27
10:4
0:11
SPU
-2SP
U-3
Car
riage
-2 L
ocat
ion
GR
OU
P-2:
4-6
WH
EE
L T
EST
SN
o. o
f Whe
els
Posi
tion
Car
riage
-1 L
ocat
ion
